


Features
- 5 Unique slides
- Fully editable and easy to edit in Microsoft Powerpoint, Keynote and Google Slides
- 16:9 widescreen layout
- Clean and professional designs
- Export to JPG, PDF or send by email


Do you have any questions?
Recommend


5 slides
Work Schedule Overview Presentation
Keep your week perfectly organized with this clean and modern layout designed to simplify planning and scheduling. Ideal for presenting weekly goals, tasks, or project timelines, it helps teams stay aligned and productive. Fully customizable and compatible with PowerPoint, Keynote, and Google Slides for effortless professional presentations.


6 slides
Social Challenges Infographics
Address social challenges effectively with our Social Challenge infographic template. This template is fully compatible with popular presentation software like PowerPoint, Keynote, and Google Slides, allowing you to easily customize it to illustrate and communicate various social challenges and their solutions. The Social Challenge infographic template offers a visually engaging platform to outline the nature of social issues, their impact on communities, and strategies for addressing them. Whether you're an advocate, nonprofit organization, community leader, or simply interested in making a positive impact, this template provides a user-friendly canvas to create informative presentations and educational materials. Raise awareness and promote solutions with this SEO-optimized Social Challenge infographic template, thoughtfully designed for clarity and ease of use. Customize it to showcase specific social challenges, statistics, success stories, and calls to action, ensuring that your audience gains a comprehensive understanding of the issue at hand. Start crafting your personalized infographic today to contribute to positive change in society.


21 slides
Tempest Sales Performance Report Presentation
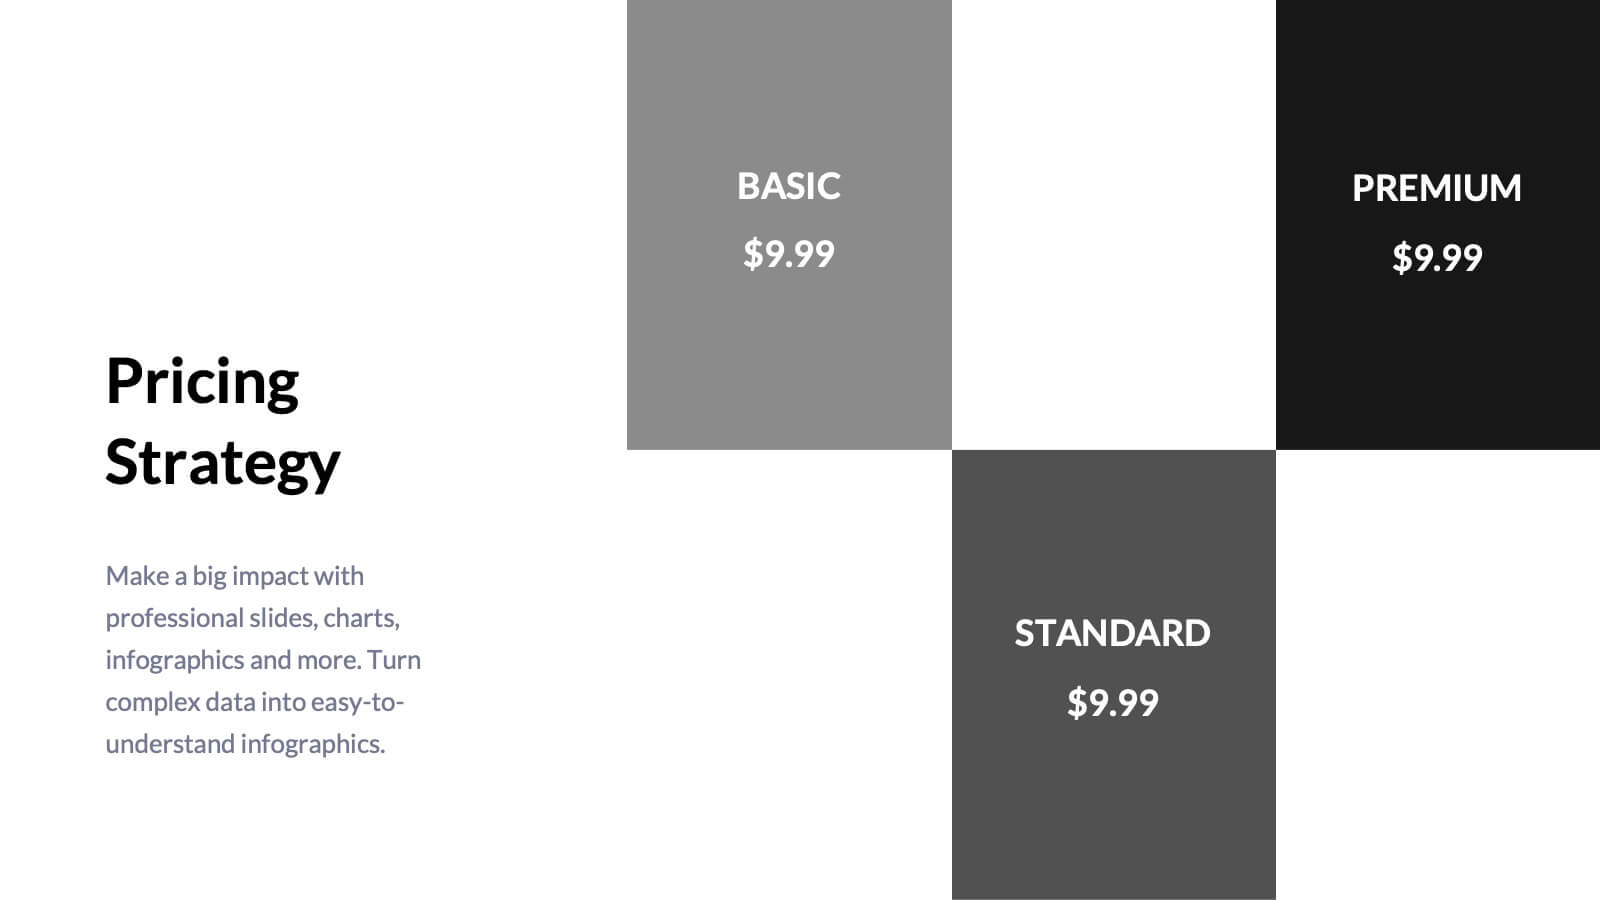
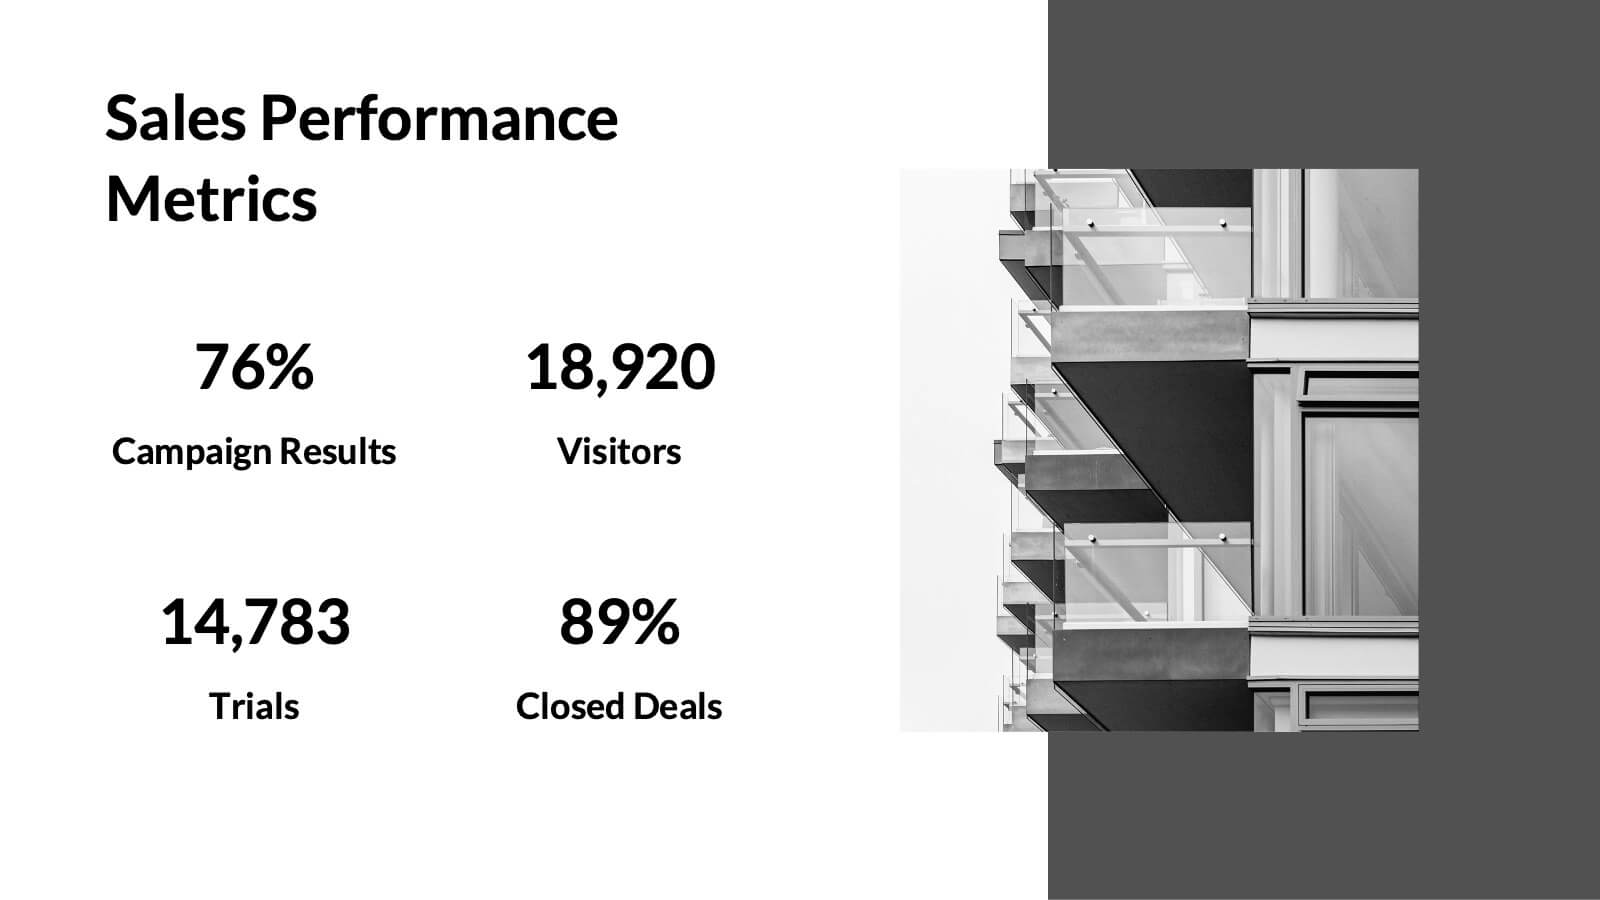
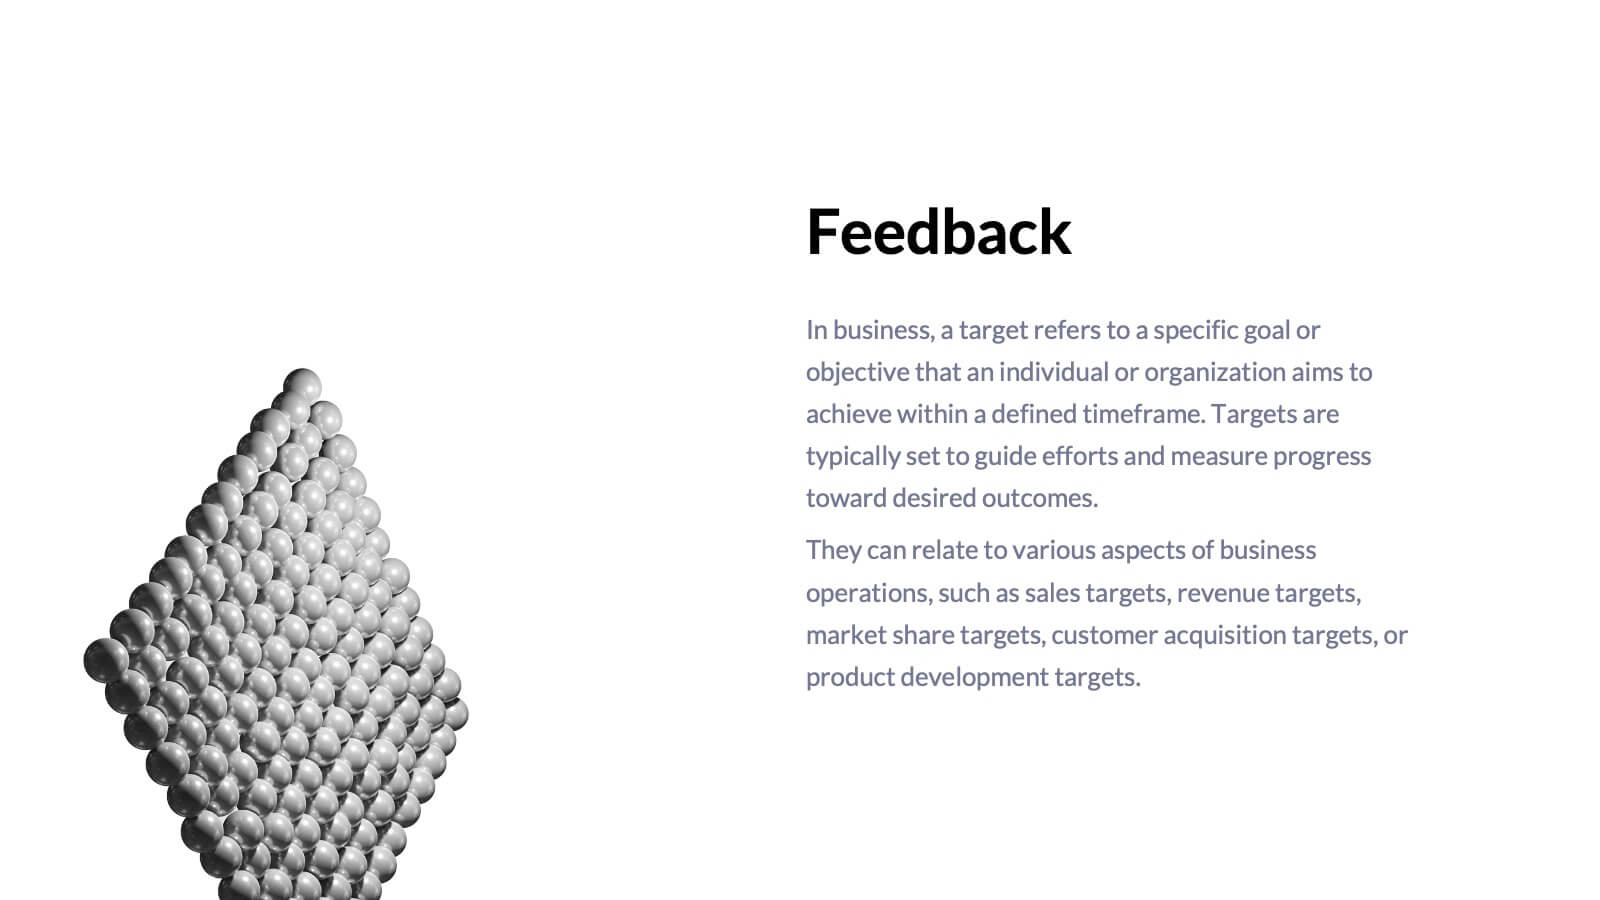
Supercharge your sales presentations with this sleek, professional template. Perfect for outlining sales objectives, processes, and performance metrics, it features a clean, minimalist design that enhances clarity and impact. Highlight key elements like competitive analysis, pricing strategy, and future opportunities to captivate your audience. Compatible with PowerPoint, Keynote, and Google Slides, it ensures seamless presentations on any platform.


4 slides
Personal Finance and Money Management Presentation
Effectively present Personal Finance and Money Management insights with this clean and professional slide template. Designed with a minimalist stopwatch infographic, this template helps visualize key financial principles like budgeting, saving, and investing. Fully customizable with editable text, colors, and icons, it’s perfect for business reports, financial workshops, or personal finance presentations. Compatible with PowerPoint, Keynote, and Google Slides for seamless editing.


22 slides
SEO Report Presentation
Optimize your SEO strategies using our comprehensive SEO Report template. It includes sections for keyword performance, market trends, competitor insights, and client feedback. Tailored for digital marketers and SEO specialists, this template supports presentations in PowerPoint, Keynote, and Google Slides.


5 slides
Compliance and Legal Affairs Presentation
Enforce clarity with the Compliance and Legal Affairs Presentation. Featuring a segmented gavel icon, this layout is ideal for outlining legal processes, compliance stages, and regulatory strategies. Each section is clearly labeled for structured storytelling. Fully editable in PowerPoint, Keynote, and Google Slides.


6 slides
Data-Driven Decision Making Presentation
Showcase your data-to-action process with this clean, step-by-step layout. Ideal for illustrating analytics workflows, this template features five connected stages with modern icons and clear labeling. Perfect for business, tech, or strategy presentations. Fully editable in Canva, PowerPoint, and Google Slides to match your branding and communication needs.


6 slides
Formal Numbers Infographics
Enter the world of formal numbers, a vital concept in mathematics and science! This infographic acts as your gateway to comprehending the structure and significance of formal numbers. From the fundamental properties of natural numbers to the intricate details of real and complex numbers, we unveil the secrets that underpin these mathematical entities. Discover the mathematical significance of formal numbers across various fields, from algebra to calculus and beyond. Explore how these numbers are used in practical applications, including engineering, physics, and computer science. Gain an appreciation for the elegance and versatility of formal numbers in solving real-world problems. With this informative infographic, compatible with PowerPoint, Keynote, and Google Slides, sharing your understanding of formal numbers becomes seamless. Empower yourself with the knowledge to navigate the intricate world of mathematics. Dive into the realm of formal numbers and embark on a journey of mathematical exploration and enlightenment.


7 slides
Digital KPI Dashboard Infographic
A KPI Dashboard is a visual representation of the most important performance metrics or KPIs that track the progress of an organization or business activities. This infographic template is designed to showcase the KPIs and metrics that are crucial for evaluating the success of digital marketing efforts. This template provides an overview of various digital marketing KPIs in an easy-to-understand format. The template utilizes eye-catching charts, graphs, and diagrams to present digital marketing data in a visually appealing way. Bar graphs, line charts, pie charts, and other visual elements make it easy to grasp the performance trends at a glance.


4 slides
Sustainable Farming Practices Presentation
Explore the essentials of sustainable farming with our visually engaging presentation template. Perfect for educational and advocacy purposes, it outlines key practices that promote environmental sustainability in agriculture. This template features easy-to-understand graphics and placeholders for comprehensive discussions on eco-friendly farming techniques.


6 slides
Expert Tables Of Content Infographics
The "Expert Tables of Content" infographic template is a sophisticated and structured tool, designed to enhance presentations in PowerPoint, Keynote, and Google Slides. This template is ideal for authors, researchers, and professionals who need to present detailed content or reports in a clear and accessible format. This template efficiently organizes complex information into an easy-to-navigate format, showcasing chapters, sections, and key topics. It's tailored to highlight the depth and breadth of your content, making it an essential tool for academic presentations, business reports, or any comprehensive document requiring a detailed table of contents. The "Expert Tables of Content" infographic template revolutionizes the way we present complex information, perfectly crafted for PowerPoint, Keynote, and Google Slides. This template is a game-changer for authors, educators, and professionals aiming to captivate their audience with a well-structured and accessible presentation of their rich content. Designed to turn any extensive material into an engaging journey, this template masterfully organizes chapters, sections, and pivotal topics. It's an invaluable asset for transforming detailed reports, comprehensive academic papers, or sprawling creative works into a visually appealing and easily navigable format. With a design that's as striking as it is functional, the template boasts a color scheme that balances professionalism with vibrancy. T....


6 slides
External Business Factors PESTEL Model Presentation
Present your strategic analysis with clarity using this External Business Factors PESTEL Model Presentation. Designed to break down Political, Economic, Social, Technological, Environmental, and Legal influences, this layout helps convey complex macro-environmental insights in a simple, color-coded visual format. Ideal for consultants, business analysts, and corporate strategists. Fully editable in PowerPoint, Keynote, and Google Slides.


5 slides
IT Technology Revolution Infographics
Navigate the digital wave with our IT technology revolution infographics. Crafted in a sleek blue and white palette, this template is a nod to the informational era's sophistication. It's an essential tool for IT professionals, educators, tech enthusiasts, or students stepping into the world of informational technology. Compatible with Powerpoint, Keynote, and Google Slides. With a design that speaks innovation, it features cutting-edge graphics, icons, and image placeholders, tailored to dissect complex tech jargons into digestible visuals. Engage your audience with data and trends that encapsulate the IT landscape's ever-evolving nature.


10 slides
Key Takeaways List Presentation
Streamline your key points with our "Key Takeaways List Presentation" template. This versatile infographic design offers a clear, structured format for enumerating crucial information across four distinct stages. Each stage is visually represented with vibrant, color-coded sections to ensure readability and impact. Whether you're summarizing a meeting, outlining project steps, or highlighting important data, this template provides a straightforward way to communicate your message effectively. Compatible with PowerPoint, Keynote, and Google Slides, it's ideal for professionals seeking to make their presentations more engaging and organized.


8 slides
Business Value Proposition
Clearly communicate your brand’s core value with this quadrant-style slide, ideal for pitching key benefits, market differentiators, or service pillars. Designed for product managers, marketers, and business consultants. Fully editable in PowerPoint, Keynote, and Google Slides—customize icons, titles, and layout with ease.


26 slides
Modern Company Culture Playbook Presentation
A culture playbook is a document or guide that outlines the values, beliefs, behaviors, and norms that define the organizational culture of a company or team. This presentation template is designed to help businesses create and communicate their unique company culture to employees and potential recruits. With a modern and professional design, this presentation provides a comprehensive overview of your company's values, mission, and beliefs, fostering a positive and inclusive work environment. Illustrate your company's vision for the future and its role in shaping a better world, encouraging employees to be part of a meaningful journey.


5 slides
Social Media Strategies Presentation
Bring your online vision to life with a clean, modern layout that makes planning campaigns feel effortless. This presentation helps you map out goals, content pillars, audience insights, and platform tactics with clarity and impact. Fully editable and compatible with PowerPoint, Keynote, and Google Slides.