


Features
- 4 Unique slides
- Fully editable and easy to edit in Microsoft Powerpoint, Keynote and Google Slides
- 16:9 widescreen layout
- Clean and professional designs
- Export to JPG, PDF or send by email


Do you have any questions?
Recommend


4 slides
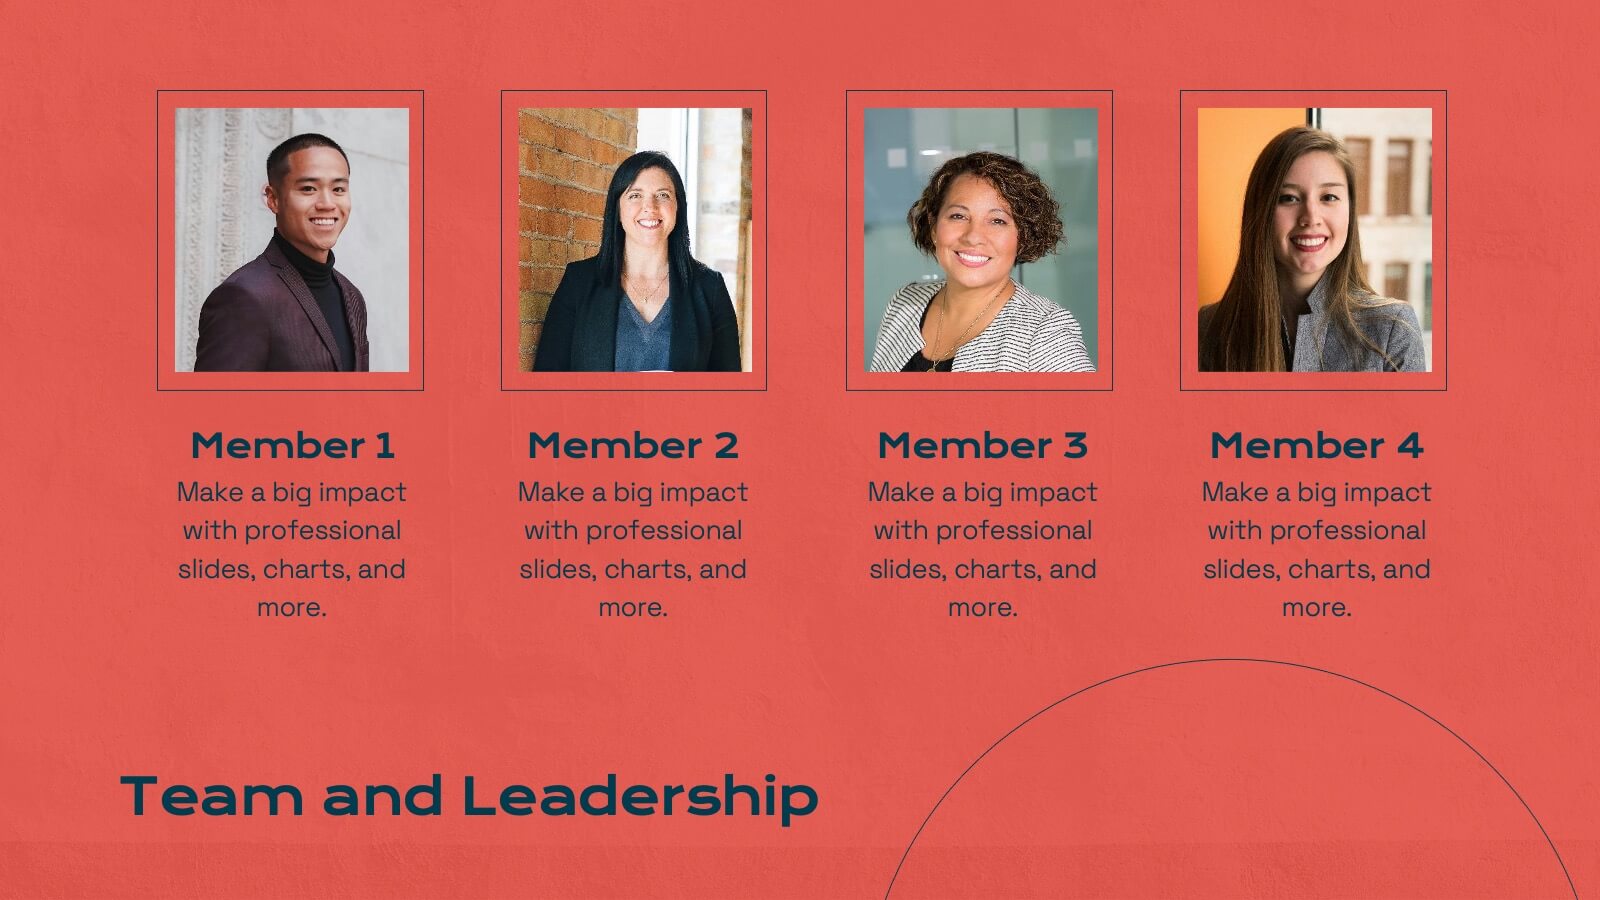
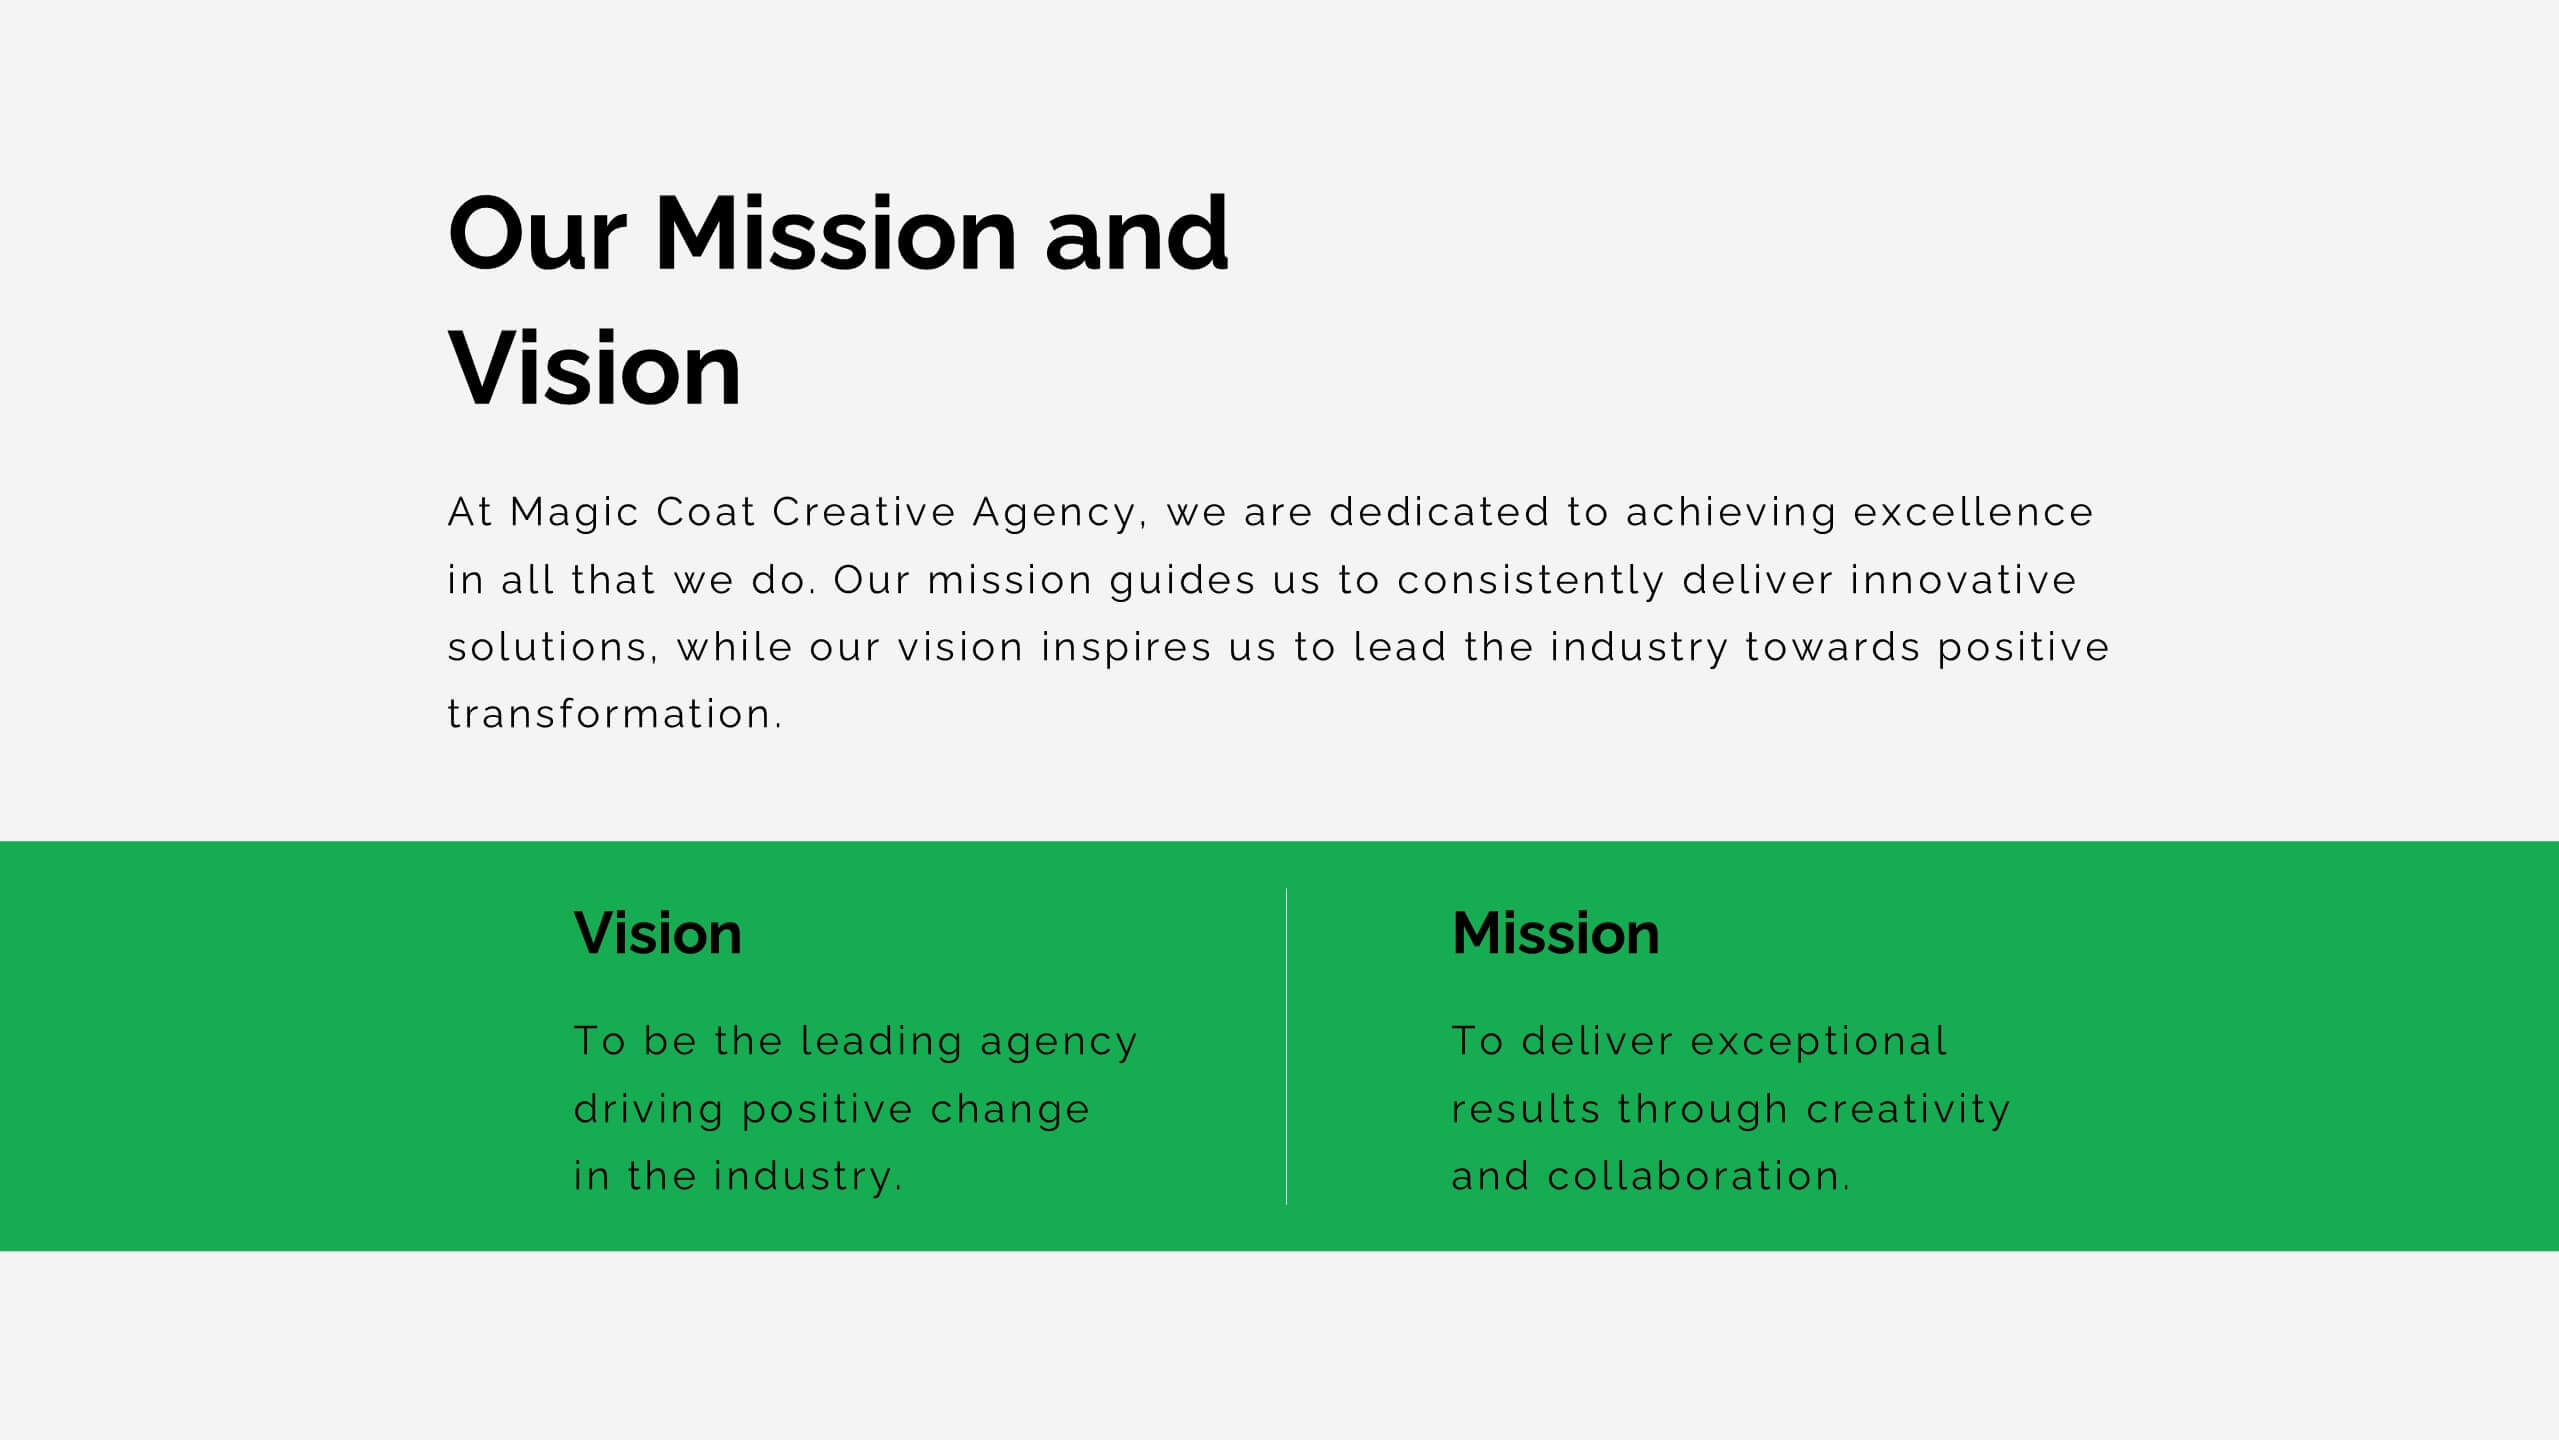
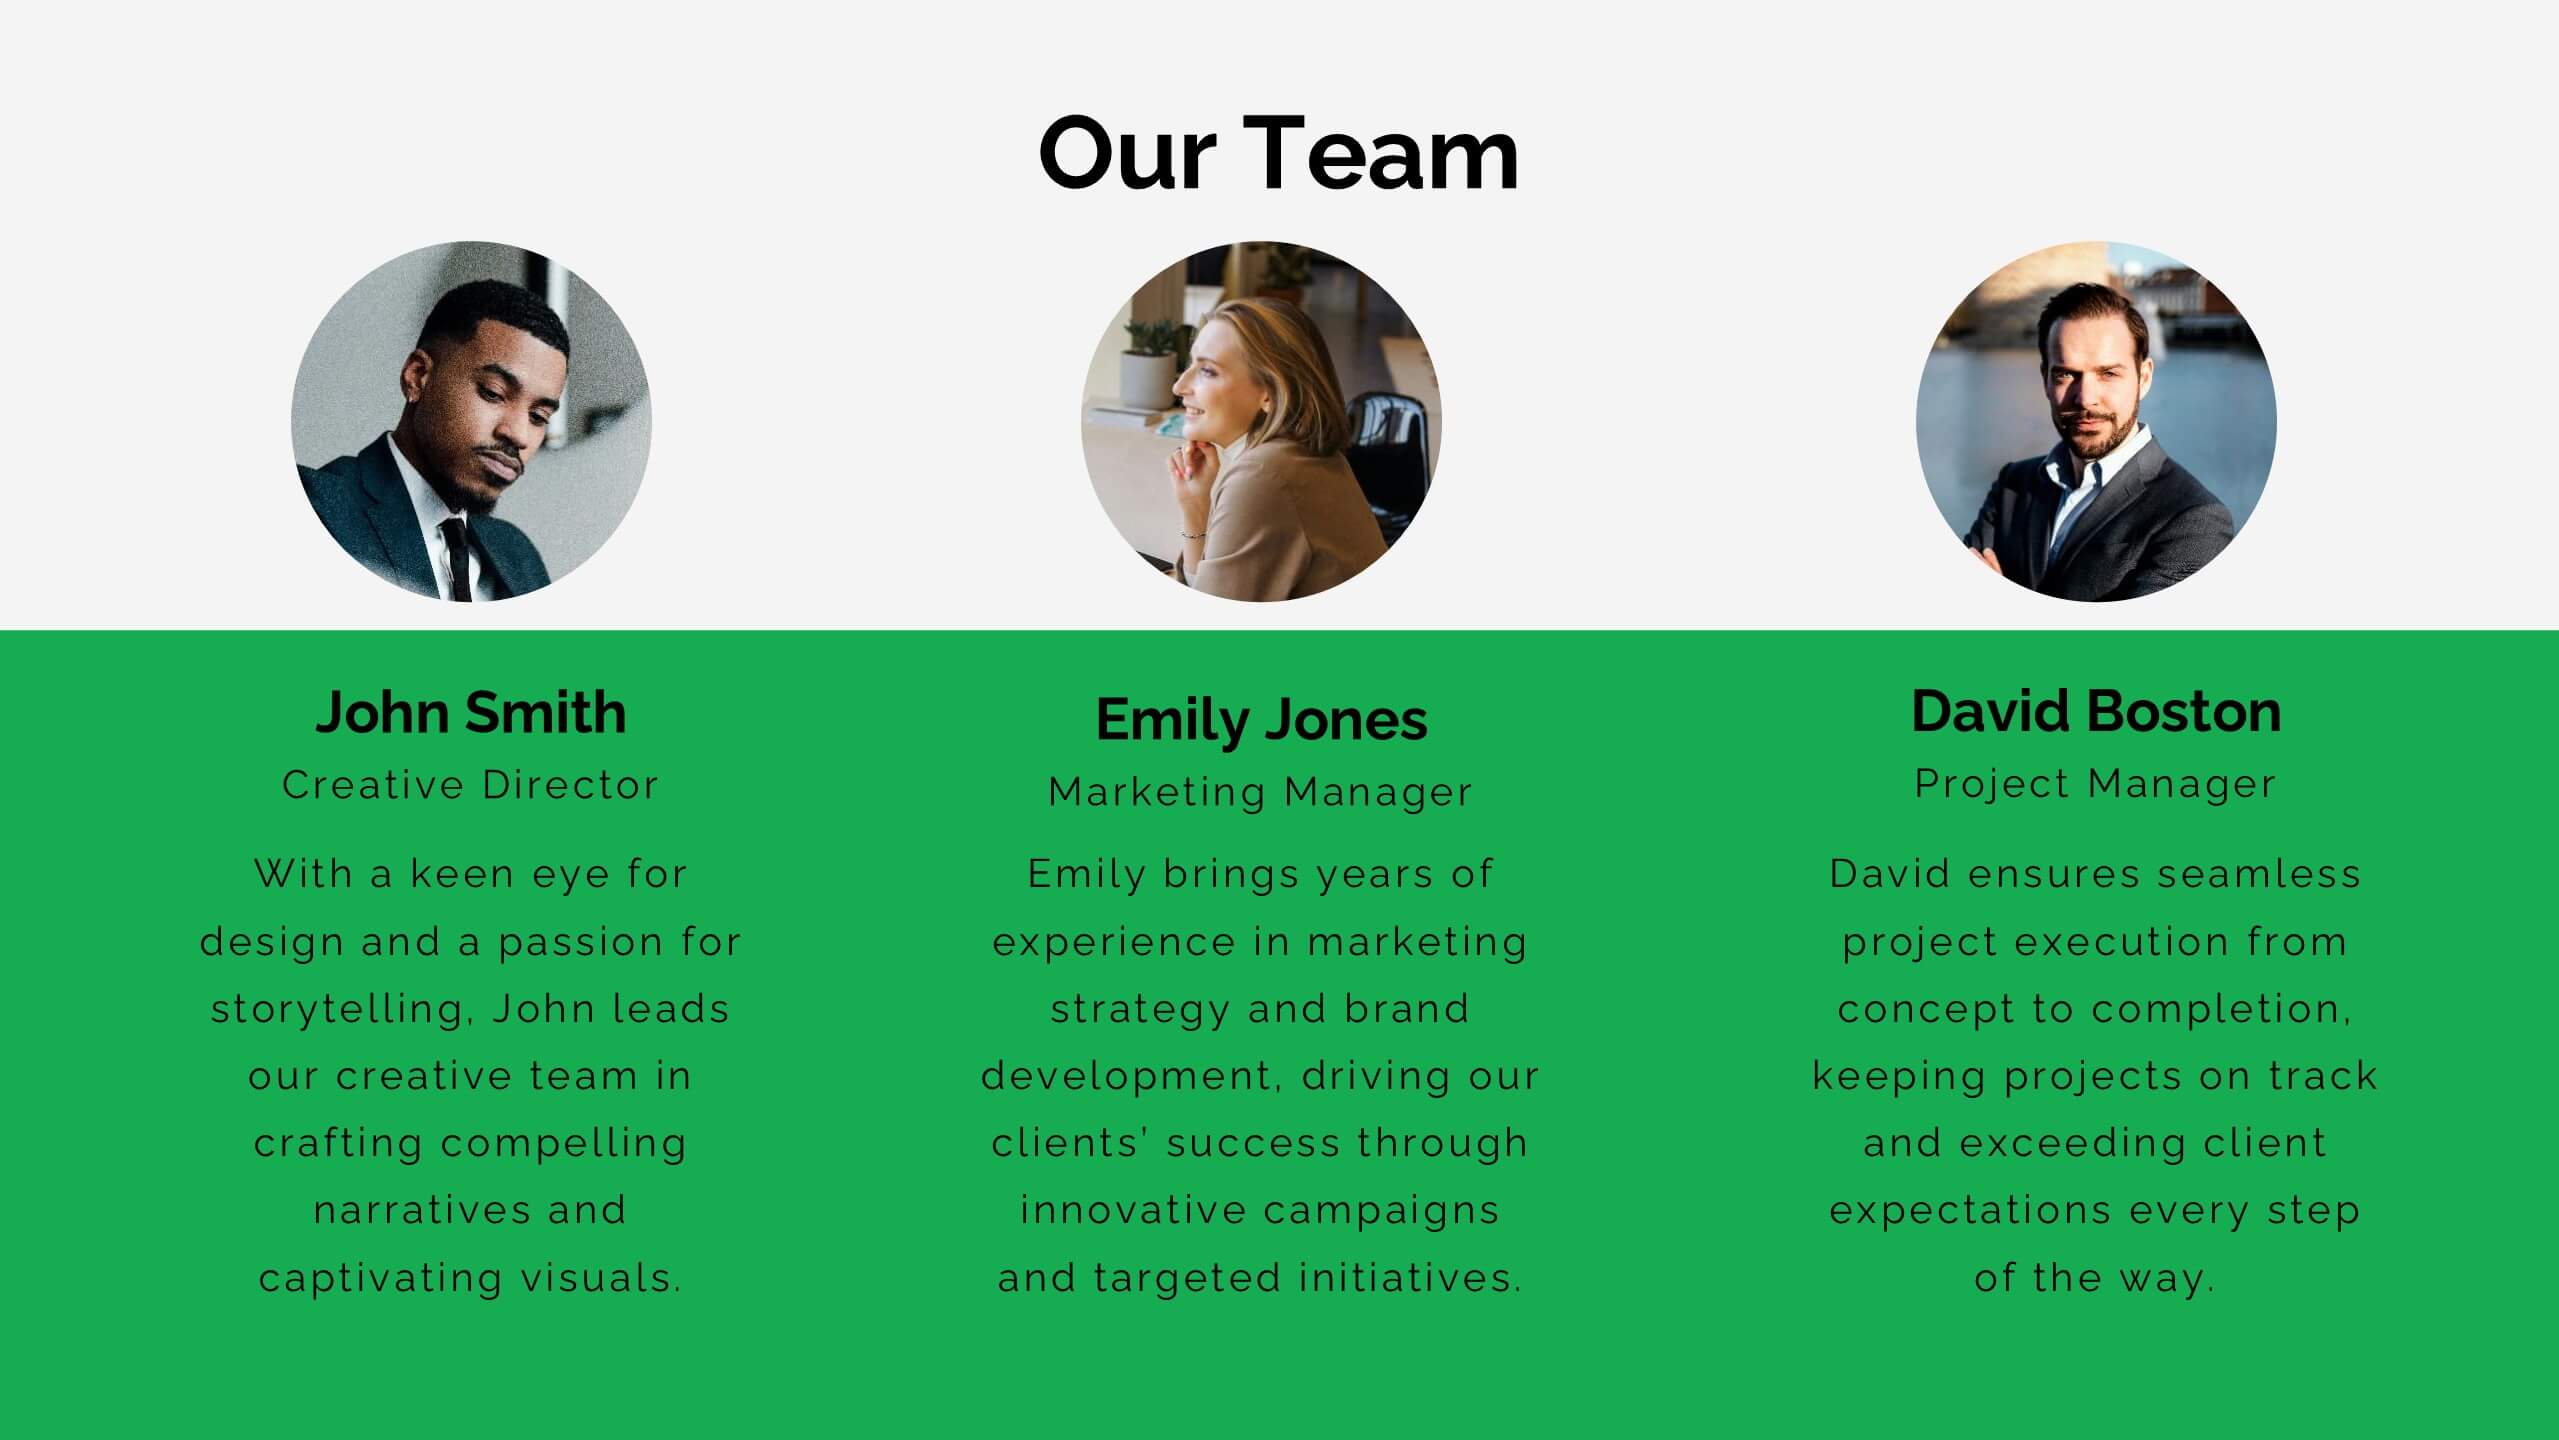
Meet the Business Team Presentation
Ignite curiosity from the start with a clean, modern layout designed to introduce your team with clarity and confidence. This presentation highlights key roles, expertise, and contributions, helping audiences quickly understand who drives the work forward. Fully editable and easy to customize in PowerPoint, Keynote, and Google Slides.


7 slides
Implementation Models and Frameworks Slide Presentation
Visualize your entire process clearly with the Implementation Models and Frameworks Slide Presentation. This sleek arrow-based timeline features six distinct stages, each with icons and text placeholders to highlight key milestones, actions, or phases. Ideal for showcasing workflows, strategic initiatives, or rollout plans, this slide ensures your audience follows the journey from start to finish. Fully editable in PowerPoint, Keynote, and Google Slides, it’s perfect for project managers, consultants, and team leads aiming for clarity and impact.


5 slides
Performance Metrics Dashboard Presentation
Turn complex data into clear, engaging visuals with a clean, modern dashboard layout that highlights performance results at a glance. Perfect for tracking KPIs, progress, and team outcomes, this template brings structure and clarity to reports. Easily editable in PowerPoint, Keynote, and Google Slides for professional presentations.


7 slides
Big Data Infographic Presentation Template
This Big Data Infographic template is the perfect tool for any business presentation. This template has been designed to help you create truly engaging data-driven visuals, with powerful typography and interesting details that help draw in your audience. Introduce your business to the world with this big data infographic template. It's just what you need to describe the role of big data in the evolution of modern businesses. Our Big Data Infographic Presentation features all the tools for you to create wonderful charts, graphs, transitions and striking shapes both for your text and images.


7 slides
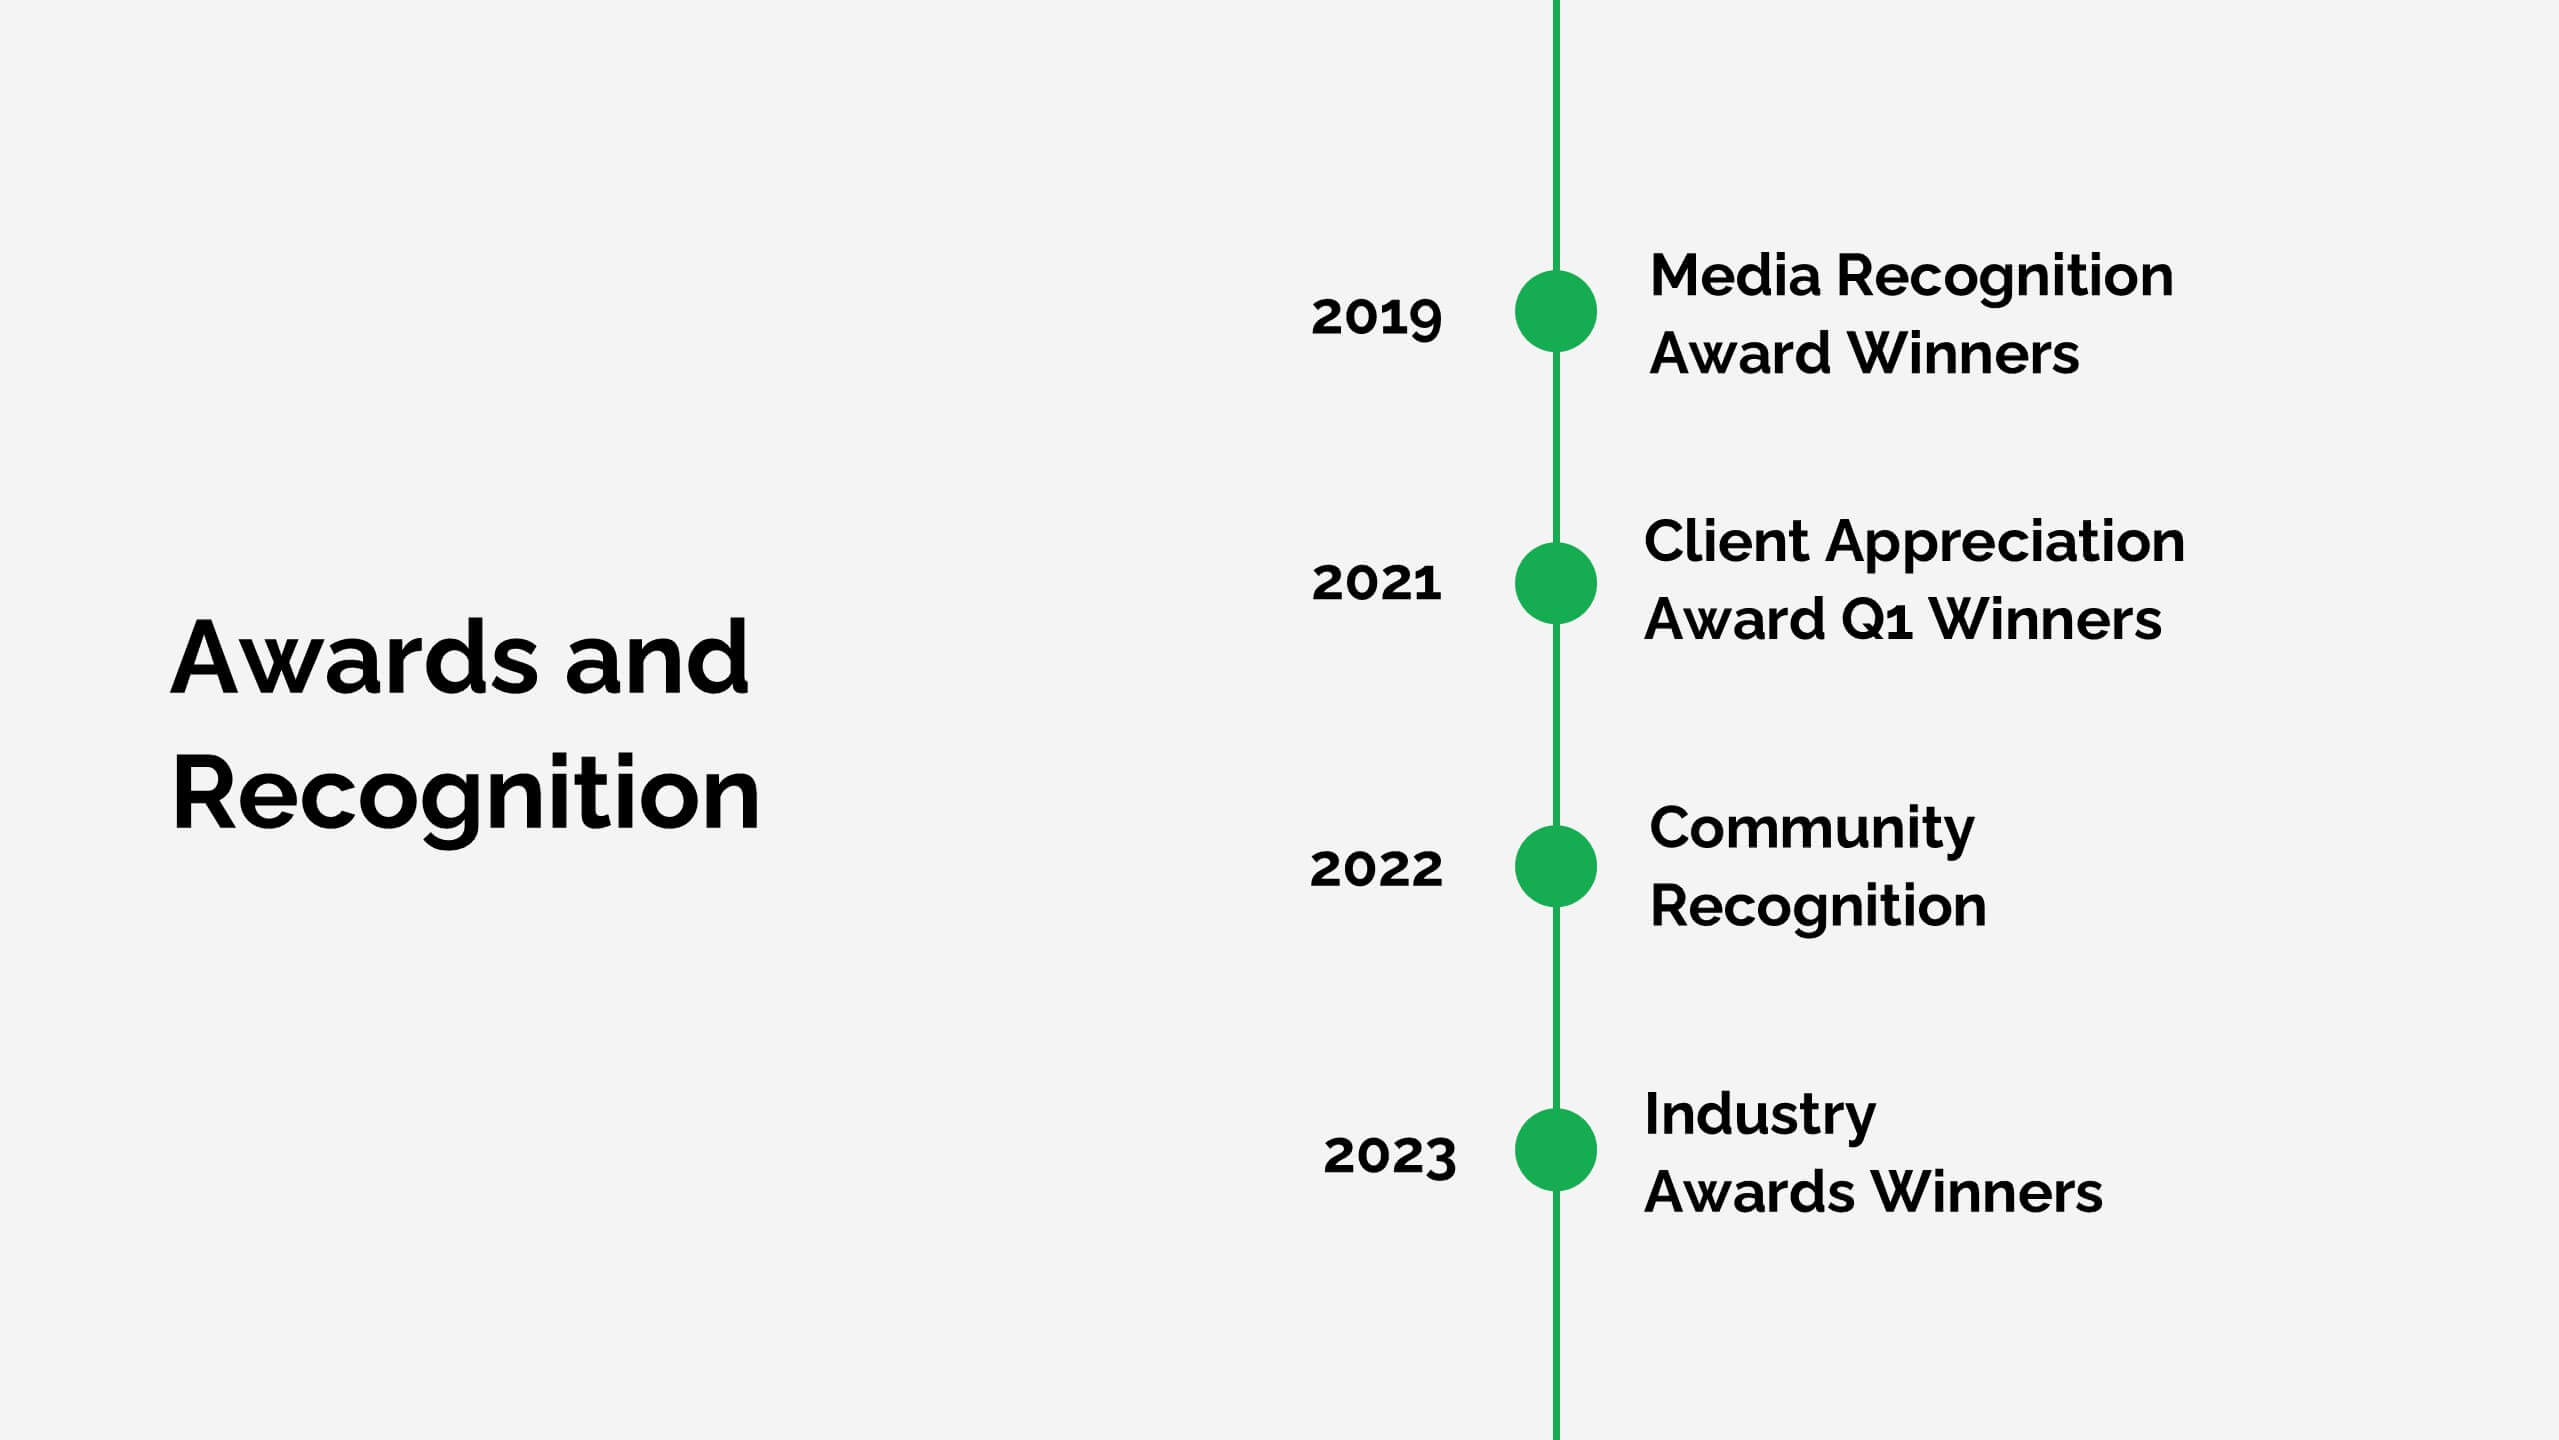
Business Timeline Infographics
A business timeline is a graphical or chronological representation that illustrates significant events, milestones, or activities within a business or project over a specific period. Embark on a visual voyage through your business's evolution with our business timeline infographic template. Fully customizable and compatible with Powerpoint, Keynote, and Google Slides. This vibrant and informative template is your canvas to fully narrate compellingly. Our timeline infographic is more than a timeline; it's a visual testament to your business's resilience, growth, and future potential!


4 slides
Insurance Business Overview Presentation
Bring clarity and professionalism to your financial presentations with this sleek and modern design. Ideal for outlining key insights, policies, or service breakdowns, it visually communicates business protection and stability. Fully customizable and compatible with PowerPoint, Keynote, and Google Slides for an engaging and polished presentation experience.


6 slides
Conversion Funnel Infographic Presentation
Optimize your marketing strategy with this Conversion Funnel Infographic template. Clearly illustrate lead generation, customer retention, and sales processes in a structured format. Fully editable to match your branding—customize colors, icons, and text effortlessly. Compatible with PowerPoint, Keynote, and Google Slides for a smooth presentation experience.


6 slides
Circular Business Wheel Model Presentation
Break down your strategy into dynamic segments with this Circular Business Wheel Model. This layout is ideal for showcasing interconnected business areas like sustainability, innovation, monetization, and market appeal. Perfect for strategy decks, business planning, and growth presentations. Compatible with PowerPoint, Keynote, and Google Slides—fully editable for your needs.


5 slides
SMART Objective Planning for Success Presentation
Turn your goal-setting process into a clear, actionable strategy with this SMART Objective Planning slide. Designed around the SMART framework—Specific, Measurable, Achievable, Relevant, Time-bound—this layout helps you articulate objectives with clarity and focus. Each segment features a bold letter with icons and editable descriptions beneath. Ideal for planning sessions, strategic reviews, and team alignment meetings. Compatible with PowerPoint, Keynote, and Google Slides.


6 slides
Historical Data Timeline Visualization
Showcase historical progression with clarity using the Historical Data Timeline Visualization. Designed for presenting chronological data points, this template combines circle elements with image icons and milestone labels—perfect for educational or historical presentations. Fully editable in Canva, PowerPoint, Keynote, and Google Slides for seamless customization.


21 slides
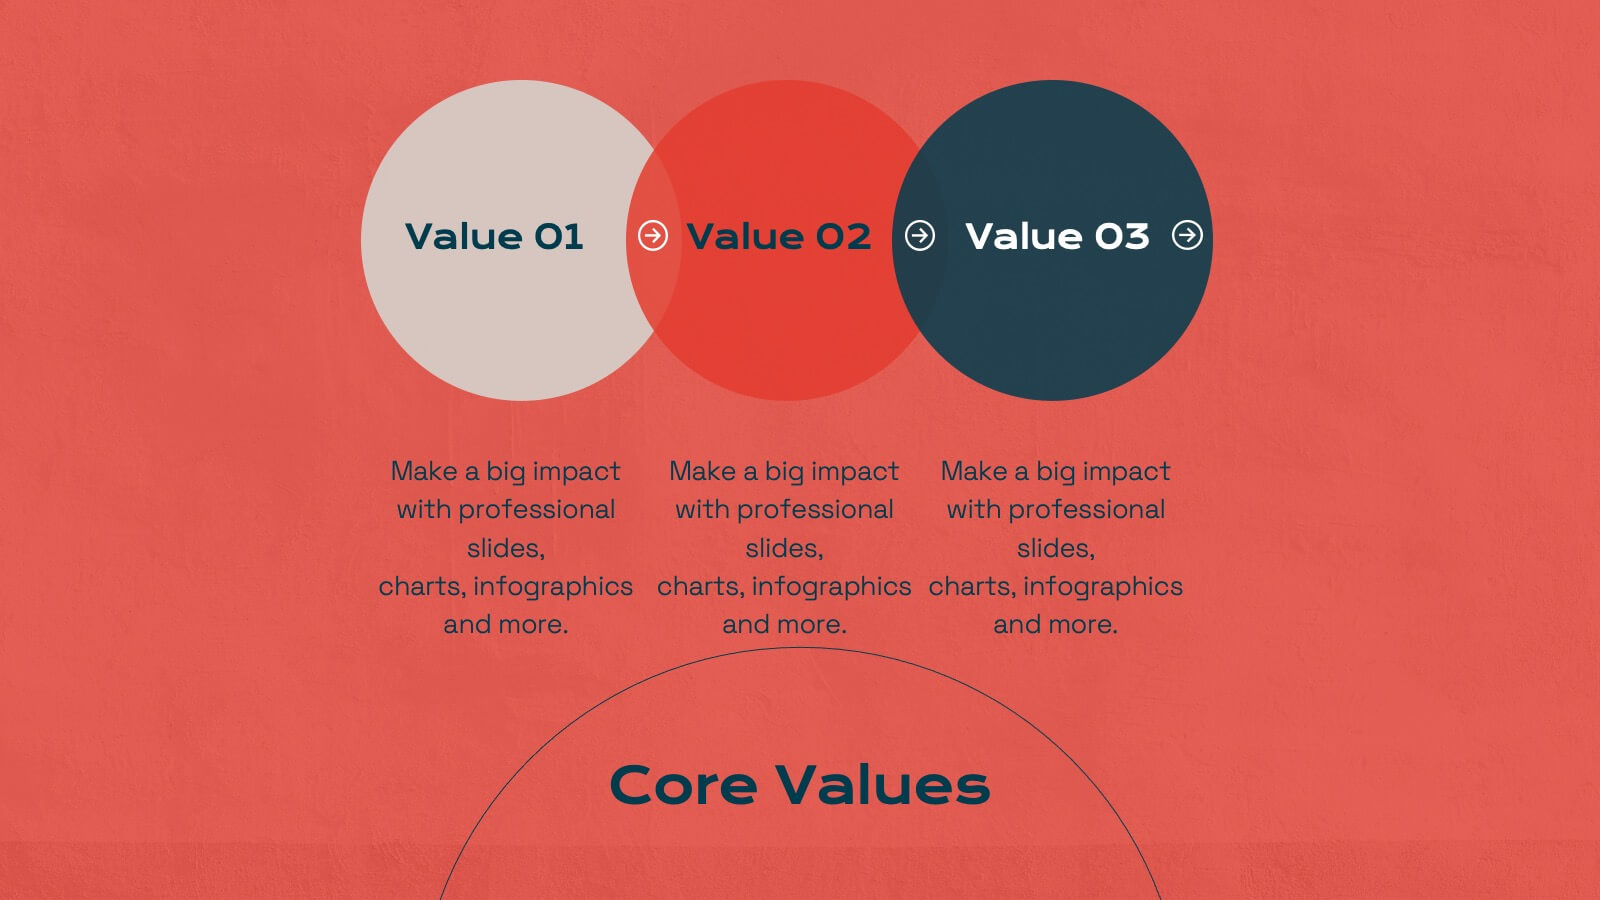
Titan Marketing Research Report Presentation
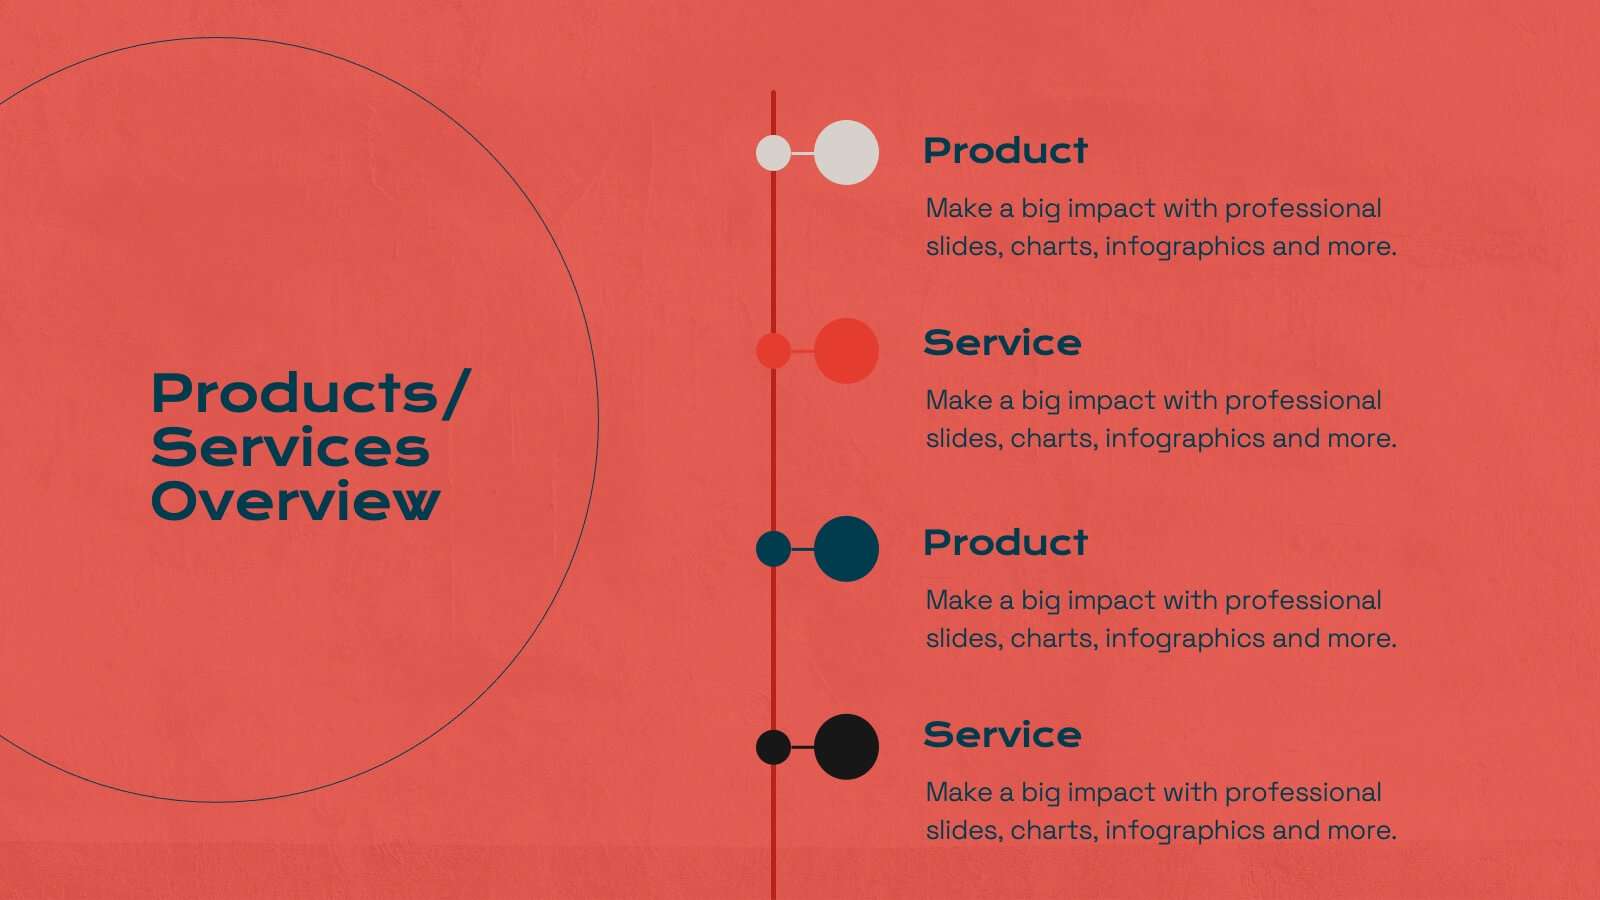
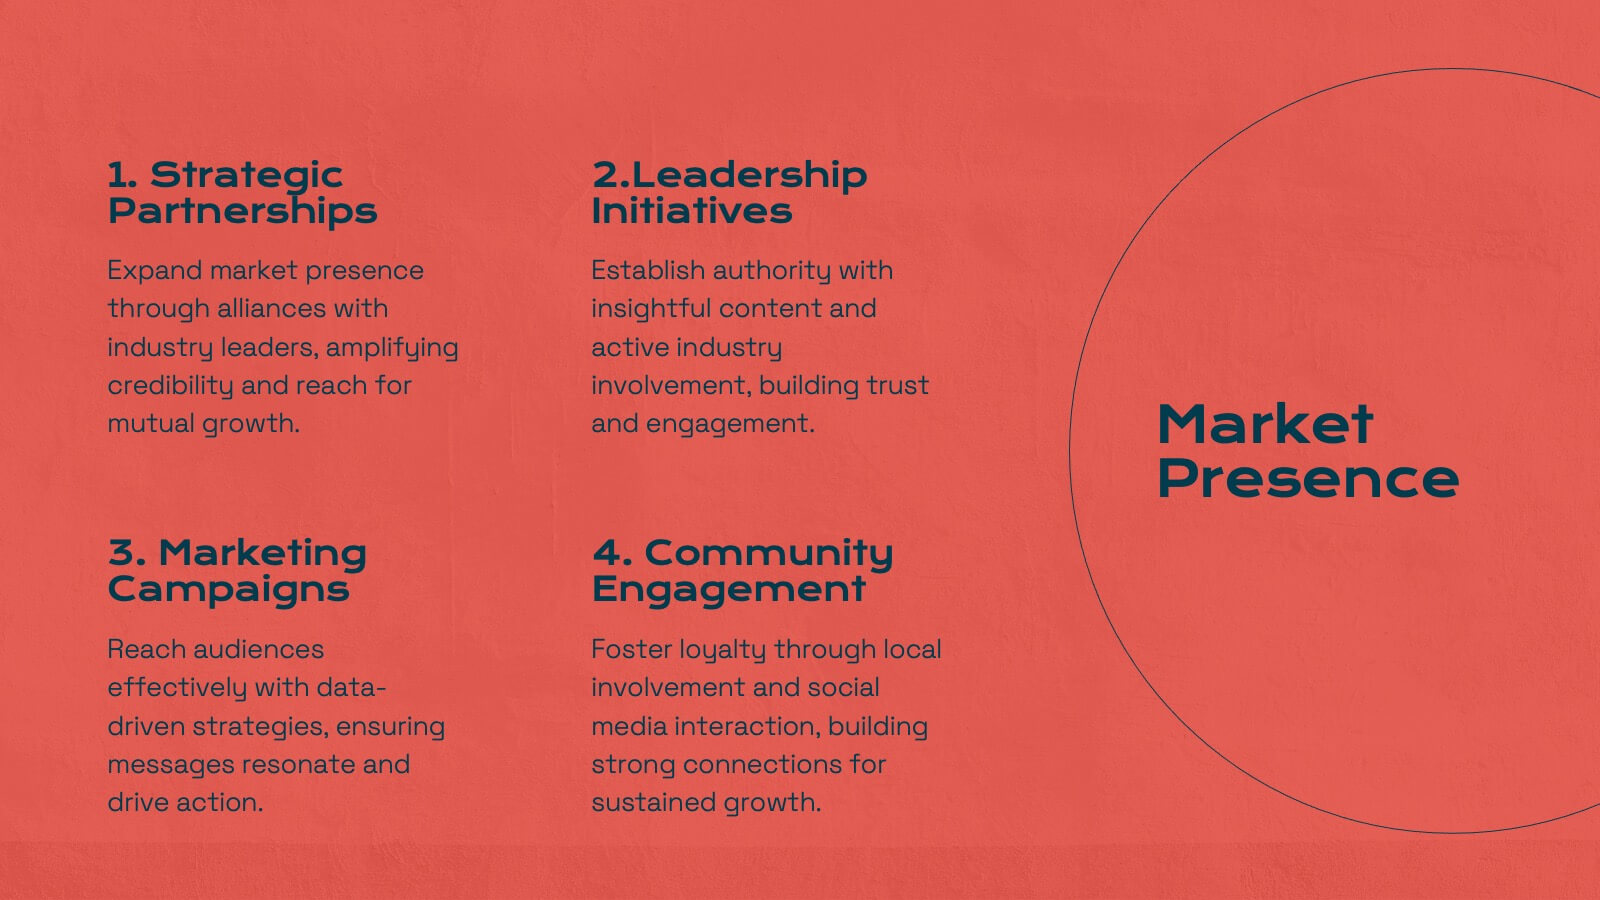
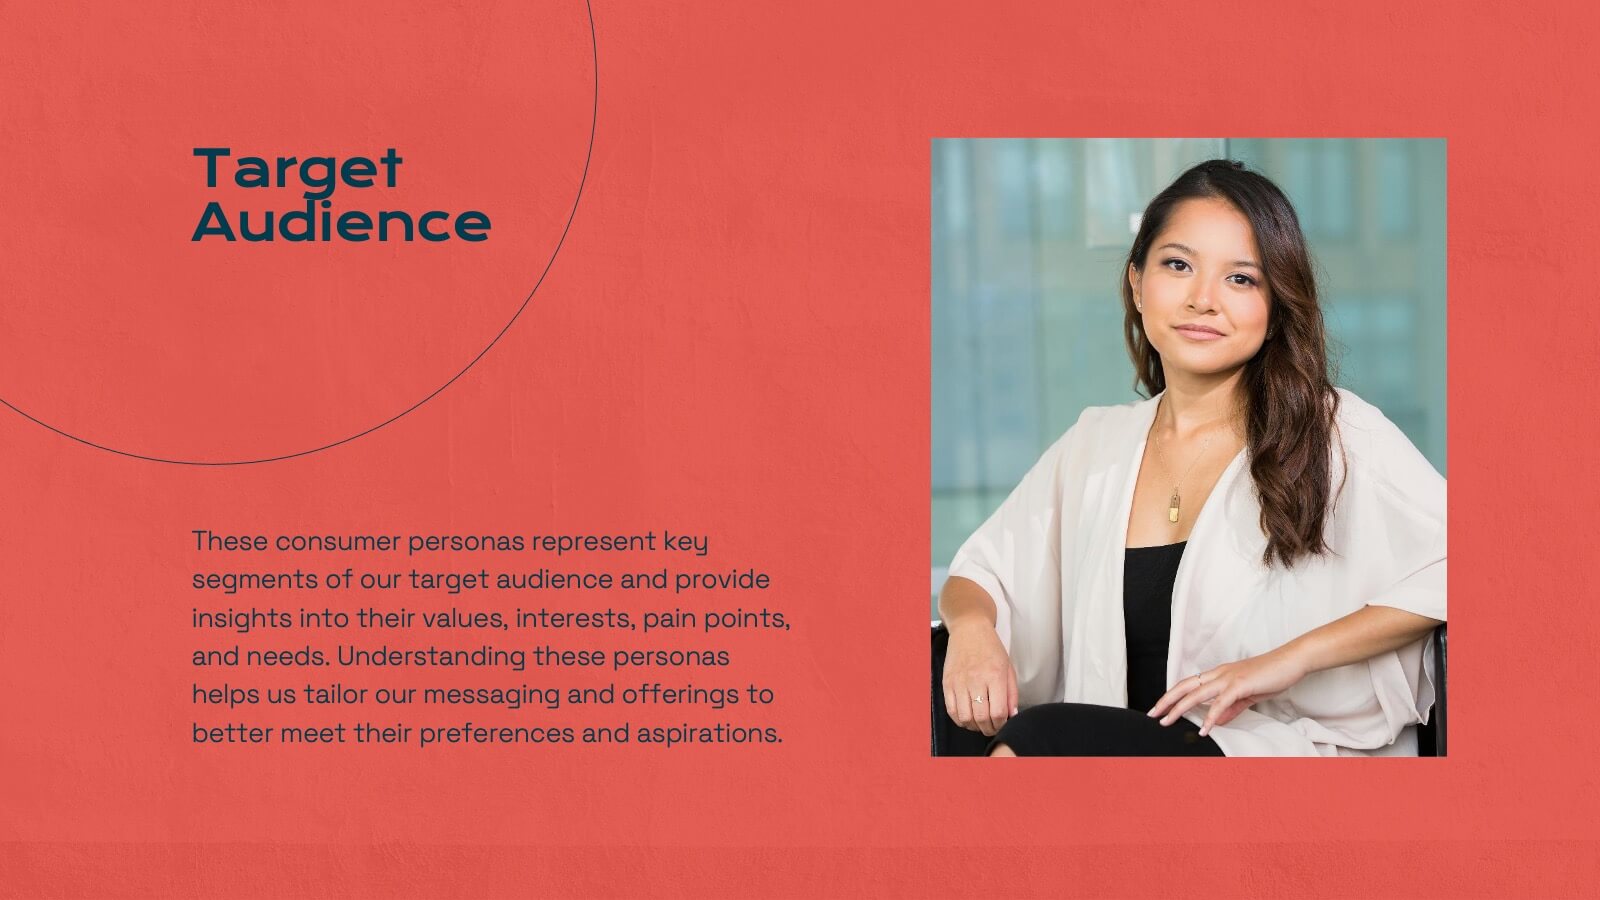
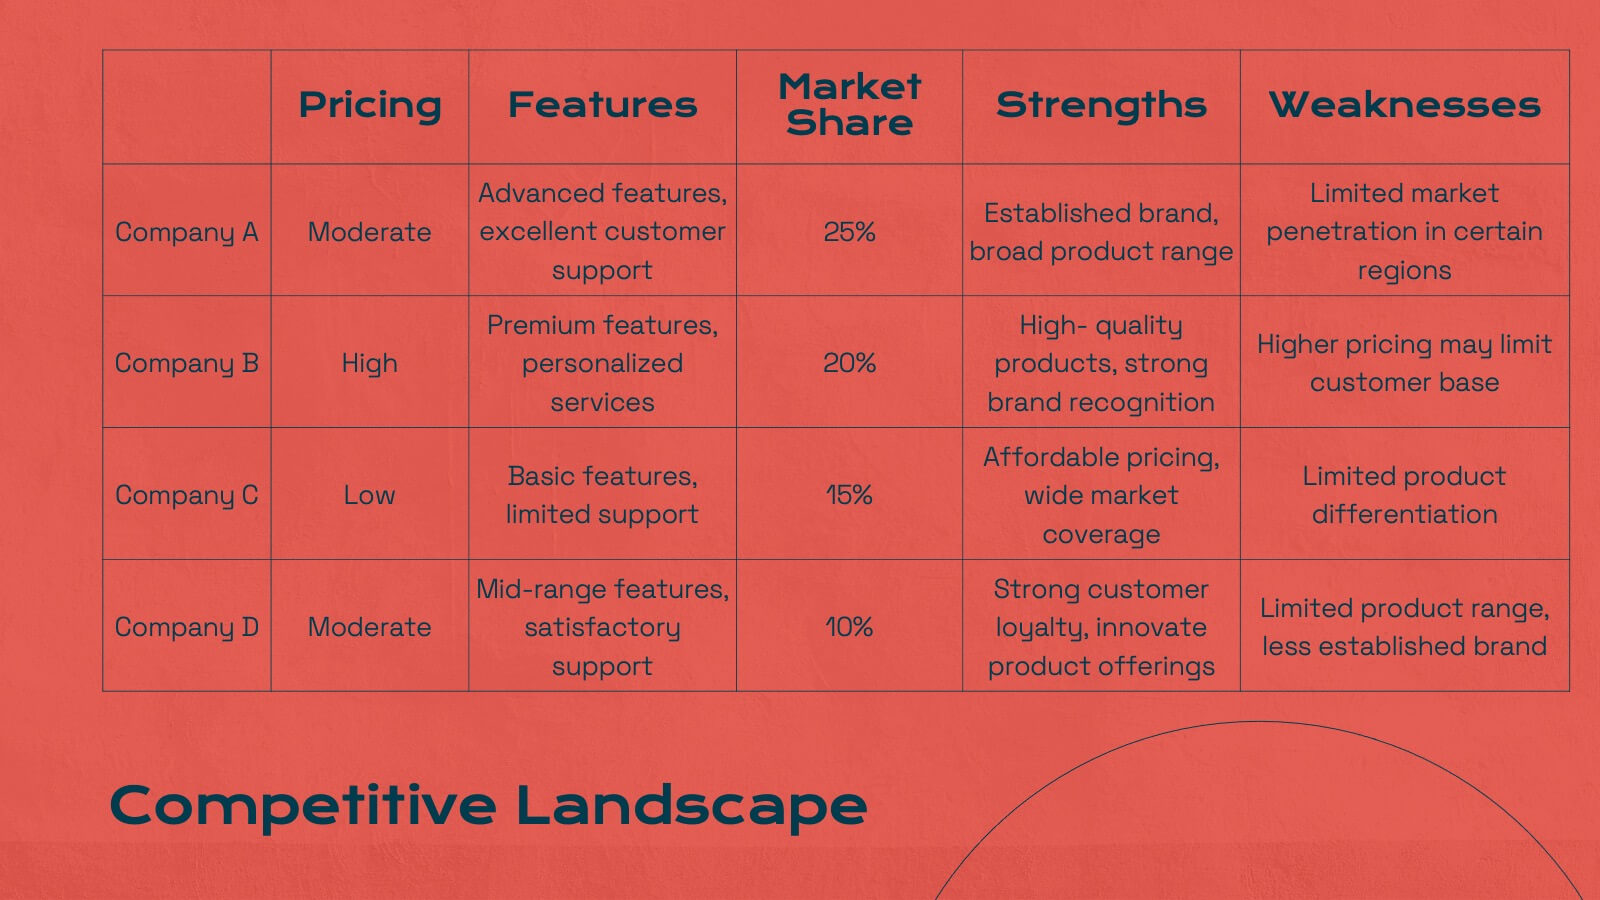
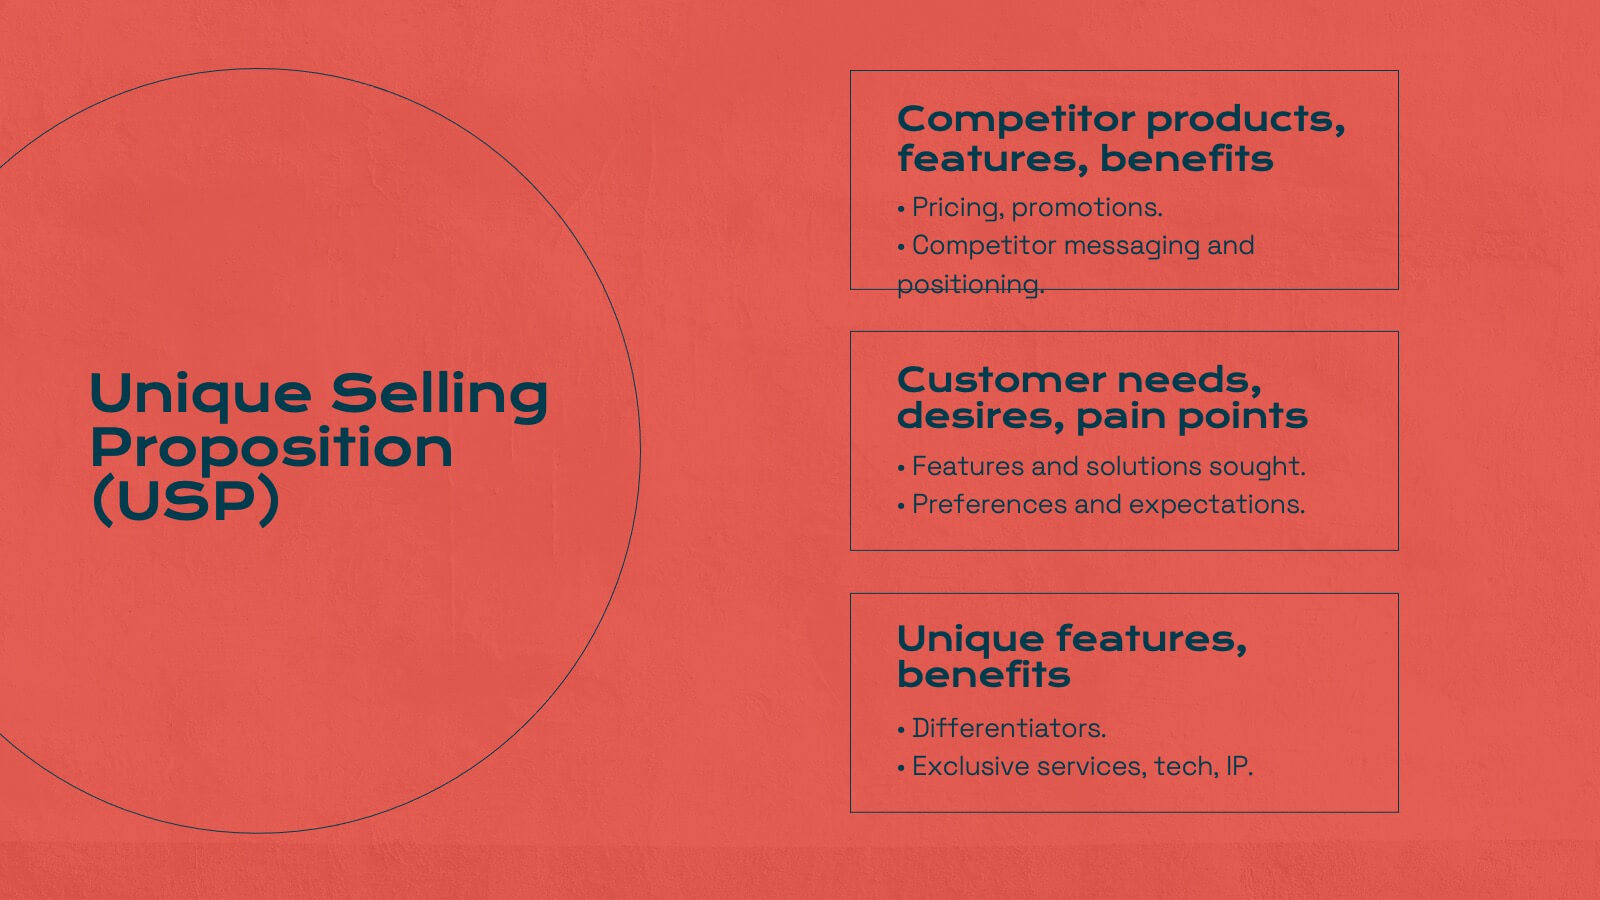
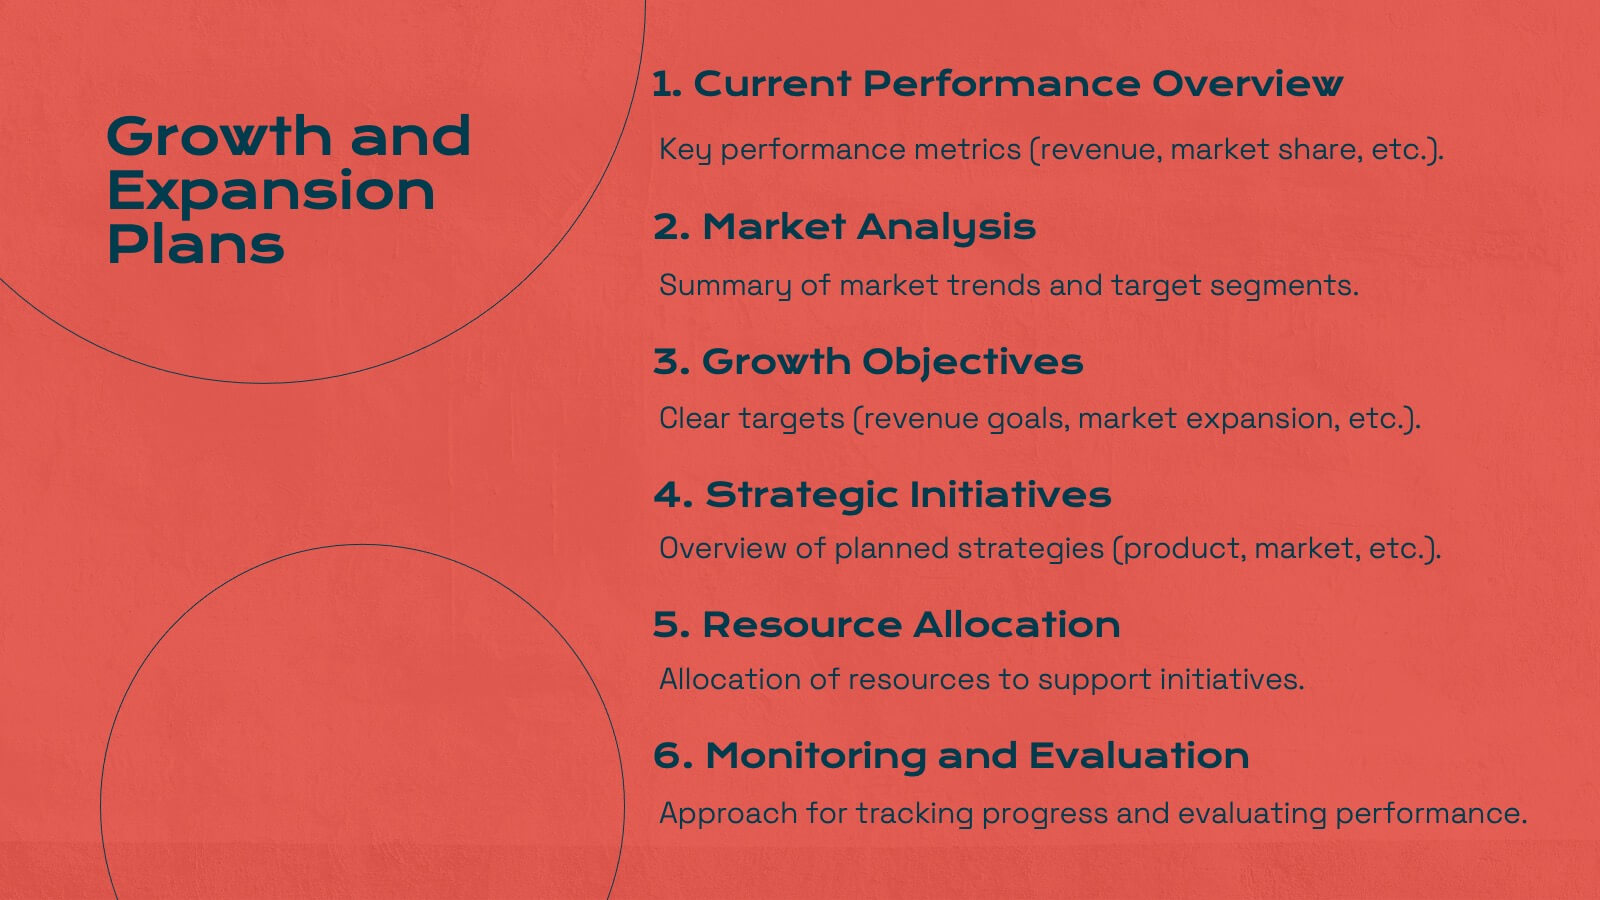
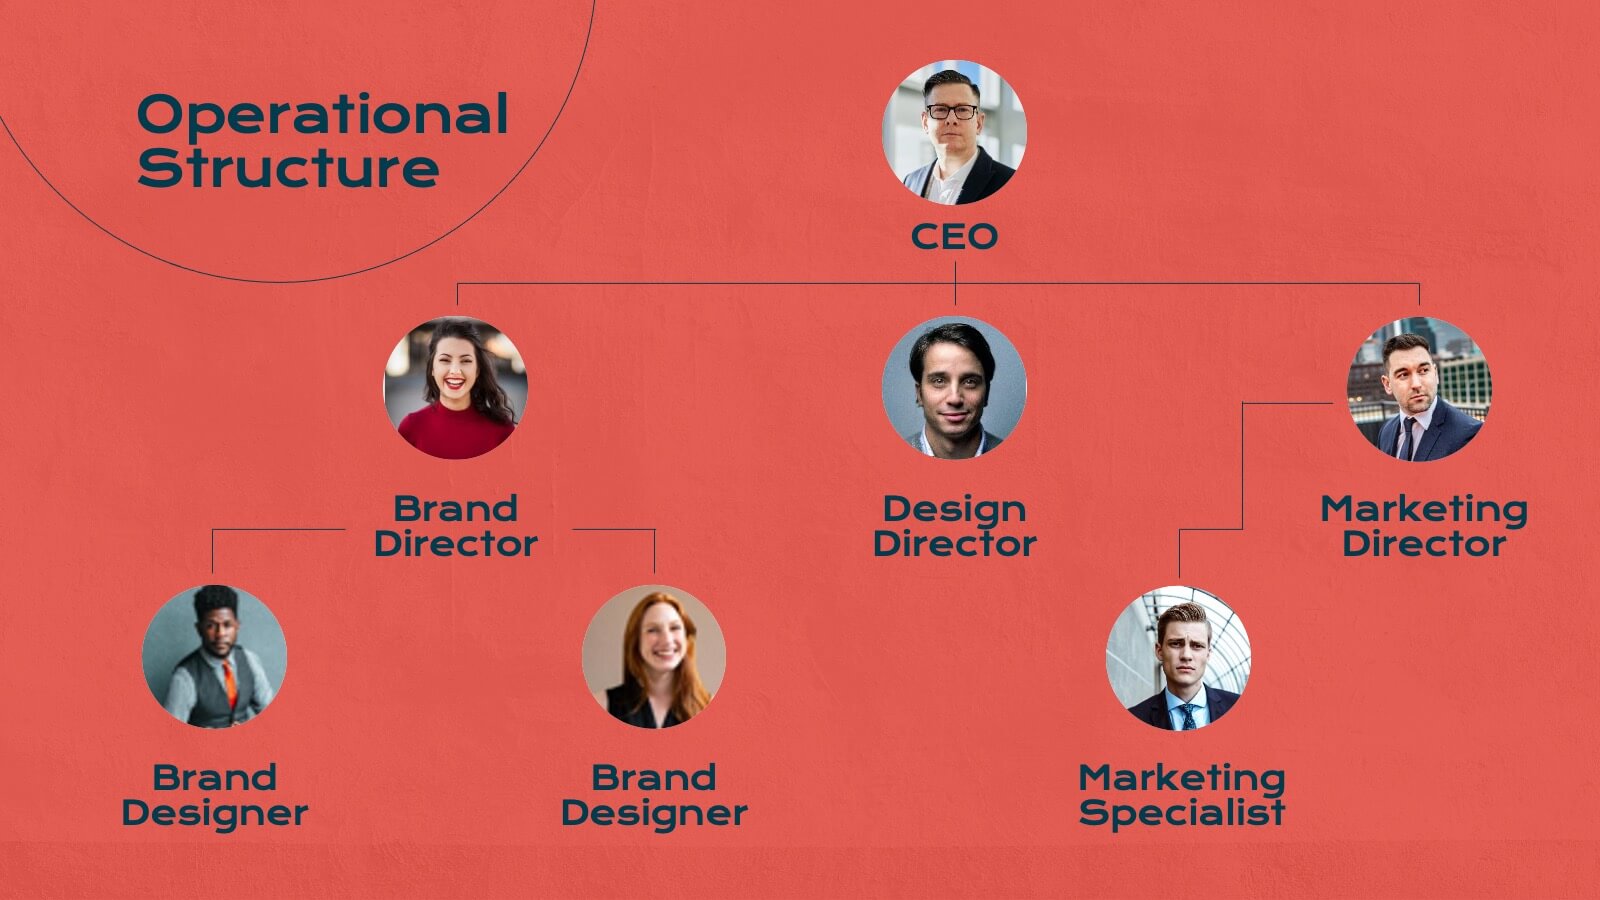
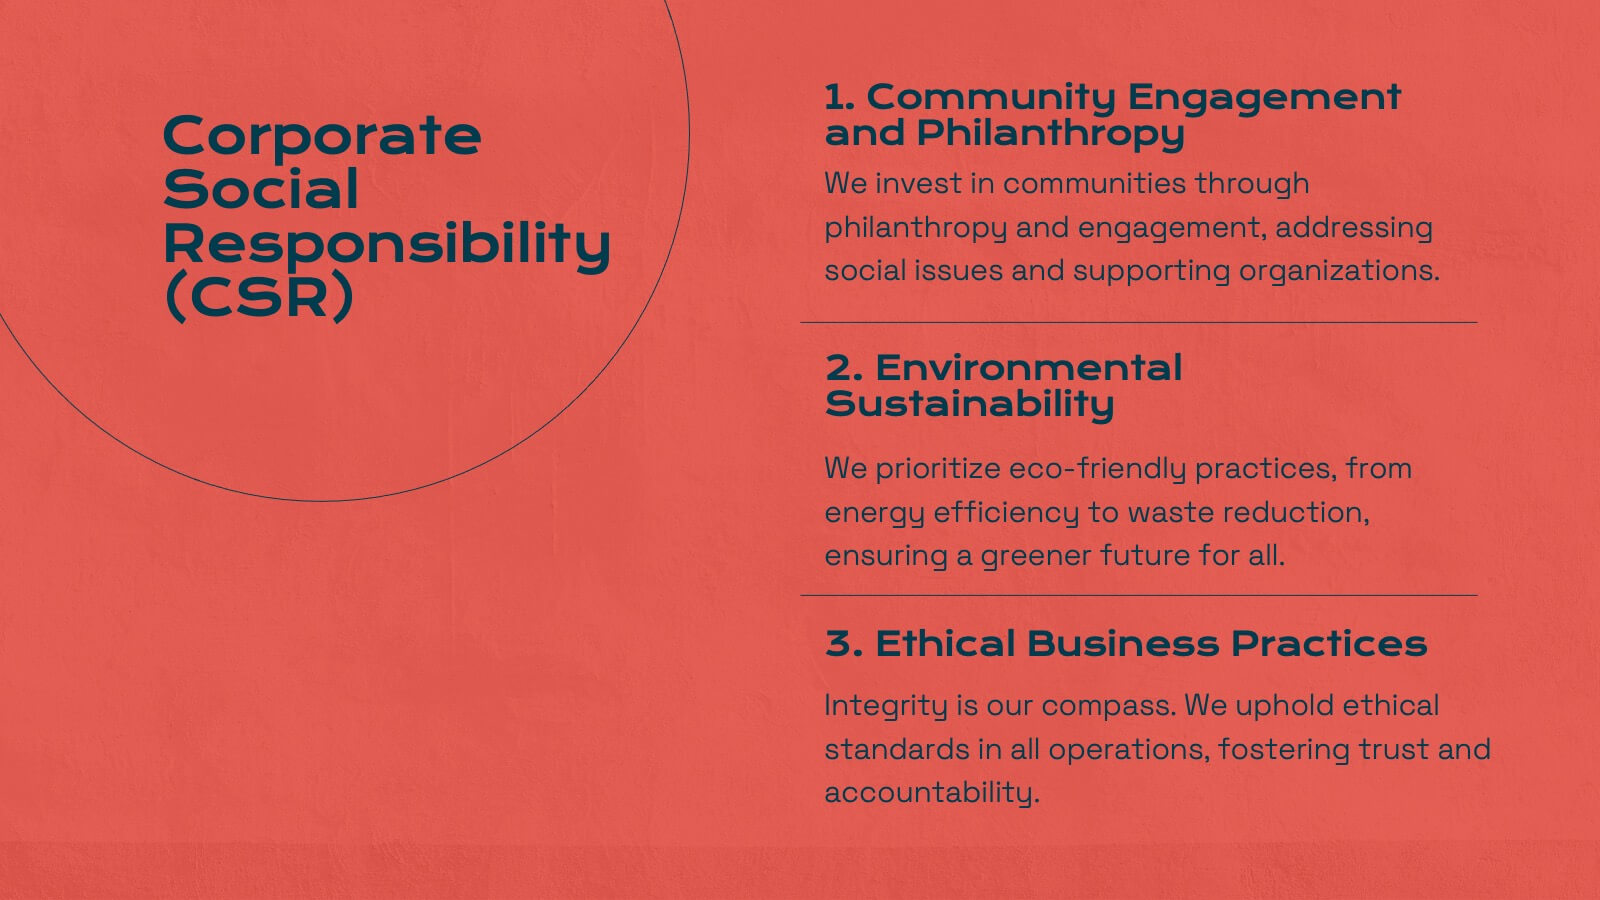
Energize your marketing research presentations with this bold, vibrant template. Perfect for detailing company history, market presence, and competitive landscapes, it features a striking red design that captures attention. Highlight key insights like target audience, financial highlights, and growth plans to engage your audience. Compatible with PowerPoint, Keynote, and Google Slides, it ensures seamless presentations on any platform.


26 slides
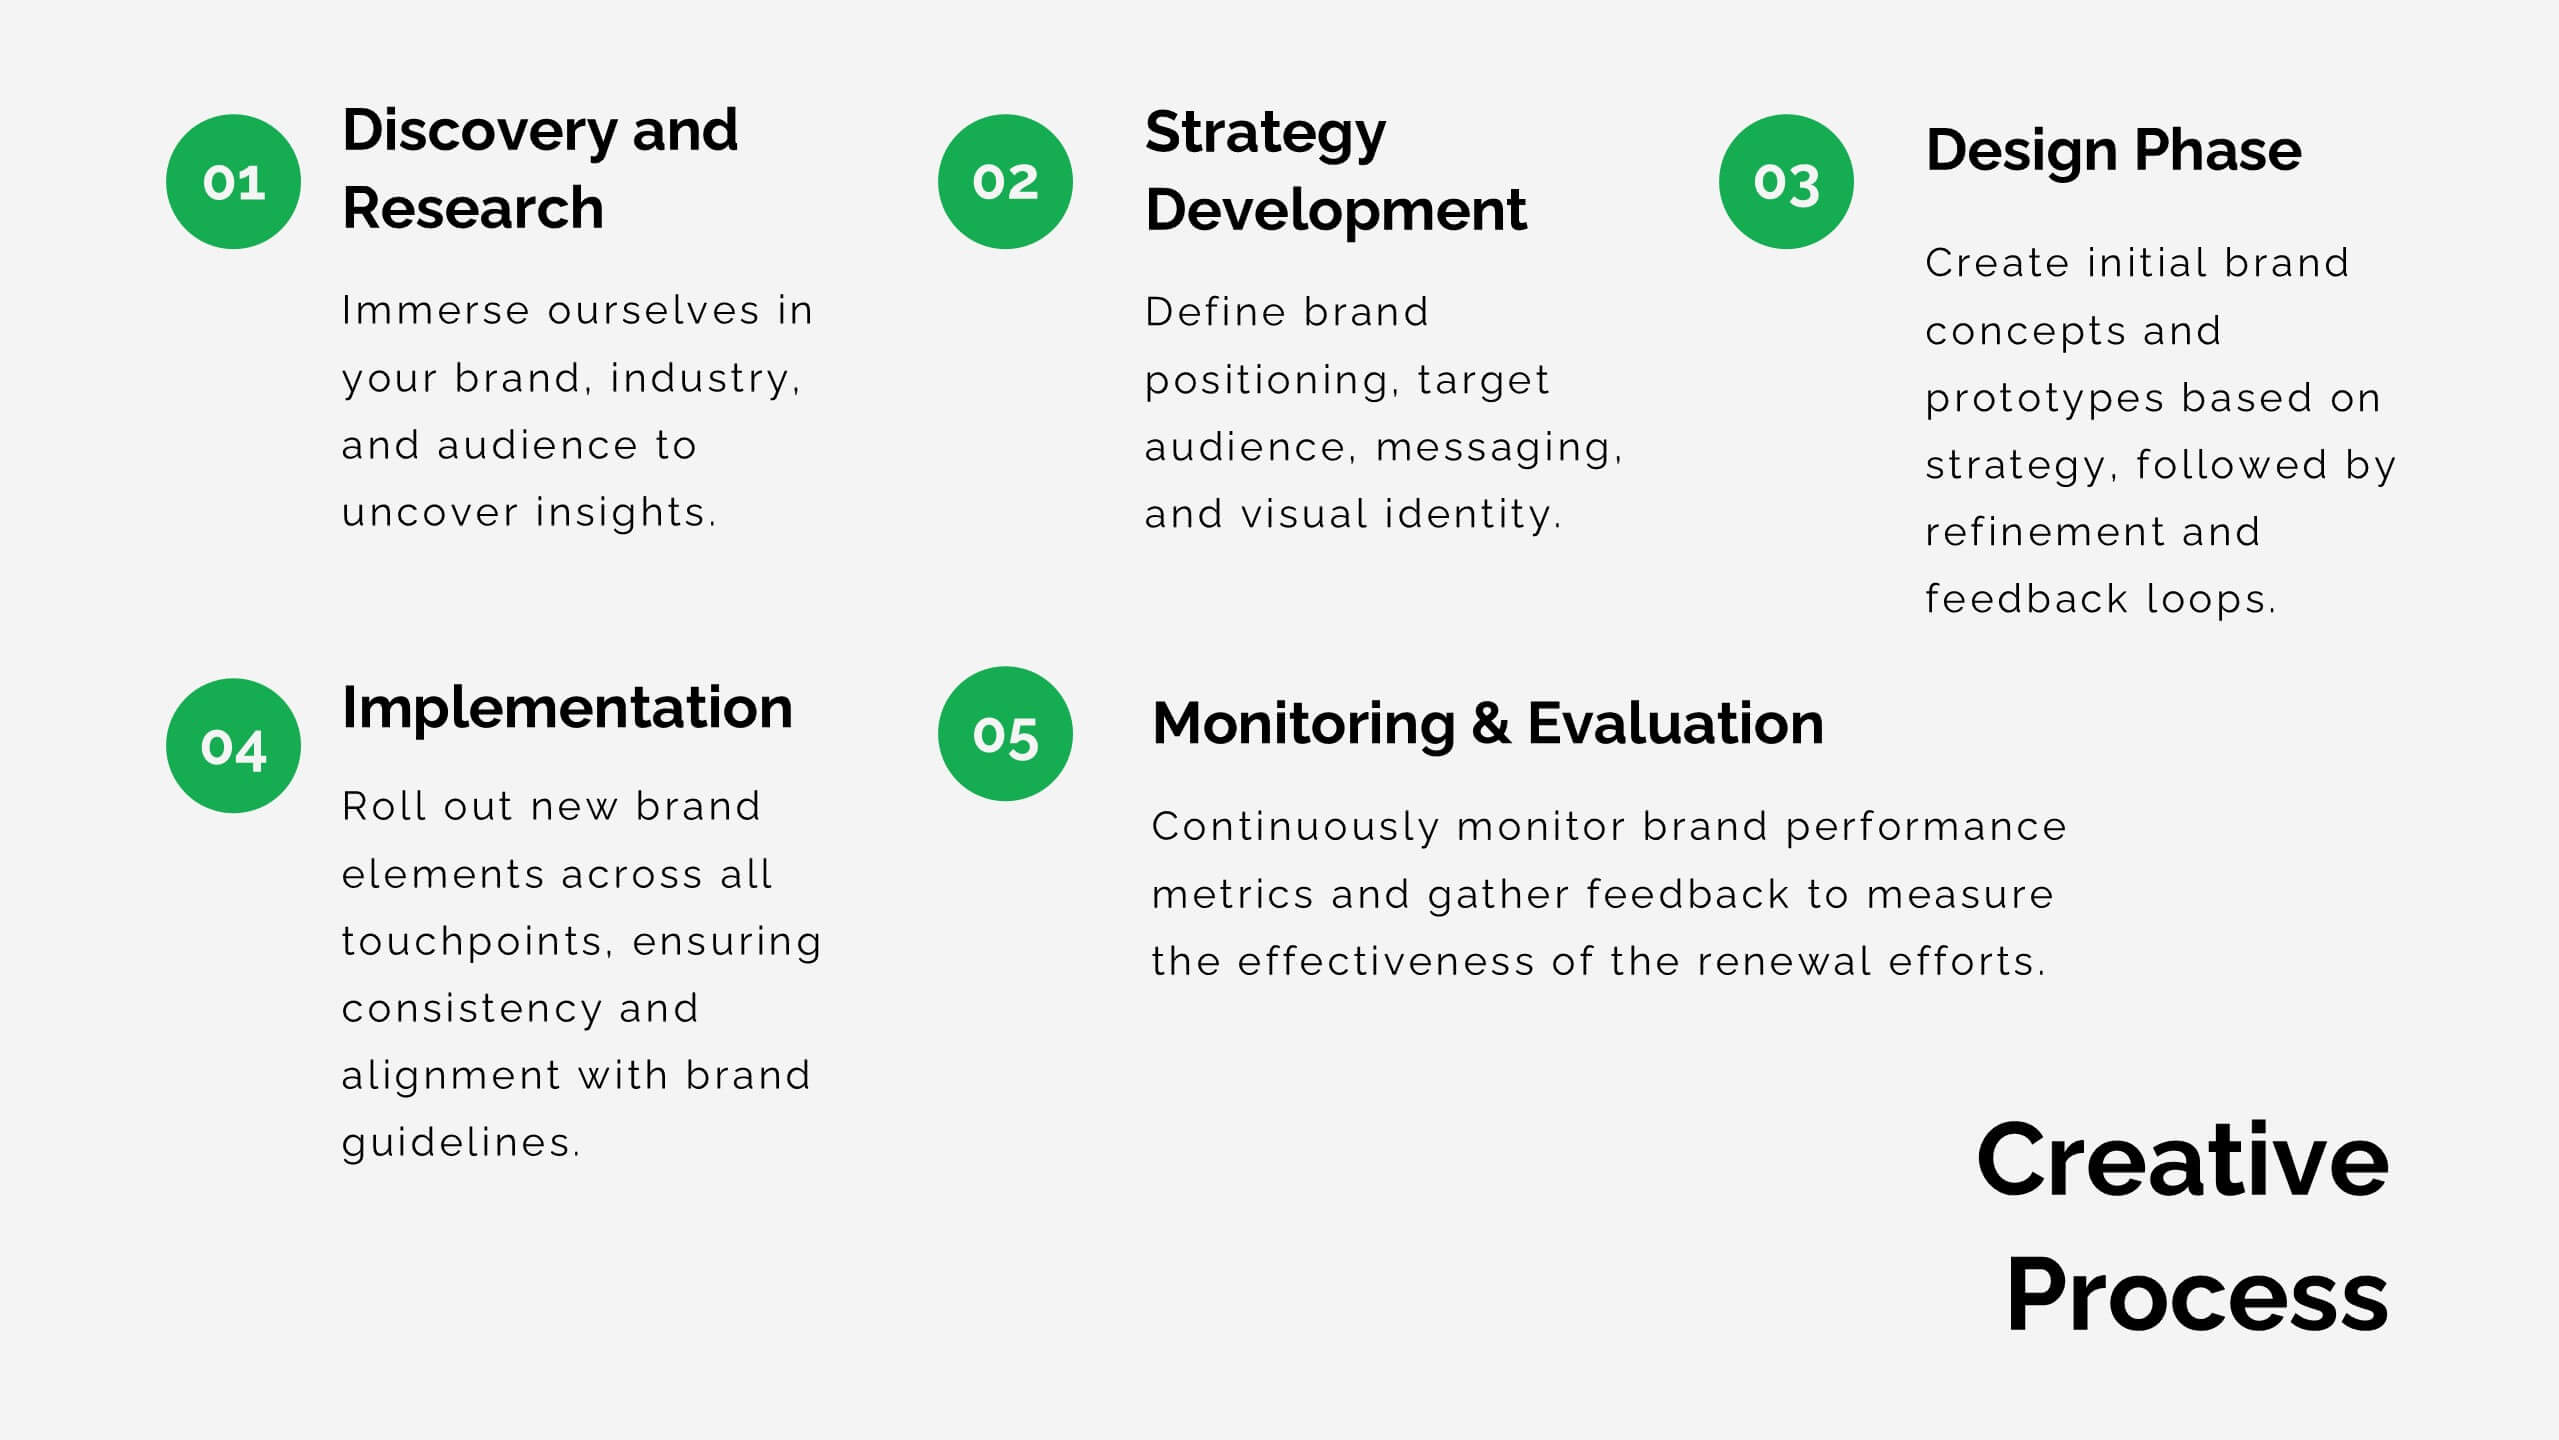
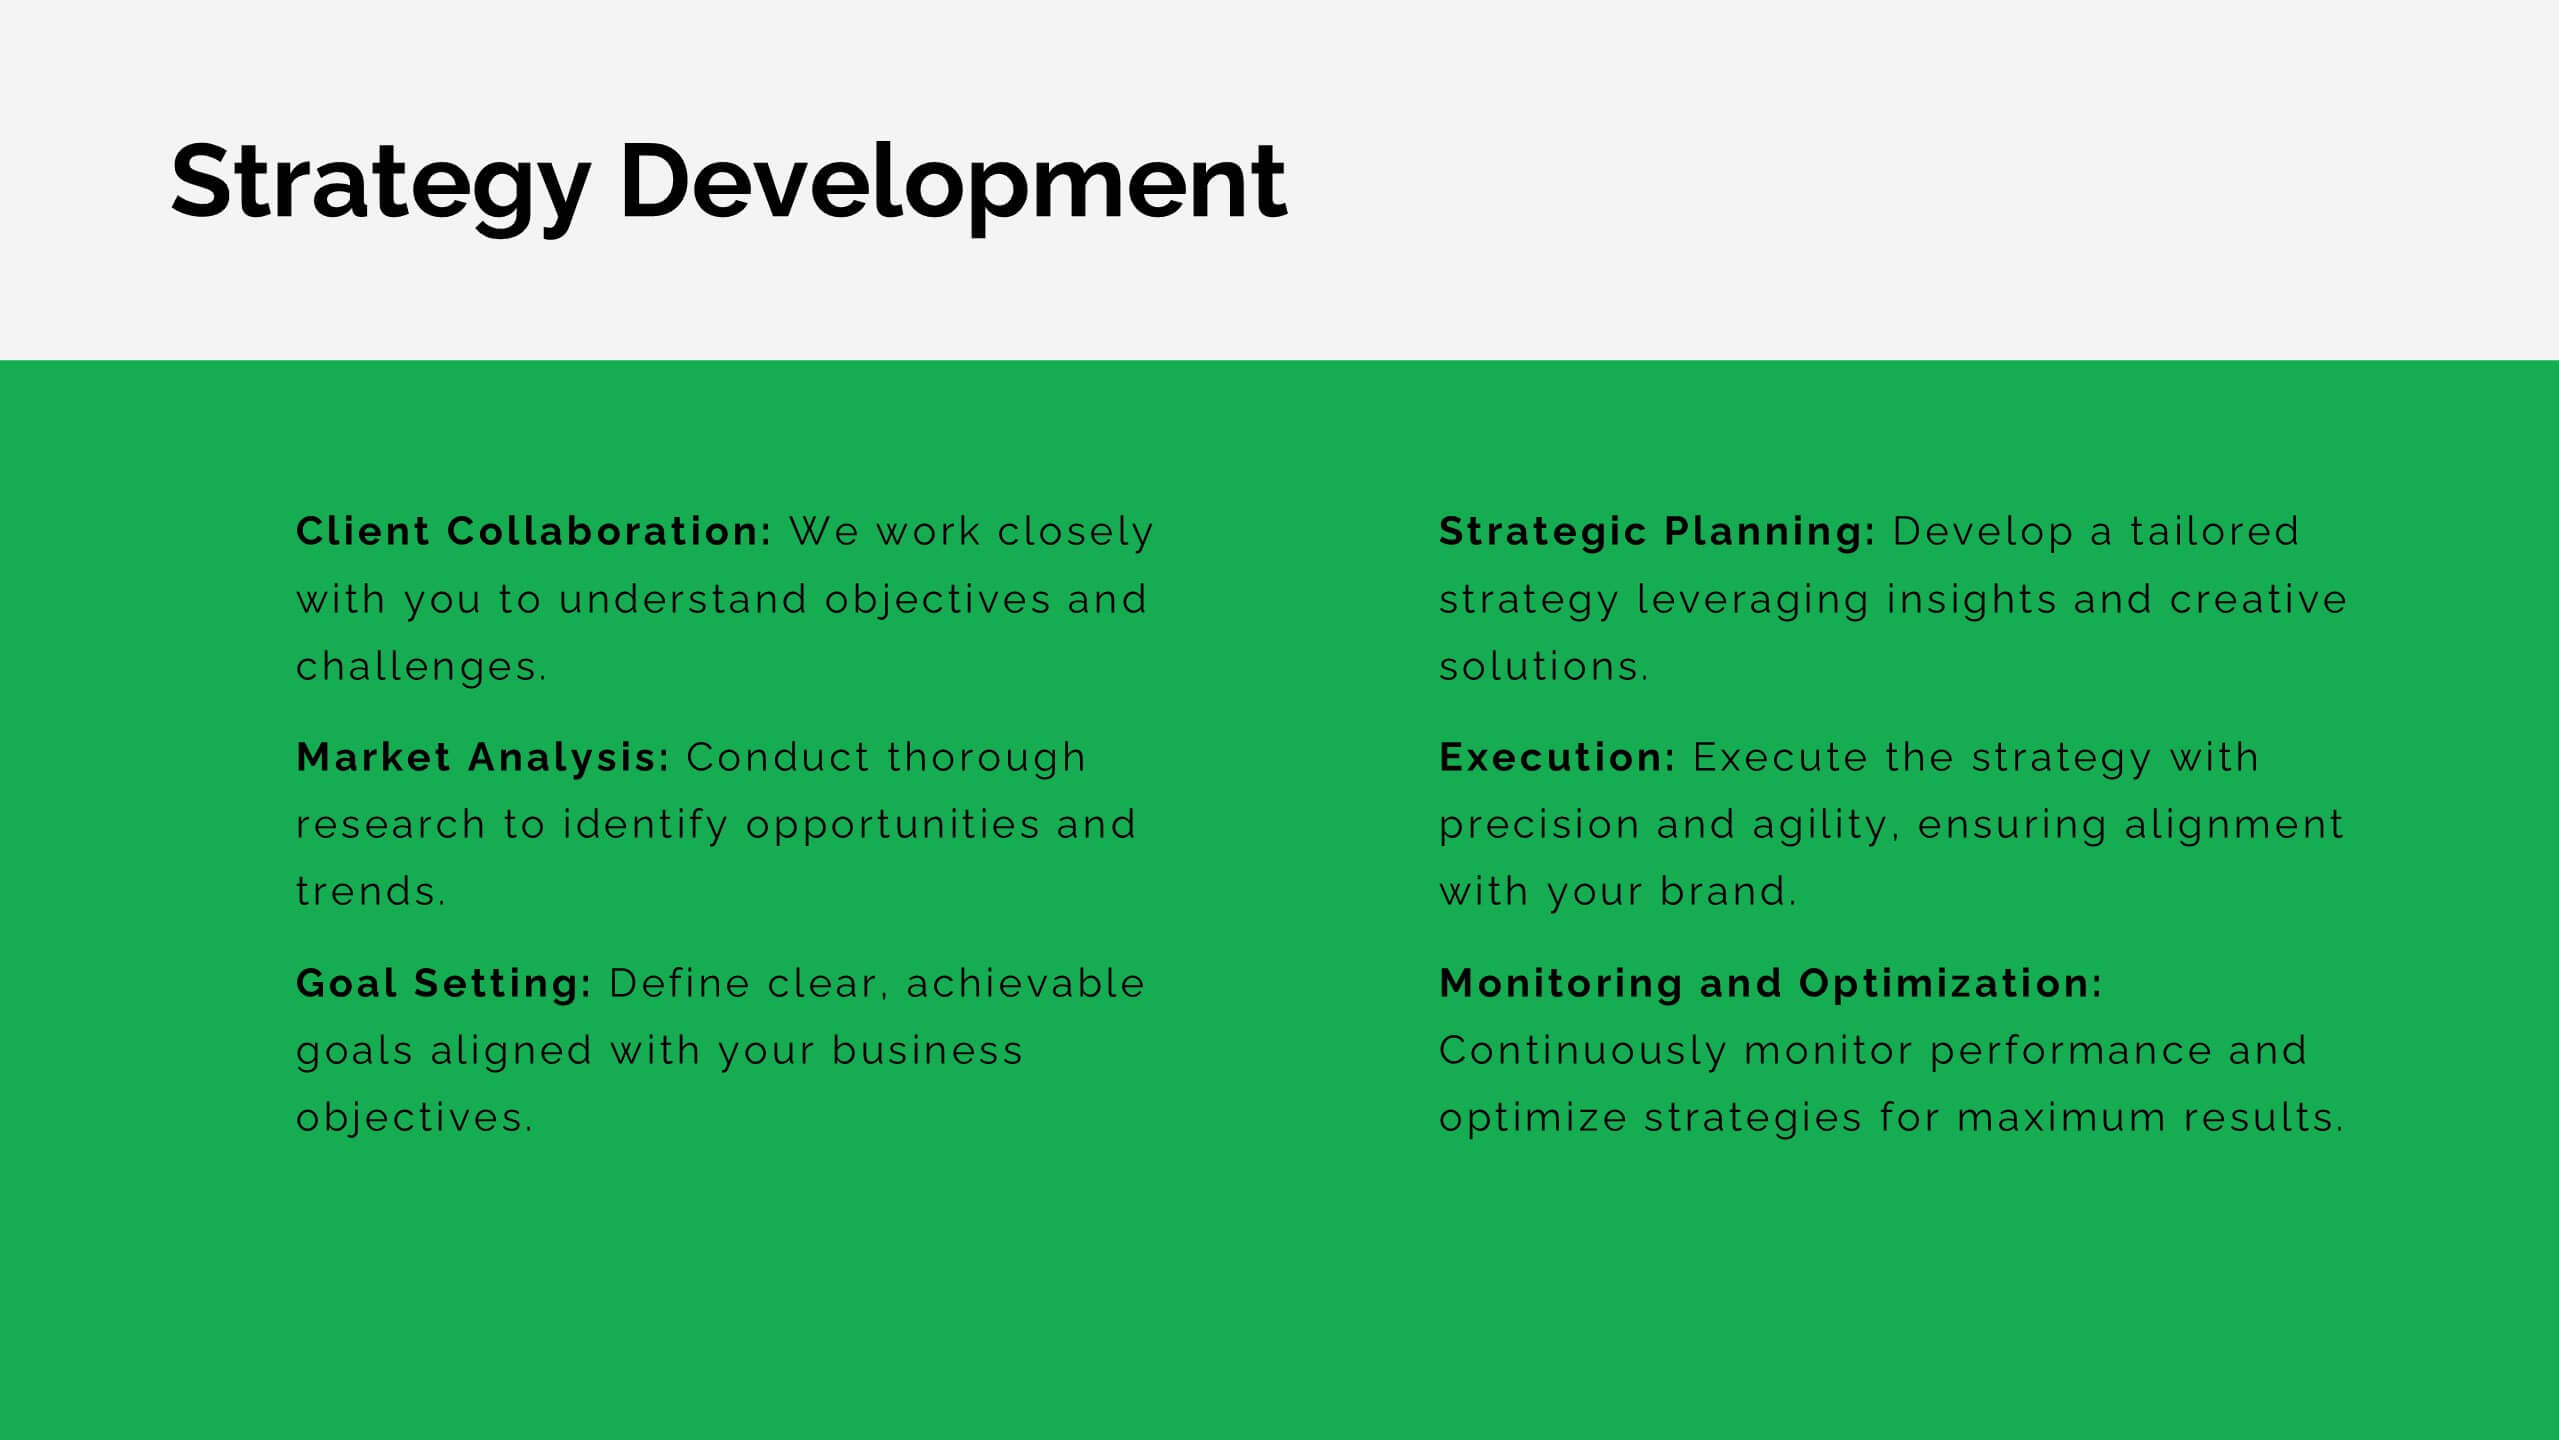
Spellis Rebranding Project Plan Presentation
Revamp your brand’s identity with this sleek and strategic presentation template. Covering key aspects such as brand values, audience personas, strategy, positioning, and future development, this template ensures a comprehensive rebranding approach. Fully customizable and compatible with PowerPoint, Keynote, and Google Slides for seamless use.


4 slides
4-Level Funnel Analysis Diagram Presentation
Give your insights a clear path to follow with this clean, modern diagram built to simplify layered decision-making. This presentation breaks complex stages into four easy-to-read levels, helping you explain flow, priorities, and performance with confidence. Fully compatible with PowerPoint, Keynote, and Google Slides.
22 slides
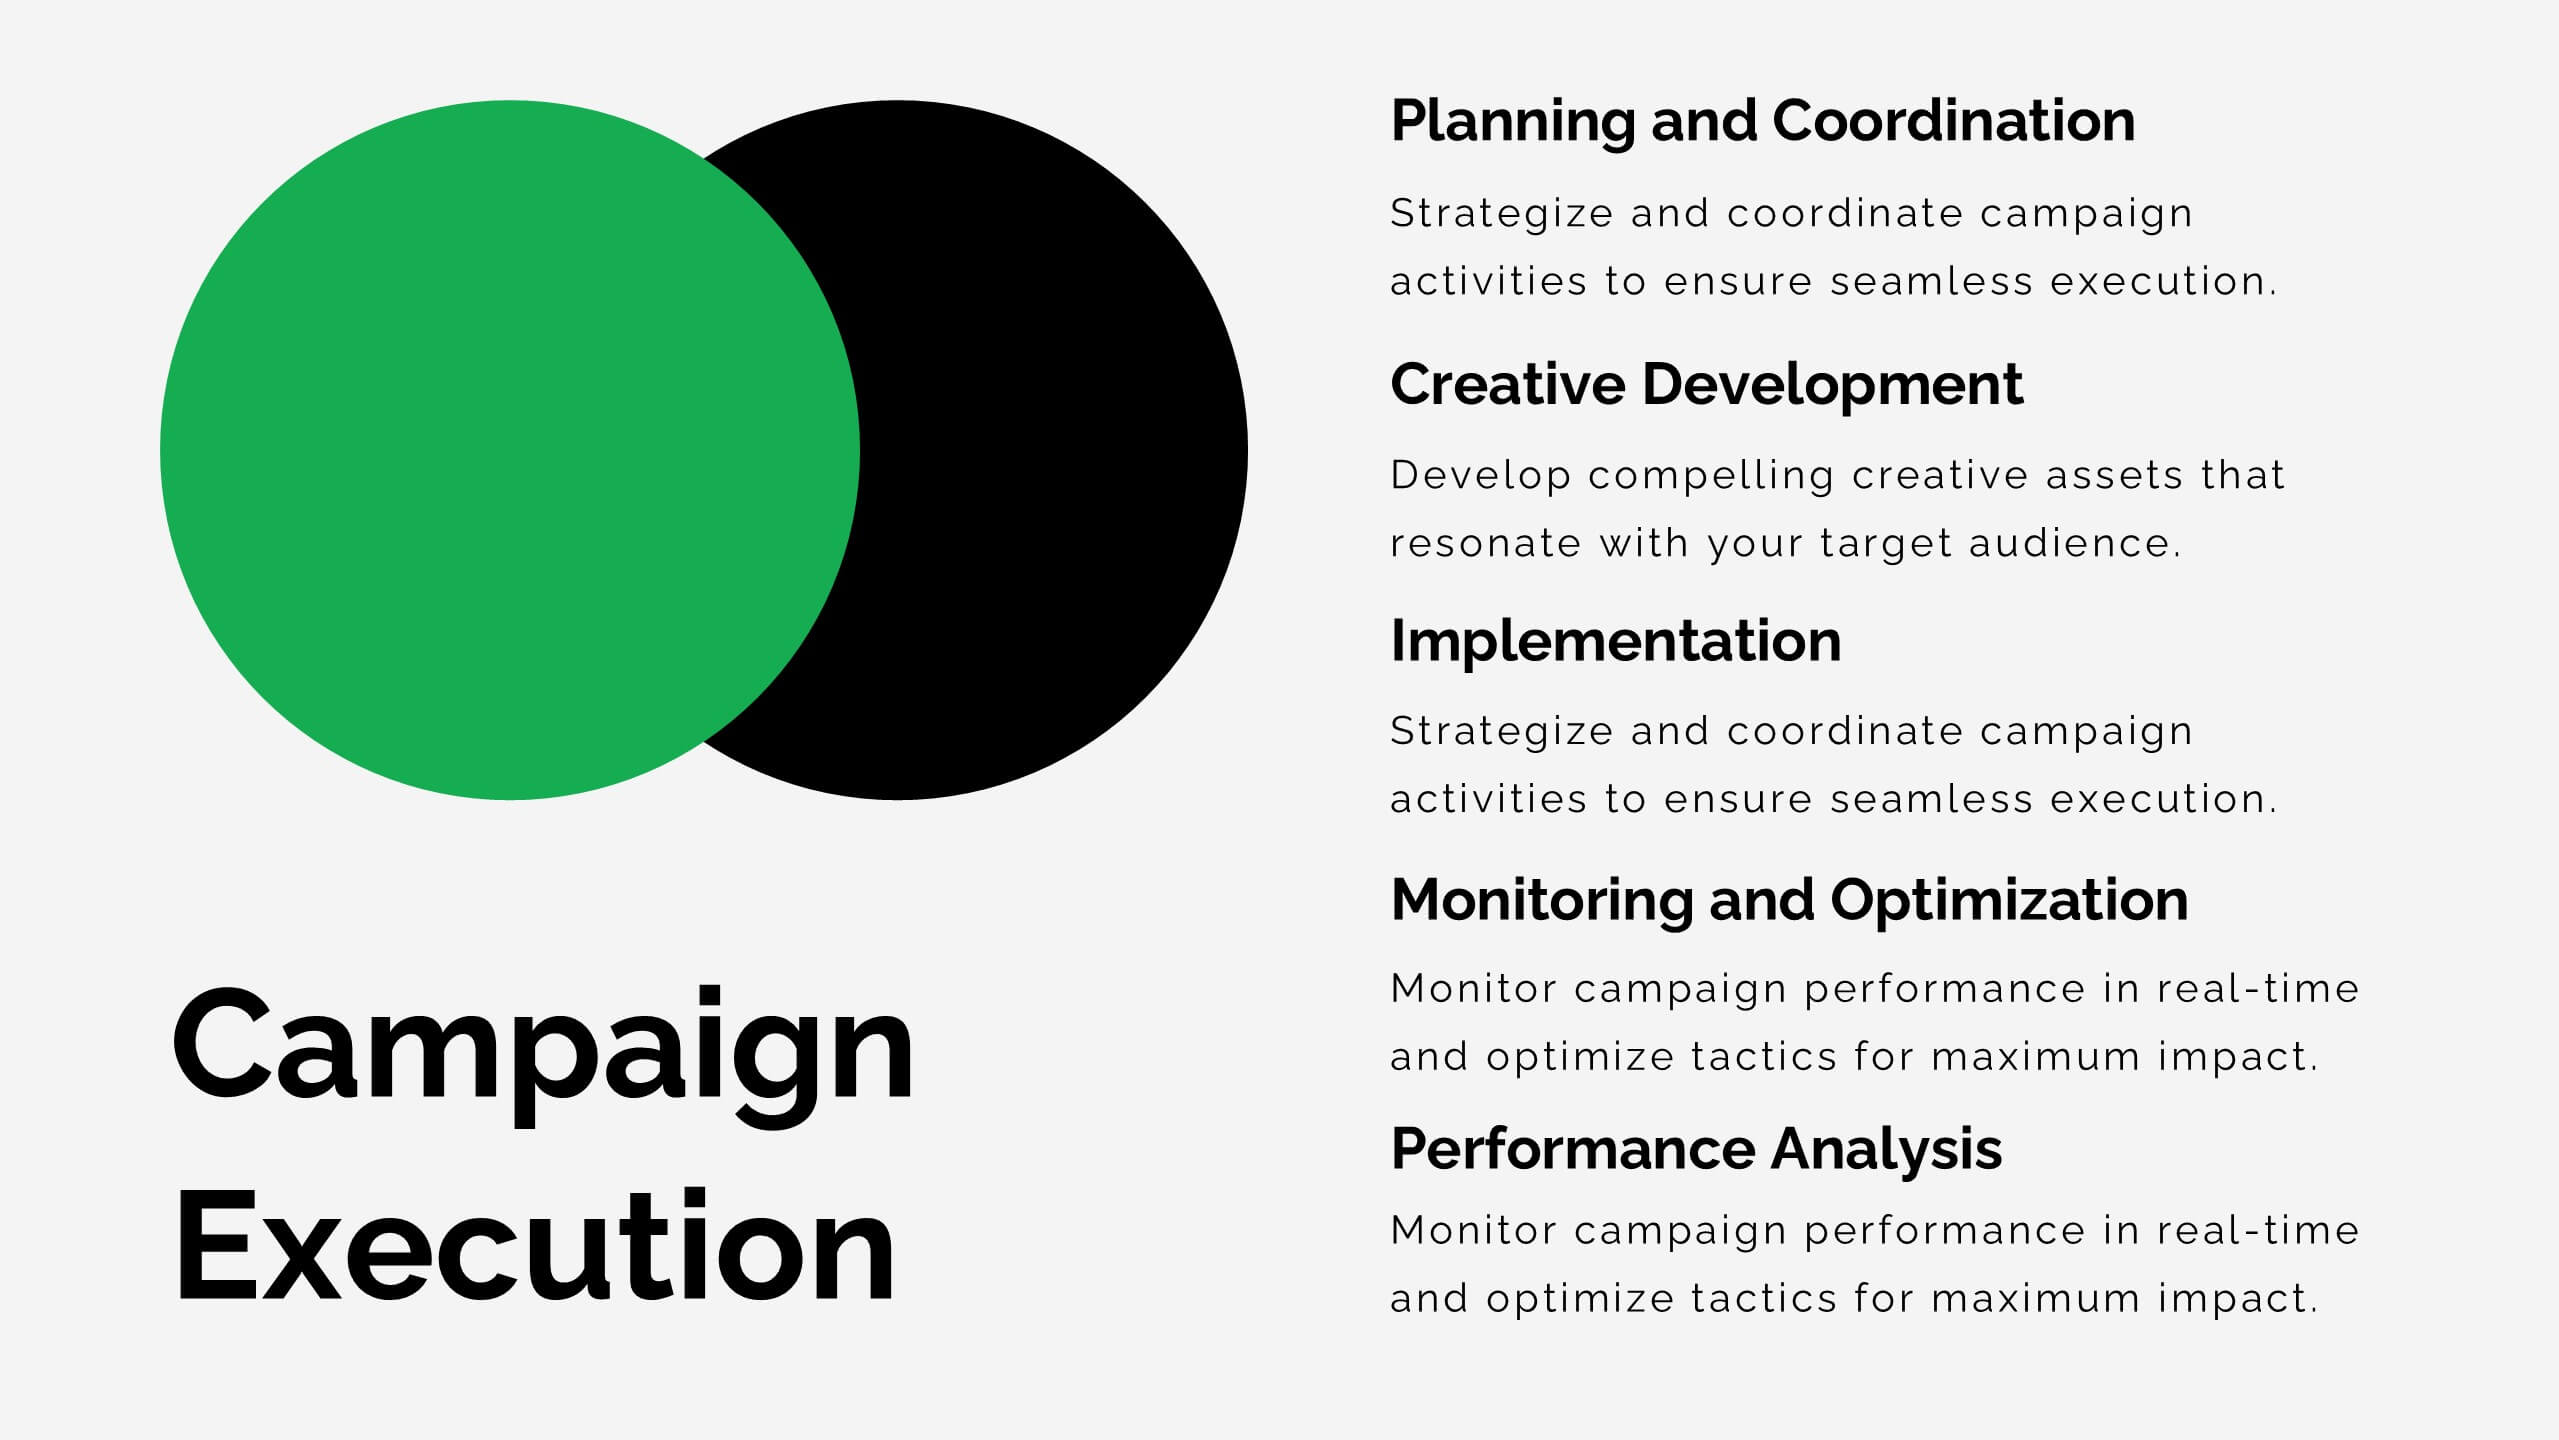
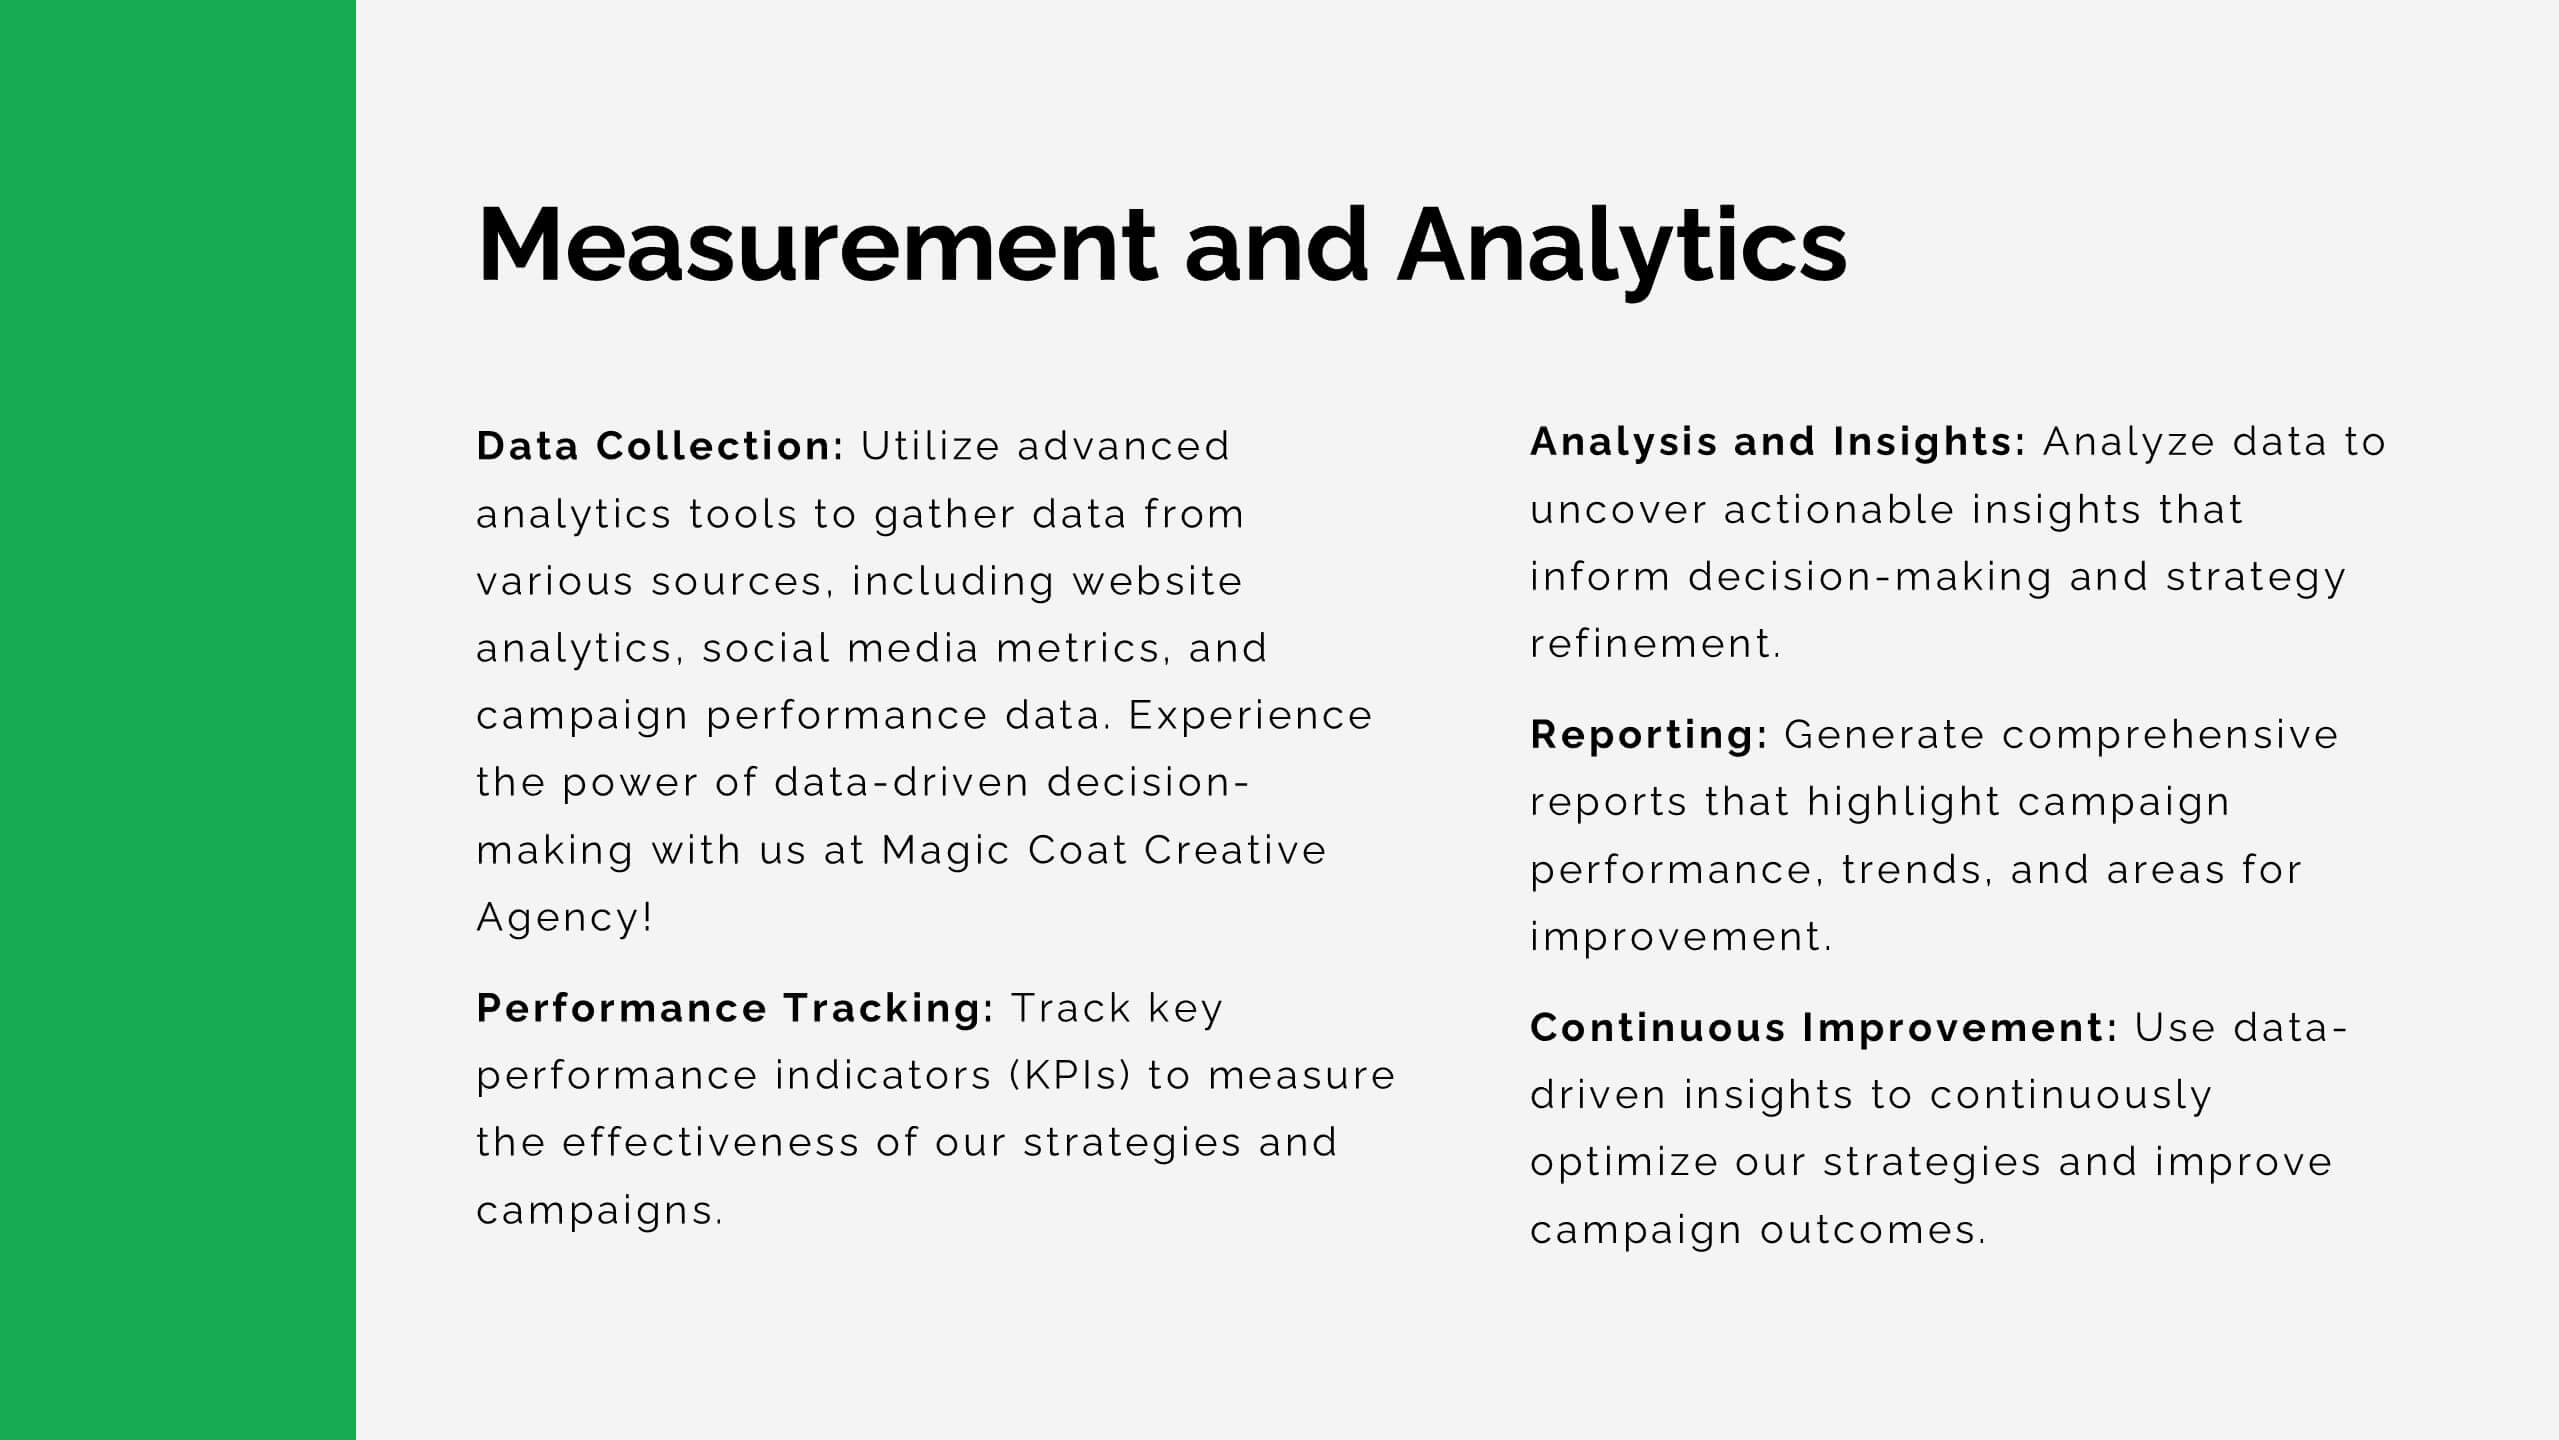
Lithium Advertising Agency Proposal Presentation
Elevate your advertising agency’s proposals with this sleek and modern template! It covers key areas like market analysis, case studies, client success stories, and campaign execution. Fully customizable, this template is perfect for presenting your agency’s services and strategies. Compatible with PowerPoint, Keynote, and Google Slides, it’s designed for impactful client presentations.


4 slides
Business Development Roadmap Presentation
Visualize your growth journey with this Business Development Roadmap Presentation. Featuring a winding road design with four milestones, it’s perfect for showcasing project phases, strategic goals, or quarterly plans. Each checkpoint is color-coded and icon-based for easy comprehension. Fully editable in PowerPoint, Keynote, and Google Slides.


10 slides
Water Resource Management Presentation
Present your strategy with this clean and modern Water Resource Management slide. Featuring droplet graphics and percentage visuals, it's ideal for showcasing water usage, sustainability goals, or conservation data. Easily customizable with titles, icons, and insights. Compatible with PowerPoint, Keynote, and Google Slides for seamless editing.


5 slides
Task Automation Process Flow Presentation
Streamline operations with this visual task automation flowchart. Perfect for illustrating automated sequences, decision nodes, and multi-branch logic. Clearly labeled elements guide viewers through each step. Ideal for tech teams, process designers, and workflow planning. Fully editable in PowerPoint, Keynote, and Google Slides to match your branding and automation strategy.