


Features
- 5 Unique slides
- Fully editable and easy to edit in Microsoft Powerpoint, Keynote and Google Slides
- 16:9 widescreen layout
- Clean and professional designs
- Export to JPG, PDF or send by email


Do you have any questions?
Recommend


5 slides
Professional Business Proposal Presentation
Make your pitch stand out with a polished, minimal design that highlights every key stage of your business strategy. This clean visual layout is perfect for outlining project phases, services, or data-driven insights with clarity and impact. Fully compatible with PowerPoint, Keynote, and Google Slides for easy customization.


4 slides
Project Responsibility Chart
Streamline team coordination with this Project Responsibility Chart. Clearly define who is Responsible, Accountable, Consulted, and Informed across key tasks. Ideal for project managers and team leads ensuring role clarity. Fully editable in PowerPoint, Keynote, and Google Slides.


5 slides
Business Choices and Outcomes Analysis Presentation
Visually connect key business options with their potential results using the Business Choices and Outcomes Analysis slide. Featuring a clean puzzle-style layout, this template is perfect for illustrating decision pathways, pros and cons, or strategy alternatives. Ideal for consultants, managers, and analysts. Easily customizable in PowerPoint, Keynote, and Google Slides.


4 slides
Cost Breakdown for Business Planning Presentation
Visually balance your budget strategy with the Cost Breakdown for Business Planning Presentation. Featuring a scale-style layout, this slide helps you compare two financial metrics or allocations with clarity and simplicity. Ideal for showcasing trade-offs, resource planning, or funding distribution. Fully editable in PowerPoint, Google Slides, Keynote, and Canva.


5 slides
Employee Training Needs Presentation
Spark growth and strengthen team performance with a clear visual guide that highlights skill gaps, development priorities, and learning pathways. This presentation helps HR and managers map essential competencies and plan impactful training programs. Perfect for performance reviews and workforce planning. Fully compatible with PowerPoint, Keynote, and Google Slides.


7 slides
Target Market Profiles Infographic
A Target Market Profile, also known as a customer profile or buyer persona, is a detailed description of a specific segment of a broader market that a business aims to target with its products or services. This infographic is a vibrant and insightful template designed to help you understand your audience better and enhance your marketing strategies. Explore the essence of audience segmentation and empower your marketing endeavors with a clear understanding of your target market. Compatible with Powerpoint, Keynote, and Google Slides. This infographic explores the world of targeted marketing and revolutionize your strategies.


4 slides
Cost Analysis and Budget Overview Presentation
Break down financial details with clarity using the Cost Analysis and Budget Overview Presentation. This slide helps you present cost structures, budget allocations, and key financial metrics side by side using icons and visual data blocks. Perfect for reports, planning, or investment decks. Fully editable in PowerPoint, Google Slides, Keynote, and Canva.


7 slides
Investment Infographic Presentation Template
This Investment Infographic template is a professionally designed presentation made to present your ideas in an easy to understand format. This template features a professional design, easy color customization and a number of other useful elements to help you create an amazing infographic. This template is designed to include a variety of charts and graphs to visually demonstrate key points, and incorporates animated elements that make it more interesting for the viewer. This is the perfect presentation to introduce your company's investment portfolio to potential investors.


5 slides
Business Insights Through Dashboard Visualization Presentation
Visualize key metrics with this Business Insights Through Dashboard Visualization presentation. The funnel chart layout is ideal for showcasing conversion rates, customer journeys, or sales processes. Each section includes clear labels and percentage indicators. Fully editable in Canva, PowerPoint, and Google Slides to suit your business reporting needs.


5 slides
Demographic Segmentation Analysis Presentation
Bring your insights to life with a clean, engaging layout that simplifies complex audience data into clear, visual segments. This presentation helps you explain key patterns, compare group behaviors, and communicate strategic decisions with confidence. Fully editable and compatible with PowerPoint, Keynote, and Google Slides.


3 slides
Project Completion Checklist Presentation
Keep projects on track with the Project Completion Checklist template. This structured layout helps you monitor tasks, update statuses, and document progress seamlessly. Featuring status indicators, date tracking, and notes sections, this template enhances productivity and organization. Fully customizable and compatible with PowerPoint, Keynote, and Google Slides for effortless use.


6 slides
Oceania Regional Coverage Strategy Presentation
Plan and present your regional focus with the Oceania Regional Coverage Strategy Presentation. This slide template features a clear map of Oceania with pinpoint markers and corresponding callout labels, perfect for visualizing expansion zones, logistics hubs, or target markets. Fully customizable in Canva, PowerPoint, and Google Slides.


7 slides
Asia Map Geography Infographic
Explore the diverse landscapes and key data of Asia with our collection of Asia Map Infographics. These templates are expertly designed to illustrate various geographical and demographic insights across the continent, making them ideal for educational purposes, business presentations, or travel-related projects. Each infographic is crafted with a clean, clear layout that highlights different countries, regions, and significant data points such as population density, economic indicators, or cultural statistics. The use of color coding and spatial markers ensures that information is easily understandable and visually appealing. Fully customizable, these templates allow you to adjust the data points, colors, and text to suit specific presentation needs or to focus on particular areas of interest. Whether you're a teacher, a business analyst, or a traveler preparing a presentation, these slides offer a valuable resource for conveying complex geographical data in a straightforward and engaging manner.


6 slides
Academic Science Infographic Presentation
Bring your scientific insights to life with a clean, engaging slide that turns complex concepts into an easy-to-follow visual story. This presentation highlights key academic data through connected icons and structured text, helping you explain research findings clearly and confidently. Fully compatible with PowerPoint, Keynote, and Google Slides.


22 slides
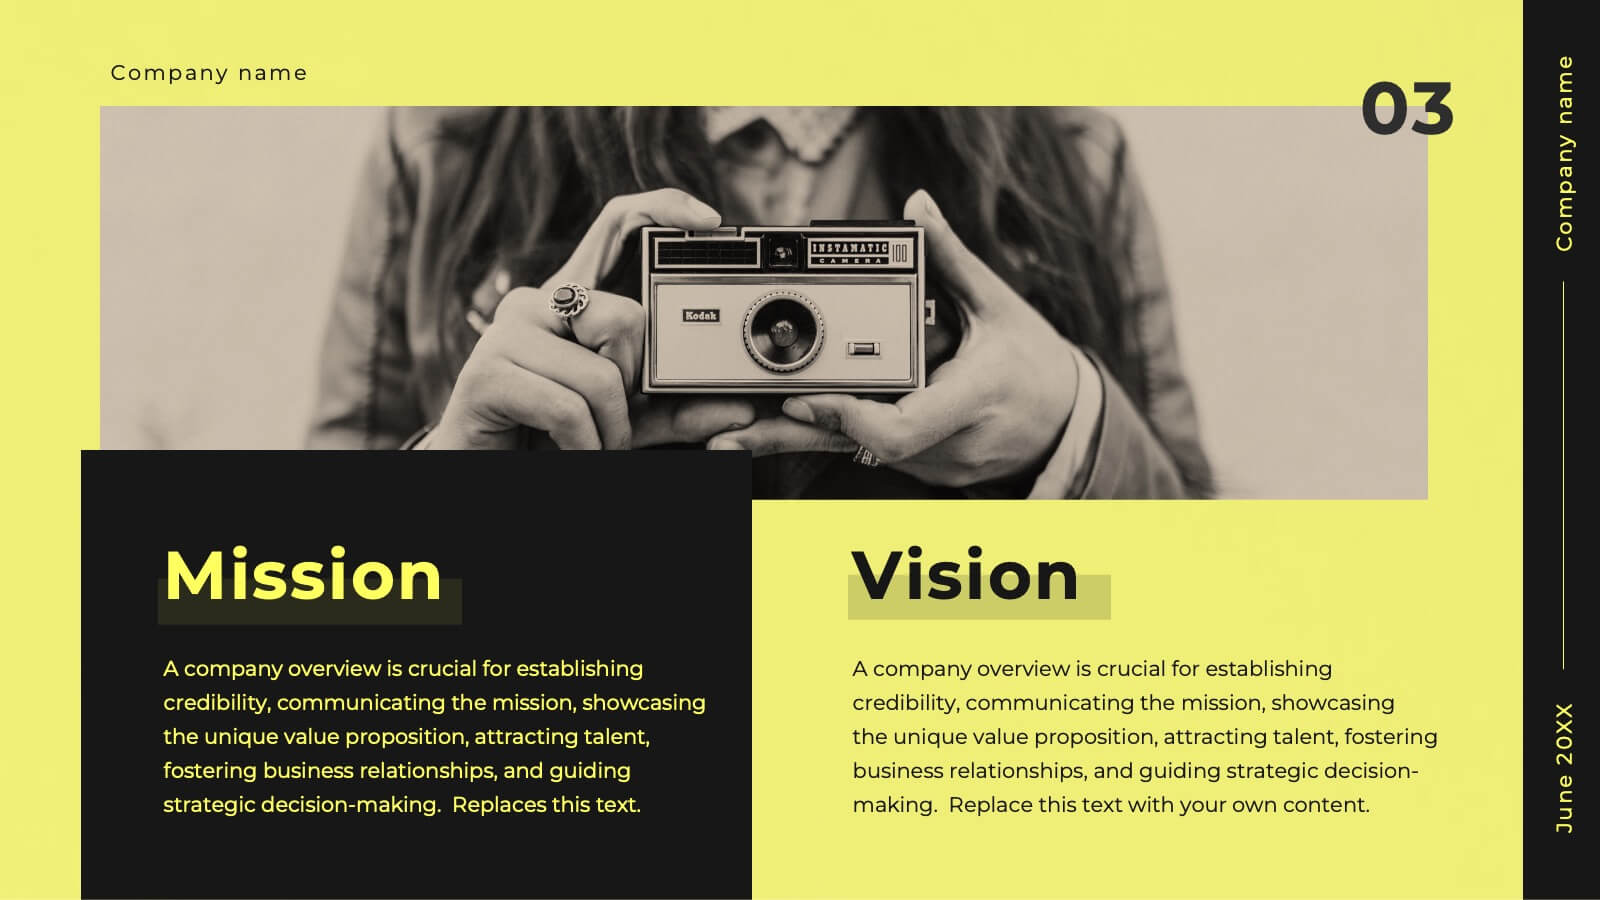
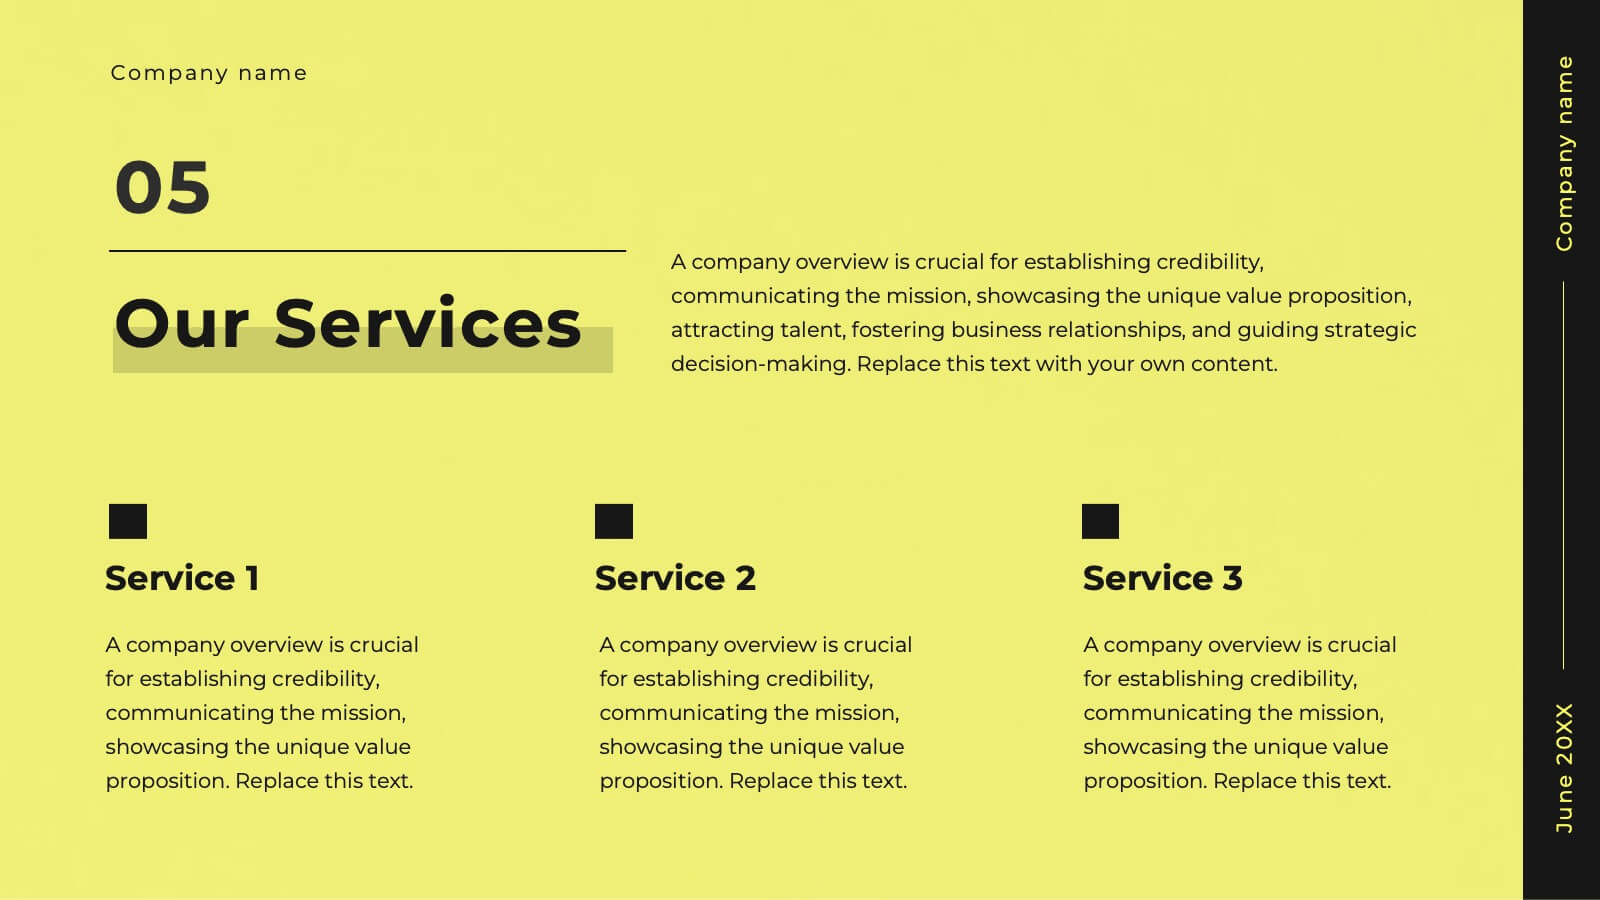
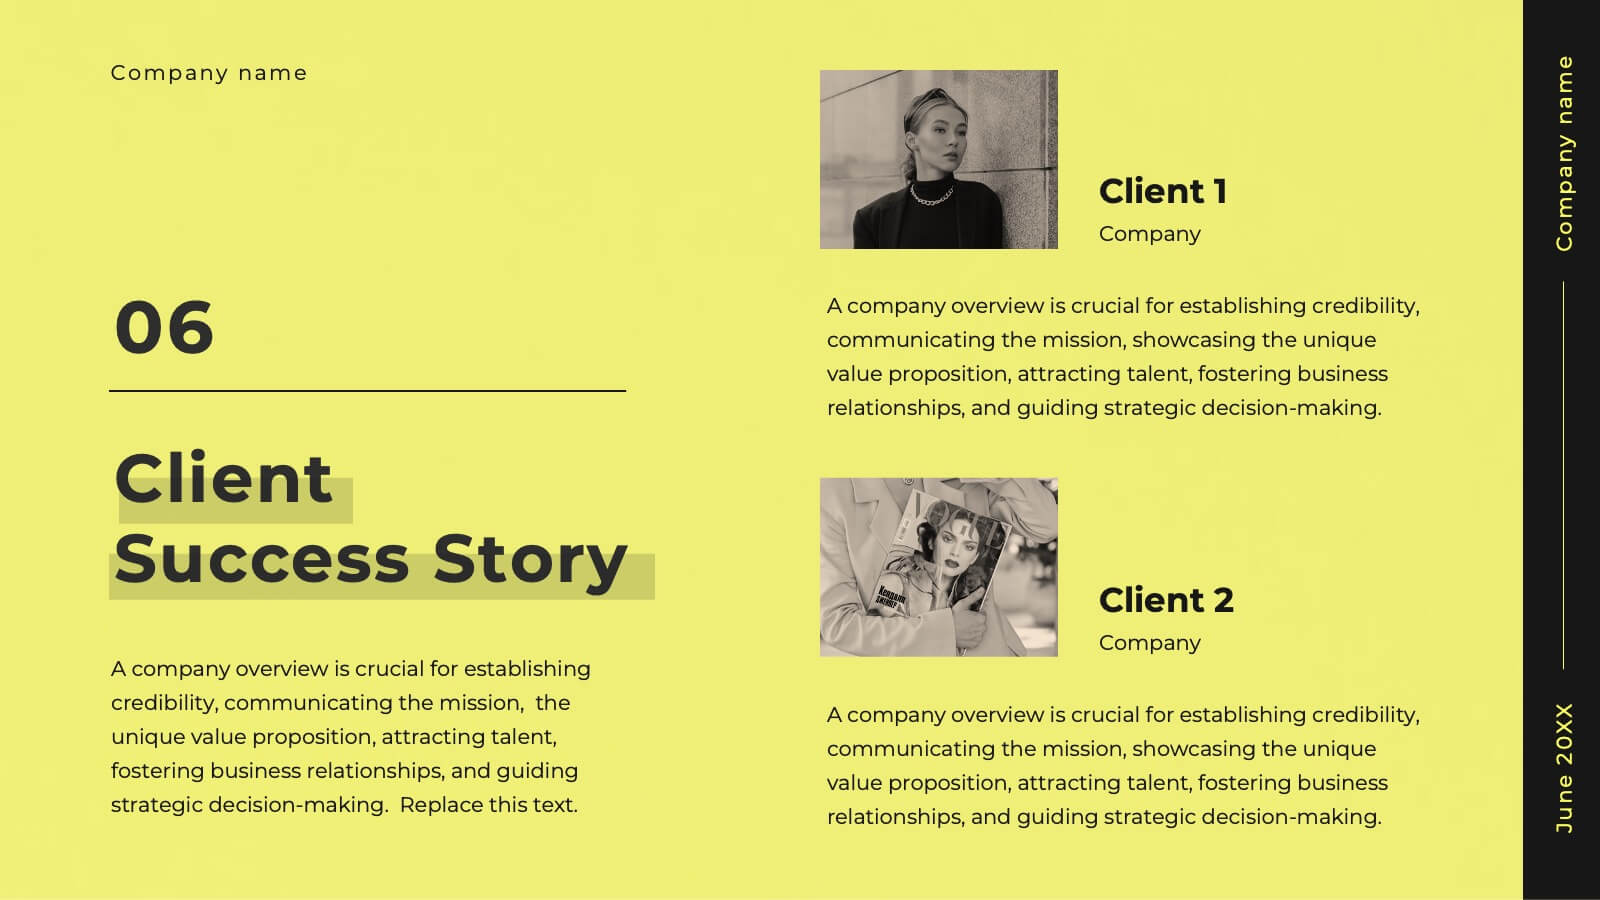
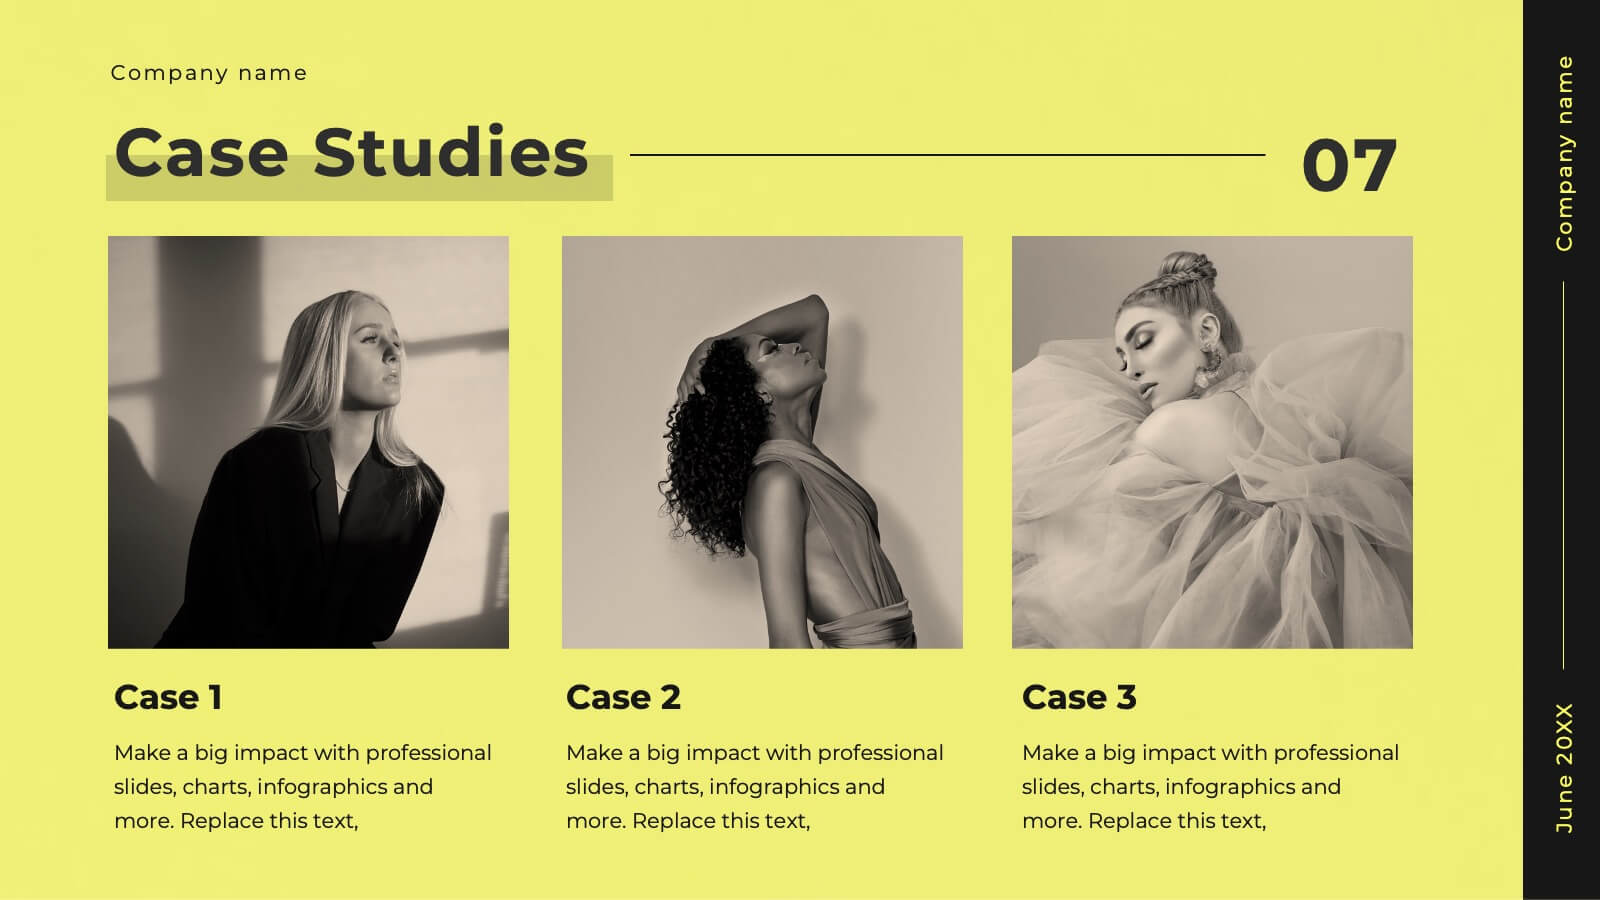
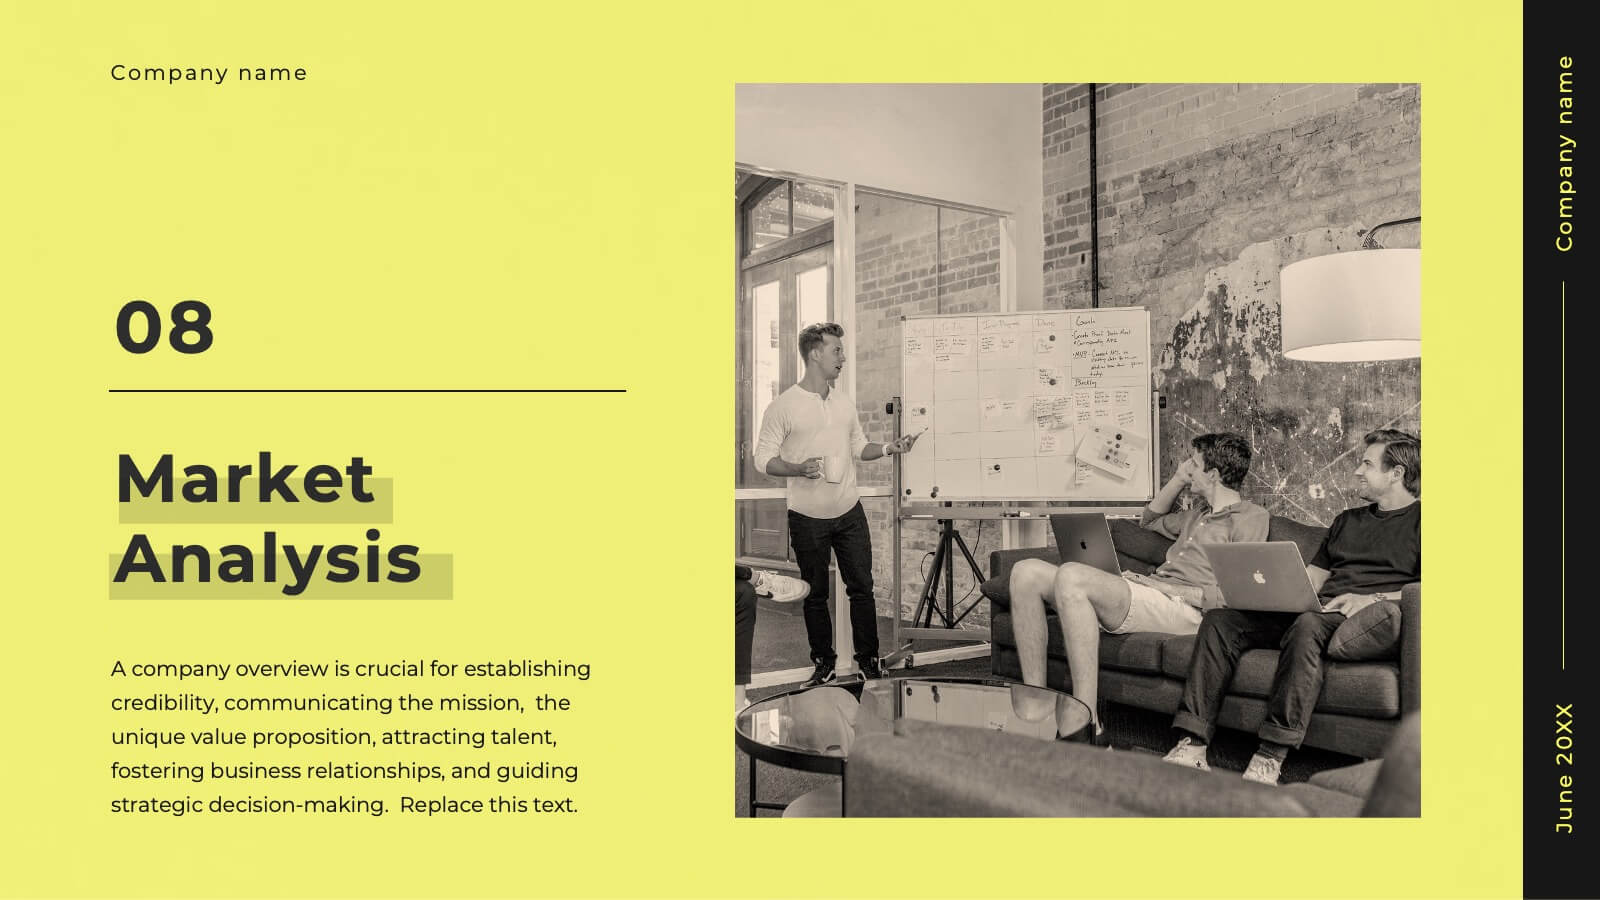
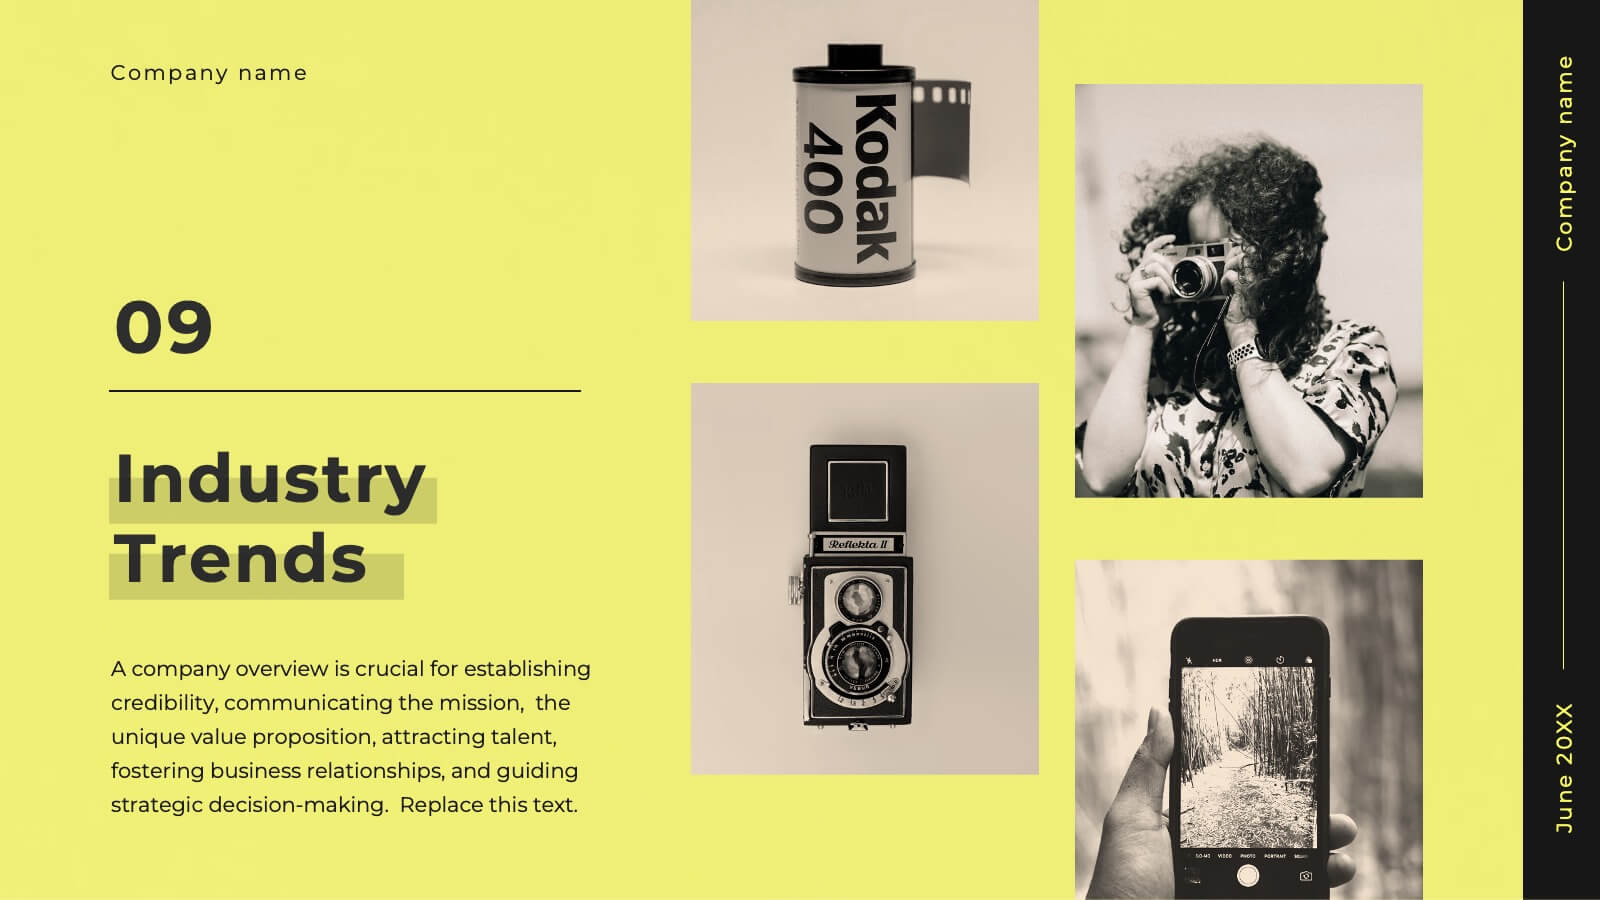
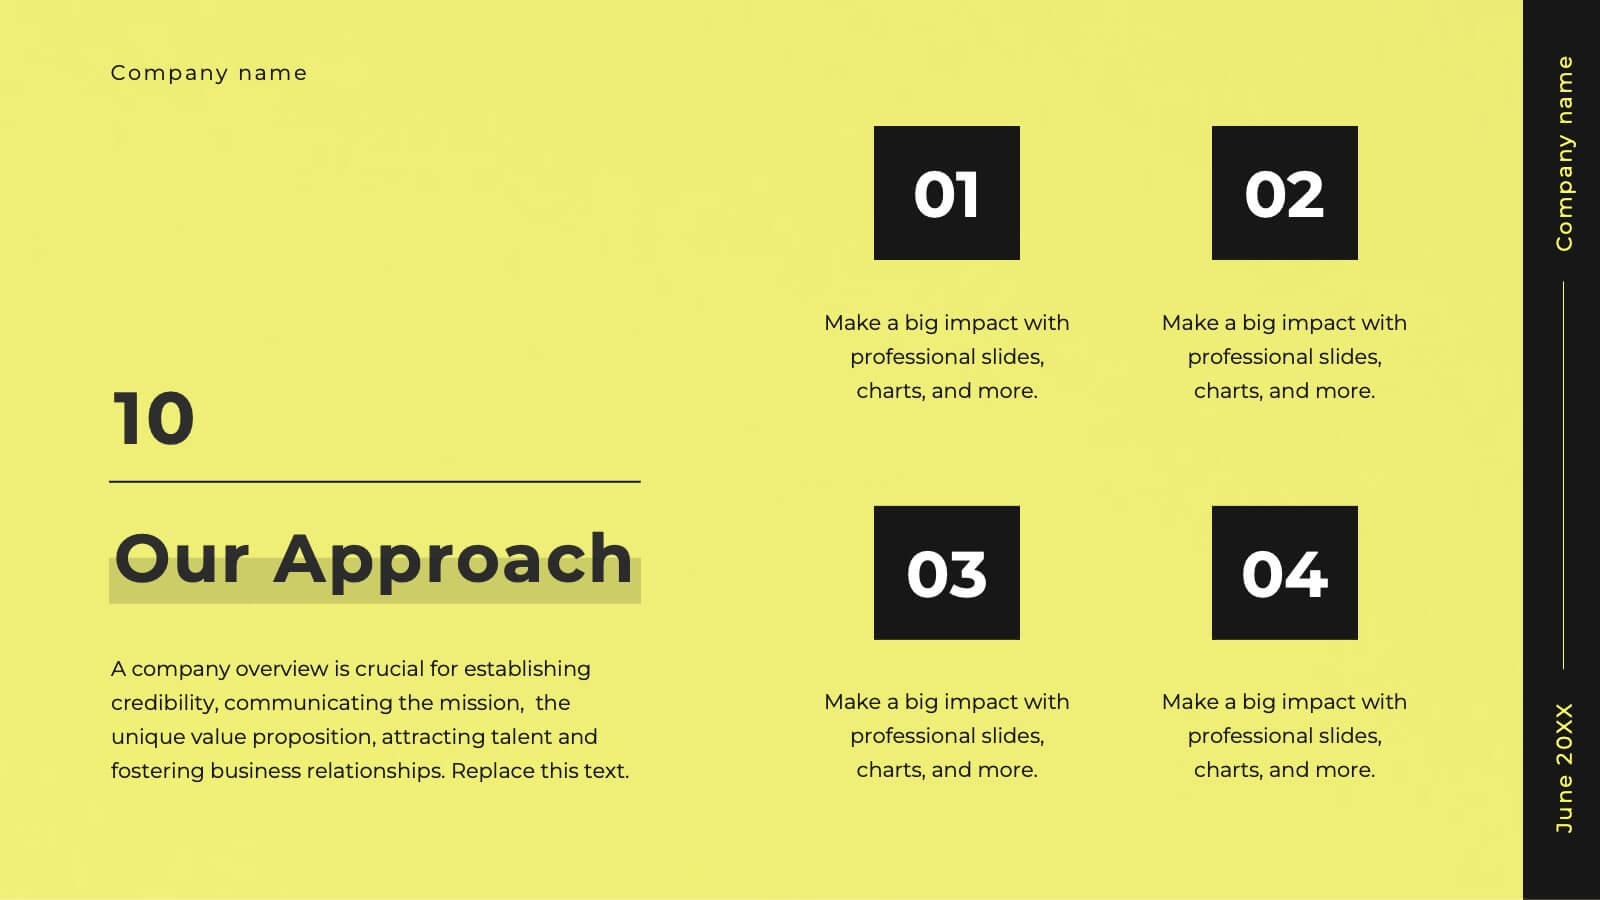
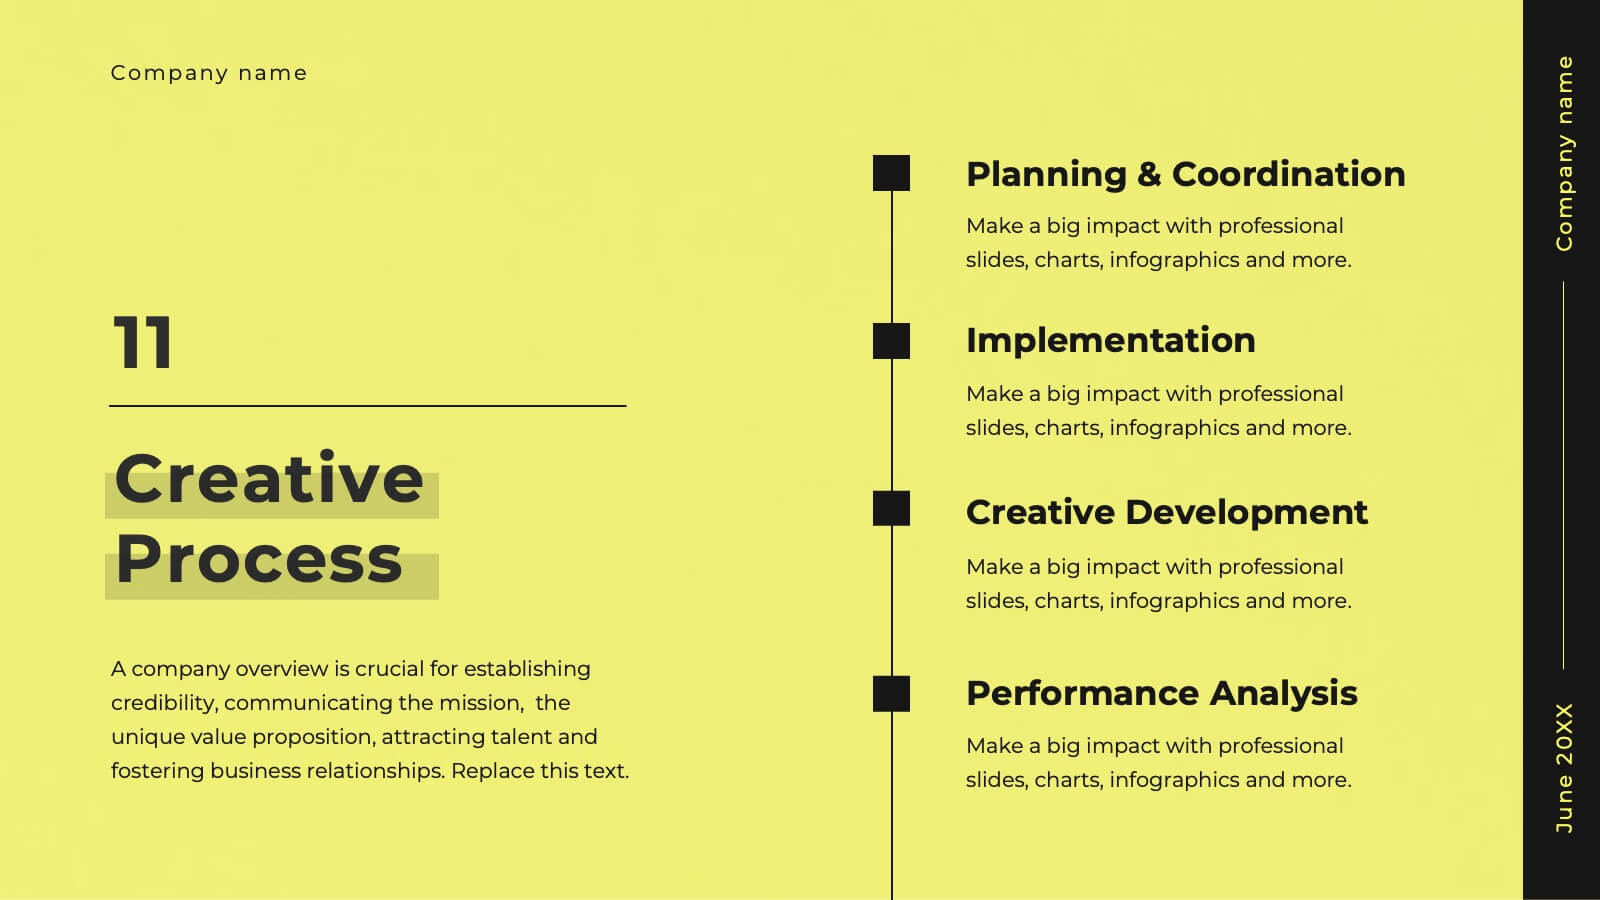
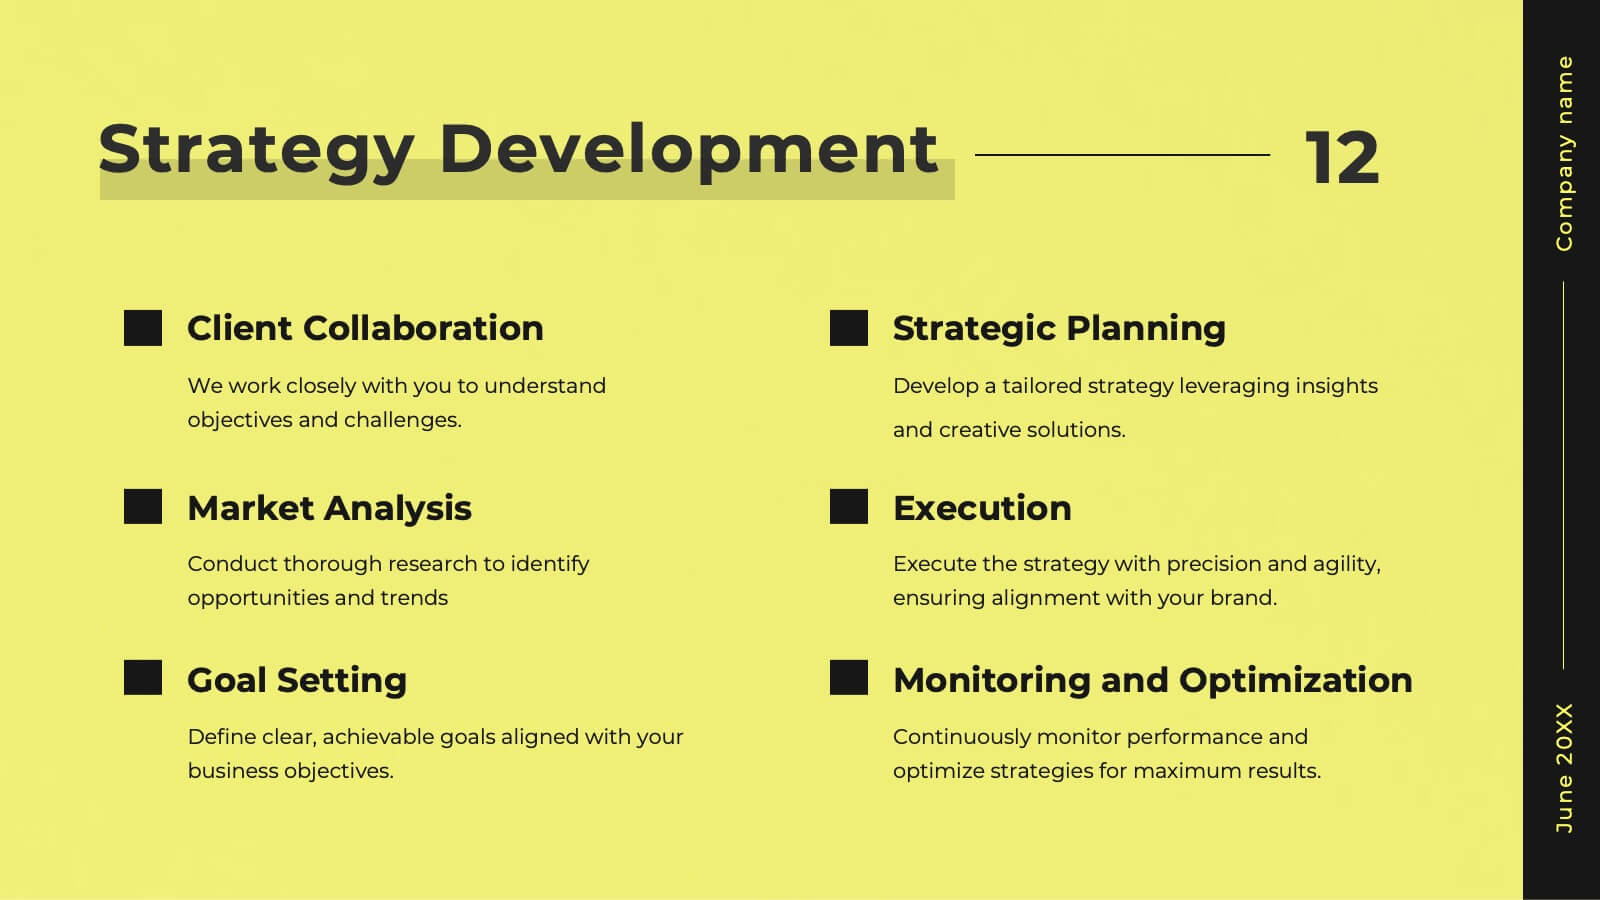
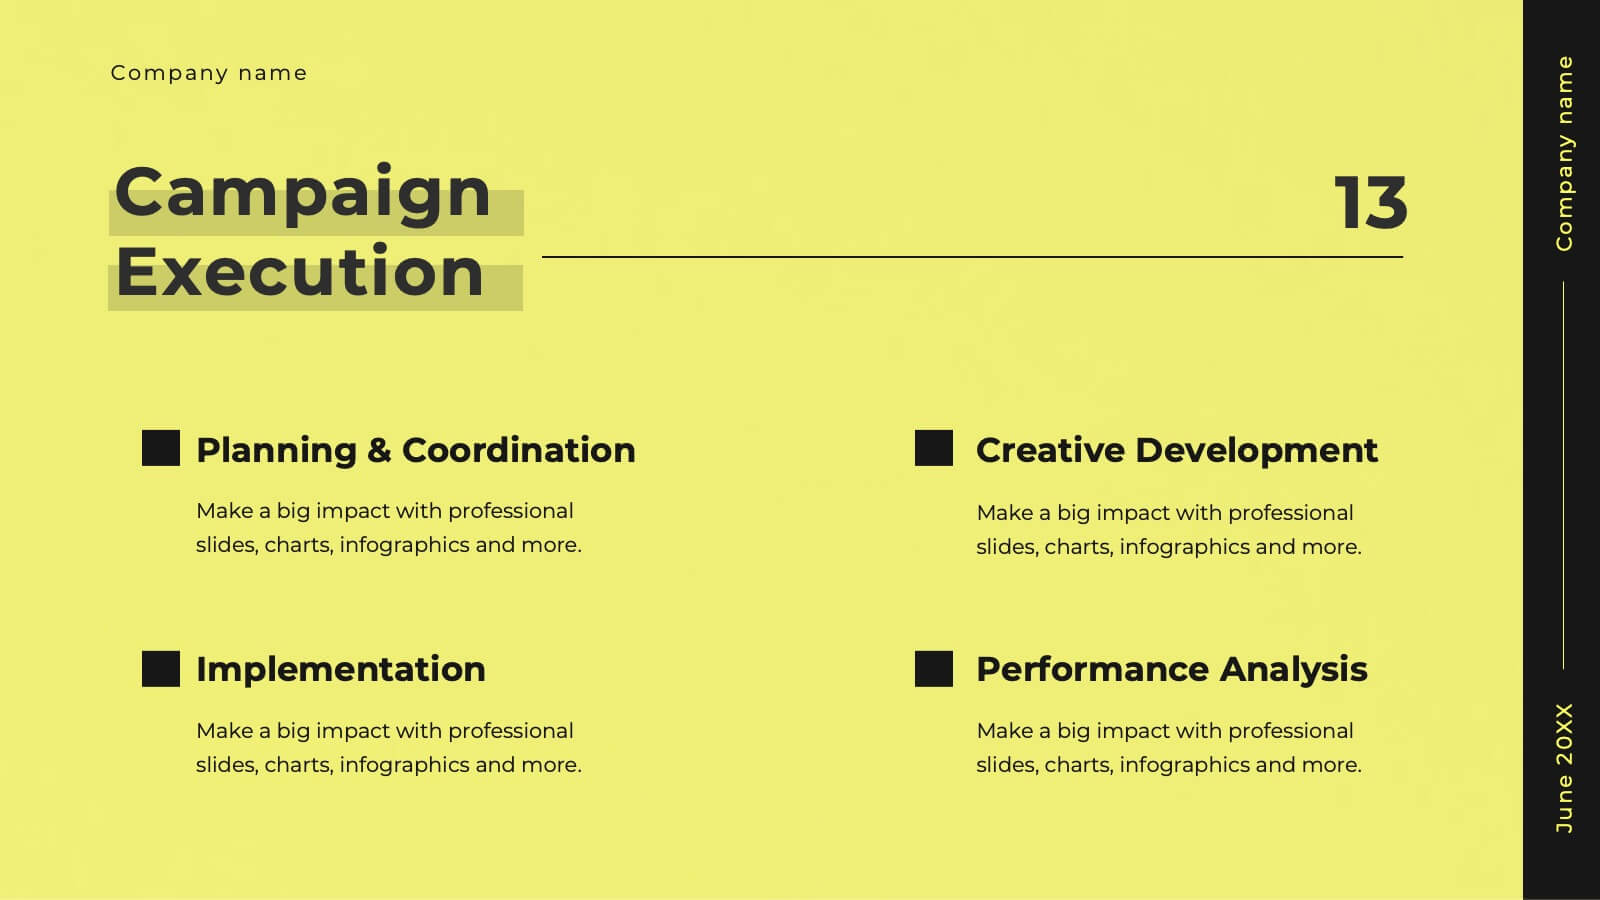
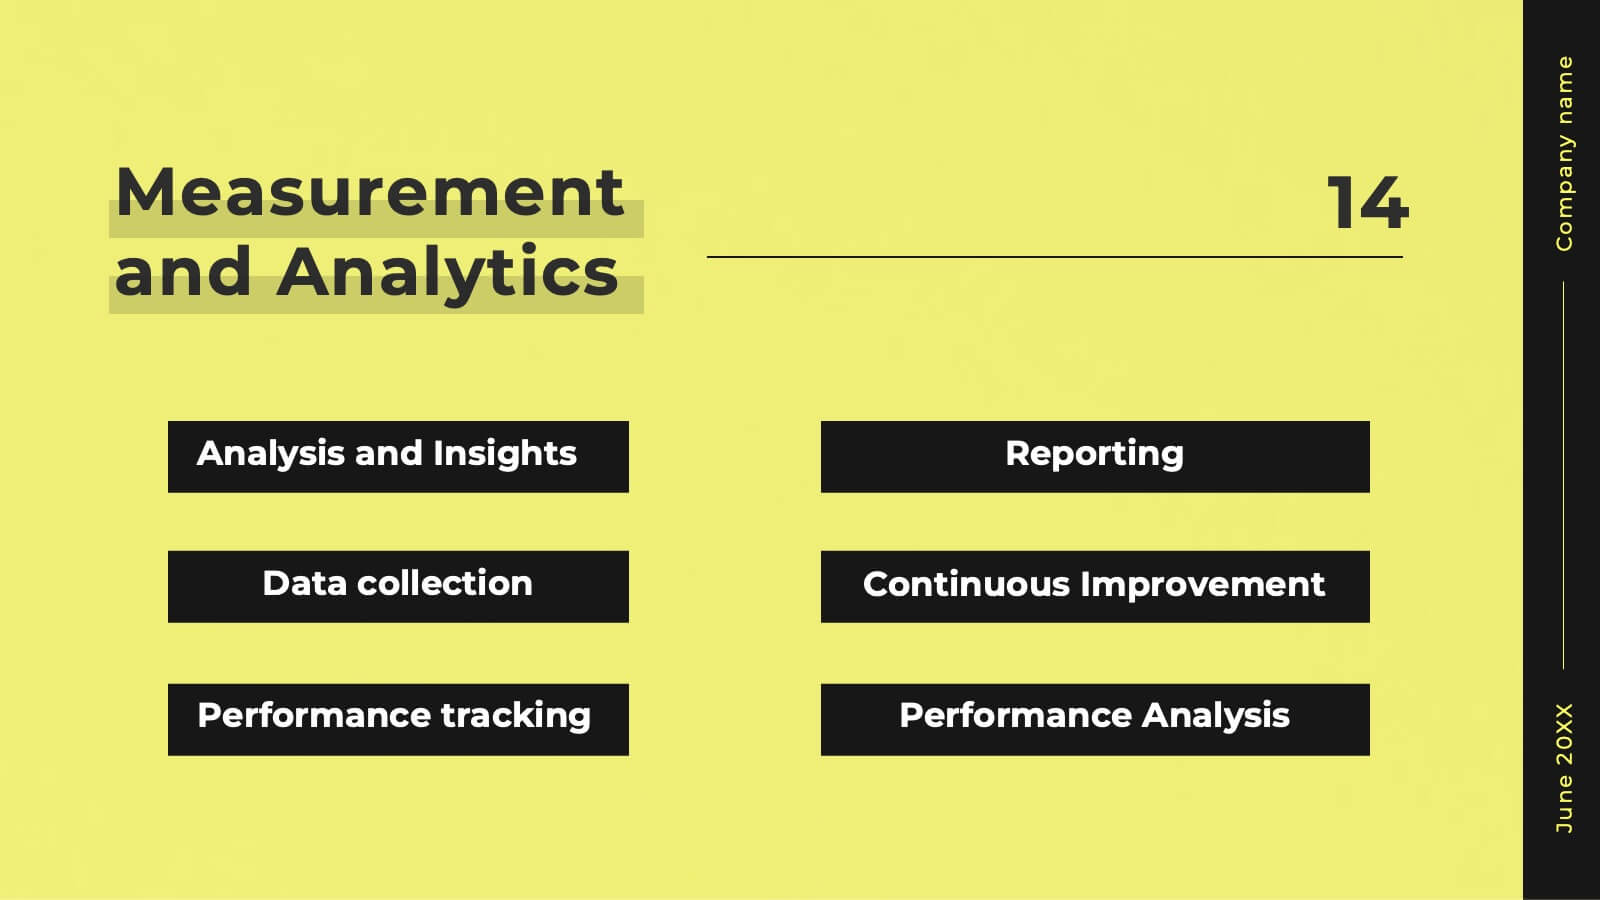
Glimmer Creative Agency Pitch Deck Presentation
Step up your game with this vibrant agency pitch deck template! Ideal for showcasing your services, client success stories, and strategic approach, it includes dynamic slides for market analysis and campaign execution. Engage potential clients with compelling visuals and well-organized content. Compatible with PowerPoint, Keynote, and Google Slides for a smooth presentation experience on any platform.


6 slides
Scientific Experiment Presentation Template Presentation
Showcase your research with clarity using this Scientific Experiment Presentation Template. Featuring lab-themed visuals like microscopes and molecular diagrams, it’s perfect for sharing hypotheses, procedures, and results. Ideal for science professionals and students, this editable deck works seamlessly with PowerPoint, Keynote, and Google Slides for compelling, educational presentations.


13 slides
Organizational Company Profile Presentation
Elevate your business overview with this straightforward Company Profile template. The opening slide announces the essence of your business, preparing the audience for a journey through your organizational landscape. Structured to highlight the key areas of your business, the template includes an 'About Us' section, laying out your mission and vision. Learn about the dedicated team behind the success with the 'Meet Our Team' slide, providing a personal touch to your corporate identity. Set clear, achievable goals with a slide dedicated to outlining your short-term and long-term objectives. Engage your audience with a 'Business Facts' slide that provides tangible insights into your company's performance. Finally, the 'Contact Us' slide offers a clear invitation for further dialogue, fostering potential partnerships. Ideal for those searching for a comprehensive yet accessible company presentation, this template is designed to convey your business strengths and opportunities effectively.