


Features
- 12 Unique Slides
- Fully editable and easy to edit in Microsoft Powerpoint, Keynote and Google Slides
- 16:9 widescreen layout
- Clean and professional designs
- Export to JPG, PDF or send by email


Do you have any questions?
Recommend


14 slides
Business Innovation and Idea Development Presentation
Drive Business Innovation and Idea Development with this dynamic and structured template, perfect for illustrating creative processes, strategic growth, and idea execution. Designed with a lightbulb-themed layout, this presentation helps break down complex concepts into clear, engaging sections. Fully customizable and compatible with PowerPoint, Keynote, and Google Slides, making it an essential tool for entrepreneurs, teams, and business leaders looking to present ideas with impact.


5 slides
Data-Driven Business Statistics
Visualize insights and percentages with this dynamic, data-driven infographic layout. Ideal for illustrating business progress, KPIs, and performance highlights. This editable template is fully compatible with PowerPoint, Keynote, and Google Slides, allowing you to tailor it effortlessly to fit your corporate style and messaging.

20 slides
Labyrinth Project Proposal Presentation
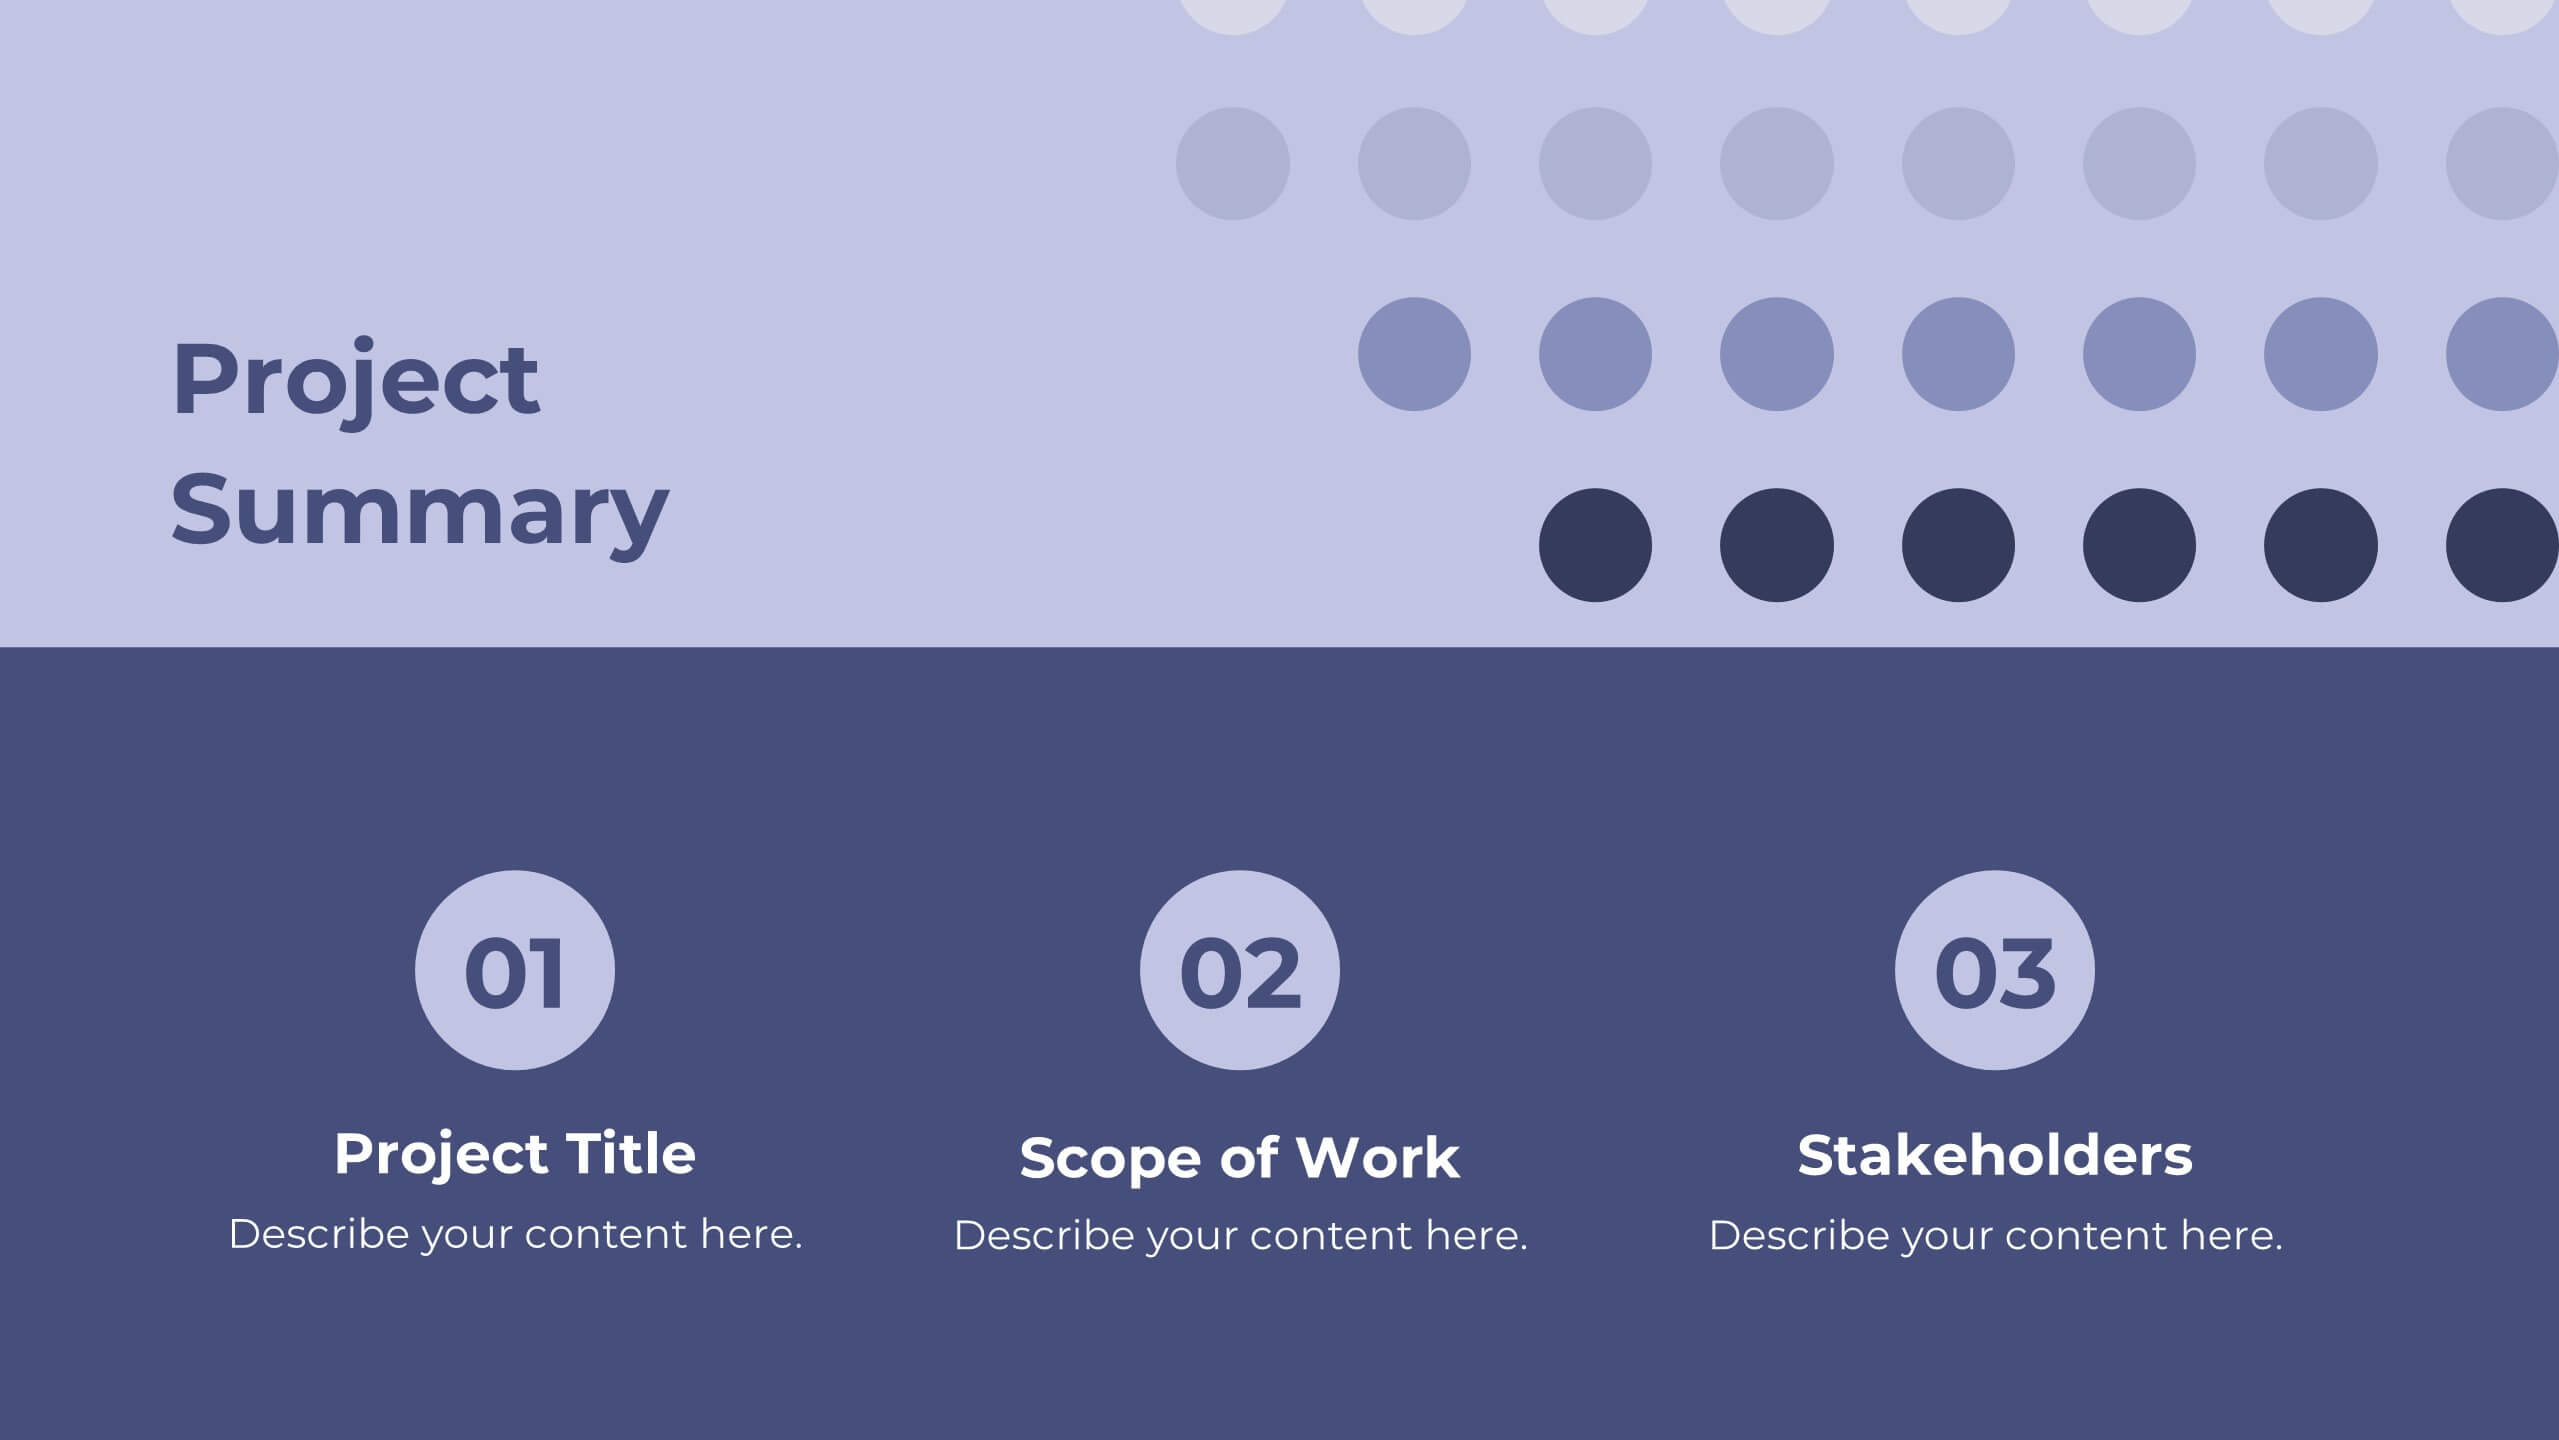
Present your project proposal with this clean and professional template! Covering sections such as objectives, scope of work, timeline, and budget breakdown, it helps you convey your plan clearly and effectively. Fully customizable and compatible with PowerPoint, Keynote, and Google Slides, it’s perfect for delivering impactful proposals to clients.


6 slides
Startup Business Launch Framework Presentation
Showcase your startup journey with the Startup Business Launch Framework Presentation. This step-by-step visual illustrates four key stages in your business launch process—from ideation to execution—using ascending blocks and modern icons. Ideal for founders, incubators, and pitch decks. Fully customizable in PowerPoint, Keynote, Google Slides, and Canva.


5 slides
Insurance Policy Structure Presentation
Add a touch of creativity to your financial reports with this clean and modern presentation design. Perfect for explaining coverage breakdowns, risk management strategies, or policy frameworks, it simplifies complex ideas through visuals. Fully editable and compatible with PowerPoint, Keynote, and Google Slides for a seamless presentation experience.


6 slides
Threat and Mitigation Bowtie Model
Break down complex threats and responses with the Threat and Mitigation Bowtie Model Presentation. This infographic visualizes the relationship between root causes, a central hazard event, and its potential consequences—alongside the controls that mitigate them. Clean, editable layouts and multiple visual states let you emphasize either side of the bowtie. Ideal for risk assessments, business continuity planning, and safety presentations. Compatible with PowerPoint, Keynote, and Google Slides.


7 slides
Performance Infographics Presentation Template
This Performance Infographic template was created with the intention of highlighting business and organizational performance in a visually appealing manner. You can create a stunning and captivating infographic that conveys your message effectively. This template was designed for professionals in organizations needing to share essential information about their organizations, goals and progress. This template is a high quality infographic presentation design made in 7 slides. This template can be used in any kind of business, school, or service and is compatible with powerpoint.


5 slides
Business Challenges and Solutions
Visualize your journey from problem to progress with this Business Challenges and Solutions infographic. Designed with a mountain path metaphor, it effectively communicates four key stages or issues alongside their respective solutions. Ideal for project timelines, team planning, or strategic overviews. Fully editable in PowerPoint, Keynote, and Google Slides.


6 slides
Canvas Breakdown for Startup Strategy Presentation
Break down your startup strategy with this streamlined canvas layout. Designed for clarity and flow, this slide presents six core components in a visually engaging format. Ideal for early-stage founders, innovation teams, and pitch decks, it simplifies complex business models into clear, actionable sections for strategic alignment and storytelling.


6 slides
Business Challenges and Solutions Presentation
Address challenges with strategic solutions using this Business Challenges and Solutions template. Featuring a clear side-by-side layout, this design helps visualize business obstacles and their corresponding solutions for effective decision-making. Perfect for problem-solving discussions, strategy meetings, and brainstorming sessions, this template ensures your content remains structured and impactful. Fully customizable for PowerPoint, Keynote, and Google Slides.


10 slides
Agile Project Status Review Presentation
Streamline your Agile methodologies with our "Agile Project Status Review" presentation templates. Designed to enhance visual communication, these templates help you effectively display project phases from start to finish. Ideal for dynamic project management, they are compatible with PowerPoint, Keynote, and Google Slides, ensuring seamless integration into your workflow.


5 slides
Data Entry Infographics
Dive into the intricate world of information management with our data entry infographics. Cast in shades of blue, warm orange, and an array of inviting colors, this vertically styled template is a boon for business analysts, administrative assistants, and database managers. The design, punctuated with relevant graphics, icons, and strategic image placeholders, simplifies complex data narratives. It serves as a visual anchor, ensuring information accuracy and efficiency. This essential tool is instrumental for professionals striving to maintain data integrity while elucidating critical entry processes, thereby fostering a streamlined workflow.


5 slides
Team Roles and Responsibilities Matrix Presentation
Define accountability with this Team Roles and Responsibilities Matrix. Clearly map tasks to team members using RACI codes (Responsible, Accountable, Consulted, Informed). Ideal for project planning, cross-functional alignment, and team coordination. Fully editable and compatible with PowerPoint, Keynote, and Google Slides to suit any workflow or team structure.


5 slides
Investment and Wealth Planning Presentation
Visualize your financial strategy with this creative piggy bank diagram layout. Each quadrant highlights a different element of your investment plan—from savings and risk management to asset growth and long-term wealth goals. Perfect for financial advisors, business consultants, or educators. Fully editable in PowerPoint, Keynote, and Google Slides for easy customization


5 slides
Mission and Values Alignment
Align your purpose with progress using this clean, directional layout that maps your mission, core values, and strategic focus in a unified flow. Perfect for internal briefings or culture decks, this slide visually connects each value to your organizational journey. Fully compatible with PowerPoint, Keynote, and Google Slides.


5 slides
Division List Infographics
A Division List is a list of items or numbers that have been divided or categorized based on a certain criterion or set of criteria. These Infographics are visual representation of data that allows you to divide and categorize information into smaller groups or categories. These can be used to display any kind of data that requires grouping, such as military ranks, airlines, religion or virus symptoms. This template is designed using bold colors, various shapes, and icons to make the data more engaging and visually appealing. These are perfect for business presentations, marketing campaigns, and educational materials.


7 slides
Corporate Sustainability Management
Visualize your sustainability priorities with this hexagon-based framework slide, designed to highlight areas like environmental impact, health, welfare, and ethical governance. Ideal for CSR reporting, ESG strategy sessions, or internal sustainability initiatives. Easy to customize in PowerPoint, Keynote, and Google Slides.