


Features
- 5 Unique Slides
- Fully editable and easy to edit in Microsoft Powerpoint, Keynote and Google Slides
- 16:9 widescreen layout
- Clean and professional designs
- Export to JPG, PDF or send by email


Do you have any questions?
Recommend


6 slides
Circular Business Wheel Model Presentation
Break down your strategy into dynamic segments with this Circular Business Wheel Model. This layout is ideal for showcasing interconnected business areas like sustainability, innovation, monetization, and market appeal. Perfect for strategy decks, business planning, and growth presentations. Compatible with PowerPoint, Keynote, and Google Slides—fully editable for your needs.


7 slides
Short Term Goals Infographic Presentation
Short-term Goals are important because they provide a clear focus and direction for individuals or organizations to achieve their long-term objectives. Get started on your goals in no time with this template. It is professional, clean and has everything you need to create a presentation. It's a good choice for career advancement and pitches. This template is designed to help your audience visualize the impact of your goals. Use this template as a base to brainstorm your vision and objectives with your team. The goal-oriented design will bring awareness and create excitement about your goals.


7 slides
Supply Chain Stock Infographic Presentation
A Supply Chain Infographic is a visual representation of information related to the flow of goods and services from suppliers to customers. This template is perfect for businesses and organizations involved in supply chain management, logistics, and procurement who want to communicate complex information in a clear way. This infographic can help engage stakeholders, promote understanding of supply chain-related issues, and drive positive change in the industry. Compatible with Powerpoint, Keynote, and Google Slides this template can be easily edited with different colors, fonts, and text.


10 slides
Brand Loyalty and Customer Retention Presentation
Strengthen your brand’s relationship with your audience using the "Brand Loyalty and Customer Retention" presentation template. This design effectively illustrates how strong branding strategies enhance customer loyalty and retention rates. Ideal for marketers and business strategists, this template is fully compatible with PowerPoint, Keynote, and Google Slides, making it perfect for presentations aimed at improving customer engagement and business growth.


10 slides
Brainstorming and Creative Idea Generation Presentation
Unlock Brainstorming and Creative Idea Generation with this visually engaging template designed to help teams capture, refine, and present ideas effectively. Featuring gear-themed graphics, color-coded sections, and structured placeholders, this template is ideal for workshops, innovation meetings, and design thinking sessions. Fully customizable and compatible with PowerPoint, Keynote, and Google Slides, ensuring seamless integration into your workflow.


6 slides
Investment Portfolio Breakdown Presentation
Give your financial insights a clean, confident voice with a layout designed to make complex data feel simple and strategic. This presentation helps you compare allocations, highlight key performance areas, and communicate investment decisions with clarity and ease. Fully editable and compatible with PowerPoint, Keynote, and Google Slides.


7 slides
Business Model Canvas Value Infographic
The business model canvas is a strategic management tool that provides a visual framework for developing, describing, and analyzing a business model. Prepare for a dynamic voyage through business success with our business model canvas value infographic. This is not just a blueprint; it's a vivid map to unlock the value potential in your business model. Navigate through the core elements, envision your venture, and redefine success. Compatible with Powerpoint, Keynote, and Google Slides. Showcase how a strong customer relationships is key. With this infographic illustrate the strategies to keep your audience coming back for more!


22 slides
Marketing Research Presentation
Streamline your data presentation with our Marketing Research template. It includes comprehensive slides on research objectives, methodology, data analysis, and key findings. Ideal for academic and professional settings, this template is compatible with PowerPoint, Keynote, and Google Slides, enhancing your research presentations with precision and professionalism.


21 slides
Runewood Marketing Proposal Template Presentation
The Marketing Proposal Presentation Template provides 21 slides covering core aspects like market presence, growth strategies, and financial highlights. Perfect for agencies and businesses to showcase their marketing strategies effectively. Fully customizable and compatible with PowerPoint, Keynote, and Google Slides.


6 slides
Strategic Business Case Study
Present detailed business case analyses with this layered castle-style layout, ideal for step-by-step storytelling. Each section visually represents a different stage or insight, helping you build a clear and convincing narrative. Fully editable and compatible with PowerPoint, Keynote, and Google Slides.


4 slides
Global Business Distribution Layout Presentation
Visualize your company’s international footprint with this Global Business Distribution Layout. Perfect for showcasing market reach, branch networks, or regional performance. Features a clean world map design with customizable highlight zones. Fully editable in PowerPoint, Keynote, and Google Slides—ideal for corporate overviews, investor decks, and business expansion presentations.


7 slides
Title Comparison Infographic
This collection of slides presents a visually cohesive and professionally designed set of templates, perfect for a variety of business presentations. The color scheme of orange and white is consistently applied across slides, enhancing visual appeal and thematic unity. These designs cater to multiple business needs, including strategic planning, project proposals, and company introductions. Particularly notable is the use of clear, concise layouts that highlight key topics such as the "Business Model Canvas," ensuring that complex ideas are communicated effectively. Each slide is crafted to maintain viewer interest and deliver content in a digestible format, making them ideal for detailed corporate presentations and briefings. This selection also includes slides tailored for 'About Us' sections and planning frameworks, which are essential for businesses to introduce their core values, objectives, and strategic directions. These slides are an excellent resource for any professional looking to present ideas in a clear, organized, and visually attractive manner during meetings or in digital content.


5 slides
Pets Paradise Infographics
"Pets Paradise" is used to refer to a place or concept that revolves around providing a perfect and delightful environment for pets. These vertical infographics are designed to celebrate the wonderful world of pets and provide essential information for pet owners and enthusiasts. This infographic template covers a wide range of topics related to pets, showcasing their impact on human lives and the importance of responsible pet ownership. The templates present fascinating statistics about pet ownership worldwide. These infographics are fully customizable, allowing users to modify colors, fonts, and layout to align with their personal preferences.

22 slides
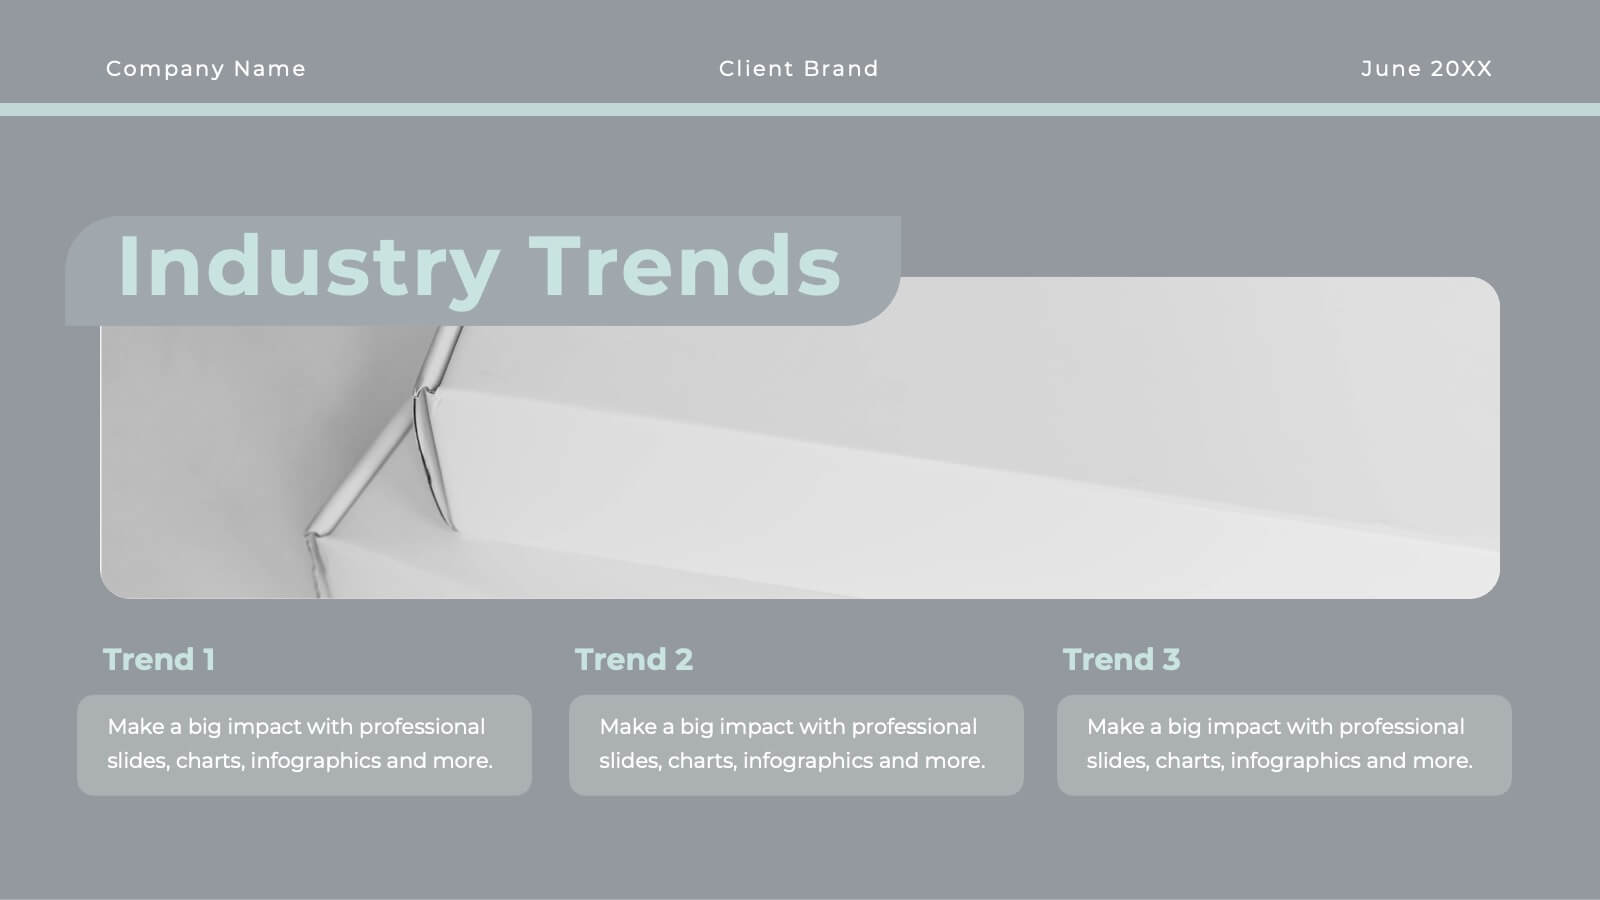
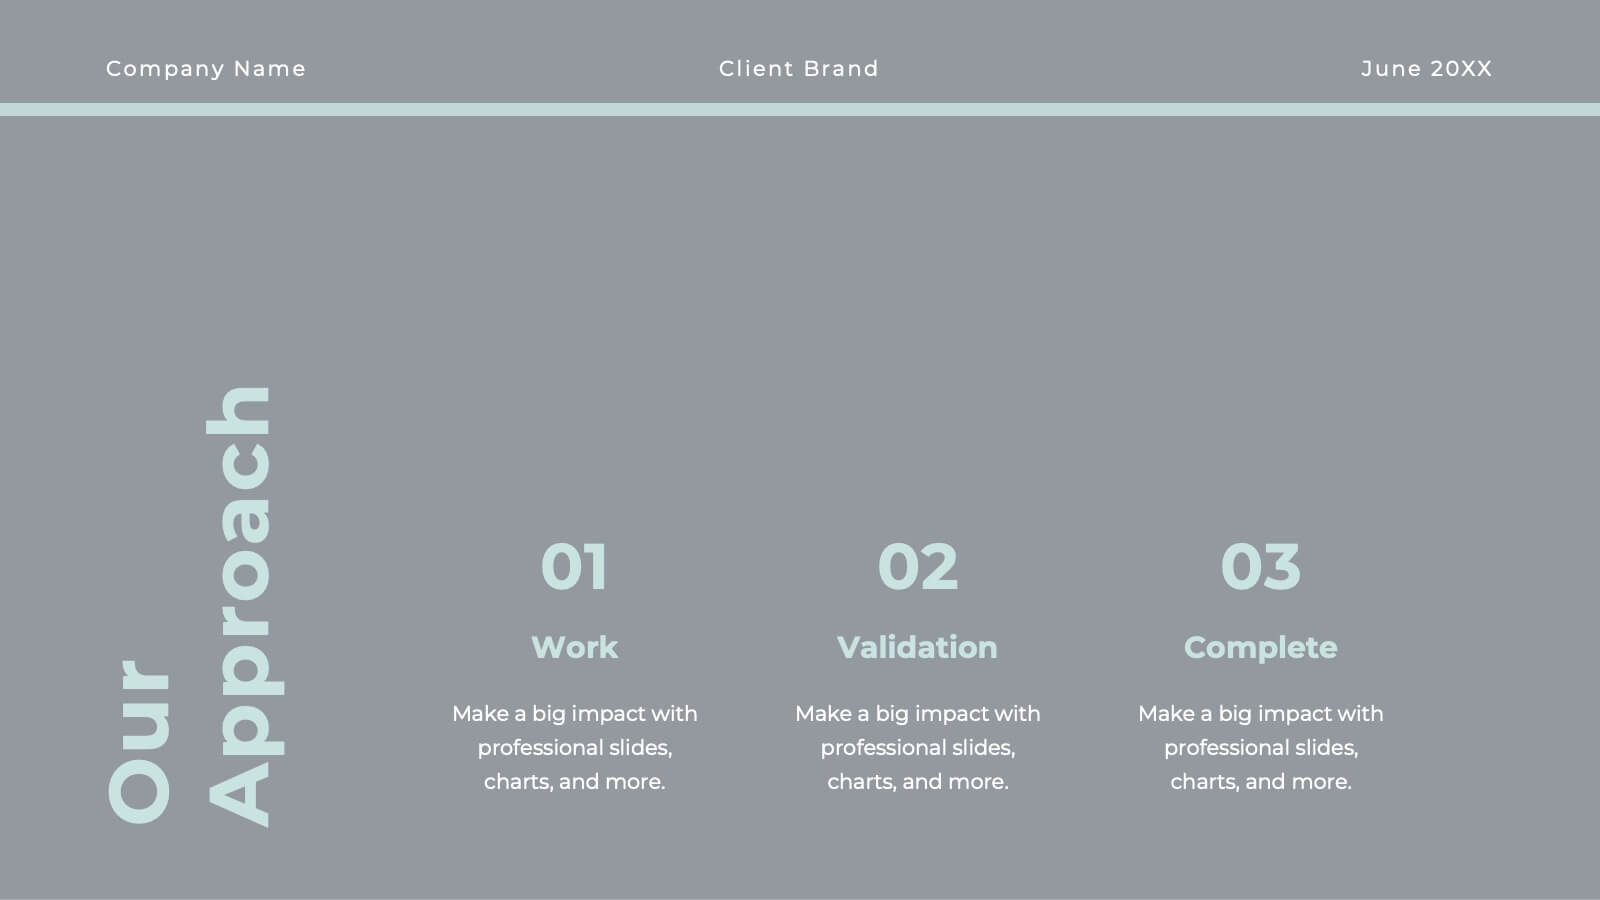
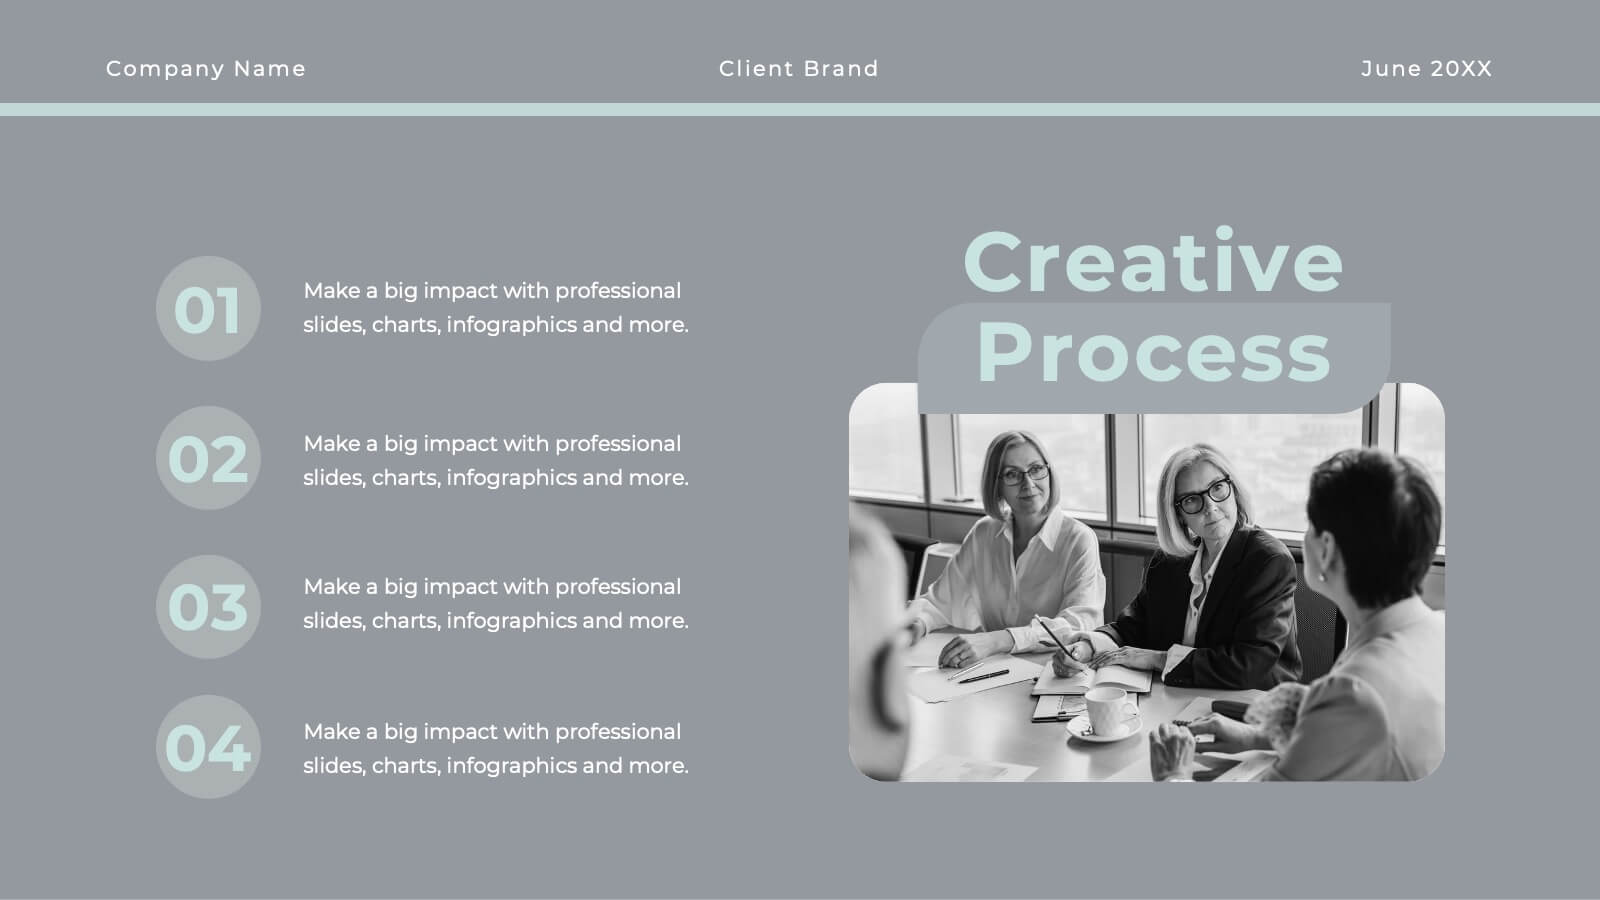
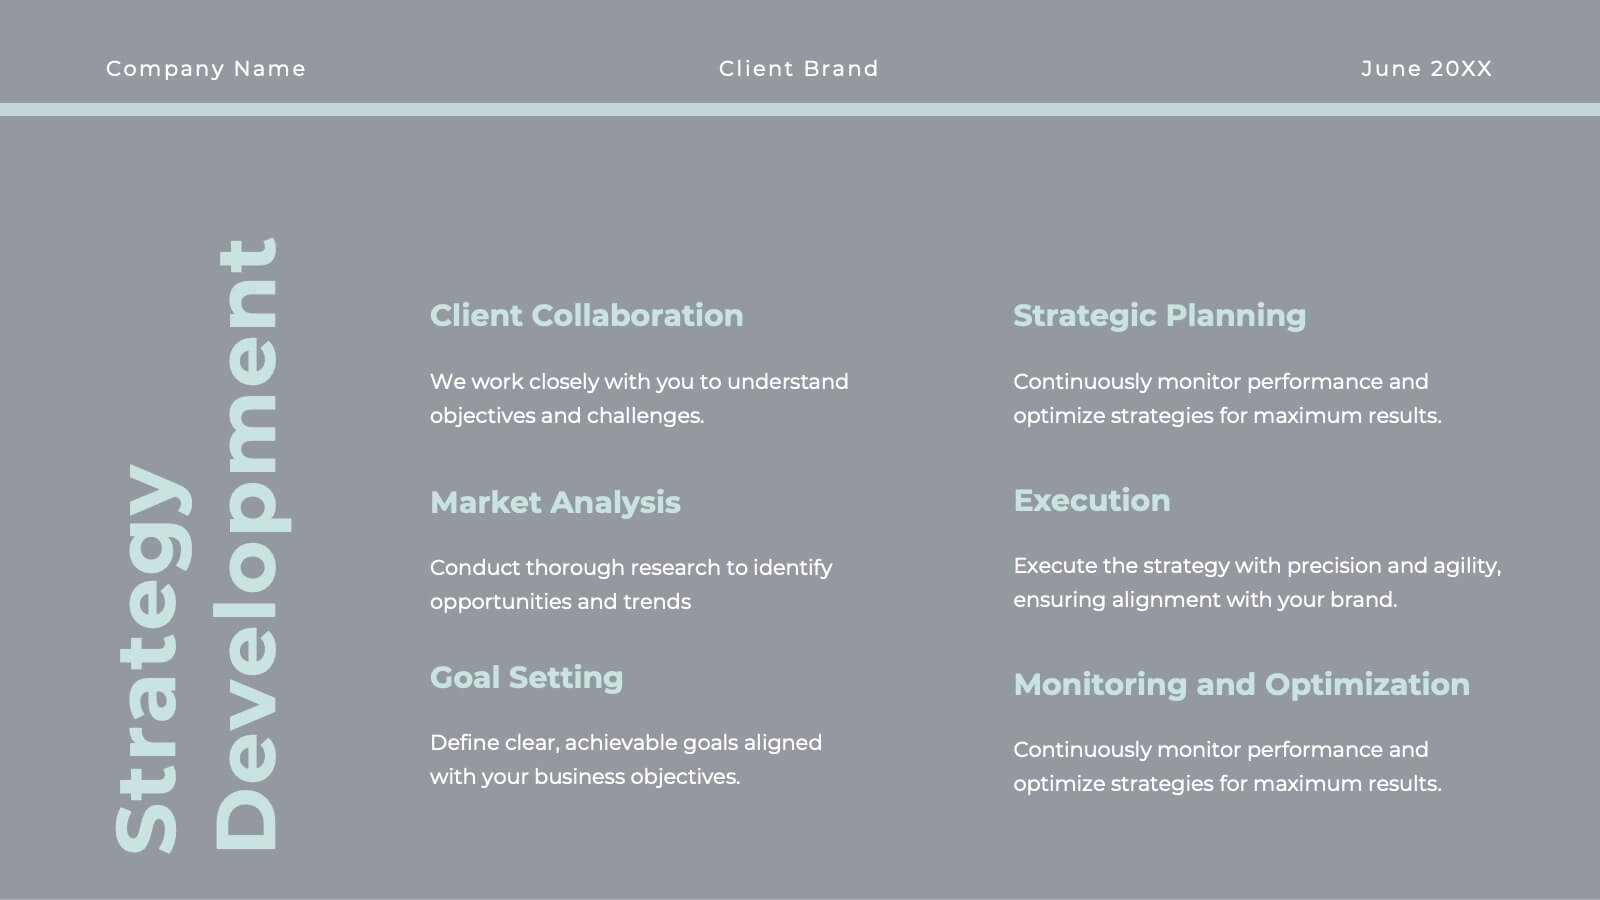
Whirlwind Advertising Agency Proposal Presentation
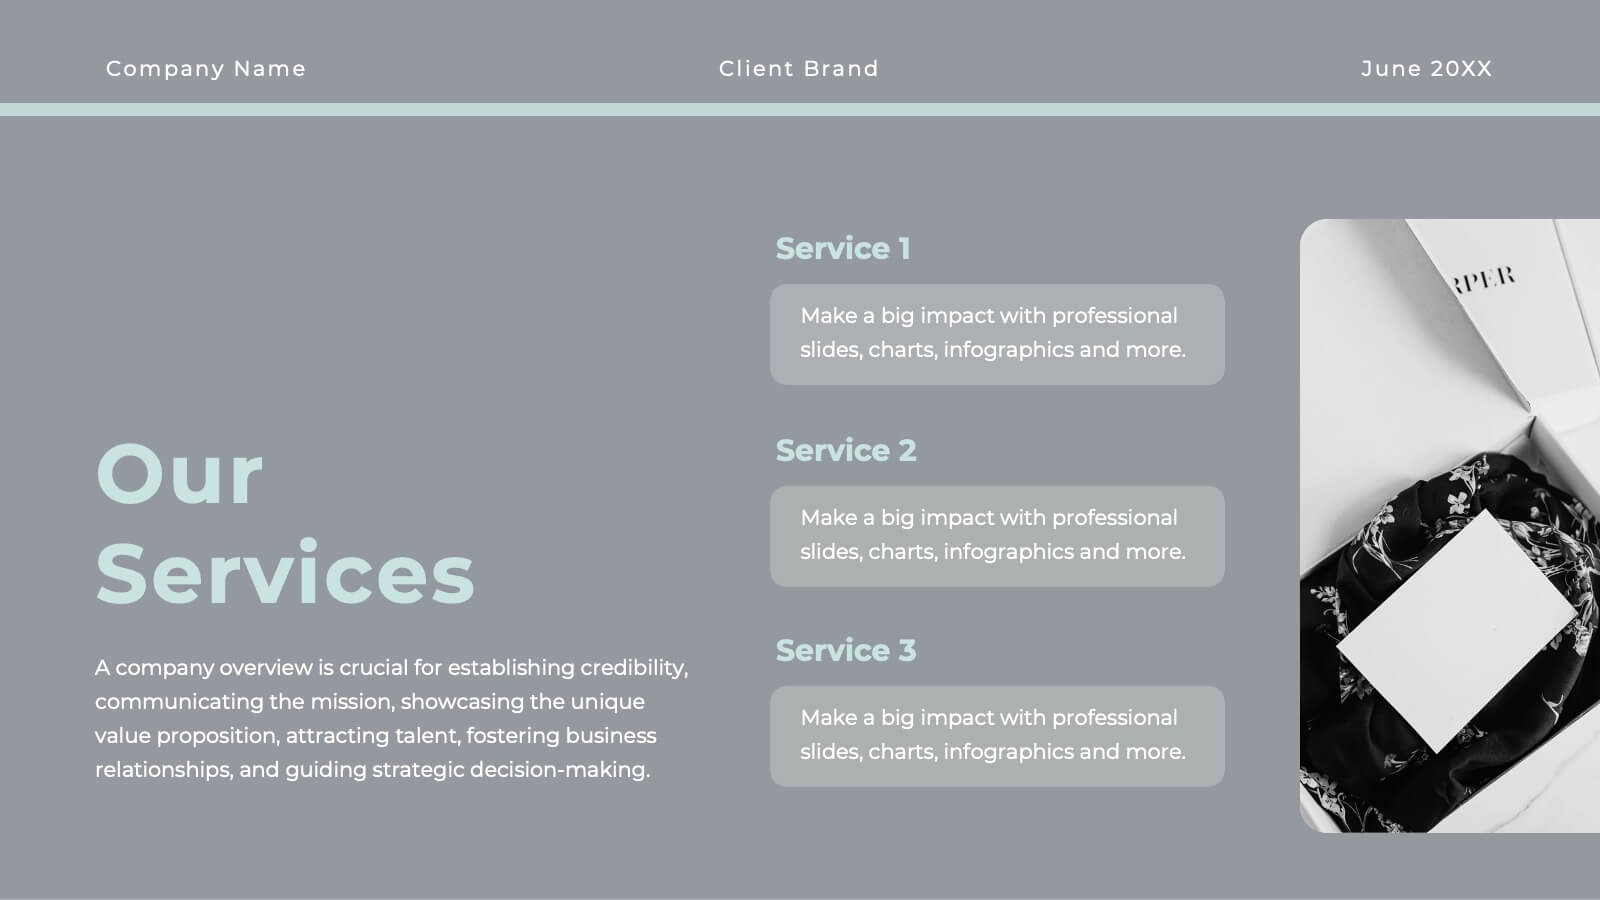
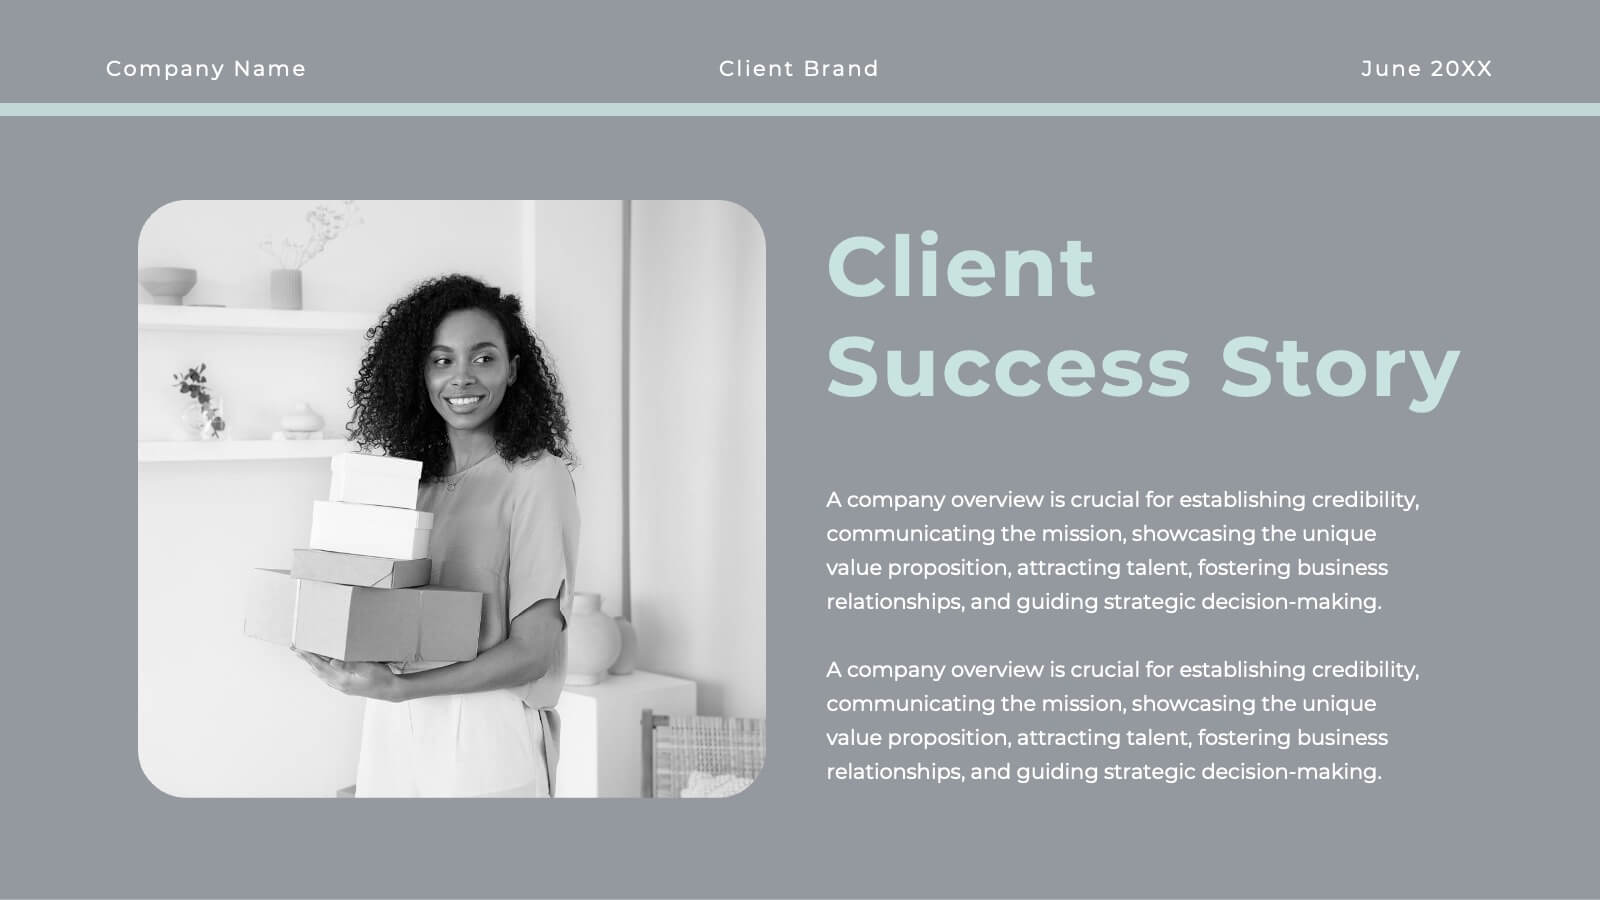
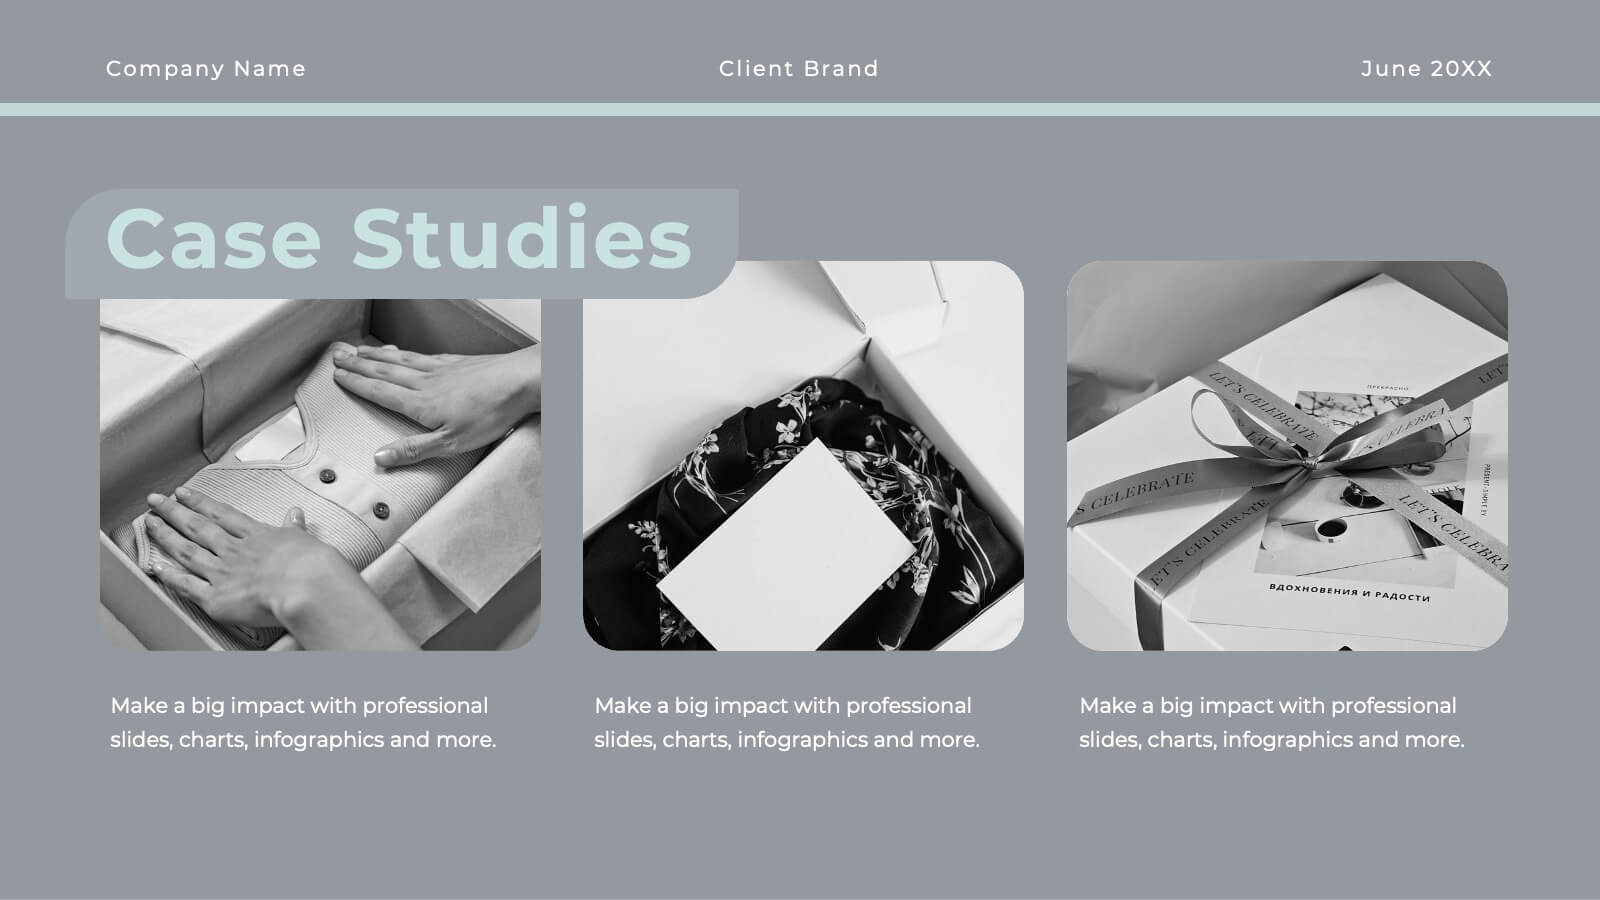
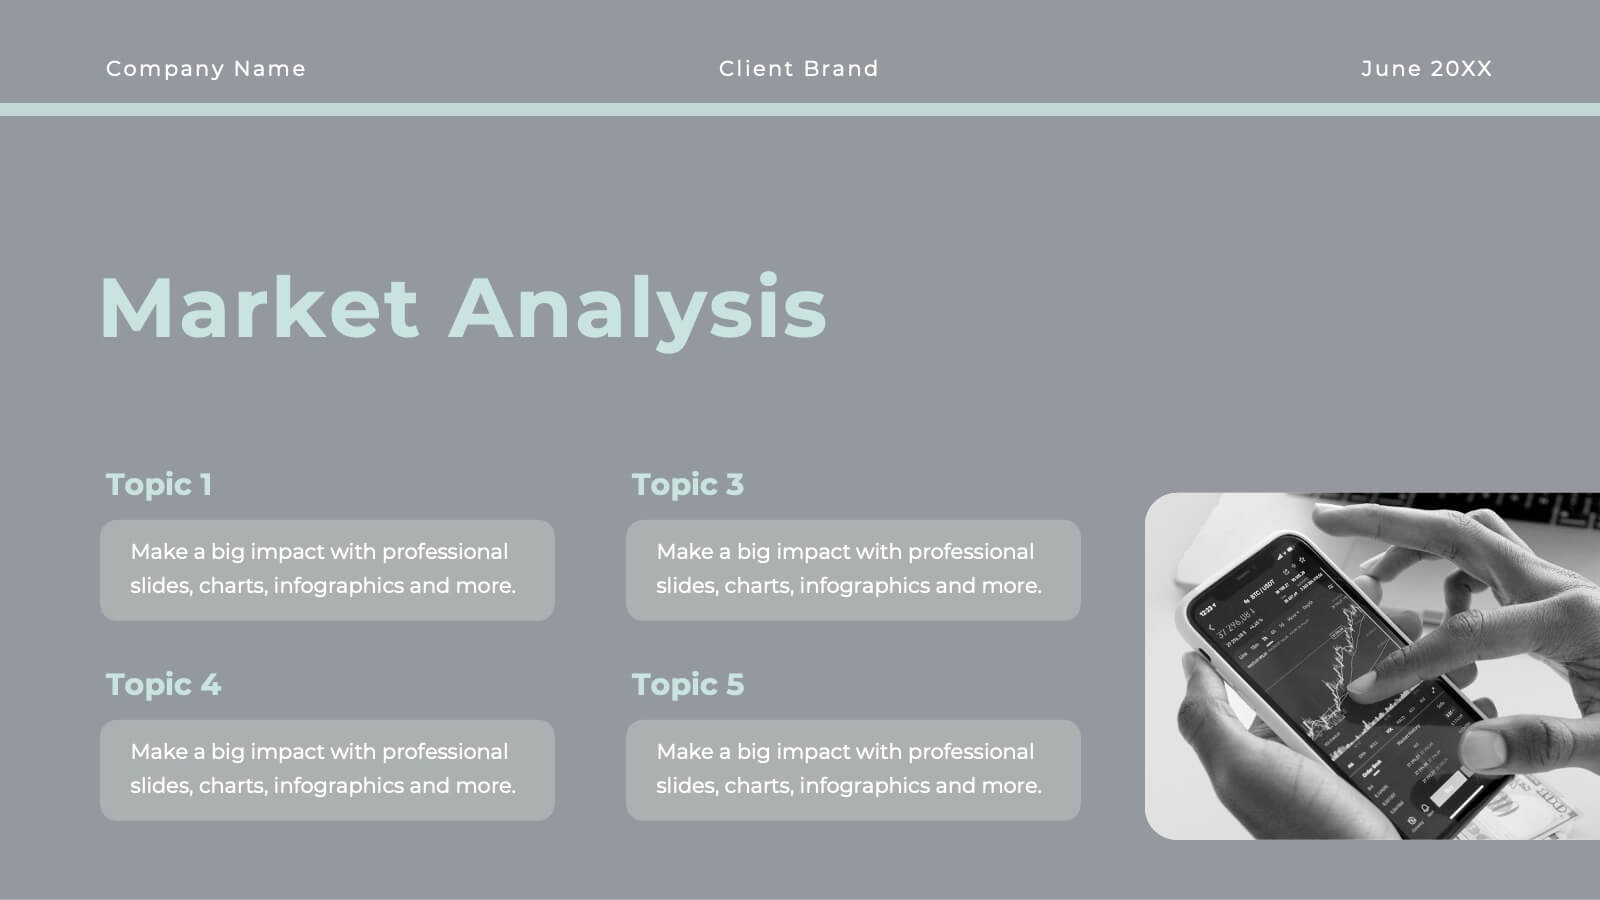
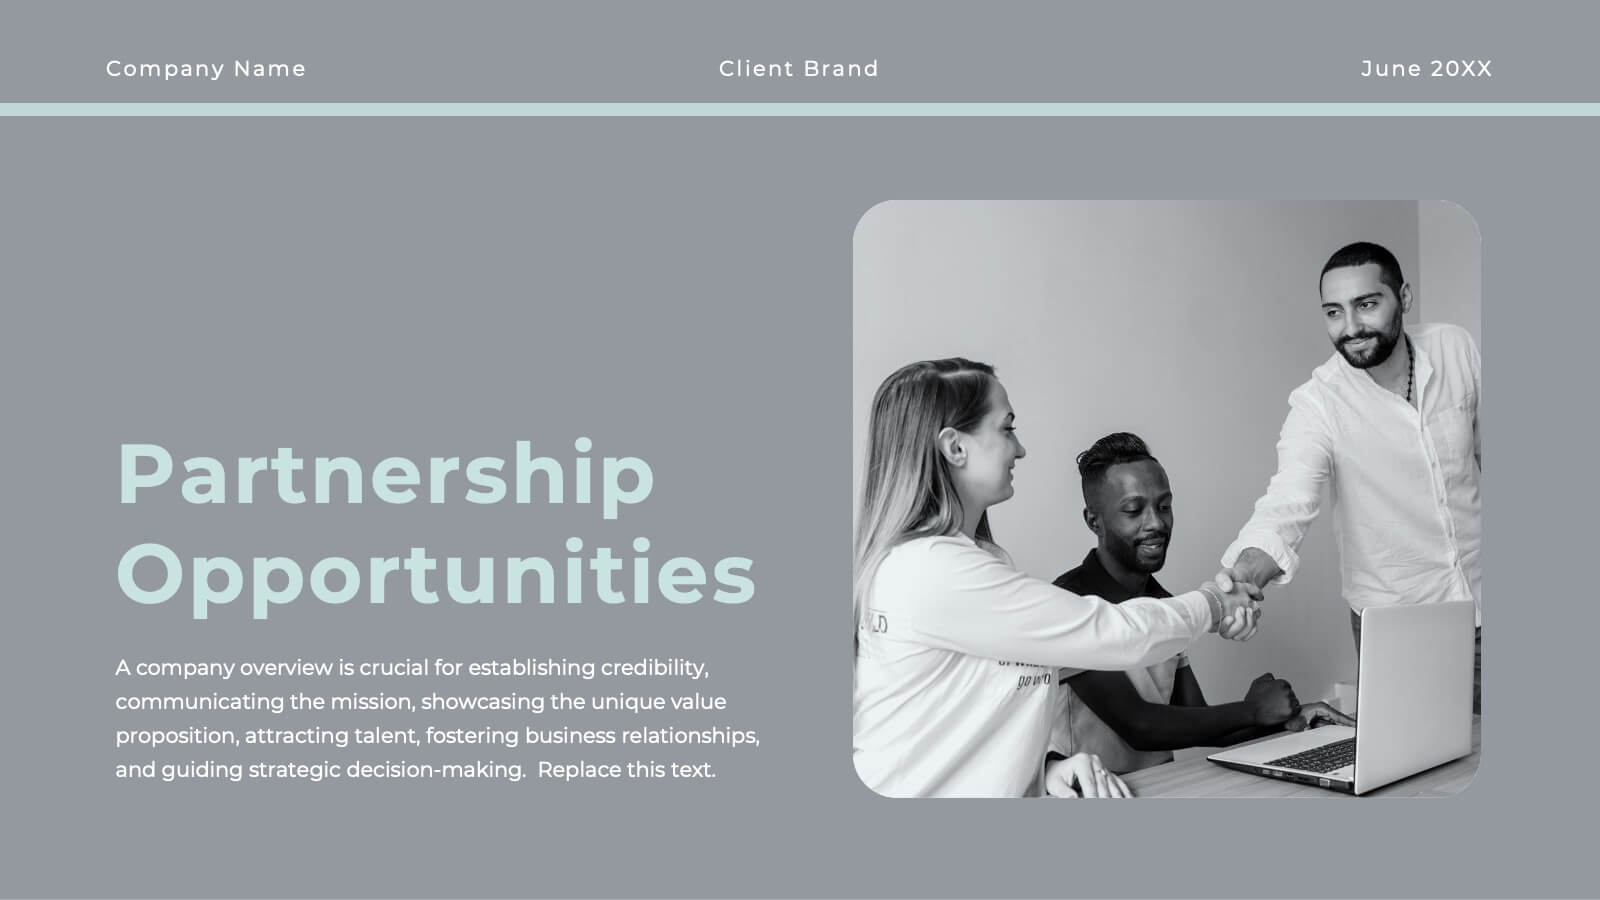
Get ready to elevate your agency’s game with a proposal template that’s as polished as your services! This sleek and sophisticated design is crafted to make a lasting impression on your clients and partners. From introducing your team’s expertise to showcasing successful case studies, every slide is meticulously designed to reflect professionalism and creativity. The clean, modern layout helps you present your market analysis, industry trends, and strategic approach with clarity and impact. With dedicated sections for client testimonials, campaign development, and partnership opportunities, this template ensures your agency’s value proposition is communicated with confidence and style. Perfectly adaptable to PowerPoint, Keynote, and Google Slides, this proposal template is your go-to tool for sealing deals and building lasting relationships. Your agency’s vision and mission will shine through in a presentation that’s both powerful and persuasive, making your proposals truly unforgettable!


26 slides
Personal Finance Management Presentation
Dive into the essentials of personal finance management with this comprehensive presentation template designed to empower individuals to achieve financial stability and growth. The template begins with an introduction that outlines the importance of effective financial management and the objectives of the presentation. It serves as a roadmap for those seeking to understand and enhance their financial literacy. In the main content section, the template offers detailed slides covering a variety of topics crucial for managing personal finances, such as budgeting strategies, savings plans, investment options, and debt management. Each slide is designed with clarity and focus, using engaging visuals and concise bullet points to explain complex financial concepts in an accessible manner. Features like comparison slides, process infographics, and timeline visuals help illustrate the progression and impact of good financial practices over time. The final segment ensures the presentation is practical for all users by confirming compatibility with popular platforms like PowerPoint, Google Slides, and Keynote. This ensures that the template can be easily accessed and utilized across different devices and settings, making it a versatile tool for individuals, financial advisors, or educational workshops looking to promote sound financial habits.


7 slides
Budget Forecasting Spreadsheet Infographic
Step into the strategic realm of budget forecasting with our detailed infographic. Cast in the reliability of blue, the vibrancy of orange, and the optimism of yellow, our template is a beacon of financial foresight. Equipped with precise infographics, intuitive icons, and adaptable image placeholders, it transforms financial data into a predictive narrative. Flawlessly tailored for Powerpoint, Keynote, or Google Slides. An essential tool for financial analysts, business strategists, accountants, or any professional navigating the future financial terrains of their organization. Forecast with confidence; let every slide be a roadmap to financial prudence.


4 slides
Simple RACI Matrix Overview Presentation
Bring instant clarity to every role with a clean, puzzle-style layout designed to map responsibilities without confusion. This presentation helps teams outline who leads, supports, approves, and stays informed in any project, turning tasks into a simple visual grid. Fully editable and compatible with PowerPoint, Keynote, and Google Slides.