


Features
- 5 Unique slides
- Fully editable and easy to edit in Microsoft Powerpoint, Keynote and Google Slides
- 16:9 widescreen layout
- Clean and professional designs
- Export to JPG, PDF or send by email


Do you have any questions?
Recommend


4 slides
Organizational Mission Strategy Presentation
Stand tall with this mountain-themed layout—perfect for showcasing the pillars of your organizational mission strategy. Each peak represents a strategic objective or core value, guiding your team toward a shared goal. Fully compatible with PowerPoint, Keynote, and Google Slides.


10 slides
Cloud Computing IT Architecture
Showcase your cloud infrastructure with this layered circular diagram designed to highlight core services, storage, and computing components. Ideal for IT teams, SaaS providers, or tech consultants, these slides simplify complex cloud systems into 5 customizable sections. Fully editable in PowerPoint, Keynote, and Google Slides.


22 slides
Zephyr Product Launch Pitch Deck Presentation
Step into the spotlight with this modern and captivating product launch pitch deck! Designed to showcase your ideas with clarity, it covers every key aspect from market opportunities to financials. Impress investors with strategic insights and sleek visuals that guide them through your business plan. Perfect for PowerPoint, Keynote, and Google Slides!
20 slides
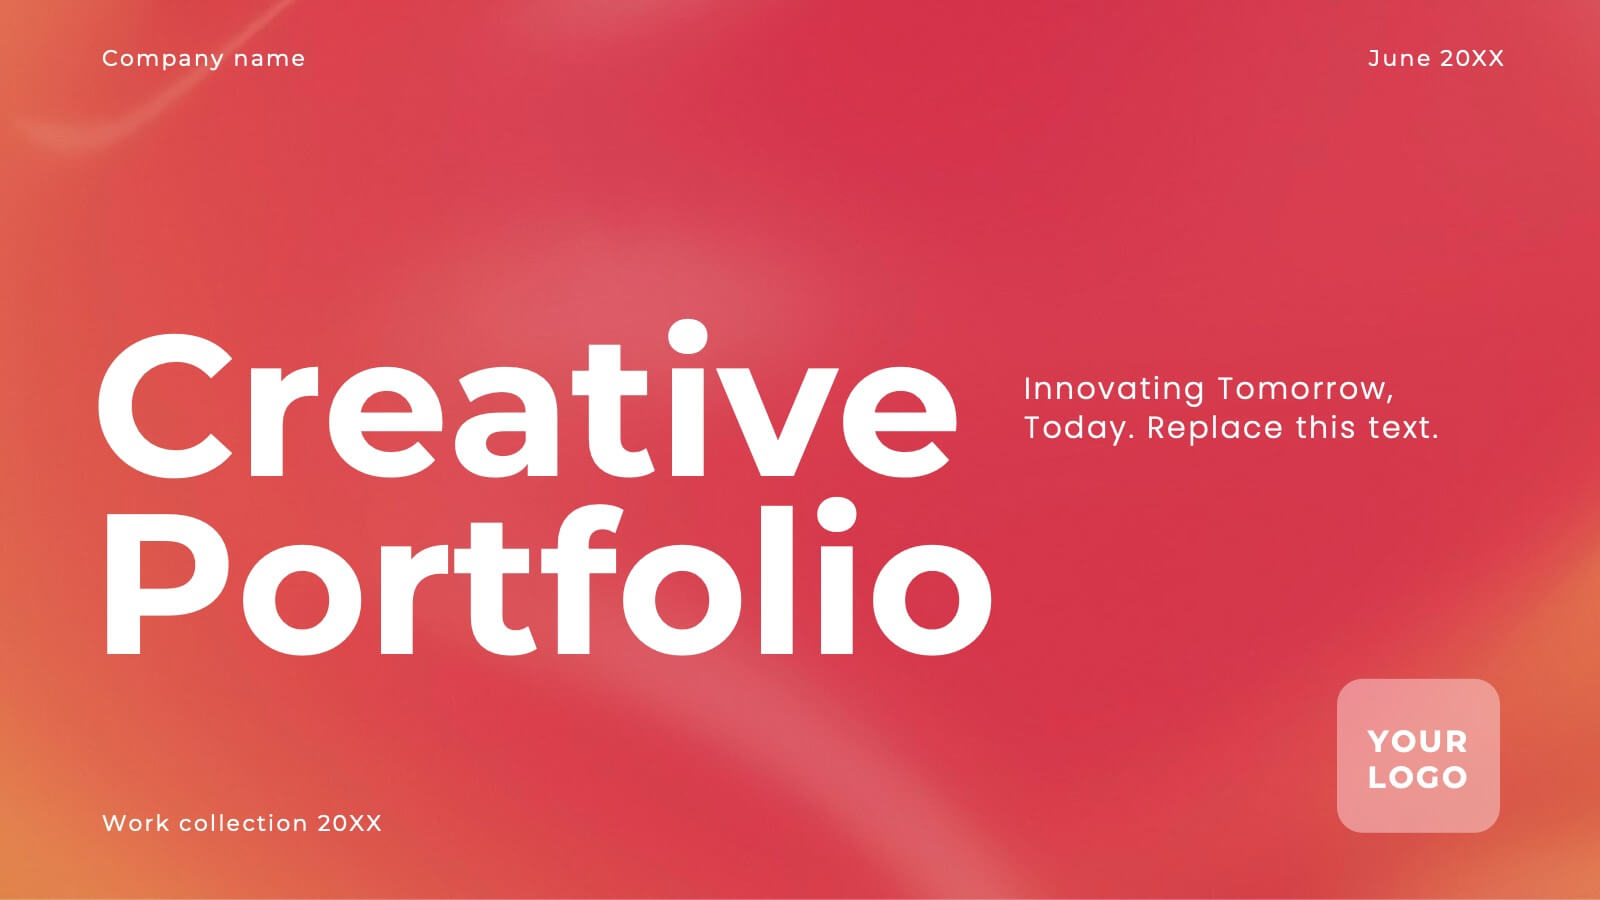
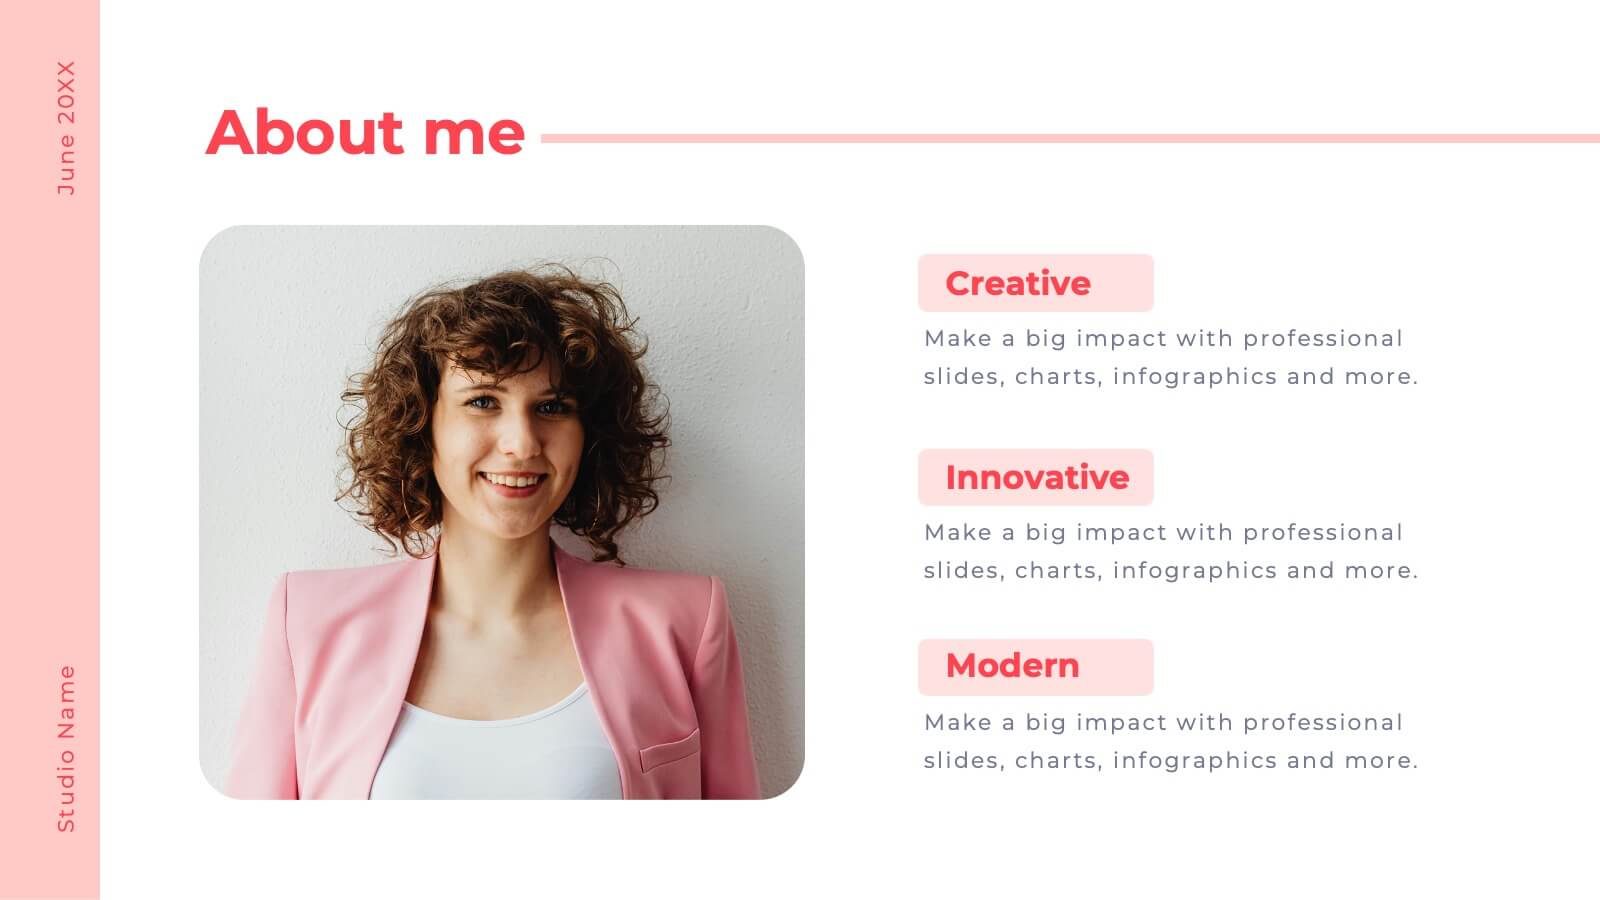
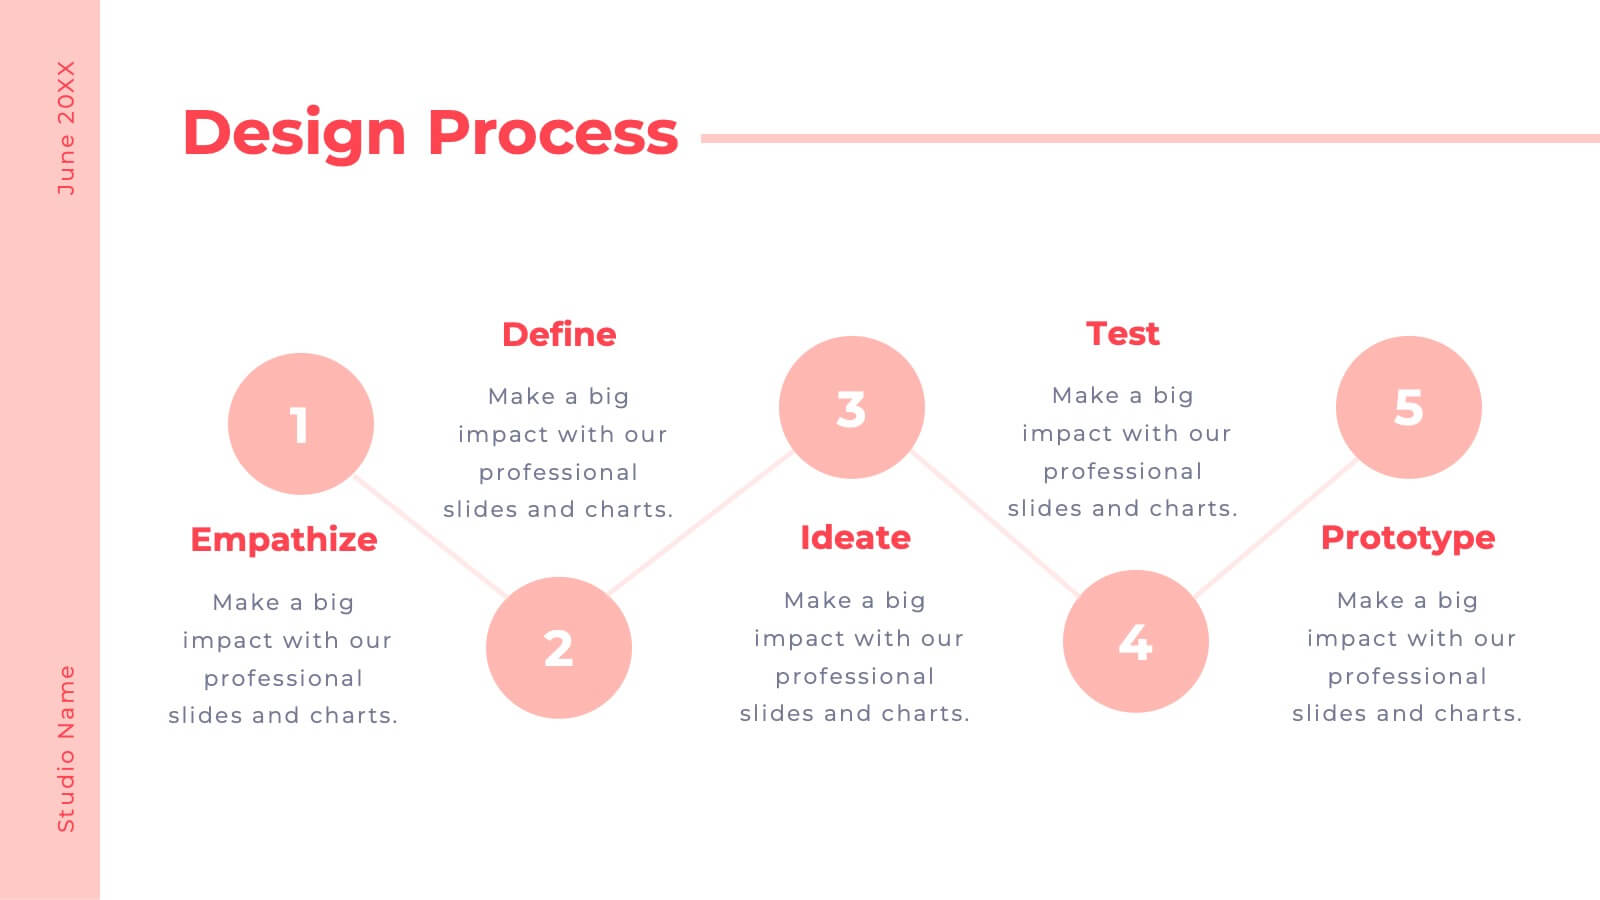
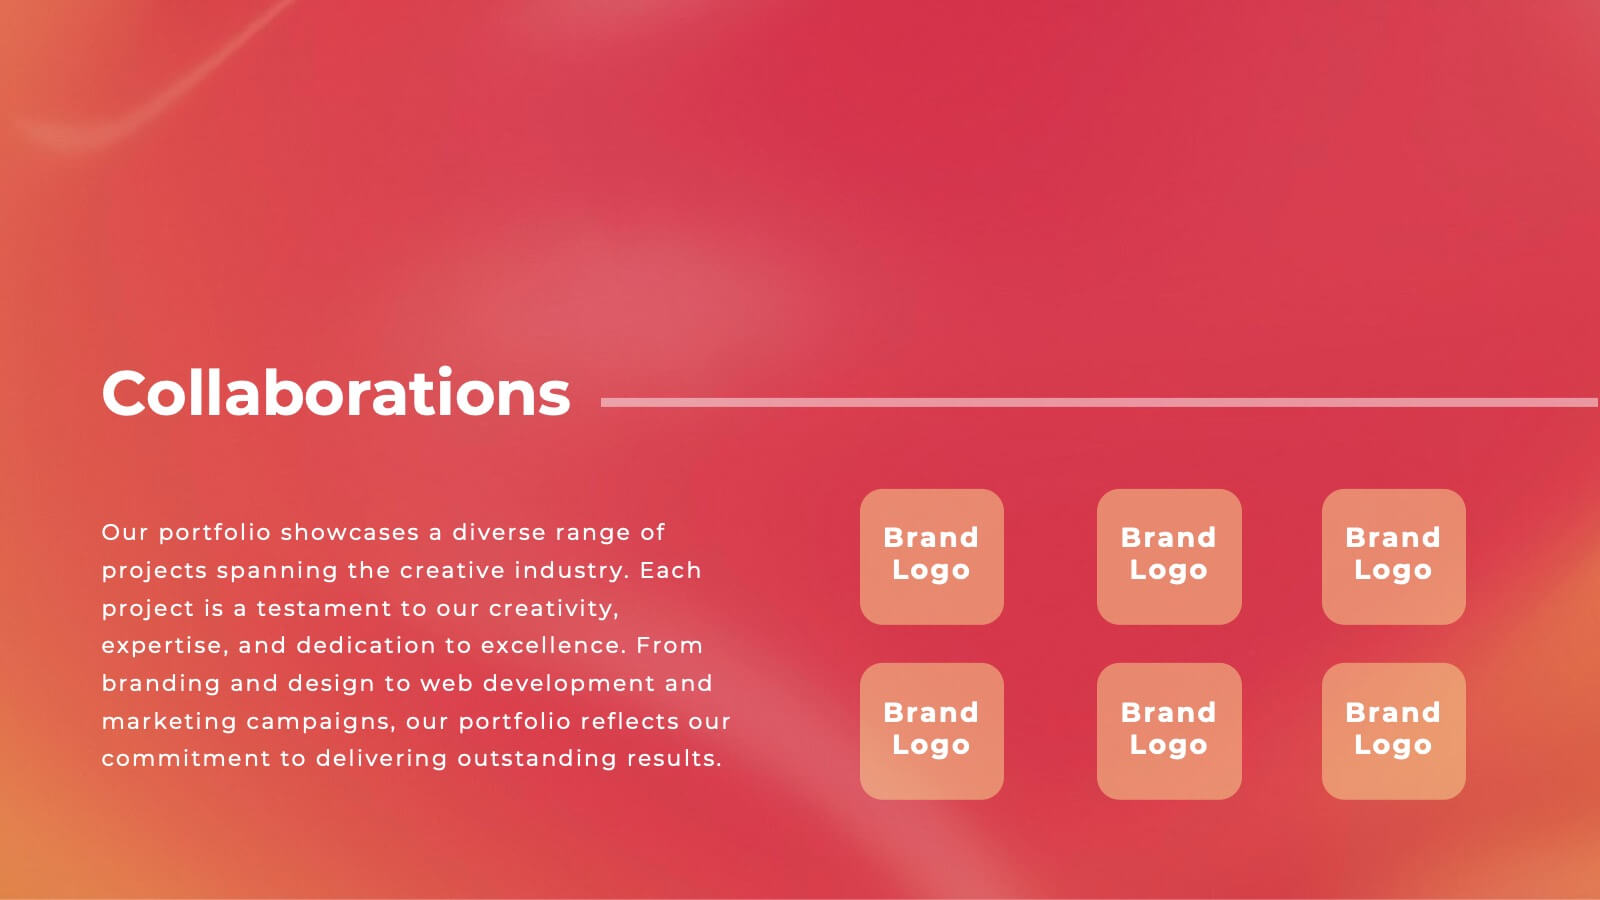
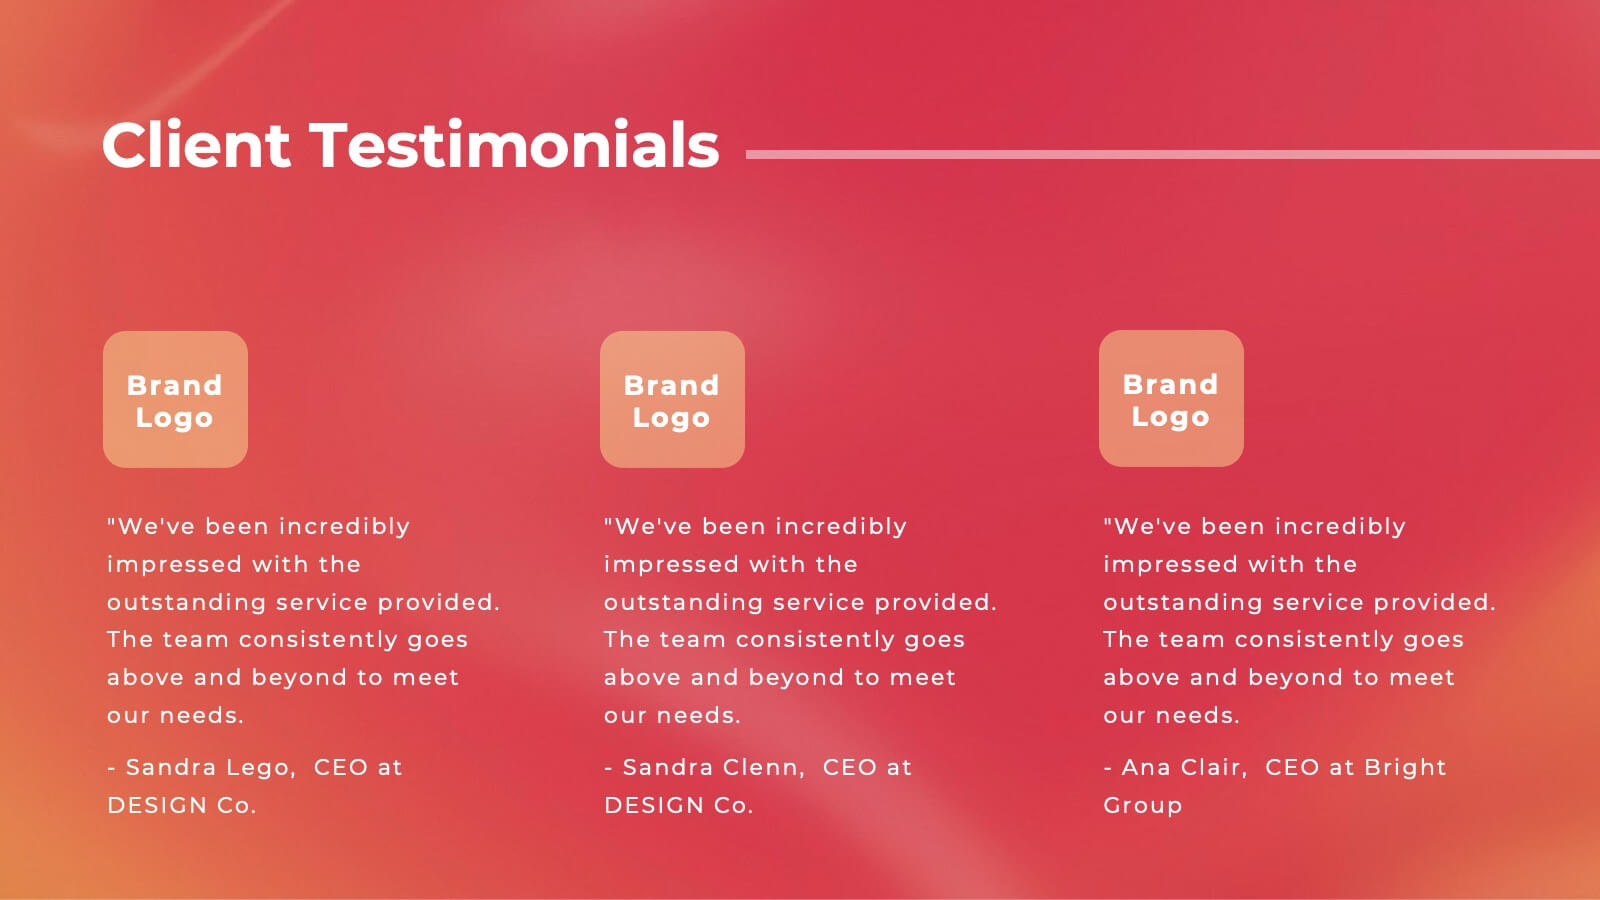
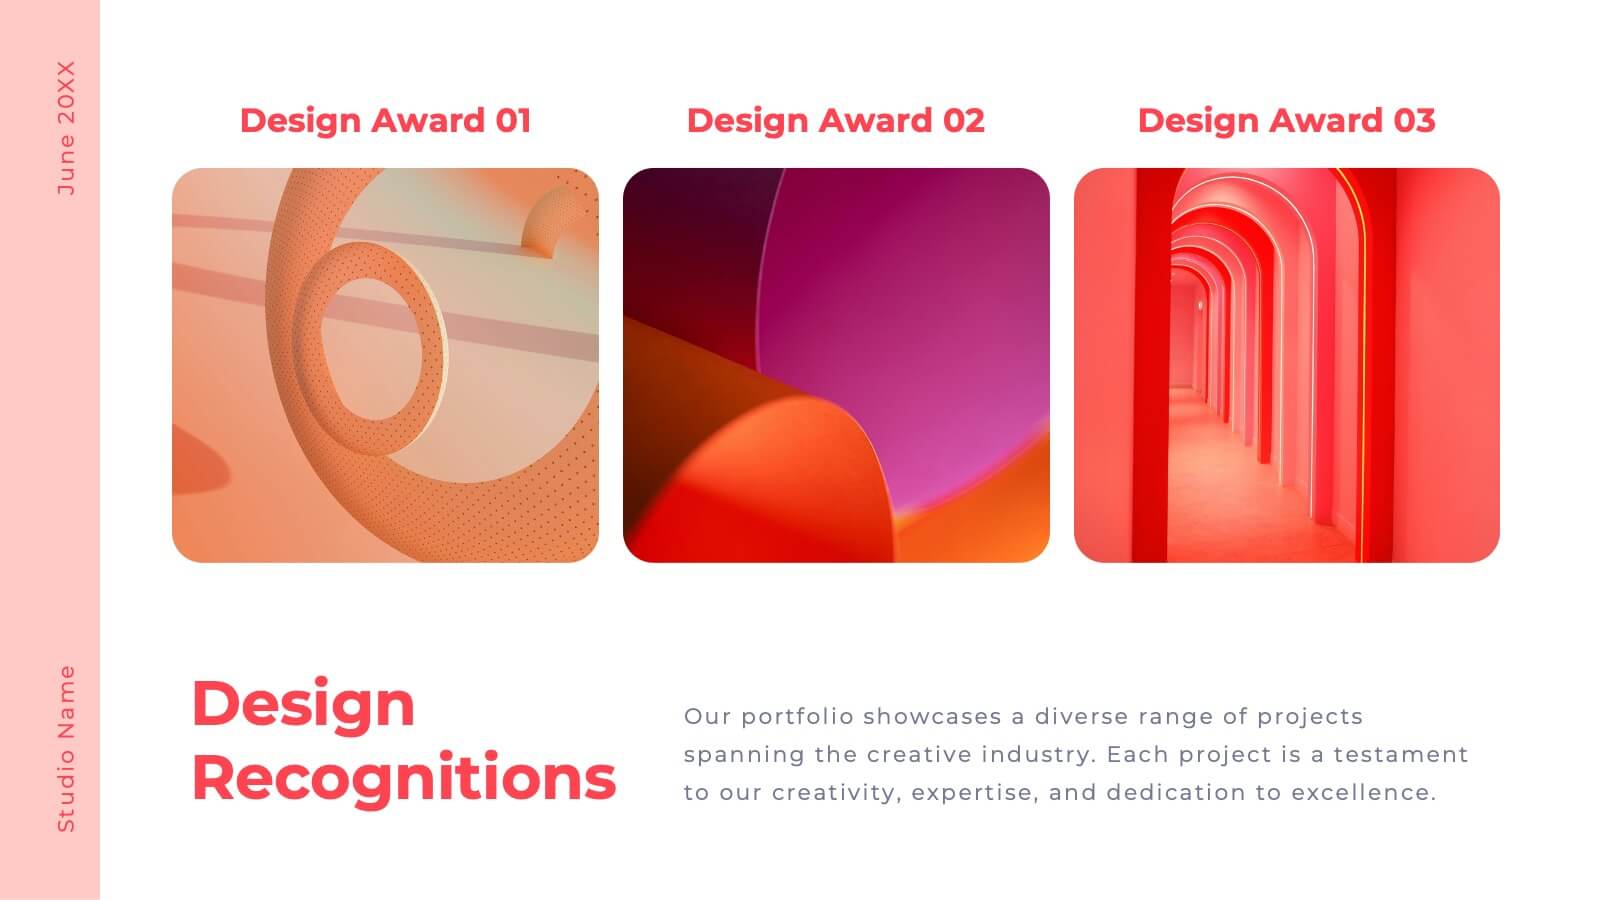
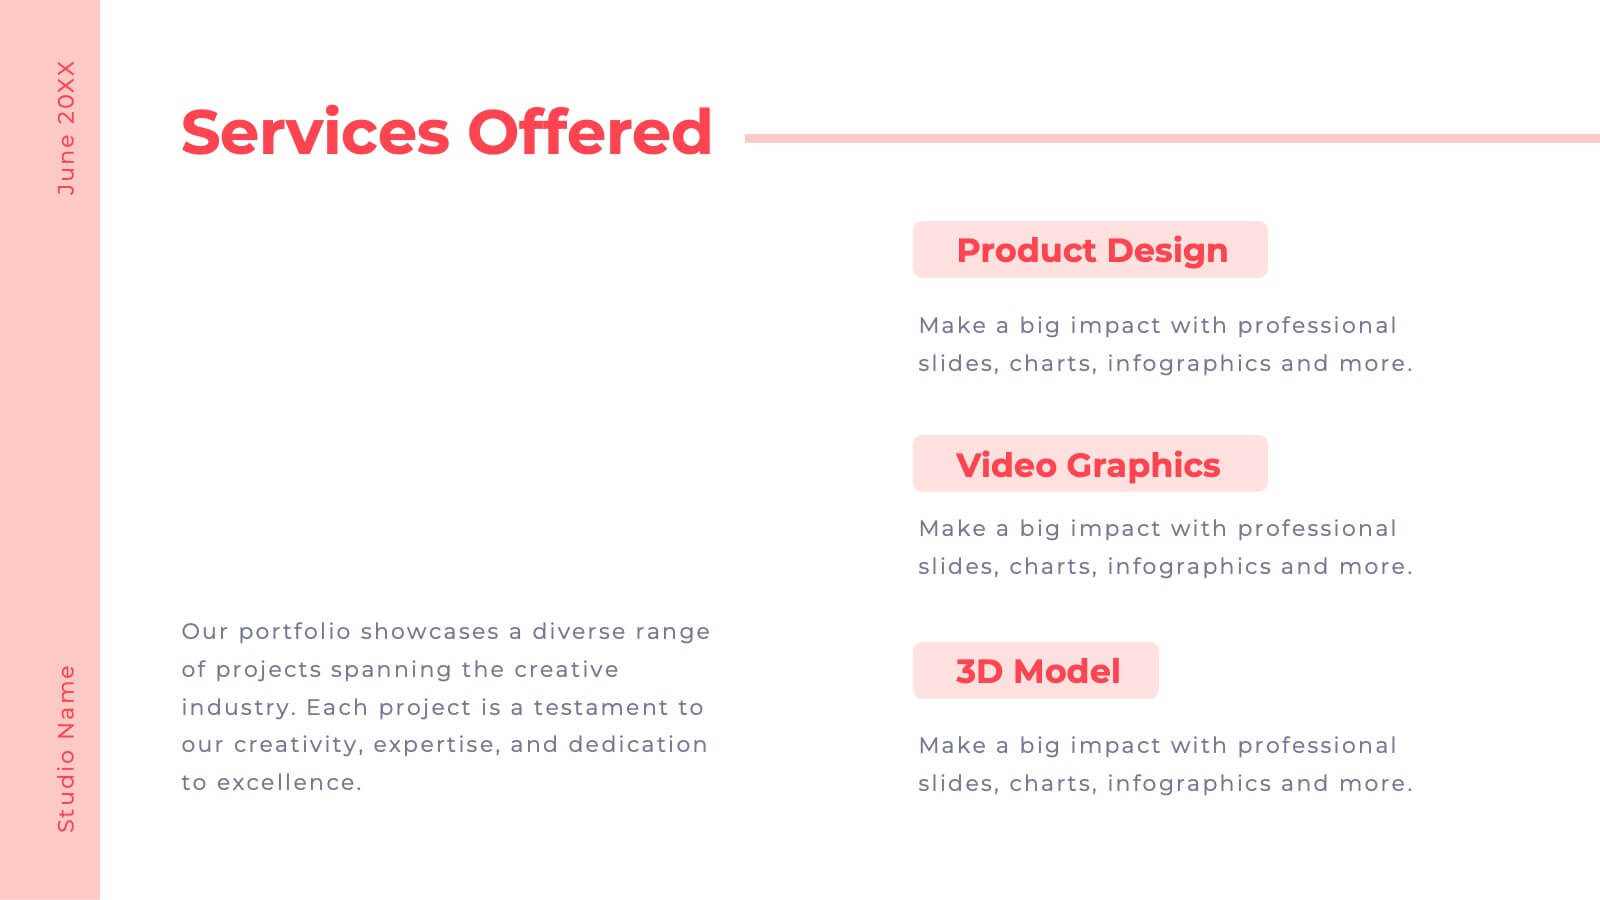
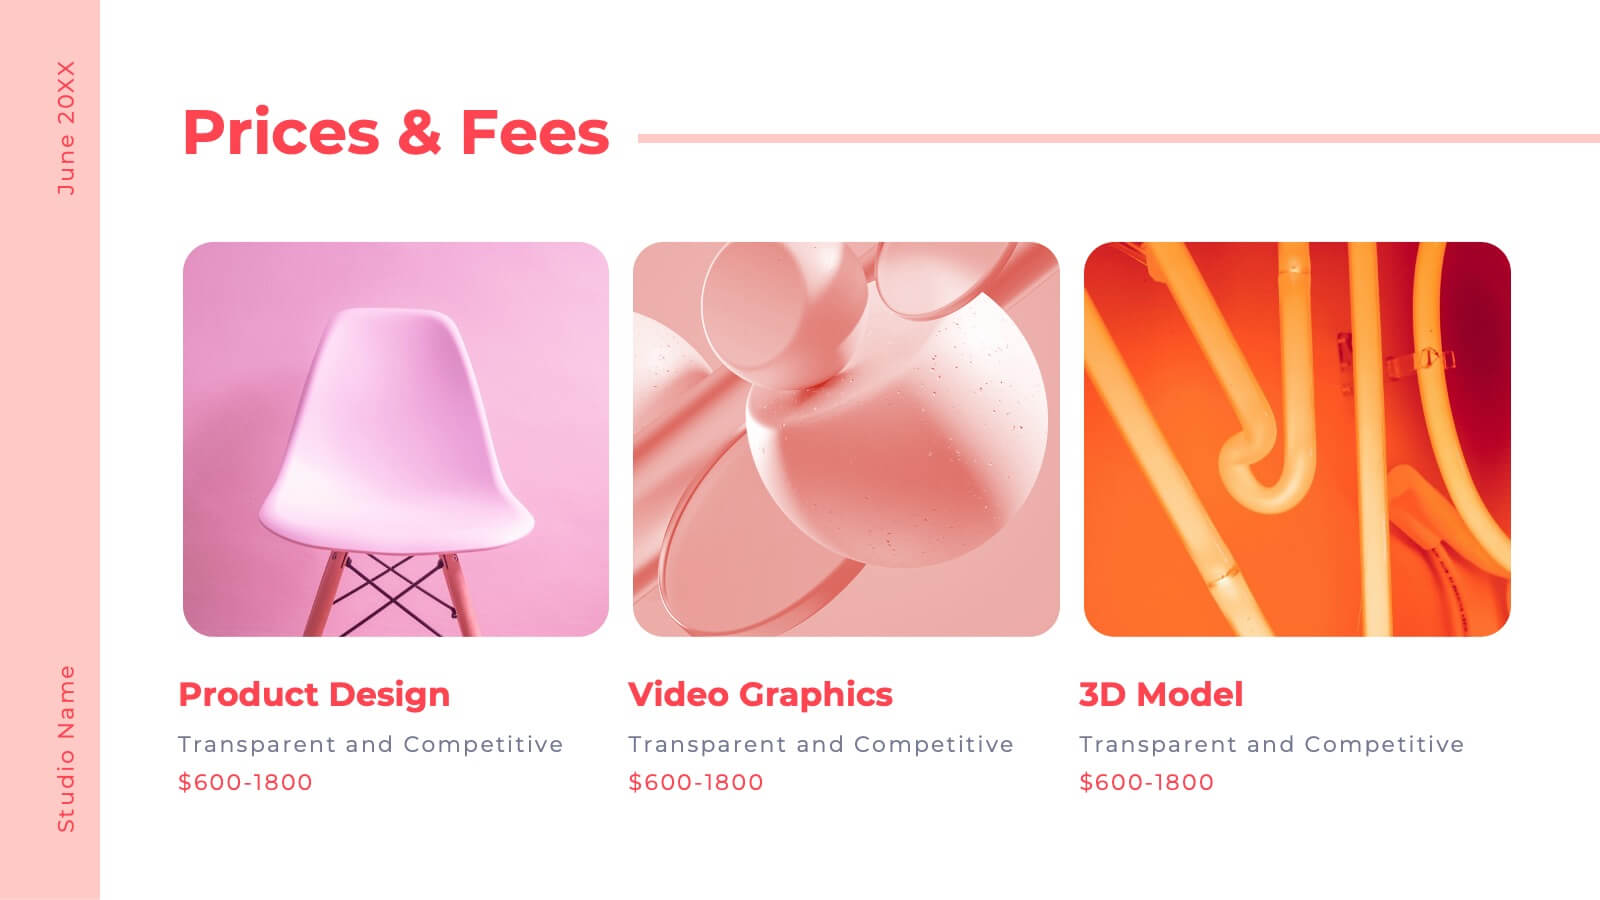
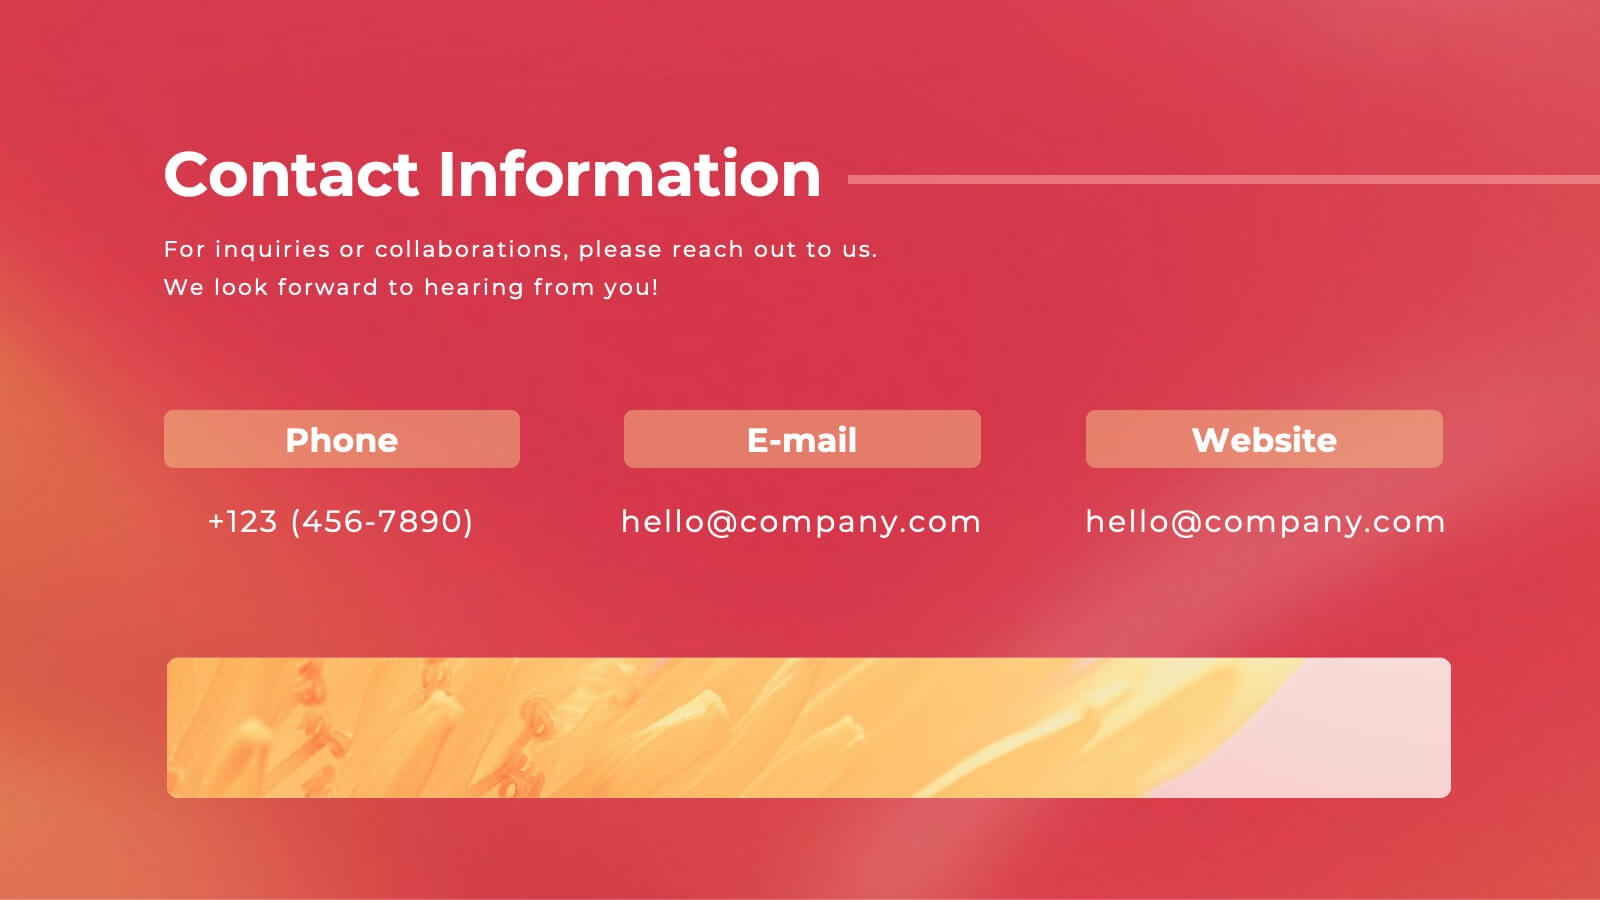
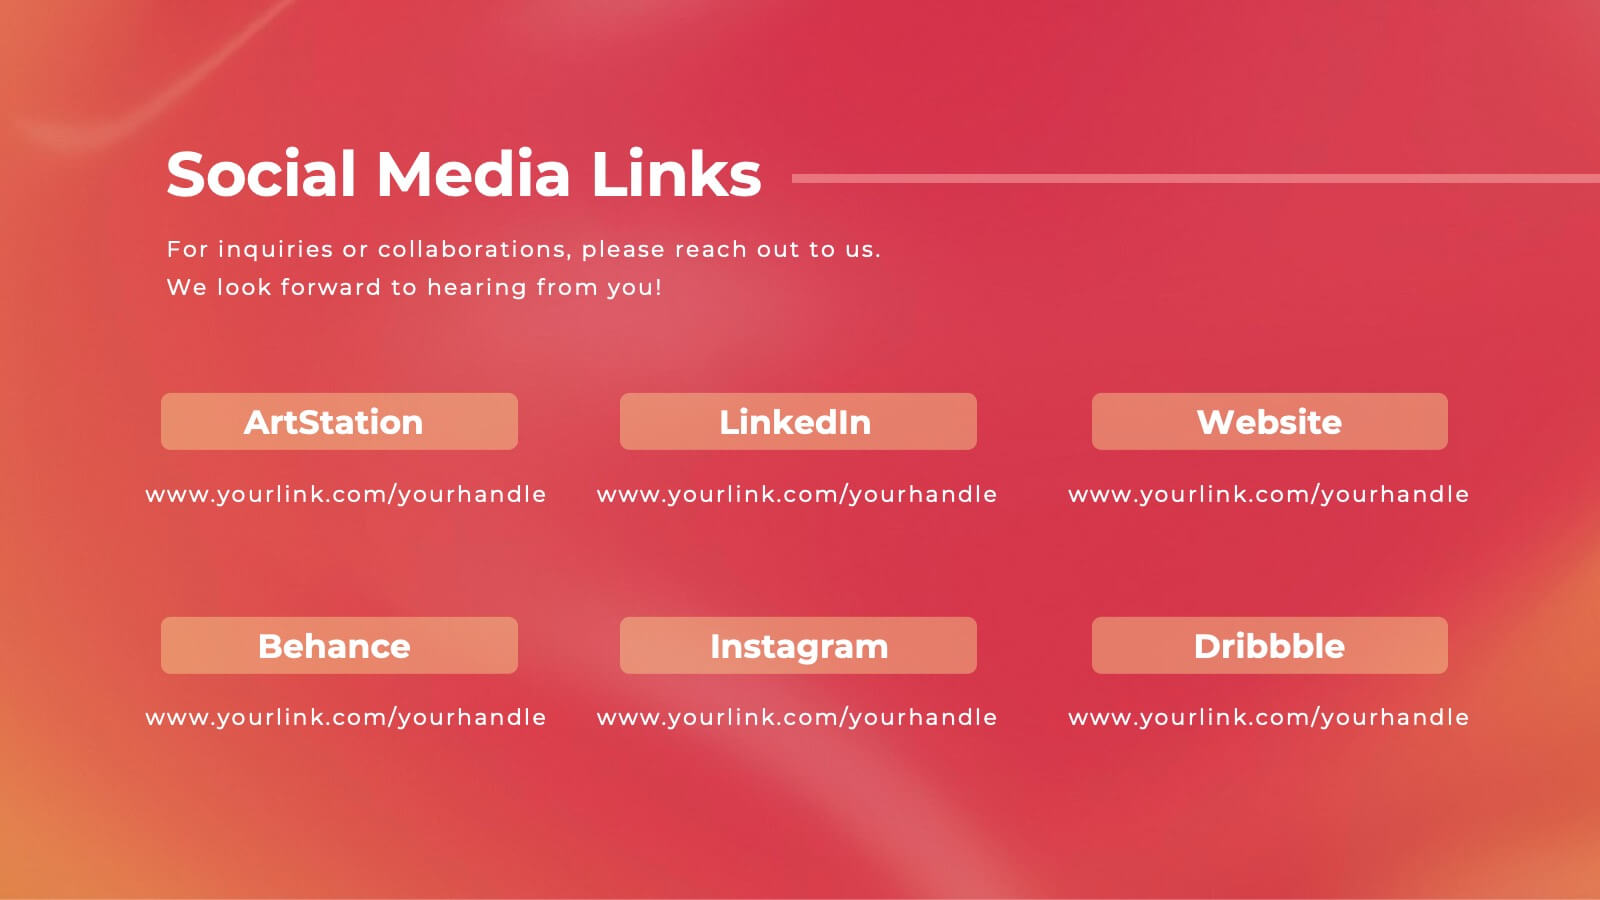
Valor Creative Portfolio Presentation
Step into creativity with this stunning portfolio template! Showcase your projects, design philosophy, and client testimonials with style and flair. Ideal for designers, artists, and creatives wanting to impress. Compatible with PowerPoint, Keynote, and Google Slides, this template elevates every portfolio to new heights. Perfect for making a lasting impact.


5 slides
Pandemic Preventive Measures Infographics
Pandemic Preventive Measures refer to a set of actions taken to prevent the spread of infectious diseases. These vertical infographics are focused on informing the audience about the preventive measures that can be taken during a pandemic. They contains various customizable elements such as icons, charts, and diagrams that can be easily edited to suit your needs. The design is clean and easy to follow, making it an effective tool for communicating important information. Educate your audience on the essential pandemic preventive measures, and provide them with the necessary information to stay safe and healthy!


21 slides
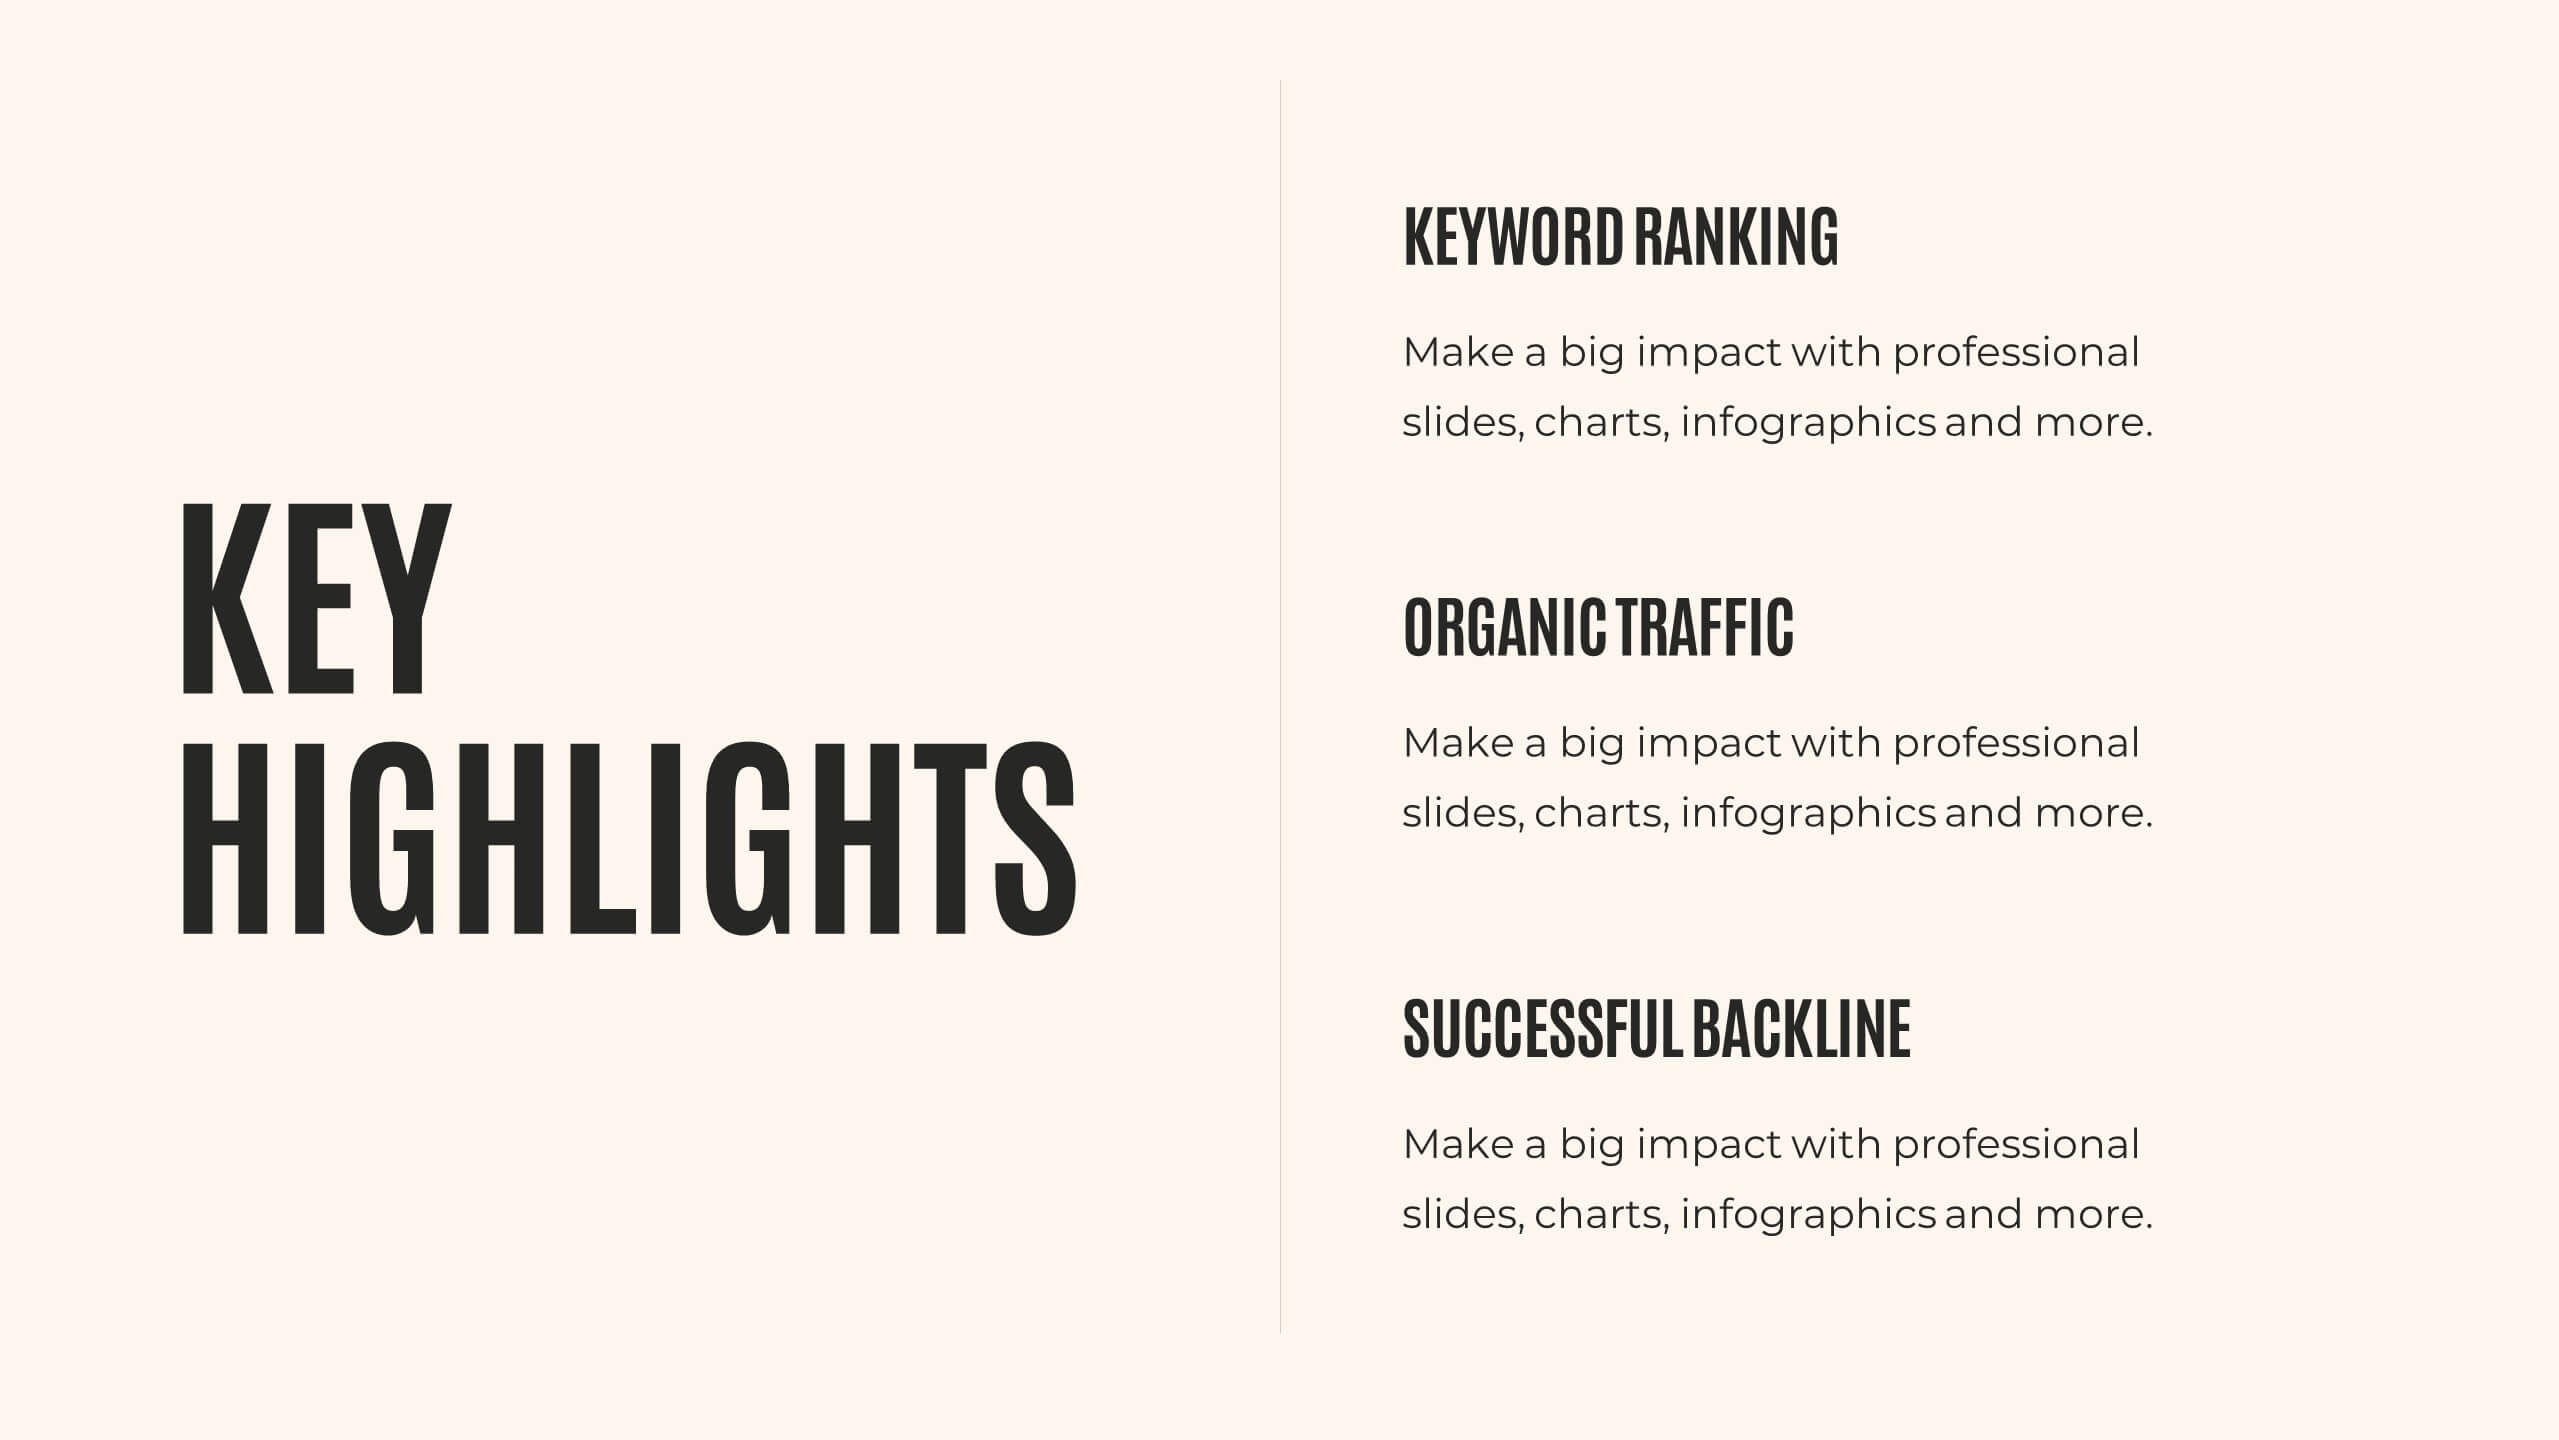
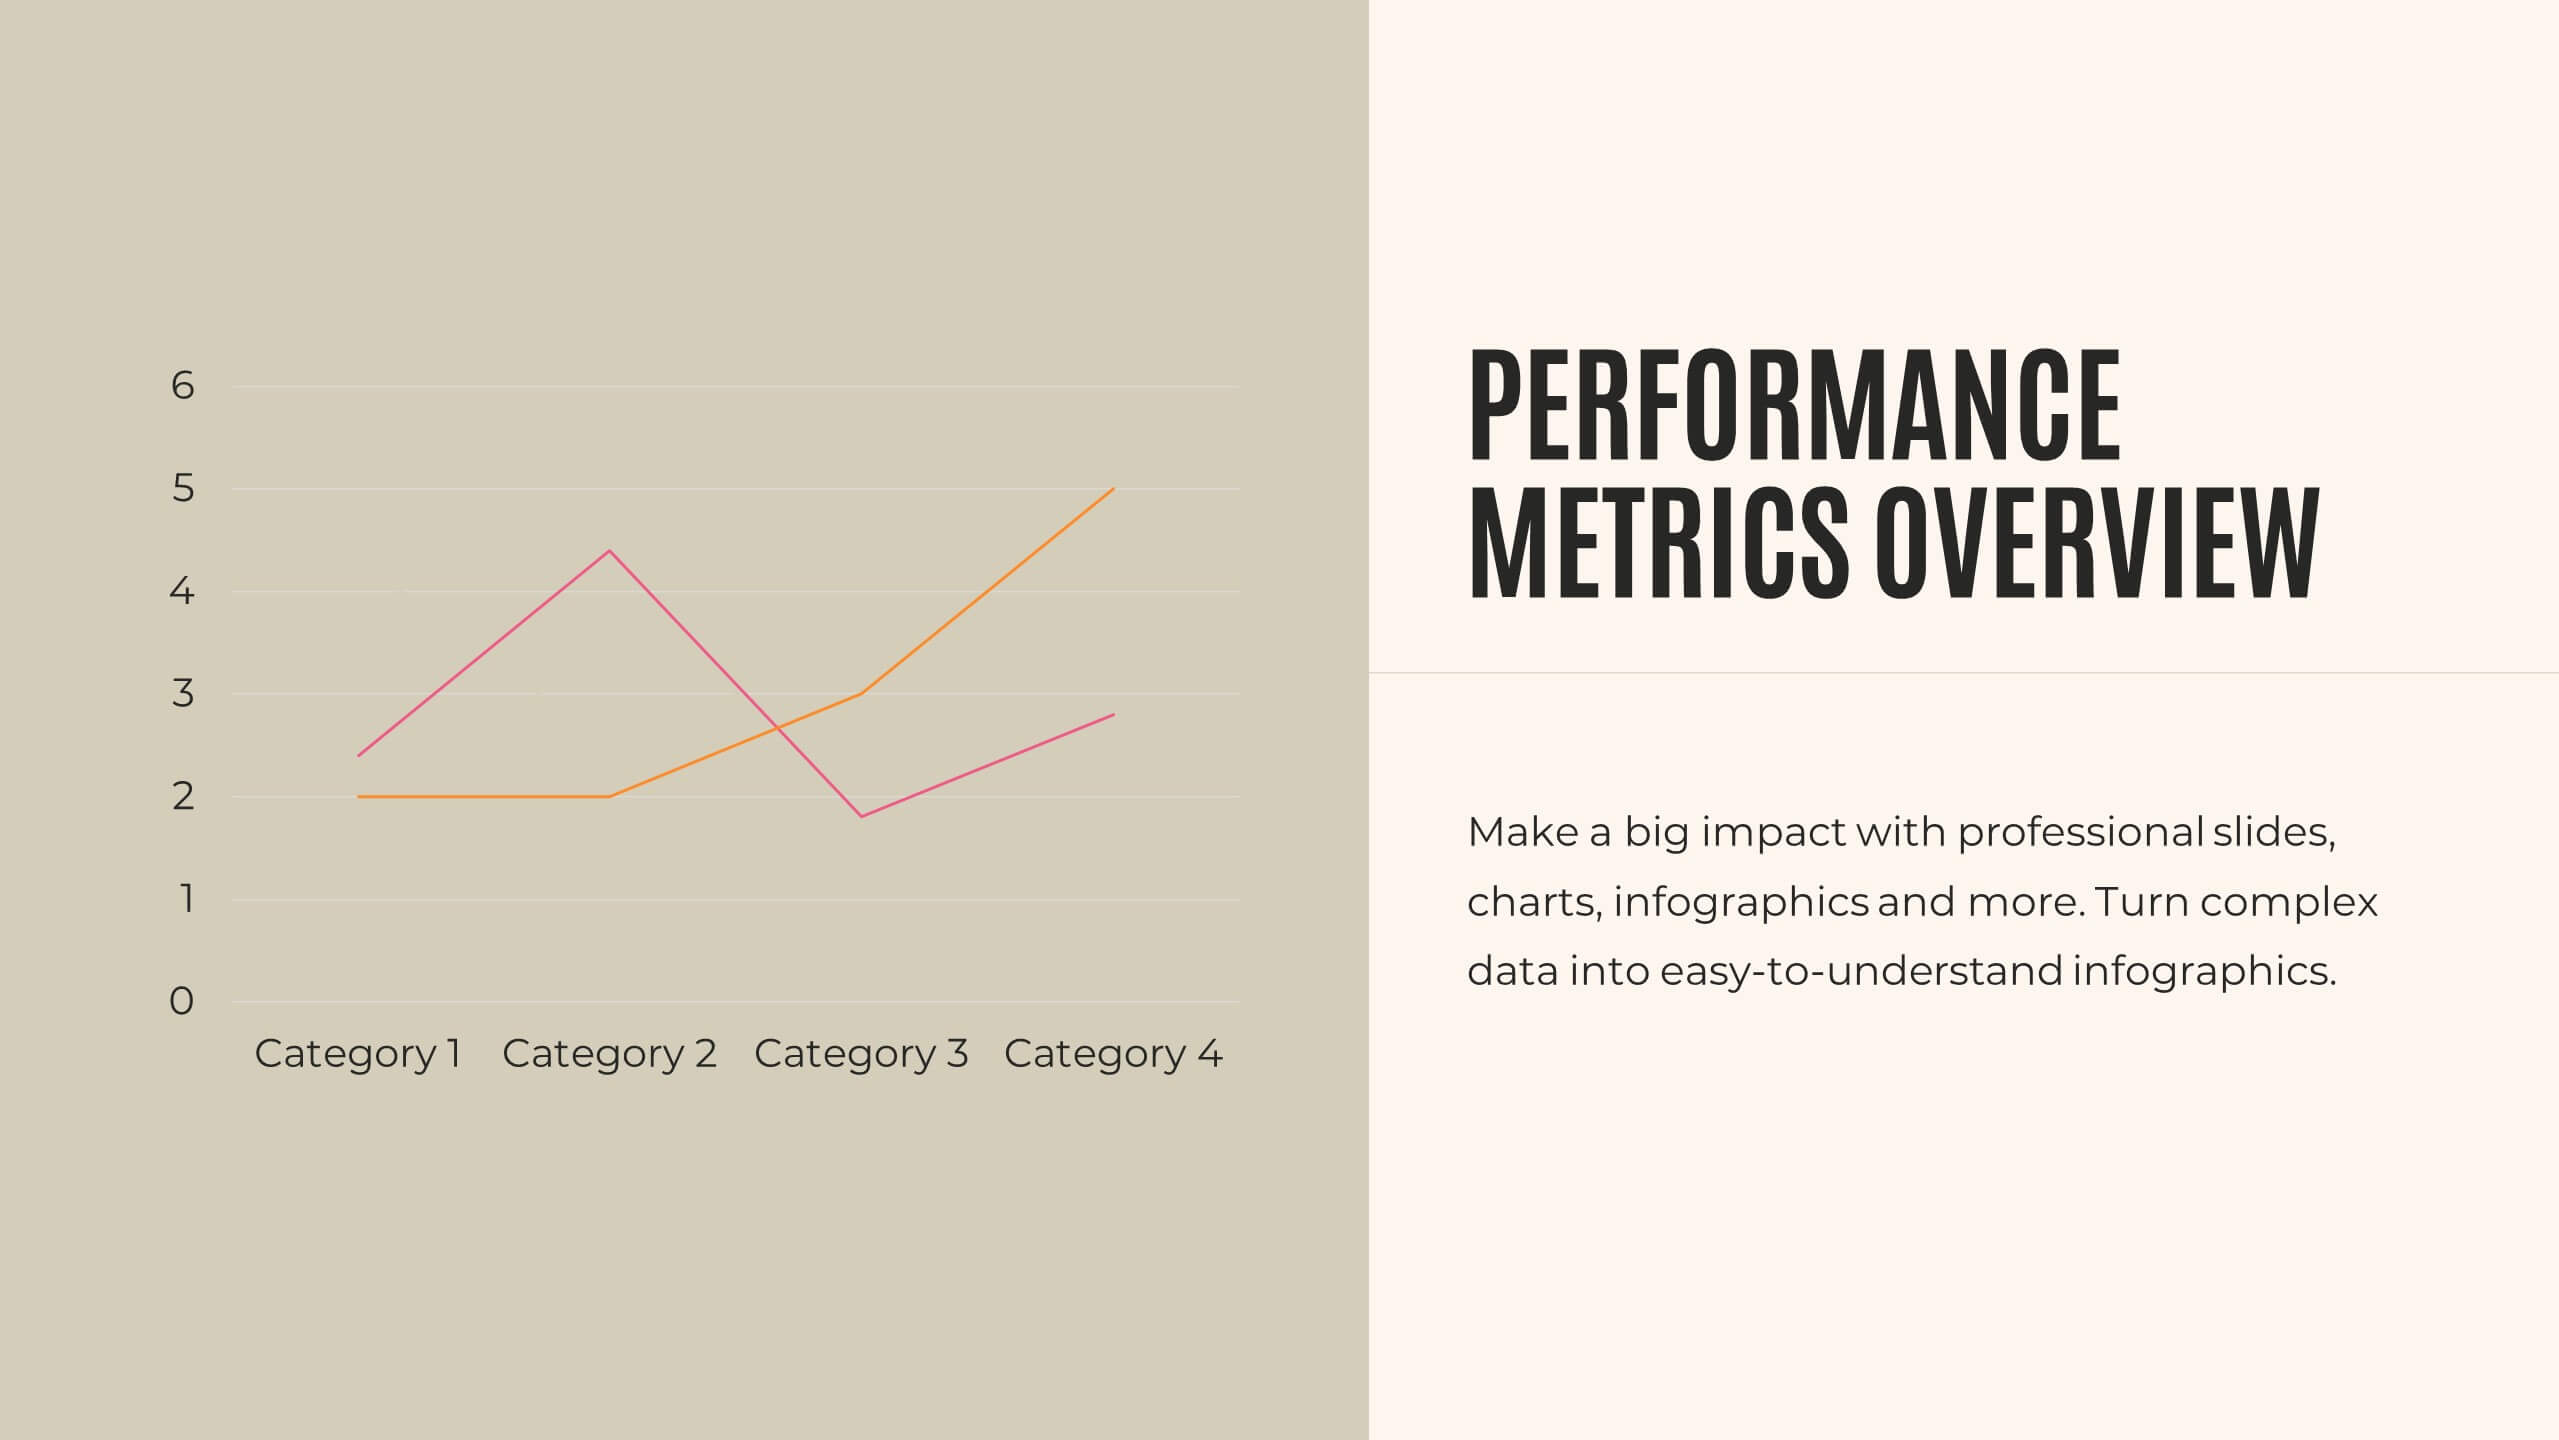
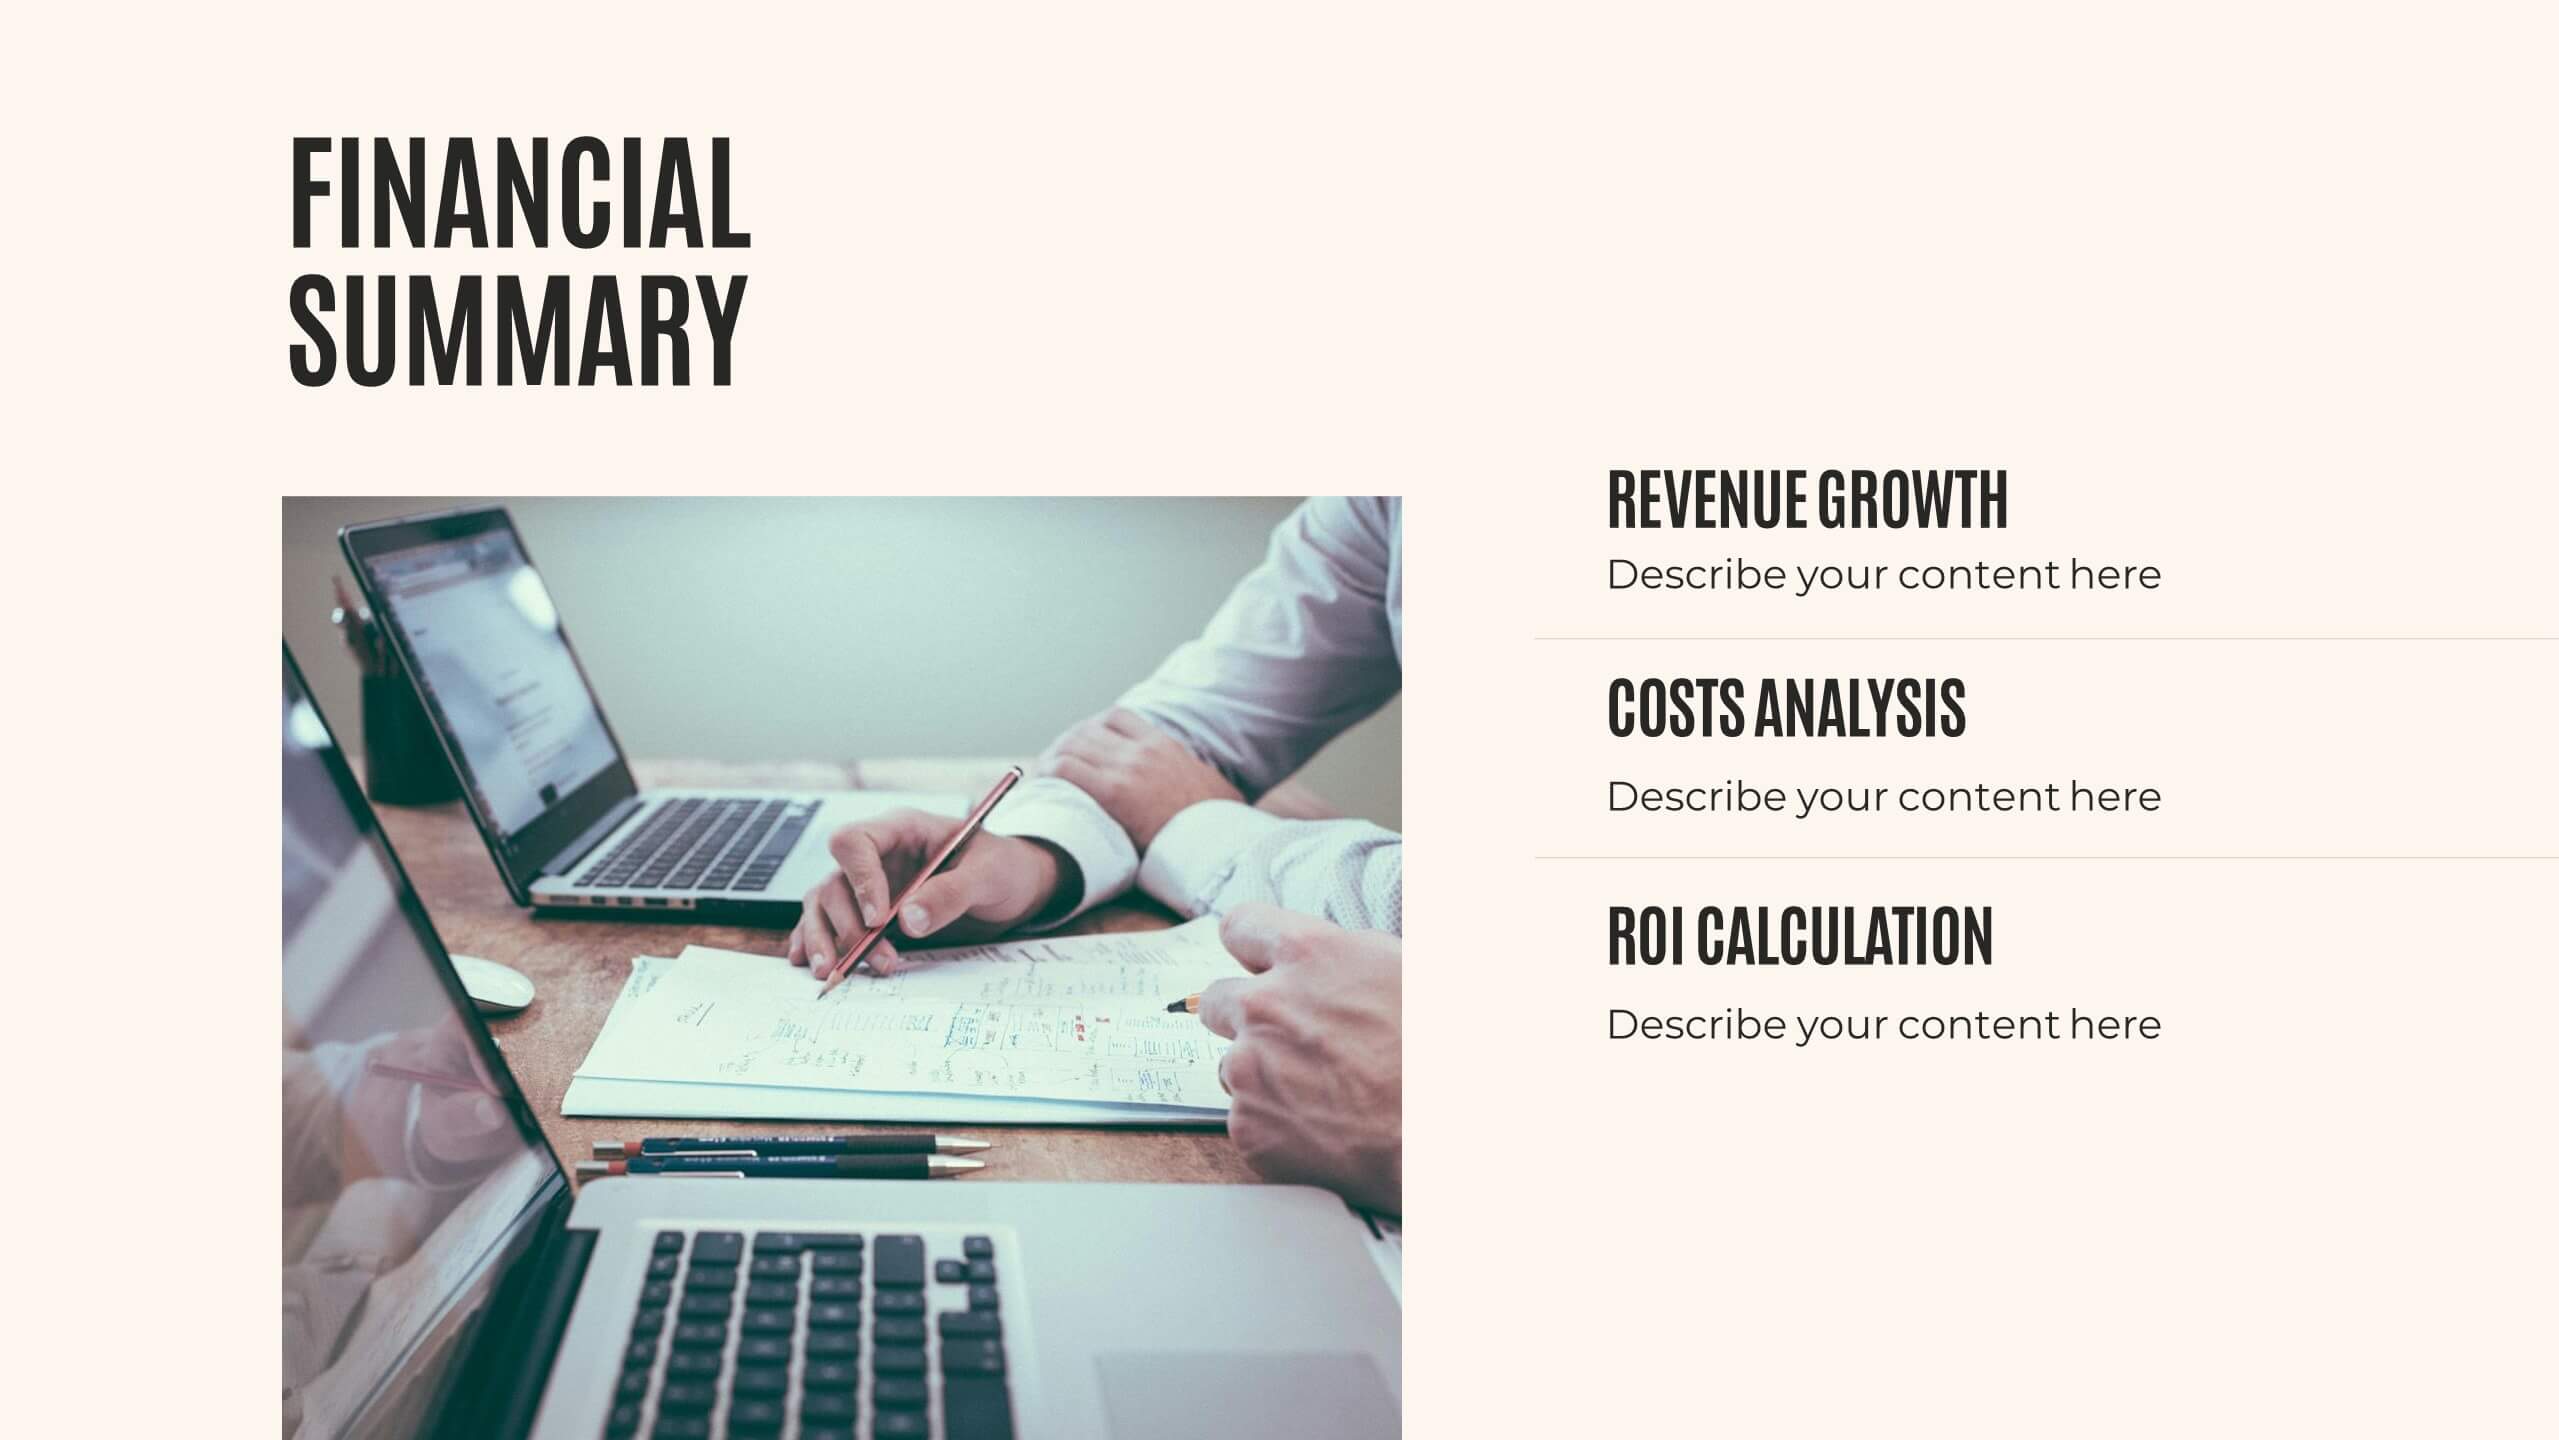
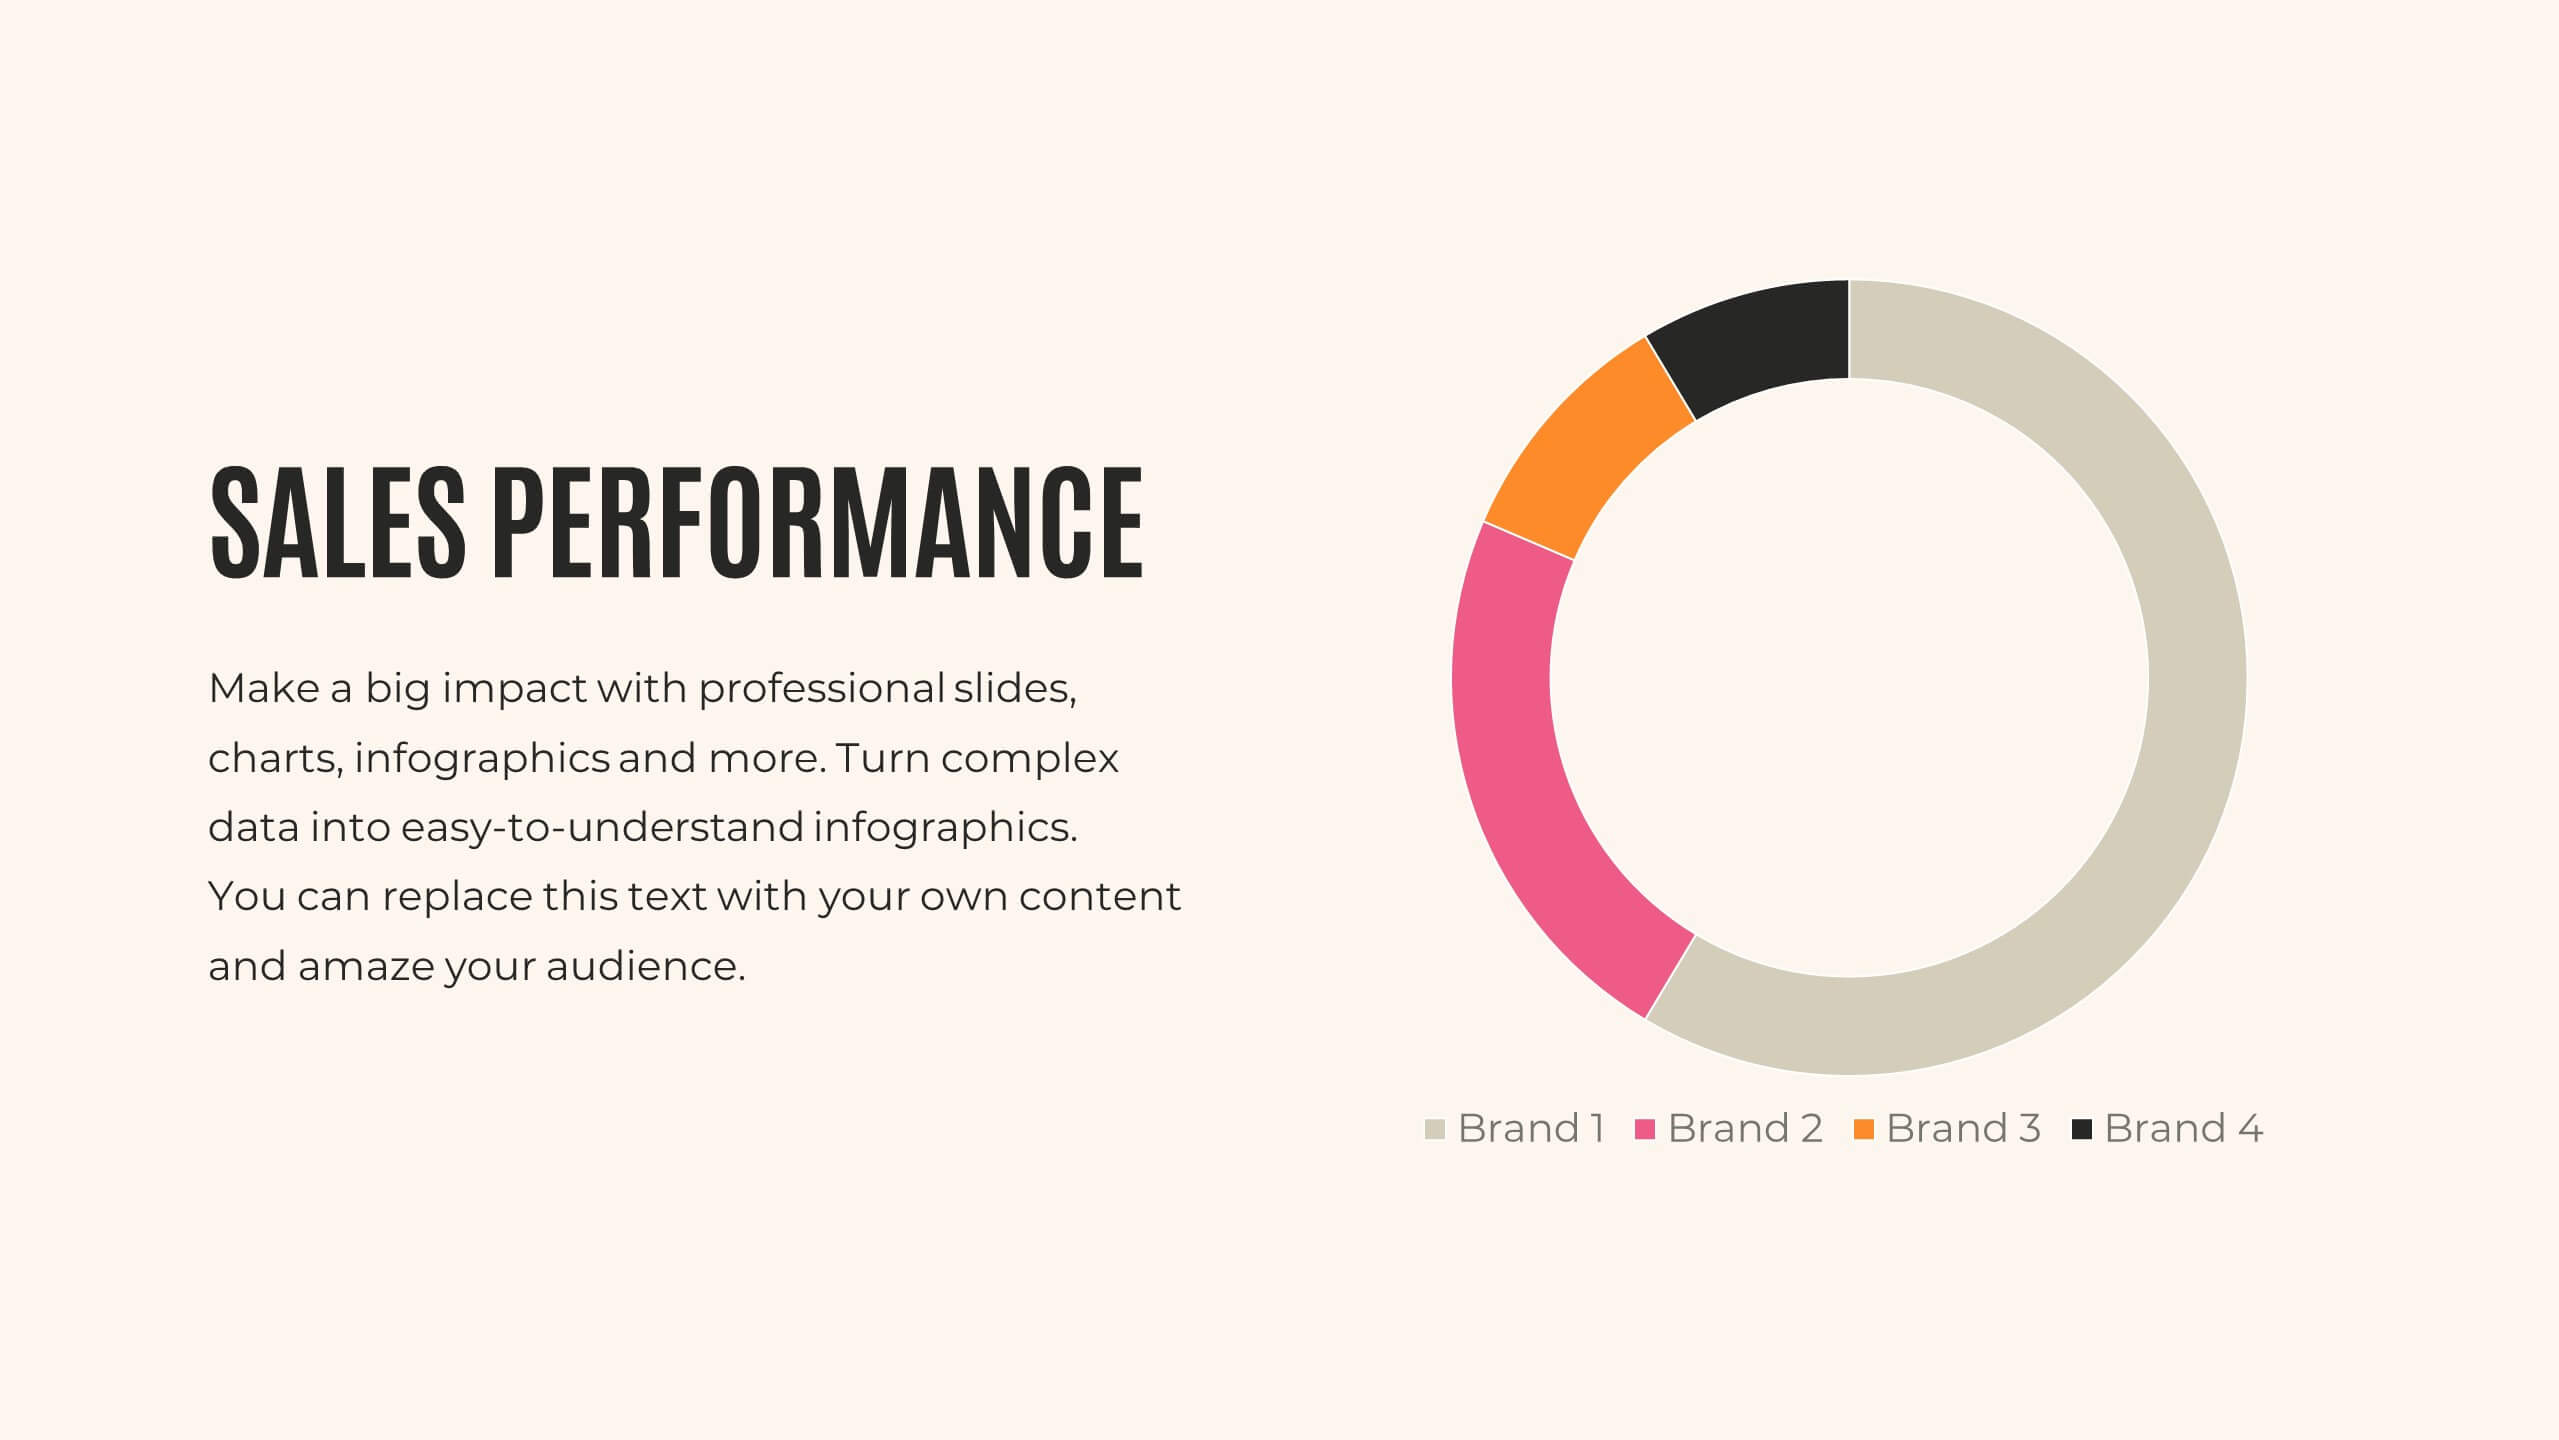
Journey Annual Report Presentation
Present your annual report with clarity and impact! This template covers agenda, key highlights, financial summary, sales performance, and project progress. Ideal for detailing achievements, insights, and future priorities. Compatible with PowerPoint, Keynote, and Google Slides, it ensures your data is visually compelling and easy to understand. Showcase your success effortlessly!


10 slides
AI Impact on Business and Innovation Presentation
Deliver insights with precision using this data-driven presentation template tailored for machine learning, AI, and analytics topics. Featuring a central hub-and-spoke design, this layout allows you to showcase key components like algorithms, tools, processes, or data sources. Each segment includes clean icons and customizable titles for seamless editing. Ideal for data scientists, tech professionals, and academic presentations. Fully editable in PowerPoint, Keynote, and Google Slides.


6 slides
Employee Welcome and Orientation Guide Presentation
Welcome new hires with clarity using the Employee Welcome and Orientation Guide Presentation. Featuring a timeline-style layout with flag icons, this design helps outline key onboarding stages—from introductions and training to policies and first-week expectations. Easy to customize in Canva, PowerPoint, Keynote, or Google Slides for a smooth employee experience.


5 slides
Benefits of Yoga Infographics
Yoga offers a wide range of benefits for the mind, body, and overall well-being, these also tend to deepen with regular practice. These infographic templates highlight the numerous advantages of practicing yoga. Whether you're a yoga instructor, wellness coach, or health enthusiast, this template provides a comprehensive overview of the physical, mental, and emotional benefits of yoga. The infographics include text boxes, illustrations, and graphs that can be used to promote the advantages of incorporating yoga into one's lifestyle. Compatible with Powerpoint, Keynote, and Google Slides, these are easily customizable.

21 slides
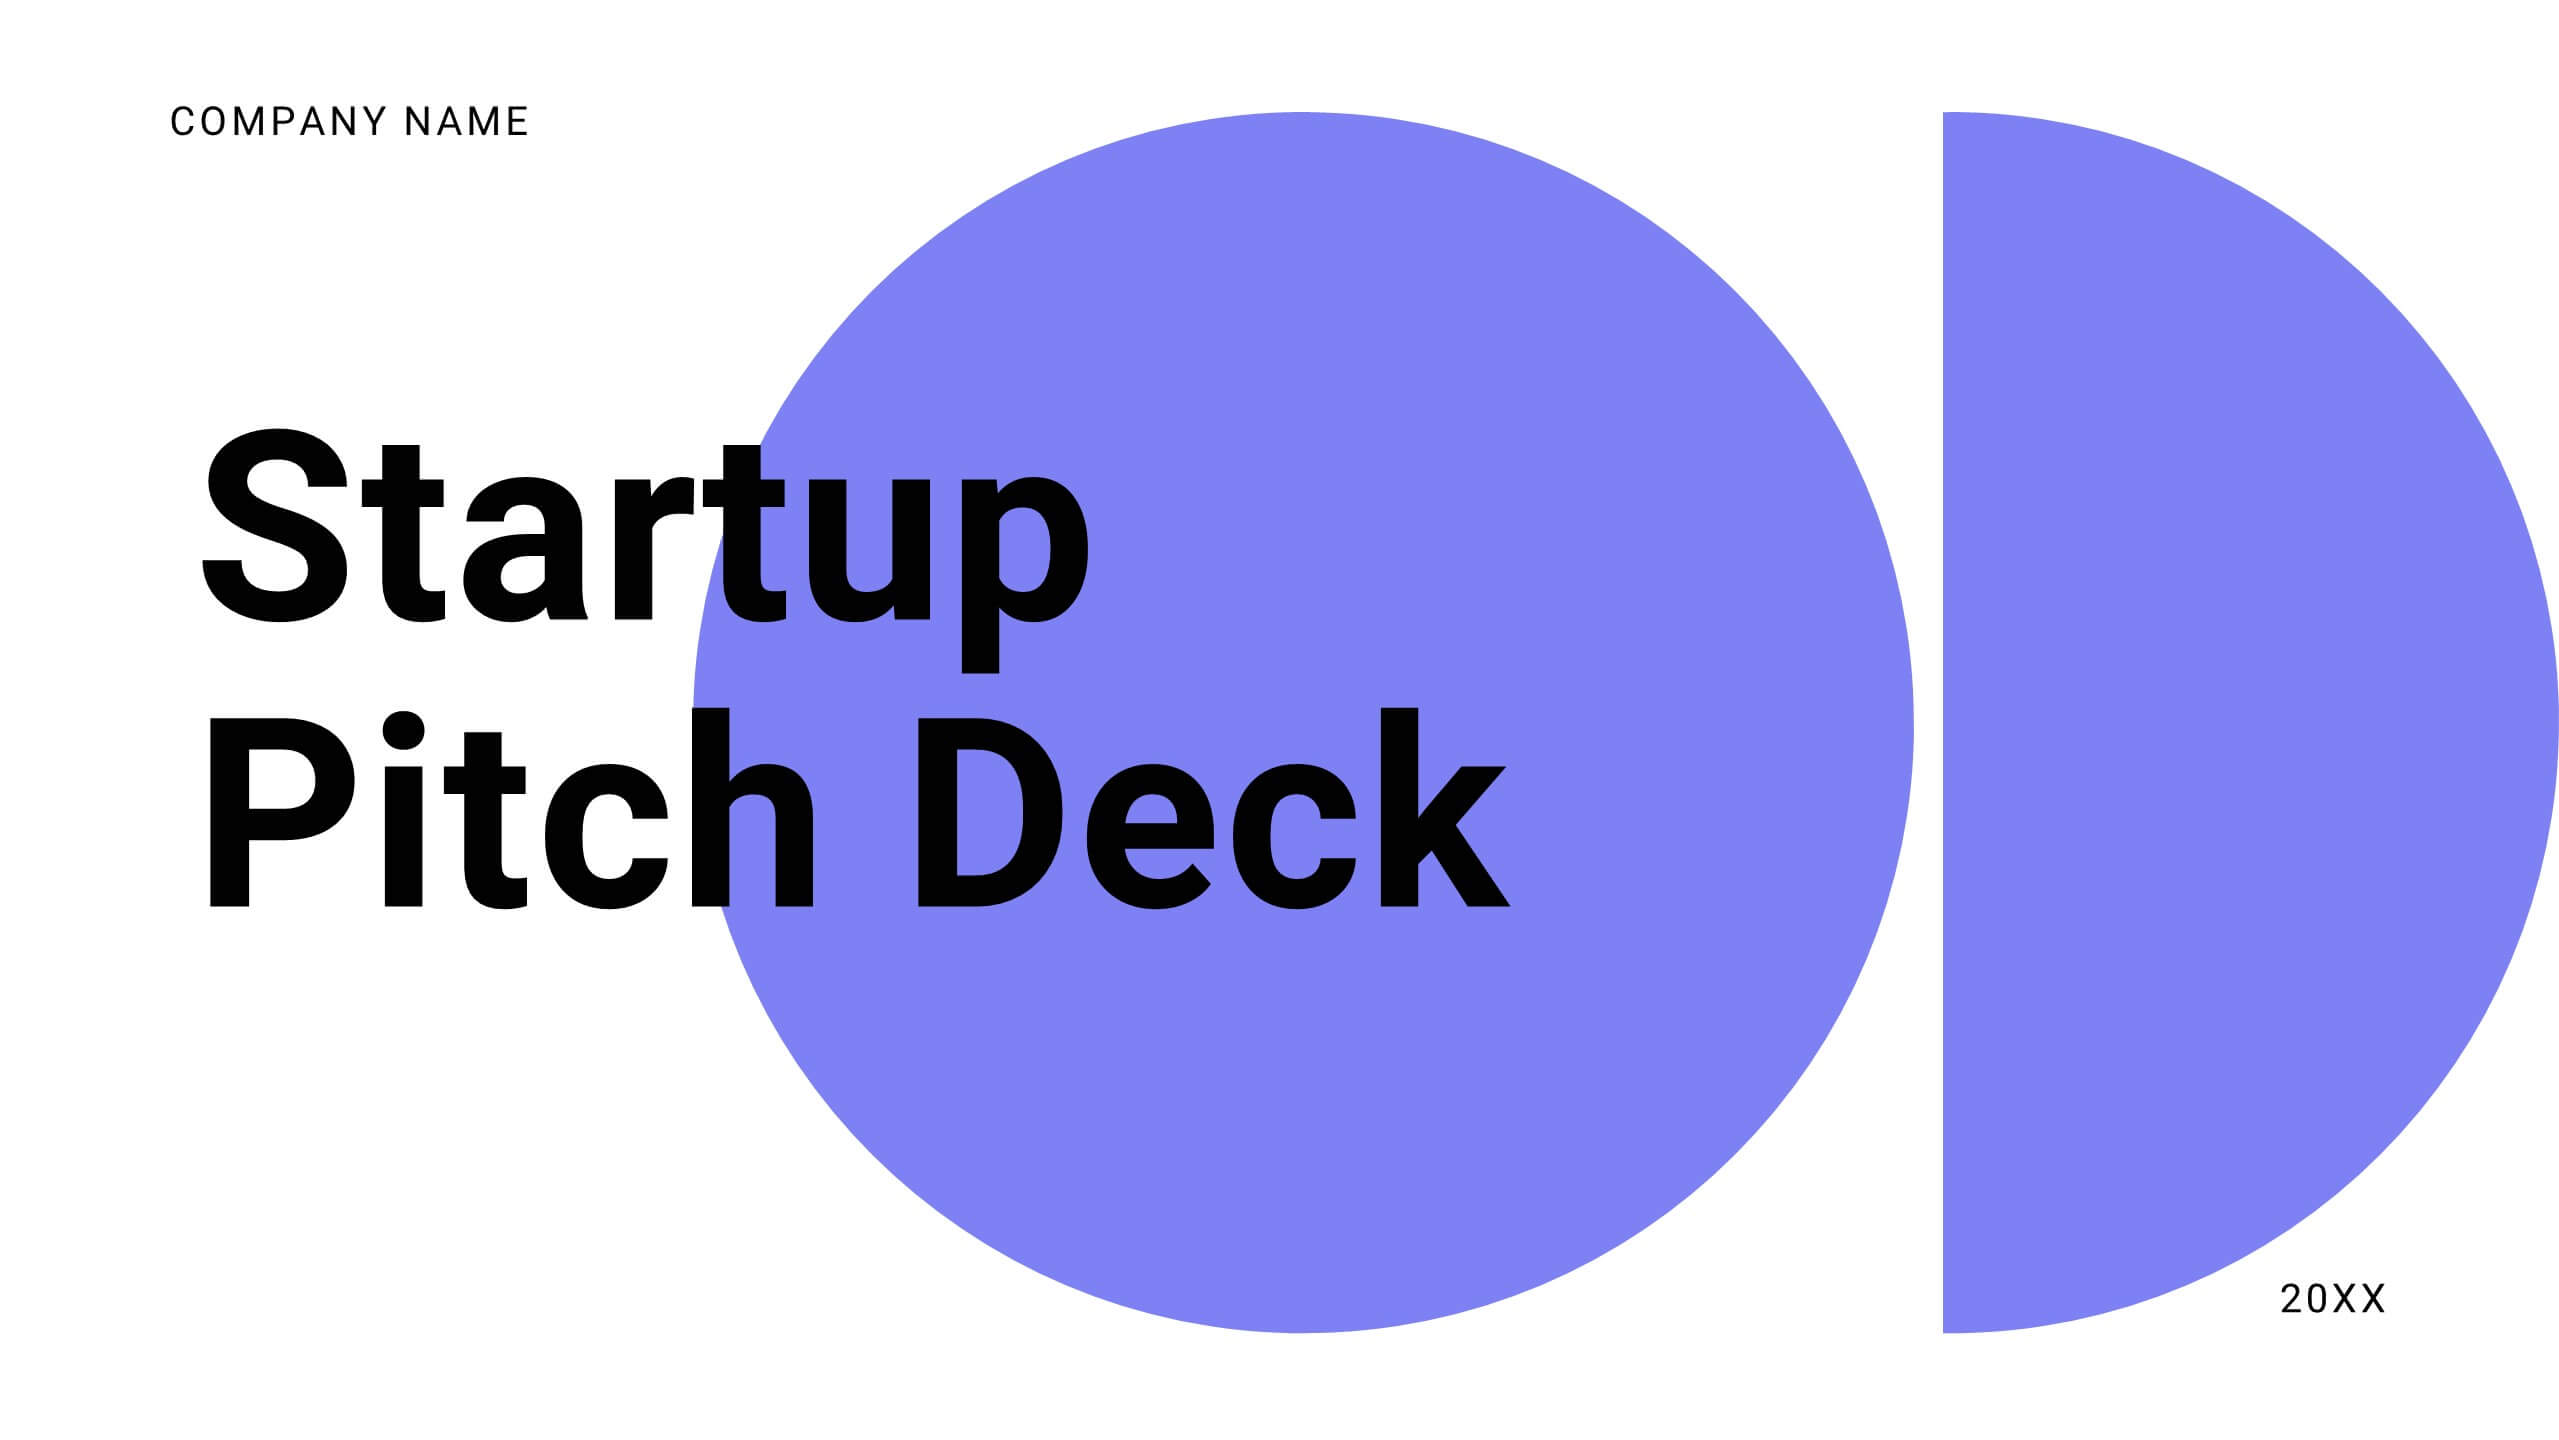
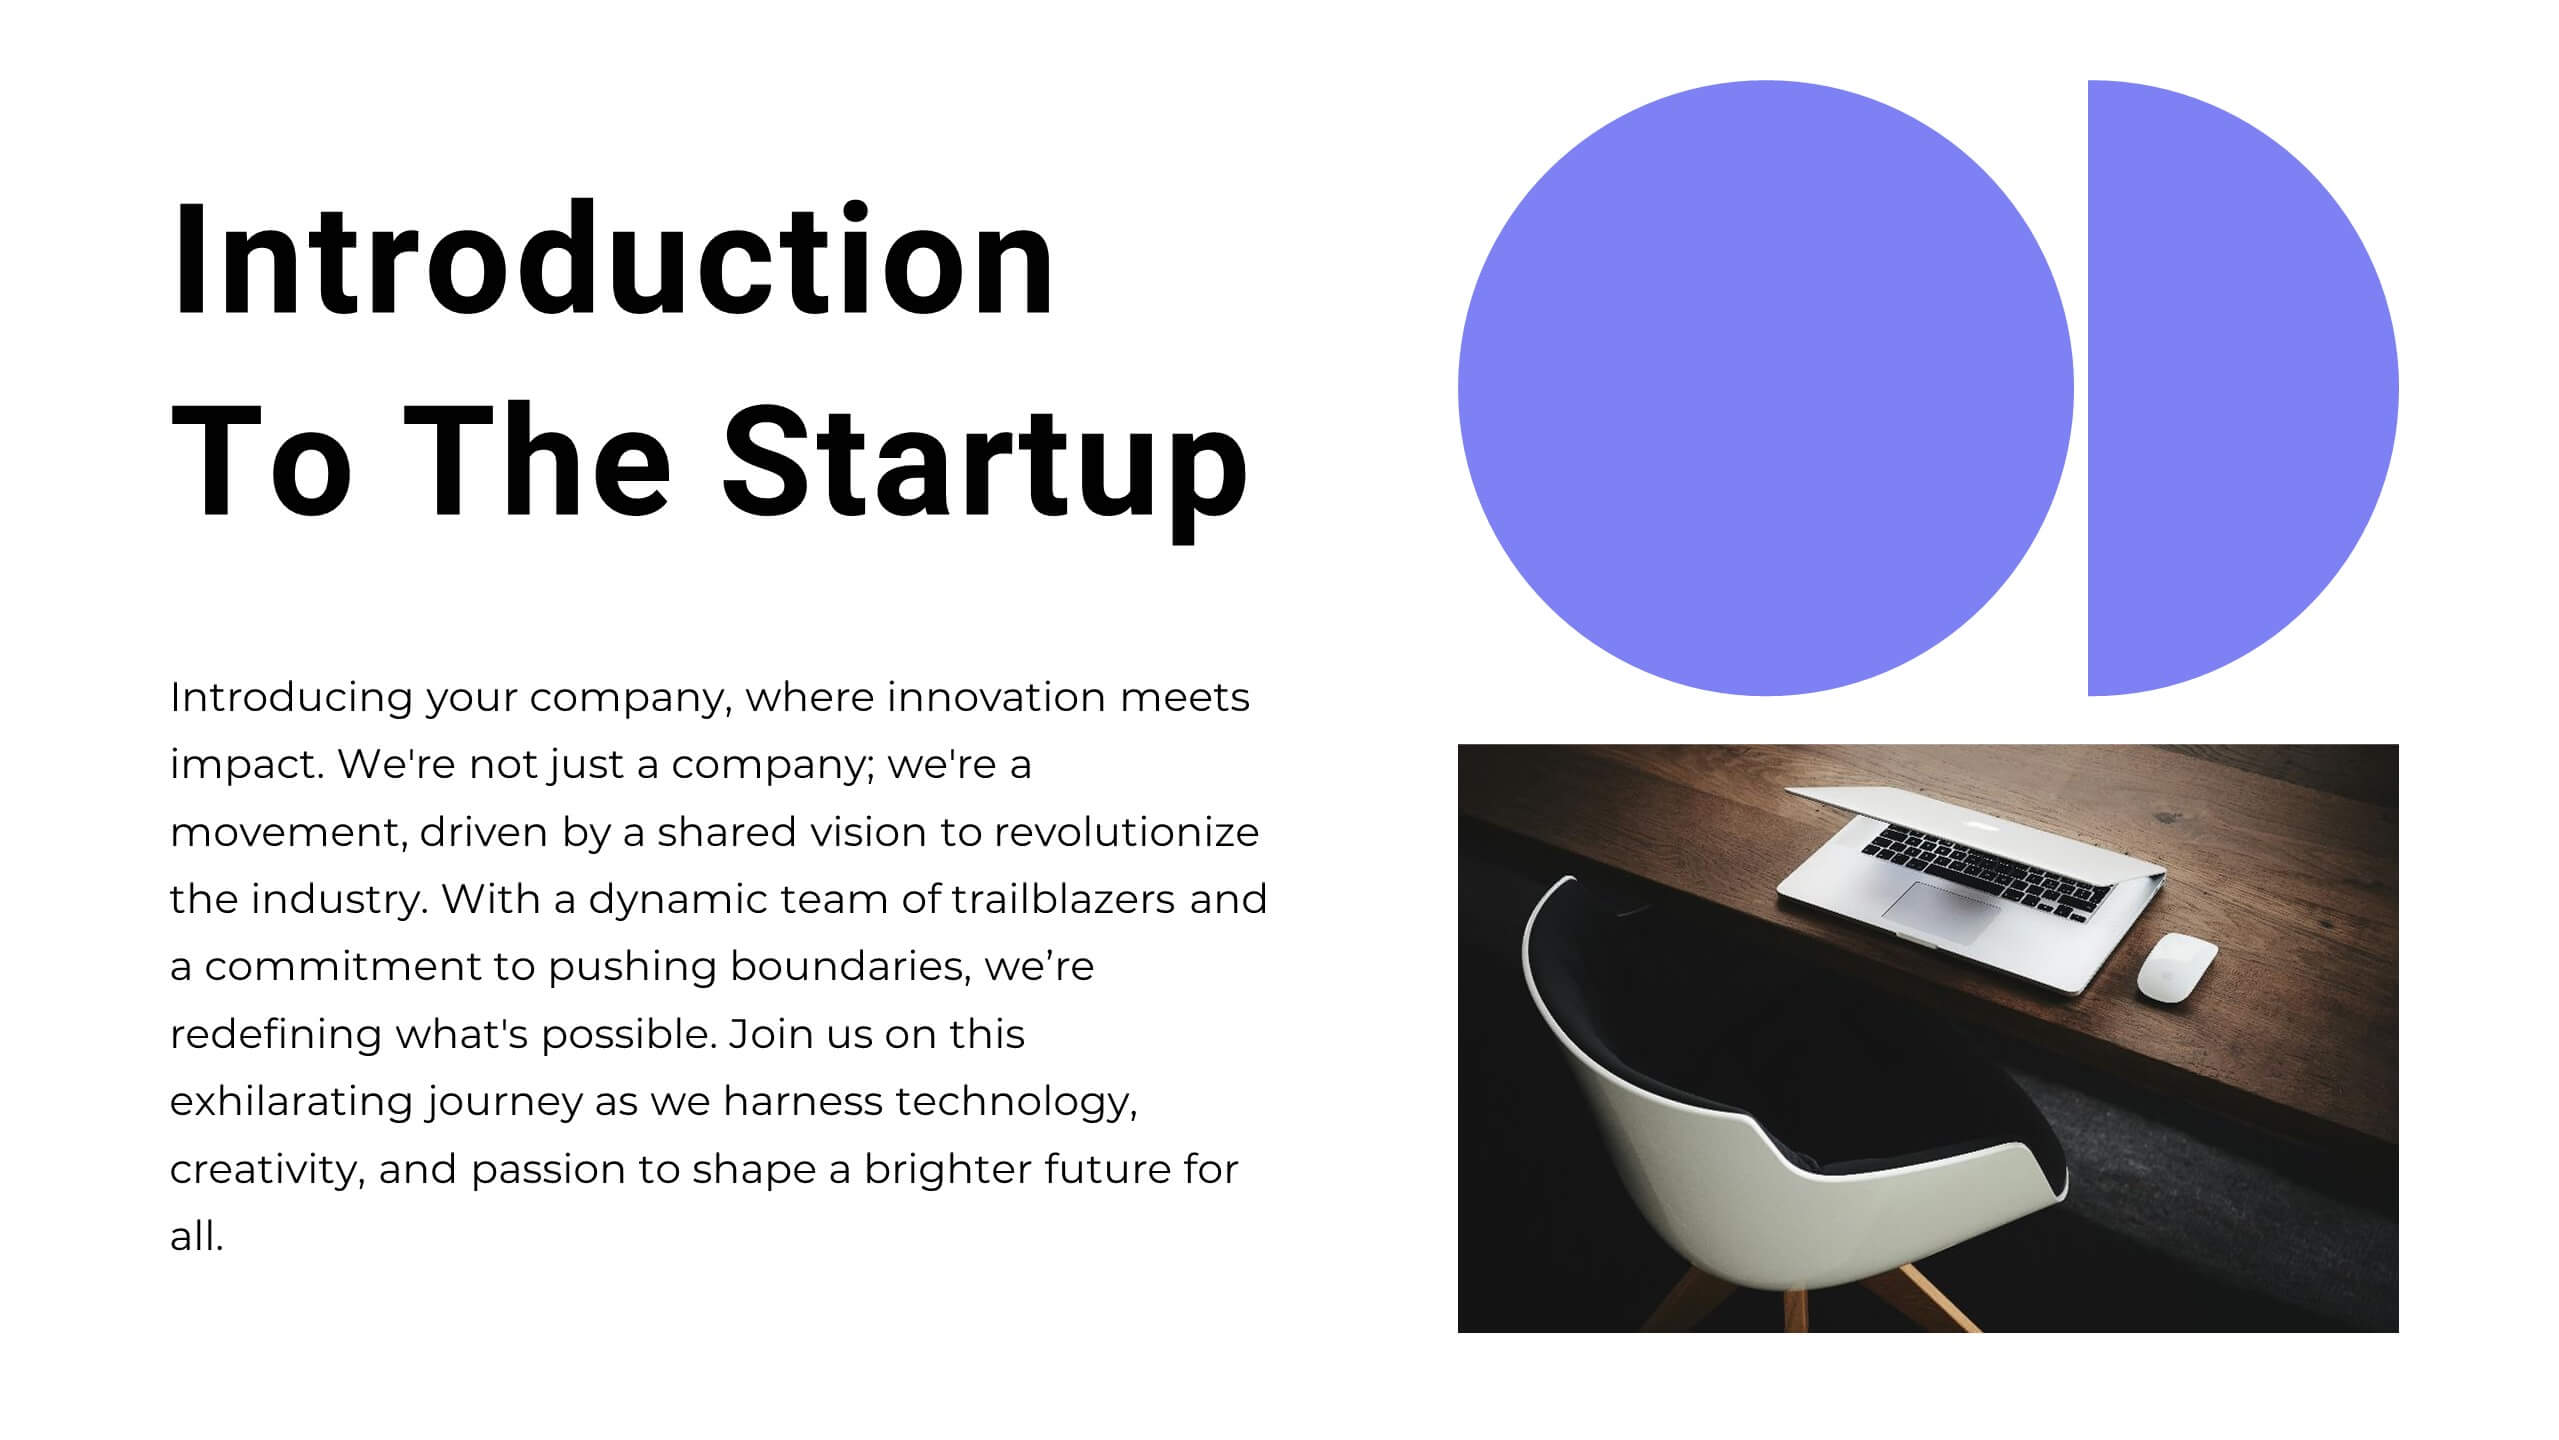
Vibrant Startup Pitch Deck Presentation
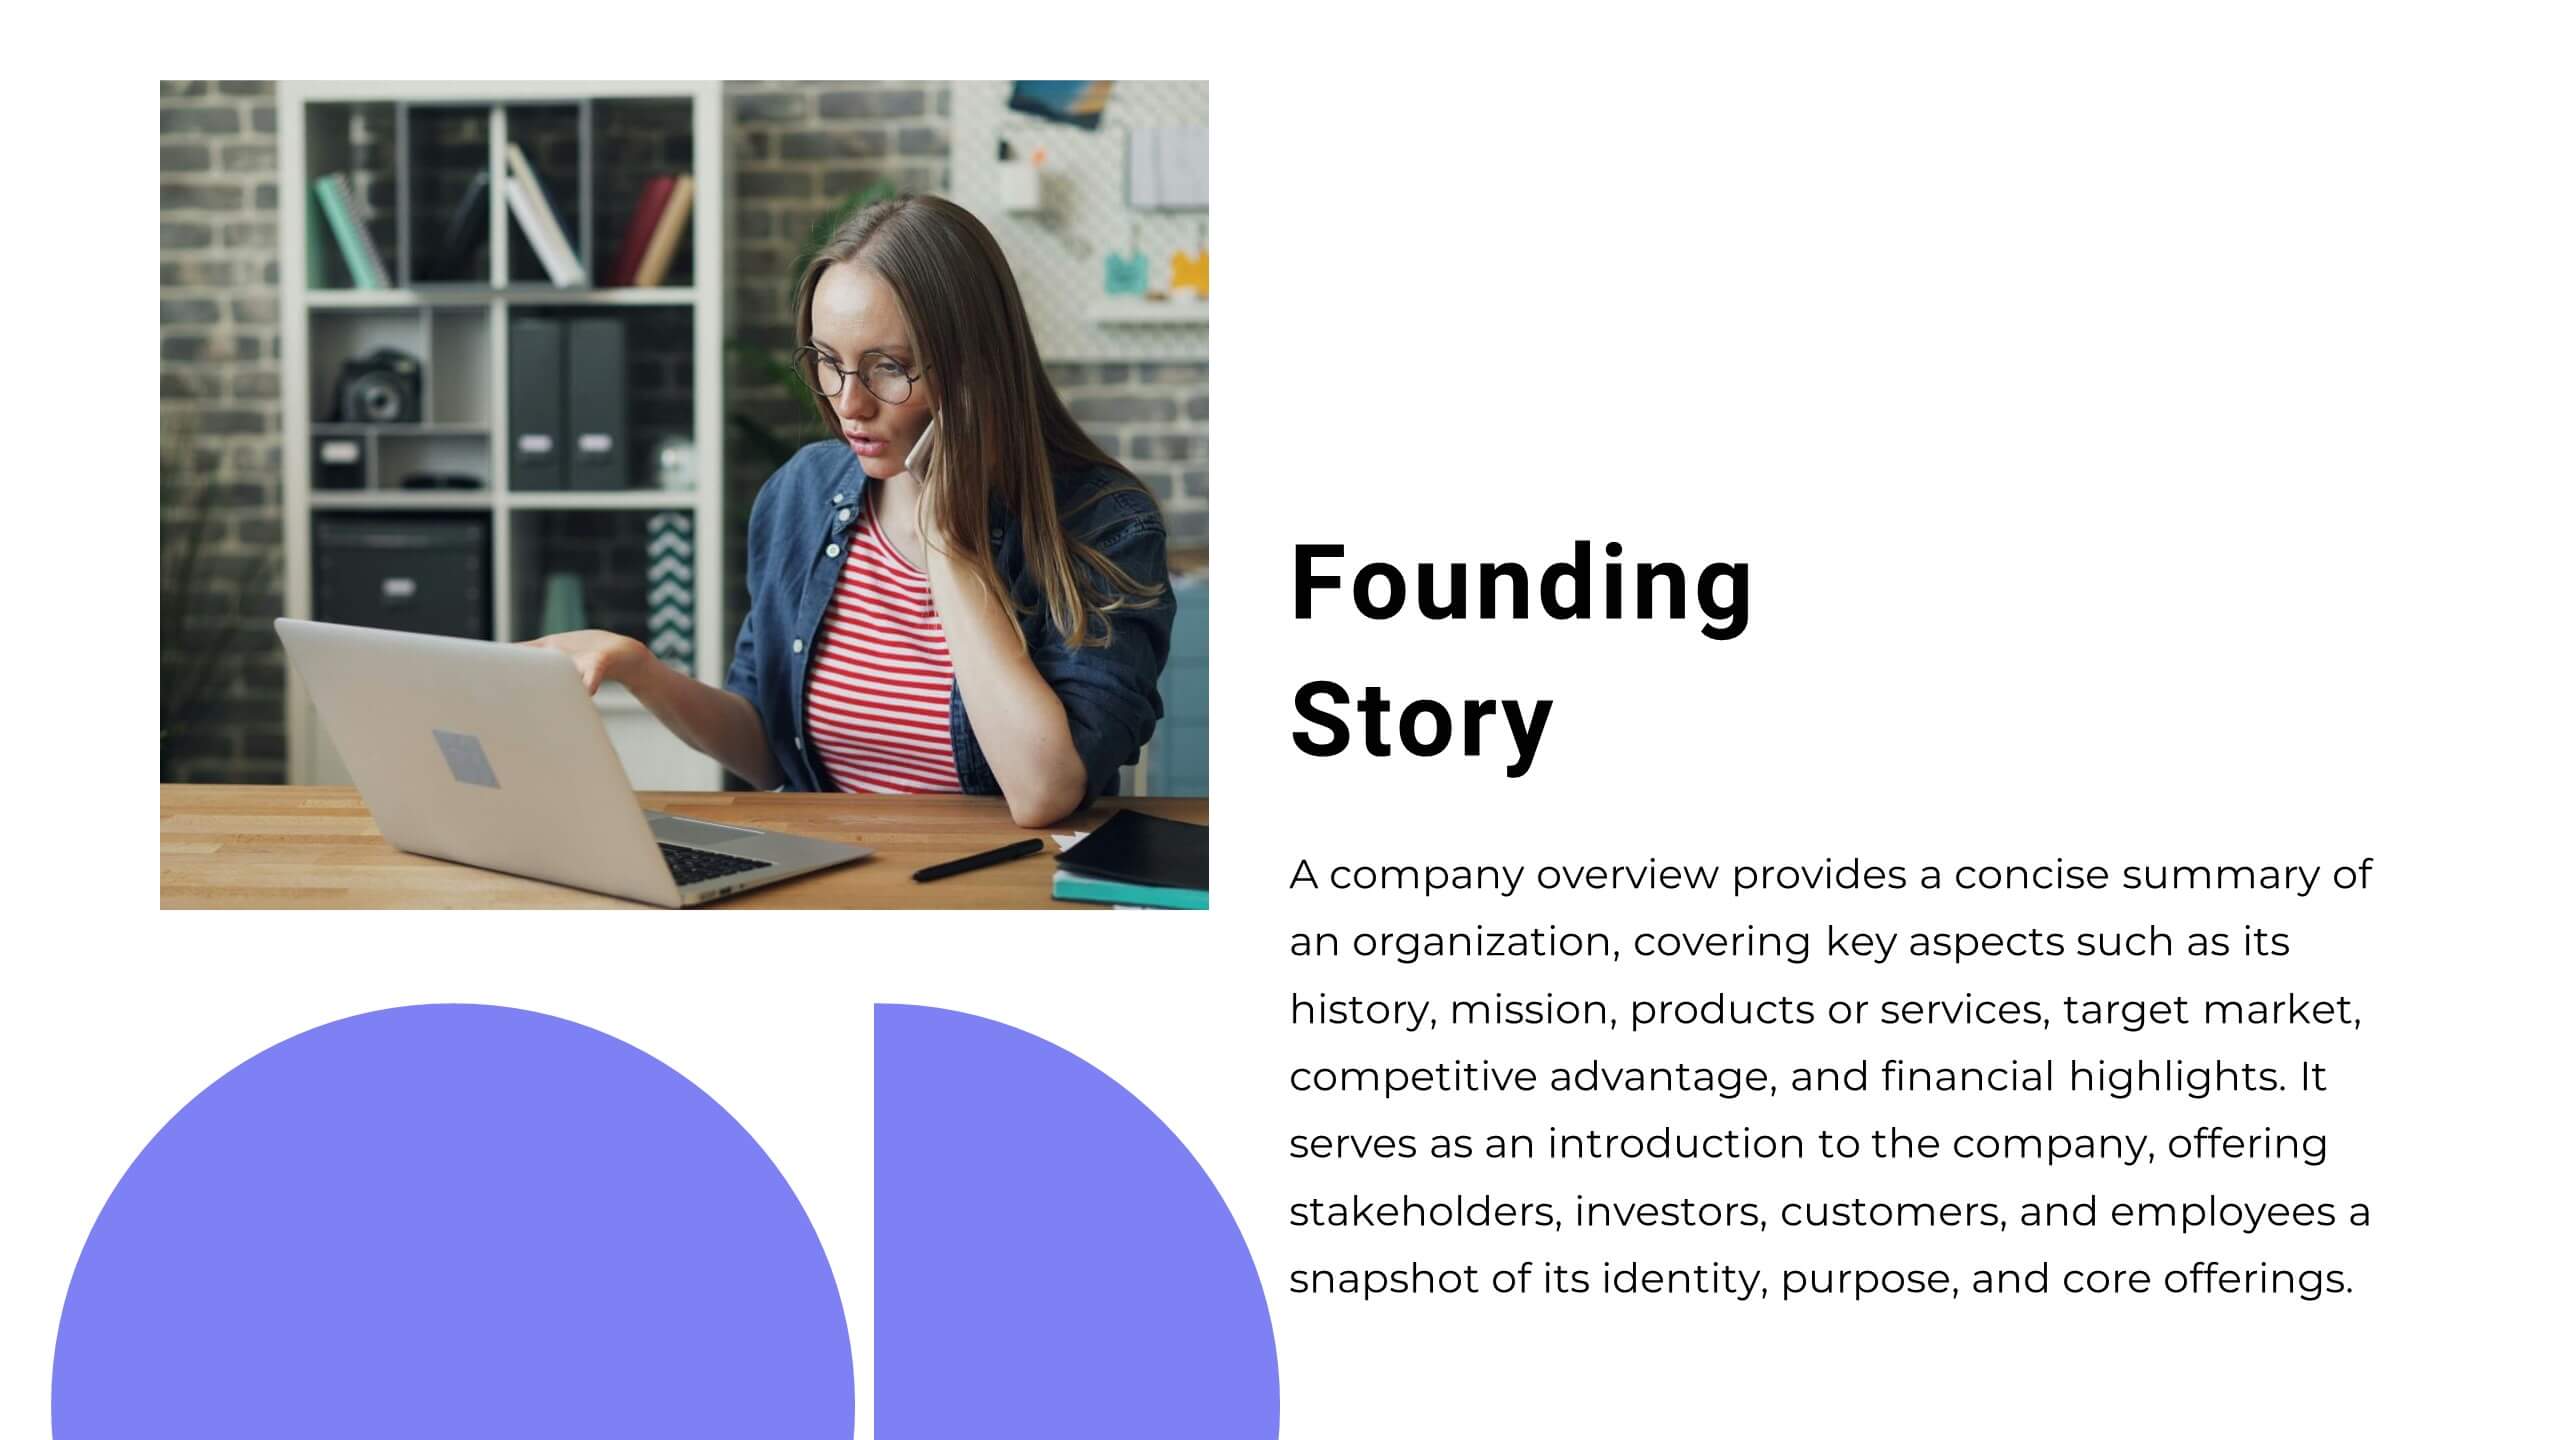
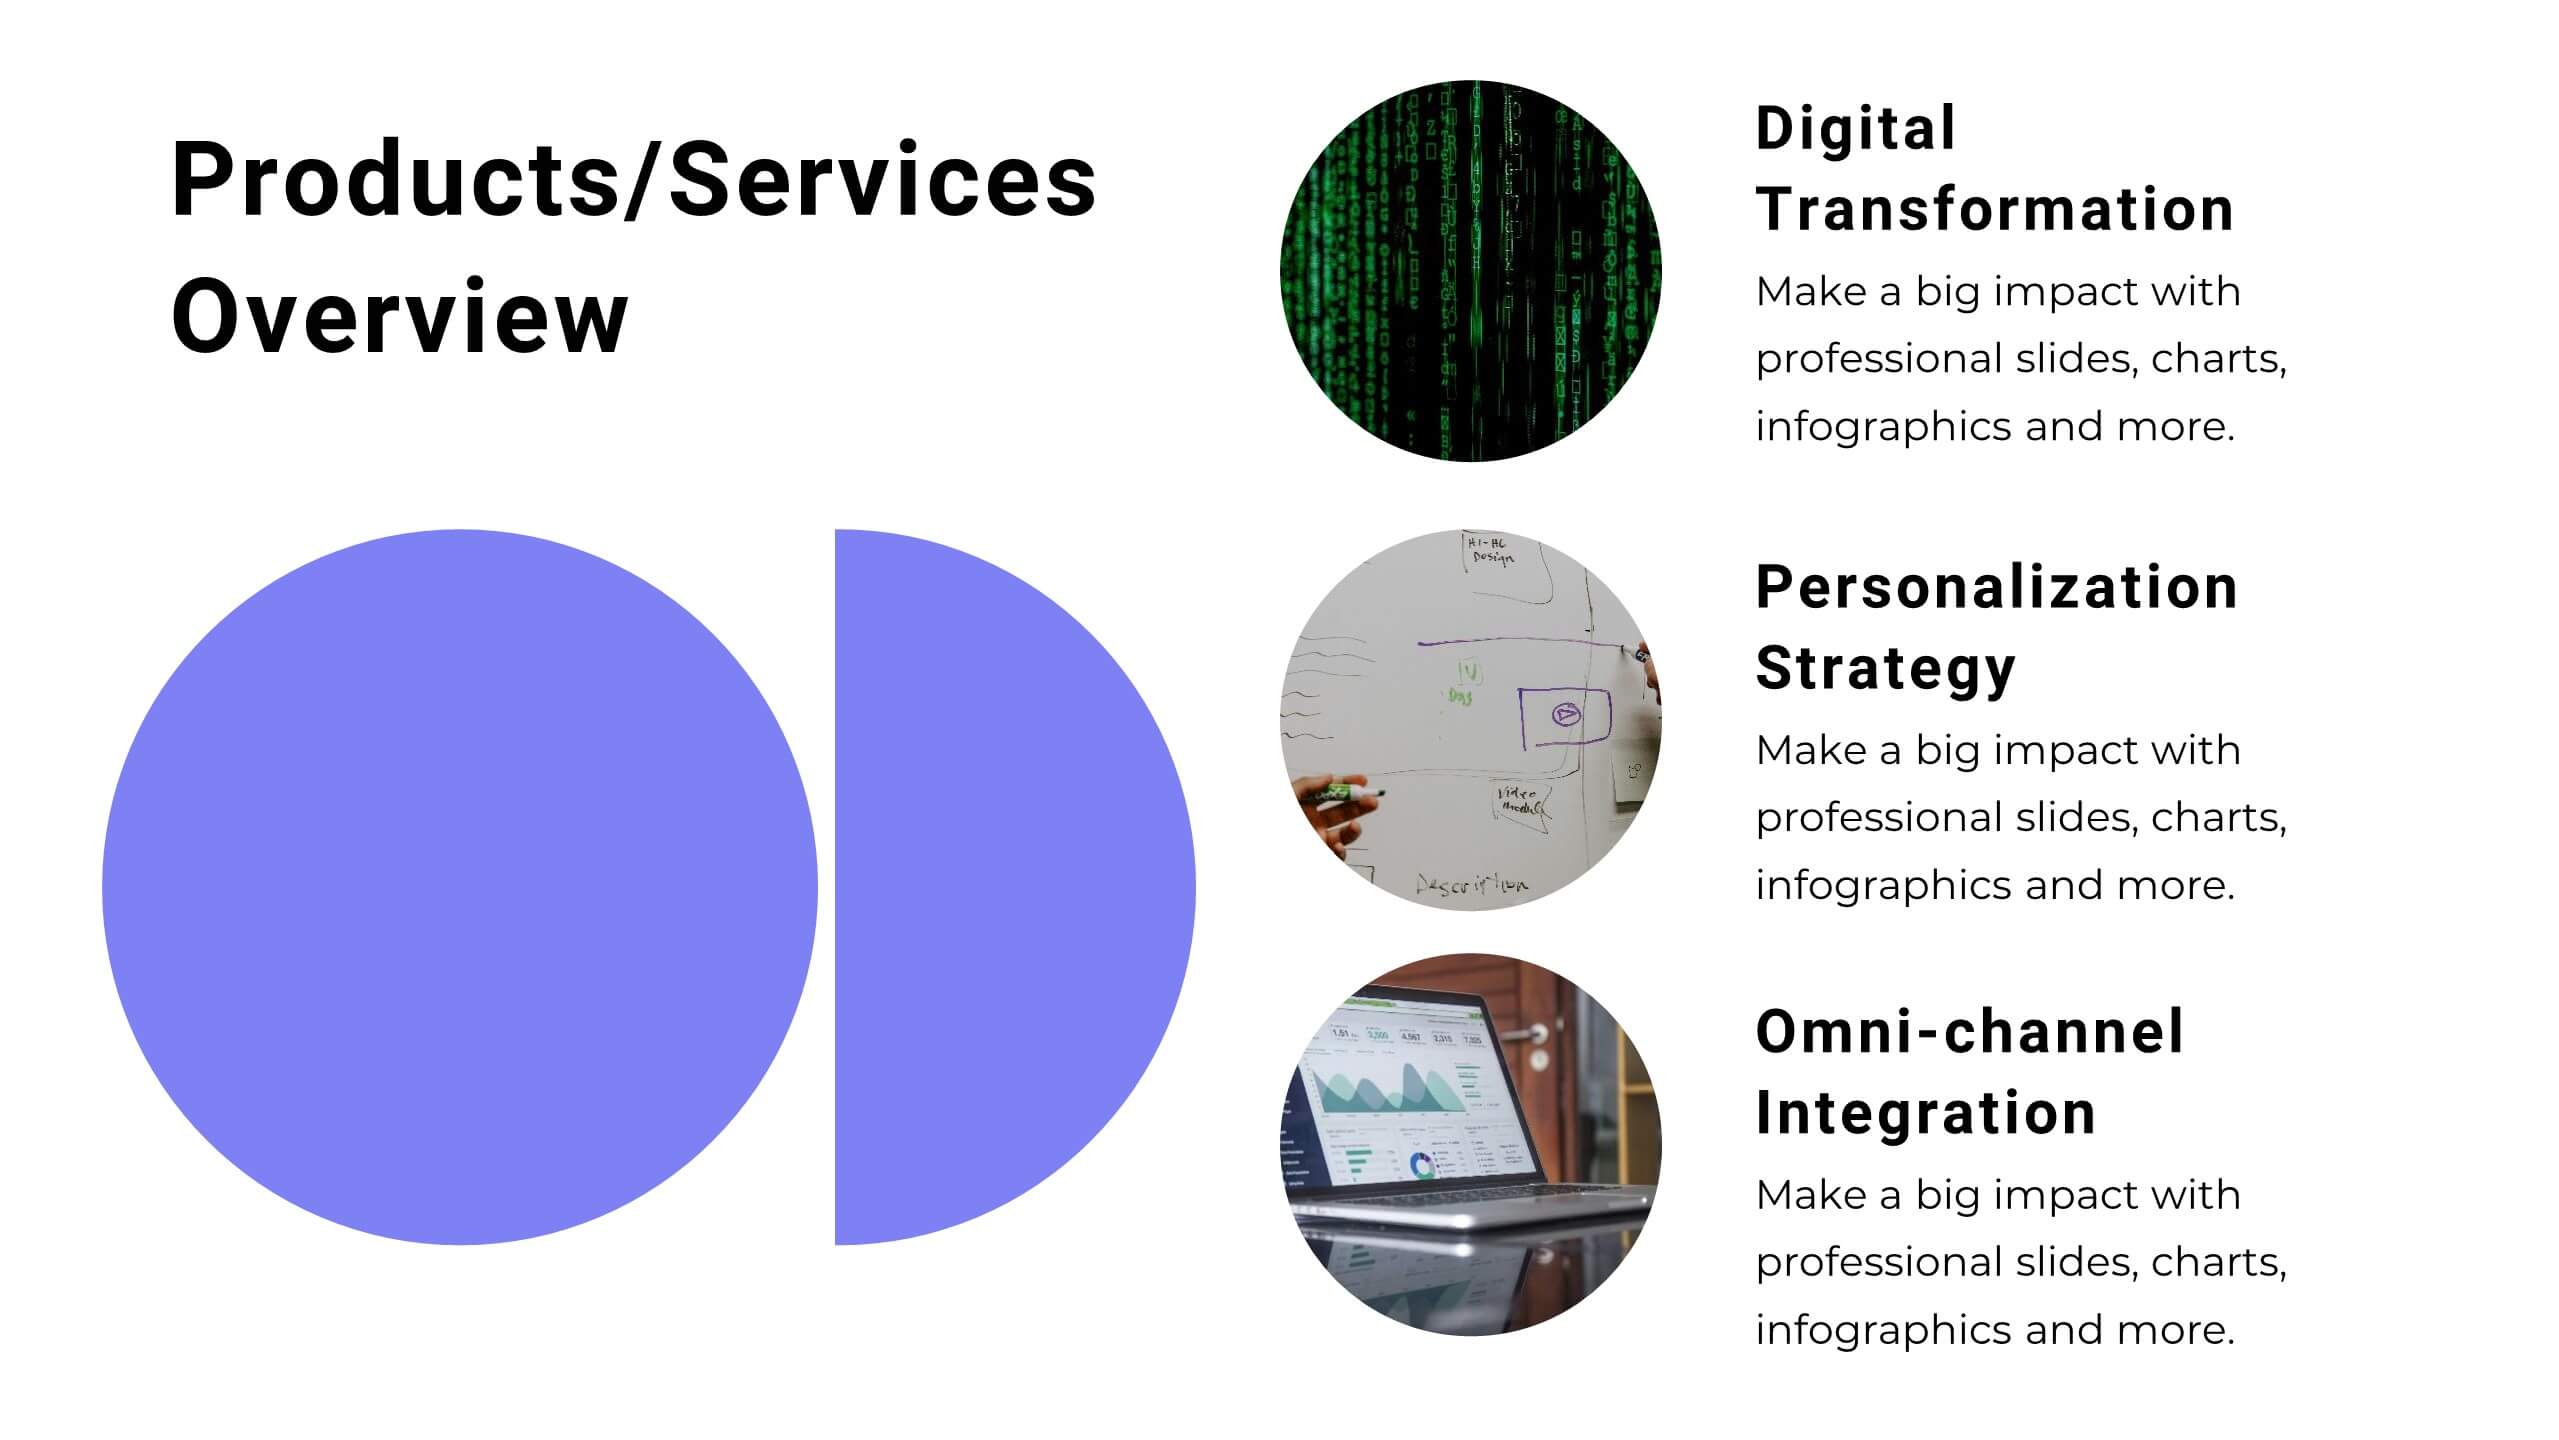
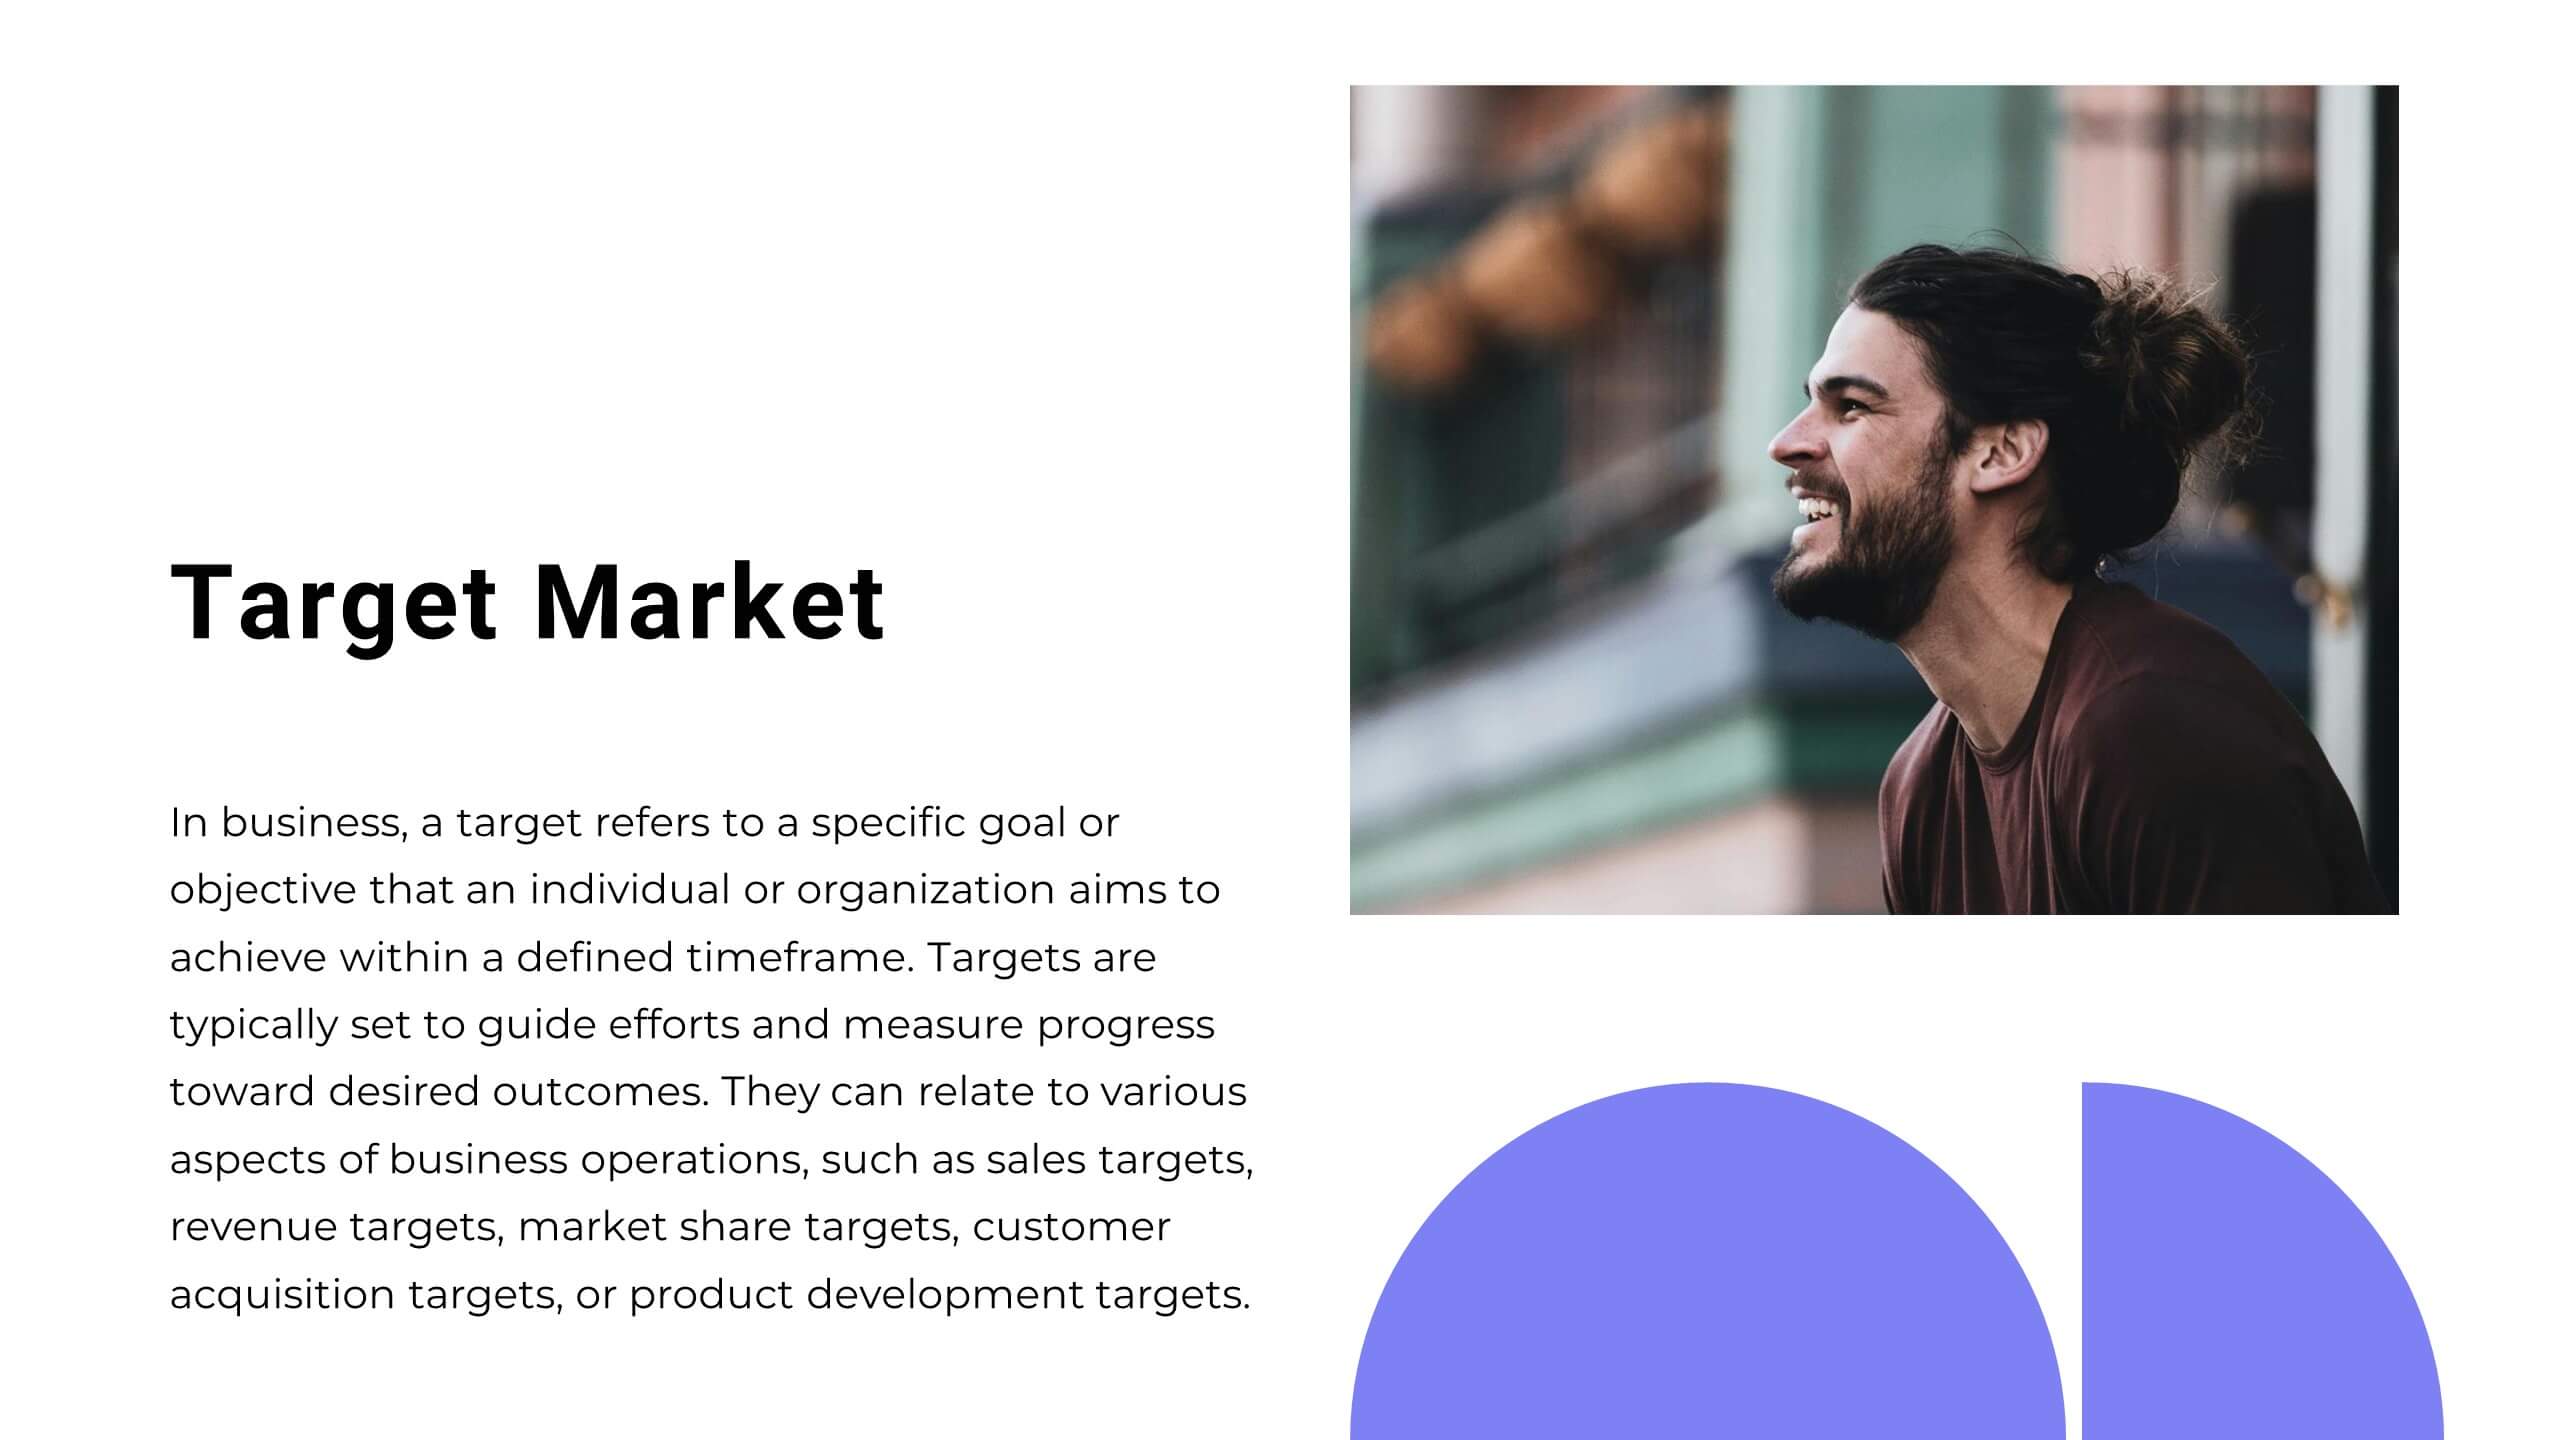
This dynamic and modern Startup Pitch Deck template is perfect for showcasing your startup's vision, strategy, and growth potential. Featuring a sleek design with bold visuals, this template guides you through key sections such as mission and vision, product/service overview, target market, and financial projections. It’s tailored to help you tell a compelling story that resonates with investors and stakeholders. The template is fully customizable in PowerPoint, Keynote, or Google Slides, ensuring you can adapt it to your specific needs and create a memorable presentation that leaves a lasting impression.


12 slides
Real Estate Business Proposal Presentation
Present your Real Estate Business Proposal with this structured and visually compelling template. Designed for real estate professionals, investors, and agencies, this slide helps communicate investment strategies, market opportunities, and property insights effectively. Fully customizable and compatible with PowerPoint, Keynote, and Google Slides for seamless editing.


20 slides
Miragyn Project Proposal Presentation
Showcase your project proposal with confidence using this visually appealing and structured template. Featuring a clear layout, it includes slides for project summaries, problem statements, and proposed solutions, allowing you to effectively communicate your vision and strategy. This template highlights essential details such as objectives and goals, timeline and milestones, and budget breakdown, making it ideal for delivering concise and impactful proposals. It also includes dedicated sections for team expertise, client testimonials, and terms and conditions, ensuring every aspect of your project is covered. Fully editable and compatible with PowerPoint, Google Slides, and Keynote, this template is perfect for professionals aiming to leave a lasting impression with their project presentations.


21 slides
Solara Business Strategy Presentation
Craft a winning plan with this comprehensive business strategy presentation! It covers essential sections like market analysis, SWOT, strategic initiatives, and performance metrics, helping you align goals and opportunities. Perfect for executive meetings or stakeholder reviews, this template ensures seamless collaboration. Fully compatible with PowerPoint, Keynote, and Google Slides.


22 slides
Glidebeam Content Marketing Pitch Deck Presentation
Capture your audience’s attention and showcase your marketing strategy with confidence using this polished and thoughtfully designed marketing pitch deck. It covers key elements like company history, target audience, competitive landscape, financial highlights, and growth strategies. Ideal for pitches or meetings, it’s compatible with PowerPoint, Keynote, and Google Slides.


7 slides
Project Management Tools Infographic
Project management is the discipline of planning, organizing, securing, and managing resources to achieve specific goals within a defined time frame and budget. This visually appealing and informative template allows you to represent project lifecycles, key milestones, team roles, and more, making complex project data easily digestible. Fully customizable and compatible with Powerpoint, Keynote, and Google Slides. Illustrate the project lifecycle from initiation to completion for a comprehensive understanding. Utilize this template to effectively show project progress and objectives, ensuring your audience is informed throughout the project's lifecycle.


7 slides
Company Profile History Infographic
This collection of templates is meticulously designed to detail a company's historical growth and significant milestones, ensuring that stakeholders can grasp the evolution and achievements of the business effectively. Each template varies in design, from sleek, minimalistic layouts to more robust, data-intensive presentations, making it versatile for different corporate needs and preferences. Included features range from detailed timelines and milestone markers to percentage breakdowns, which not only aid in visualizing the company's journey but also emphasize important events such as key product launches, expansion milestones, and significant shifts in company strategy. Additionally, these templates allow for customization, including the ability to incorporate company-specific branding elements like logos, color schemes, and typography. Ideal for shareholder meetings, investor pitches, and internal strategy discussions, these templates serve as a powerful tool for companies to showcase their historical context, financial growth, market expansion, and customer engagement over the years, aligning past achievements with future goals in a clear and structured format.


7 slides
Medical Care Infographic Presentation
A medical infographic is a visual representation of information related to medicine, health and healthcare. This infographic design can help people understand complex topics and communicate more effectively about science. This medical infographic template features a dynamic background image, along with a visual representation of information related to healthcare. It is a great way to promote your health-related content. This infographic is a great tool to provide patients with a breakdown of information. This template is compatible with Powerpoint, Keynote and Google Slides.