


Features
- 5 Unique slides
- Fully editable and easy to edit in Microsoft Powerpoint, Keynote and Google Slides
- 16:9 widescreen layout
- Clean and professional designs
- Export to JPG, PDF or send by email


Do you have any questions?
Recommend


7 slides
College Schedule Infographic Presentation
A College Schedule infographic is a visual representation of a typical college schedule, which includes classes, extracurricular activities, and other commitments. This template can be used to help students plan and organize their time effectively, ensuring that they can balance their academic and personal responsibilities. This infographic includes weekly timed schedules in table and chart formats to present the schedules in a clear and easy to understand way. This template is a helpful tool for college students looking to manage their time effectively and balance their various tasks.


4 slides
Corporate Governance Structure and Rules Presentation
Define leadership roles, responsibilities, and oversight with the Corporate Governance Structure and Rules Presentation. This minimalist bar-style layout is perfect for illustrating hierarchical influence, compliance levels, or board member functions. Each section can be fully edited to align with your company’s governance model, helping stakeholders visualize how power and accountability are distributed. Ideal for board meetings, corporate compliance reports, or executive briefings. Fully compatible with PowerPoint, Google Slides, and Keynote.


7 slides
Tree Branch Diagram Infographic
The Tree Branch Diagram Infographic is a versatile template designed to showcase hierarchical information and relationships between different categories or levels of data. Its tree-like structure branches out from a central idea, making it ideal for visualizing organizational structures, decision trees, or classification systems. Each branch represents a unique segment of information, which can be further divided into sub-categories, providing a clear and comprehensive view of complex data. The design is user-friendly and adaptable, suitable for use in PowerPoint, Google Slides, and Keynote presentations.


5 slides
Process Improvement Using Five Steps Framework Presentation
Visualize progress with clarity using the Process Improvement Using Five Steps Framework Presentation. This stepped layout helps you illustrate sequential actions, milestones, or improvements across five stages. Ideal for strategy, operations, or performance initiatives. Easy to customize in PowerPoint, Keynote, Google Slides, and Canva to fit your workflow needs.


4 slides
Future-Focused Business Vision Planning Presentation
Plan ahead with clarity using the Future-Focused Business Vision Planning infographic. This 4-step layout helps you outline long-term goals, strategic milestones, and action points in a visually structured format. Perfect for business roadmaps, planning decks, and executive briefings. Fully editable in Canva, PowerPoint, and Google Slides.


20 slides
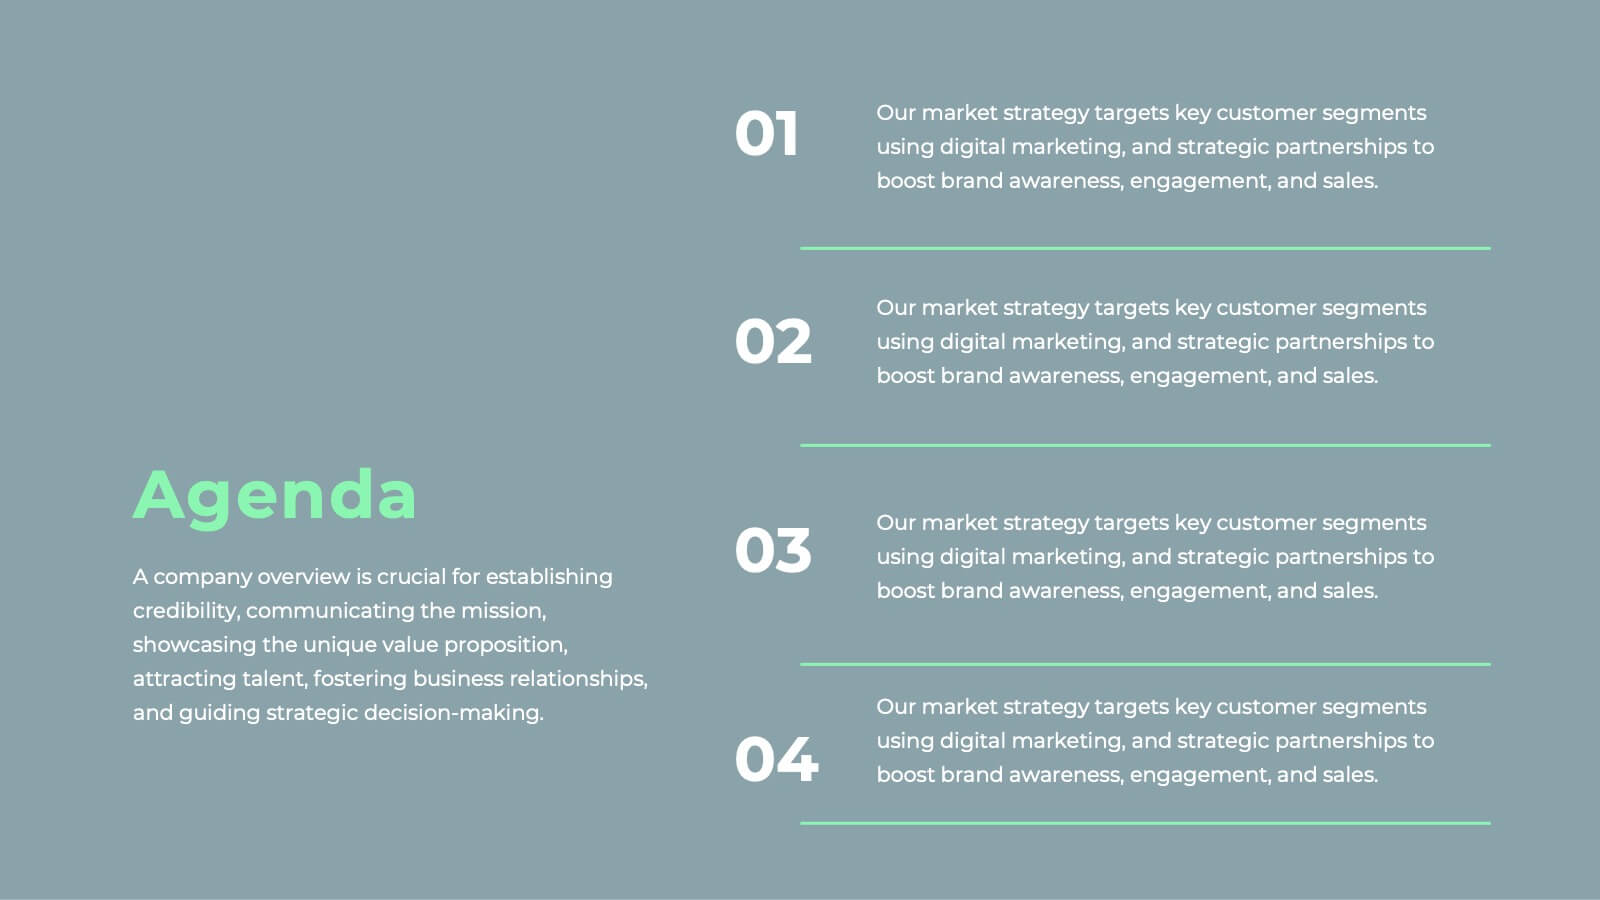
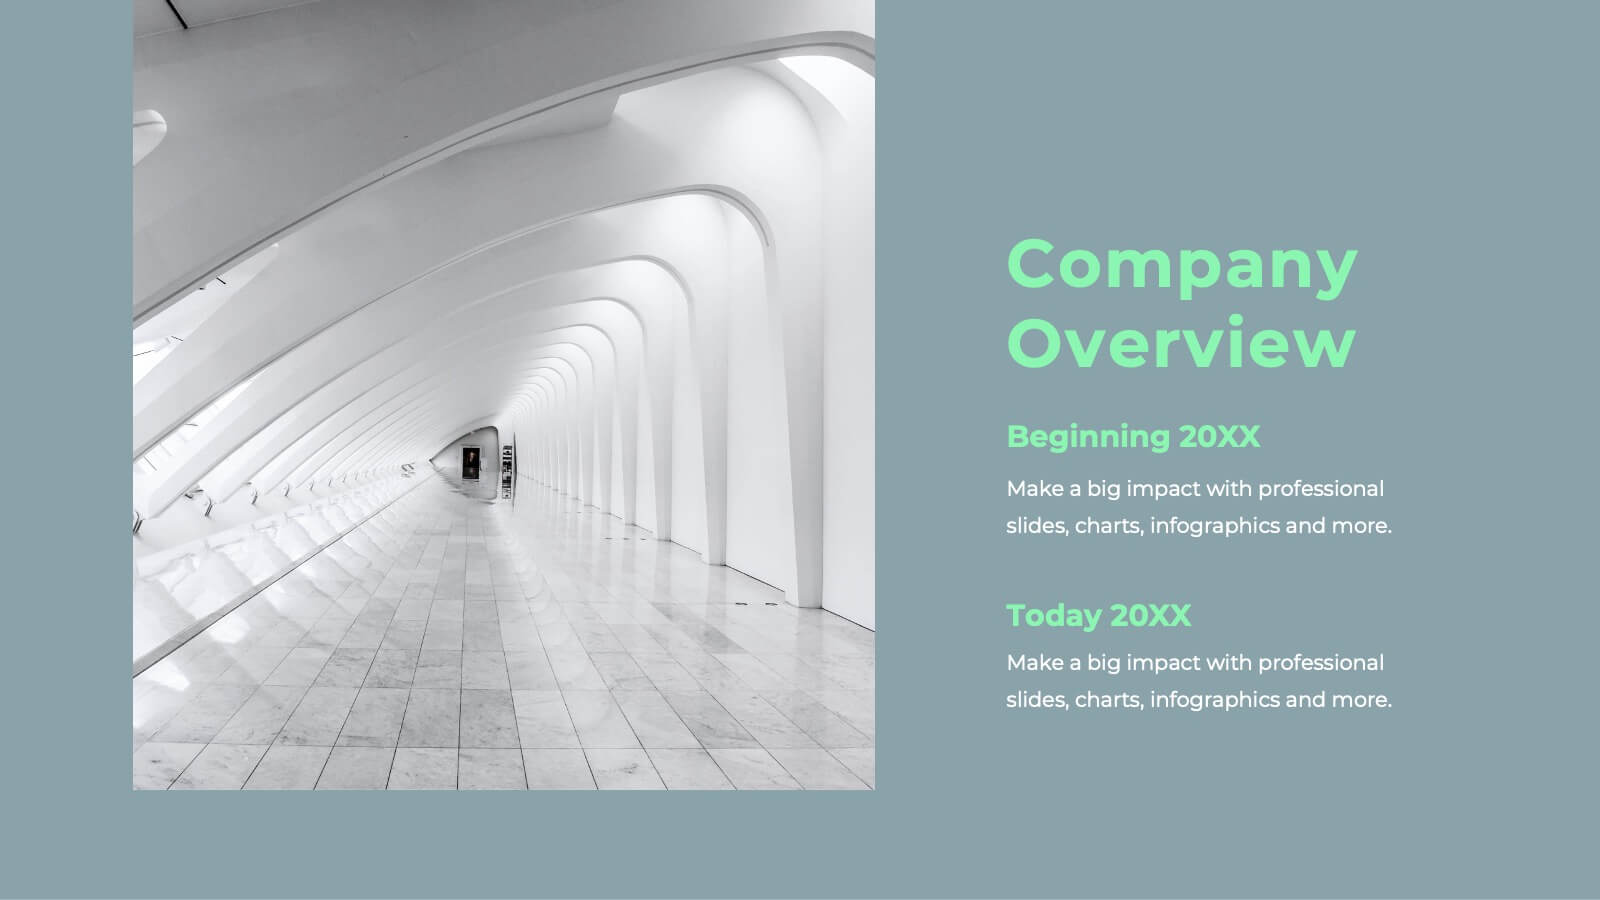
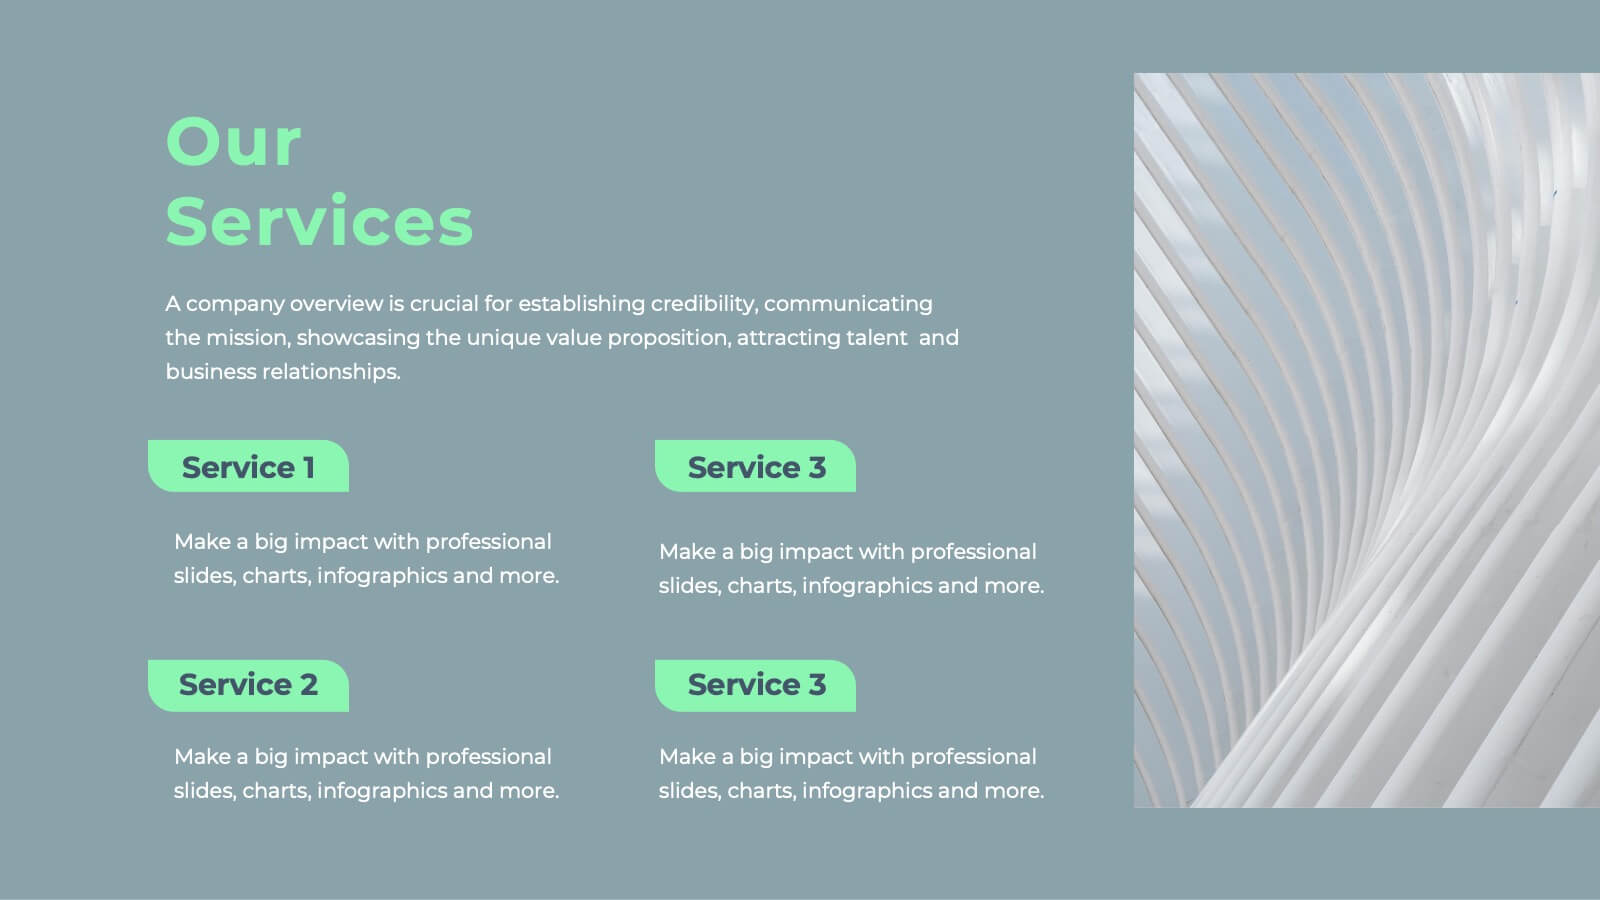
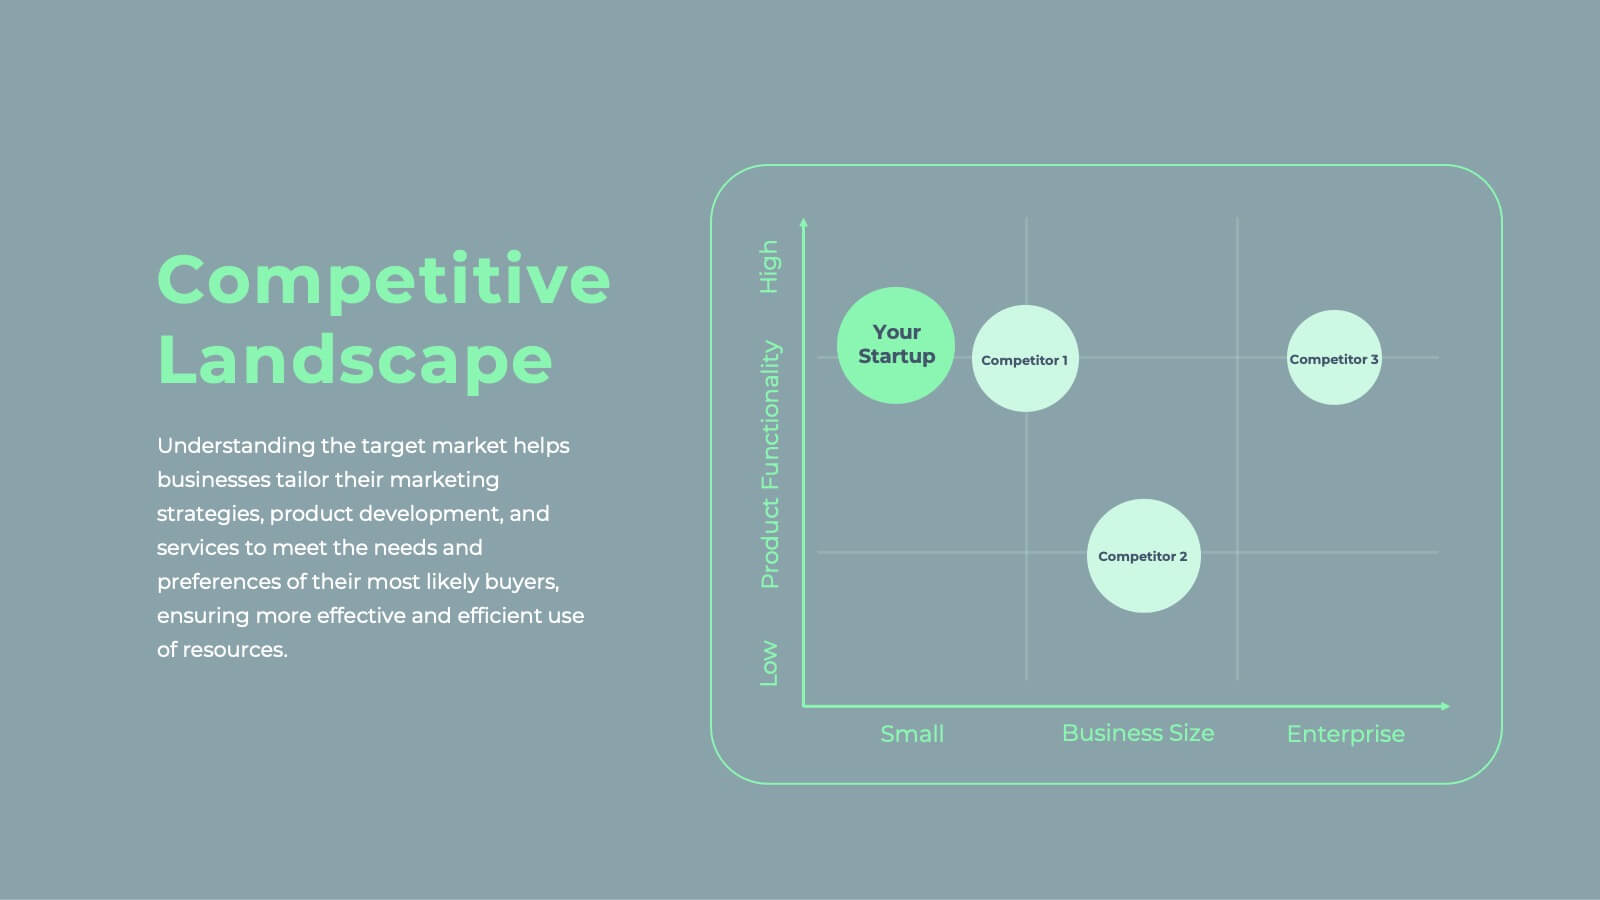
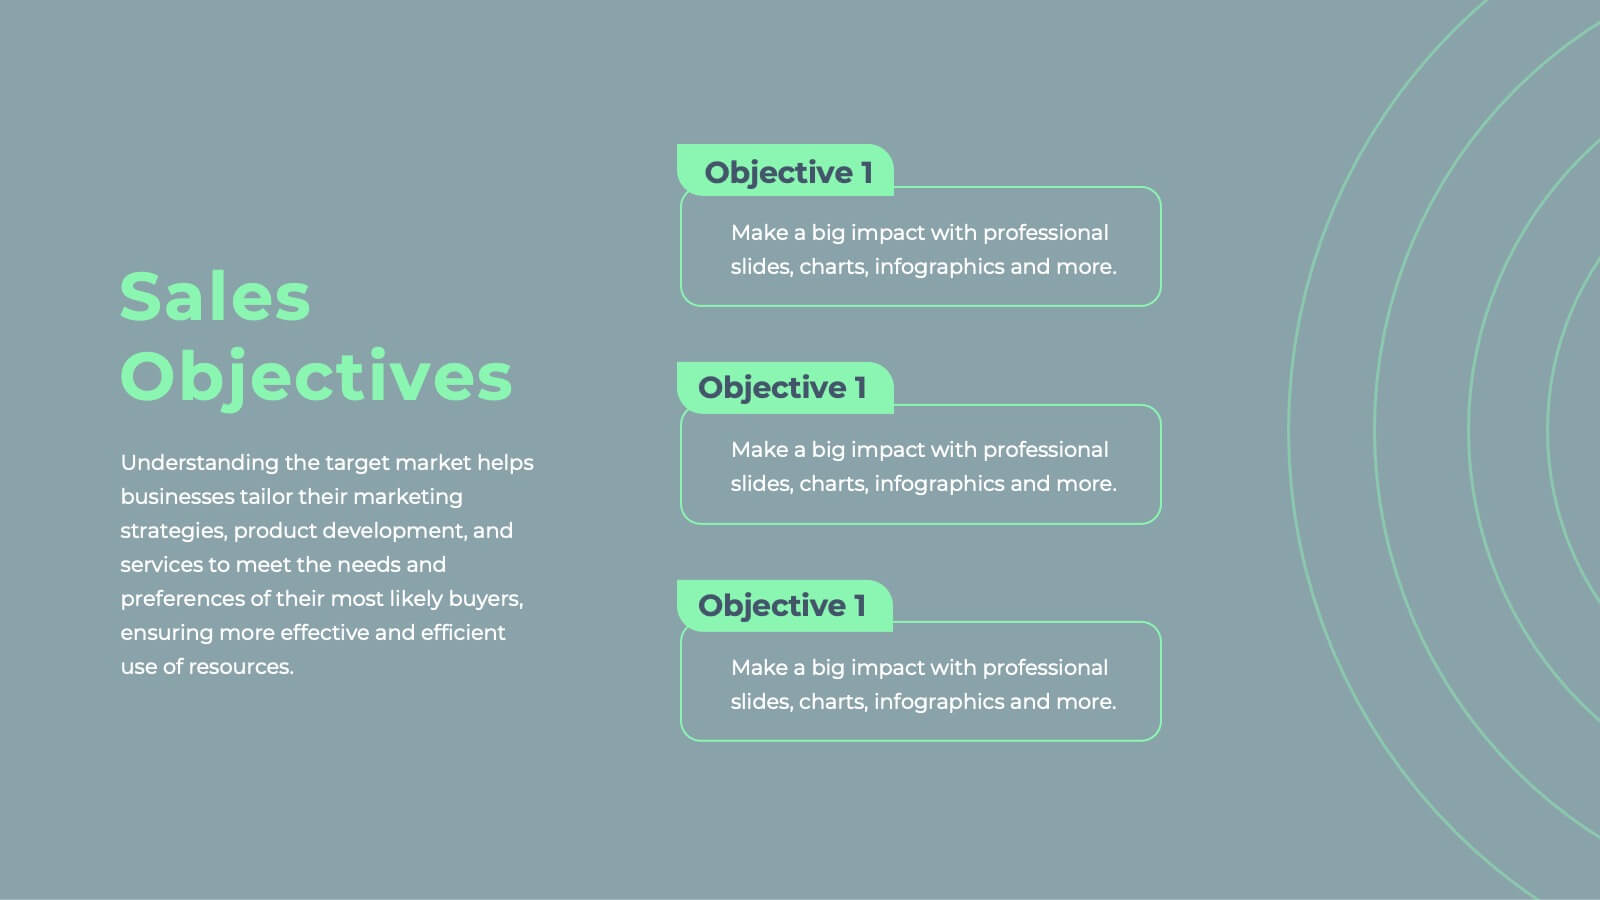
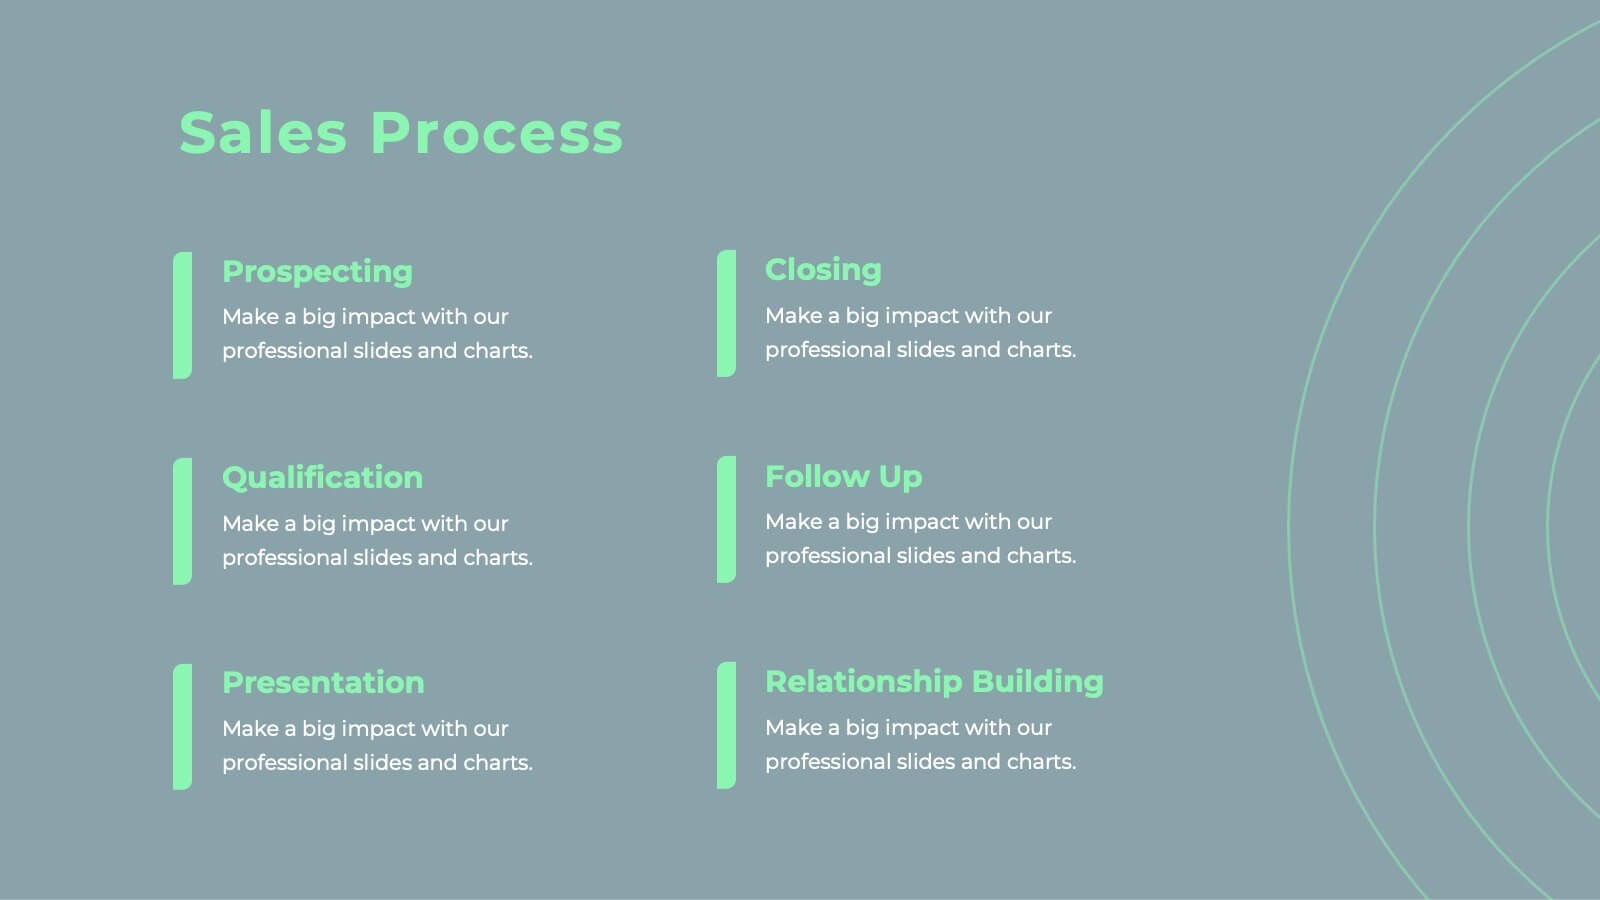
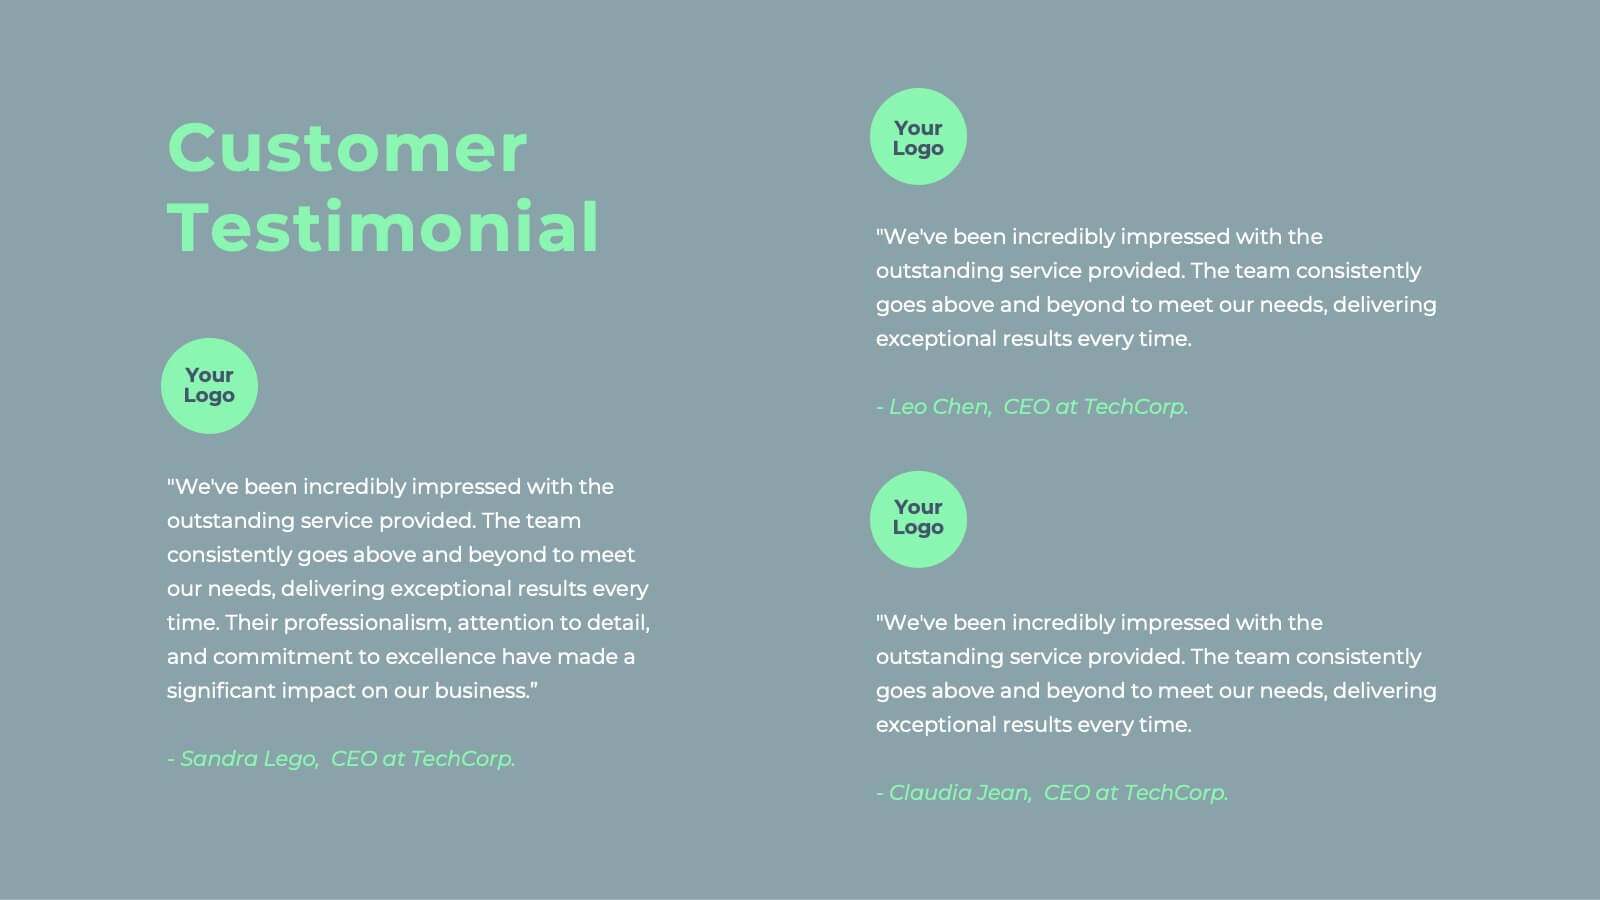
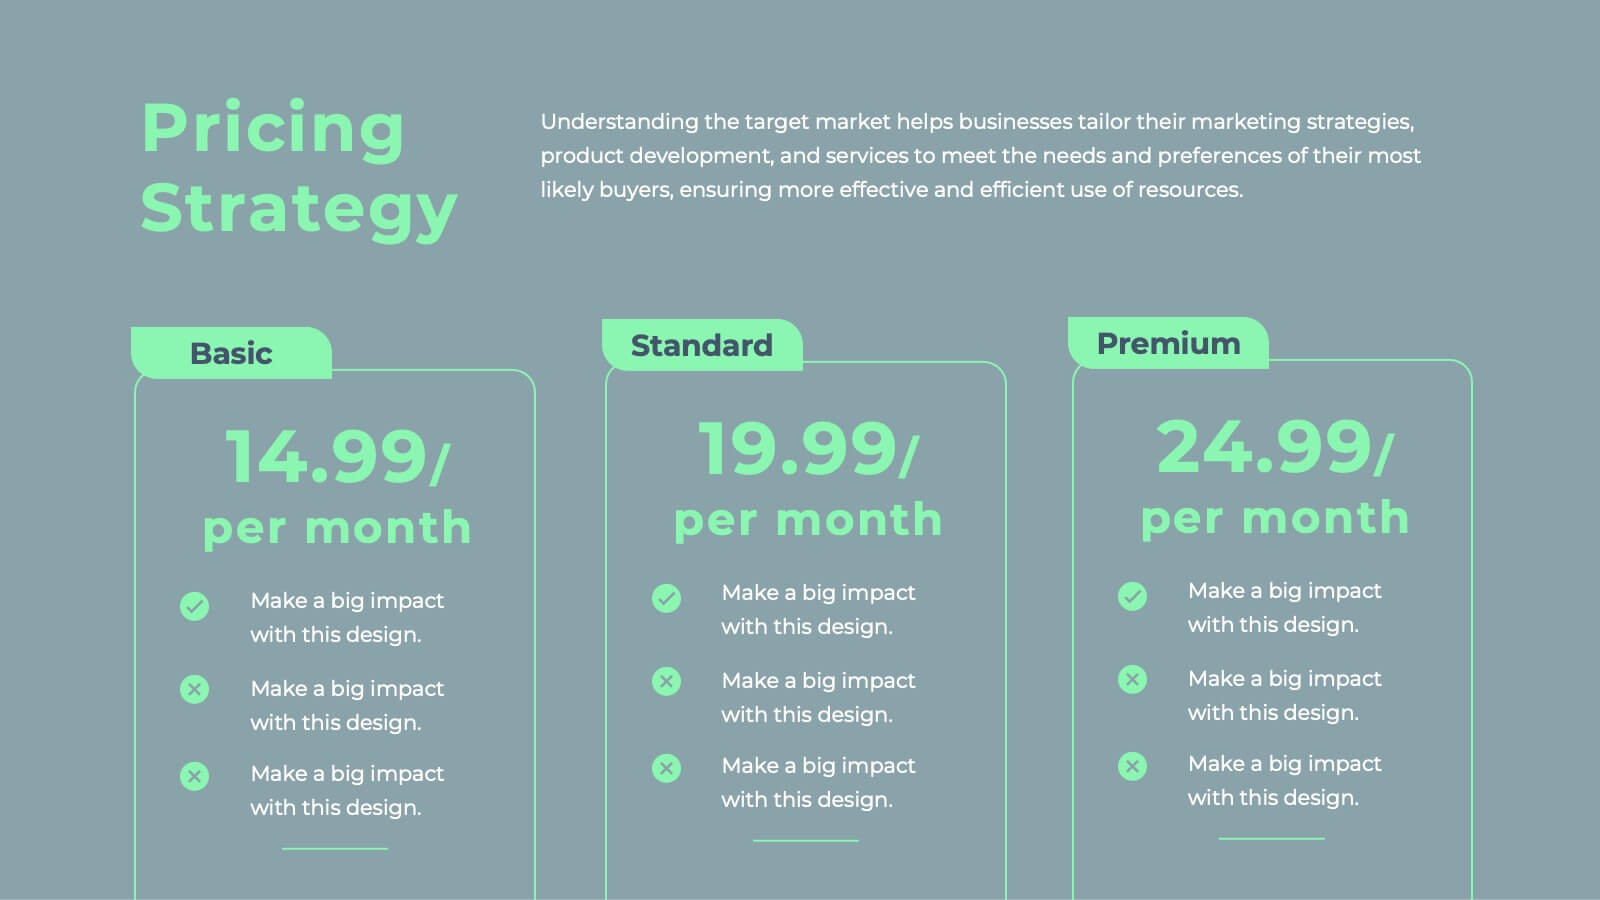
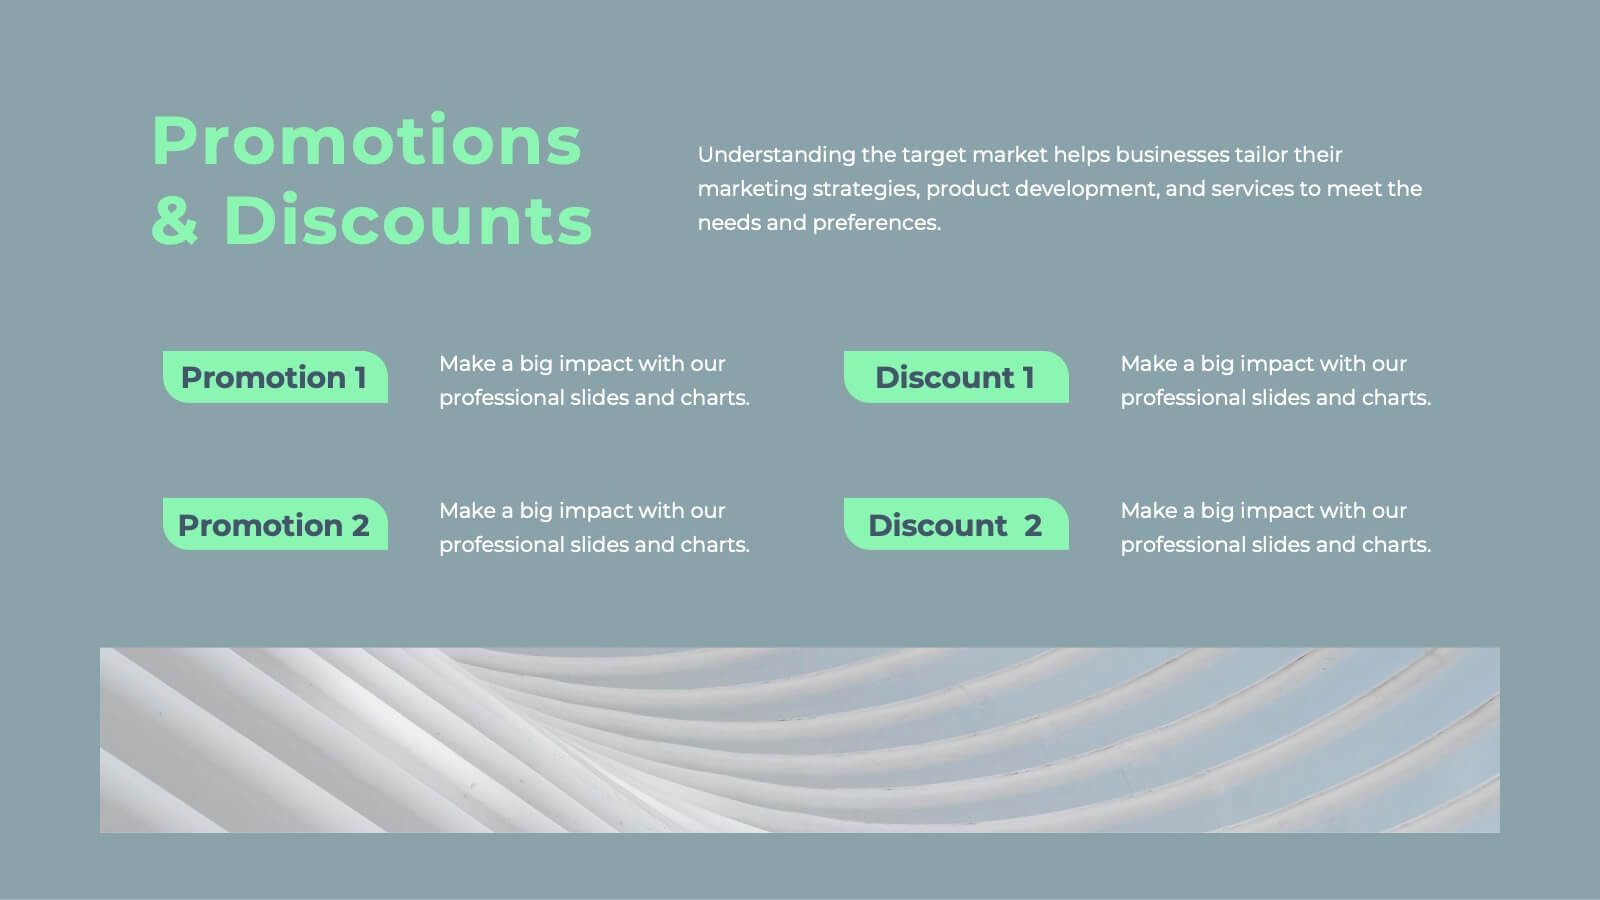
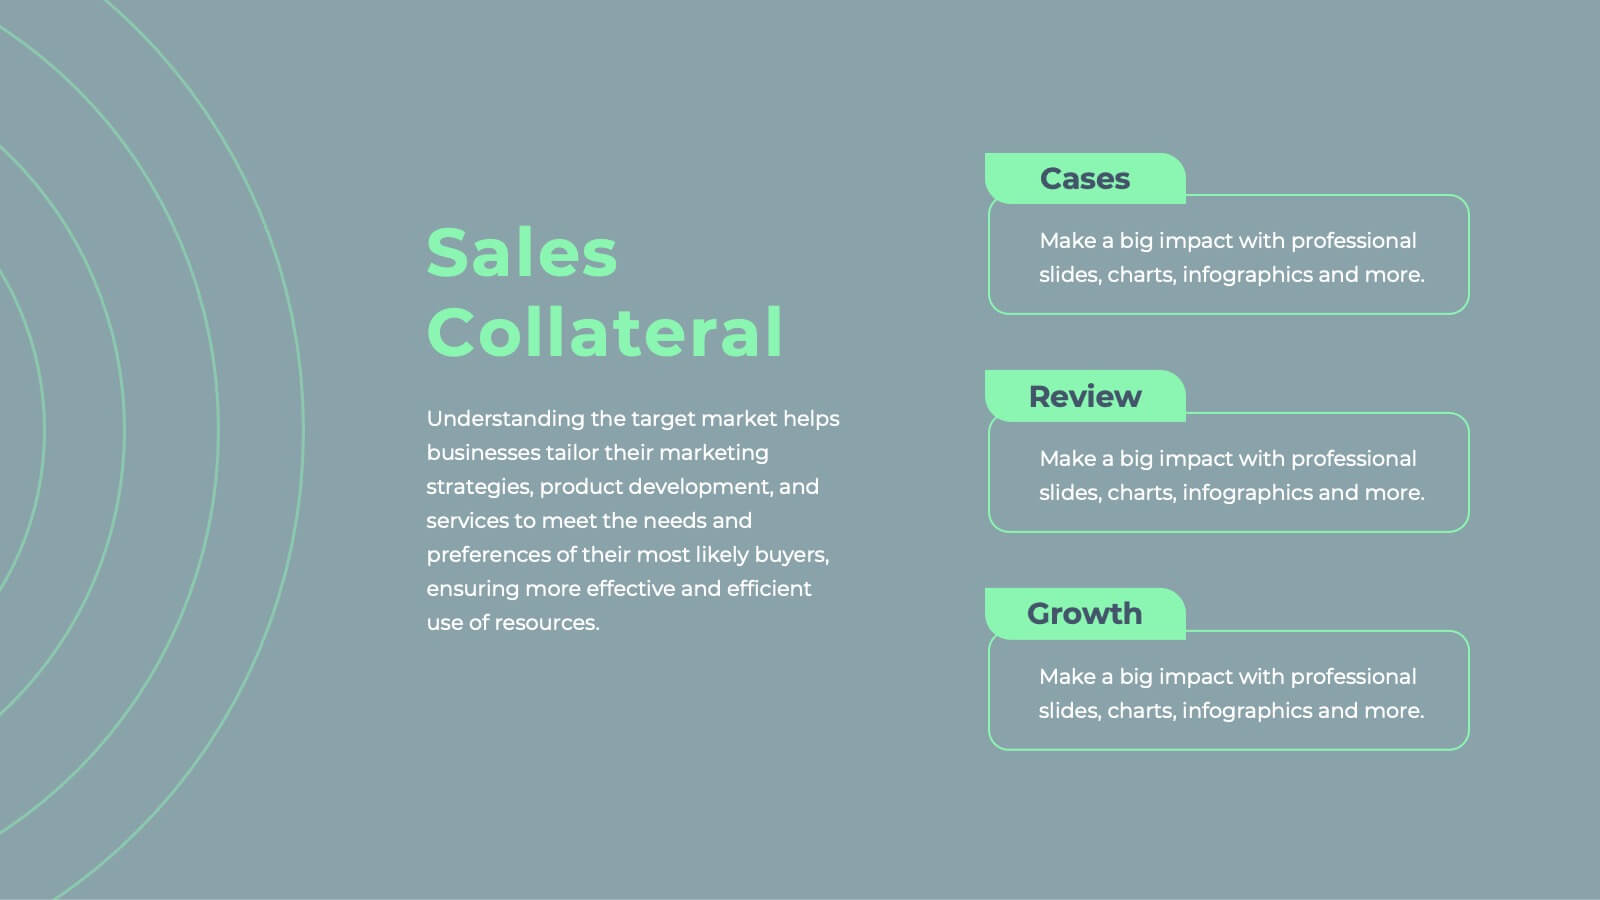
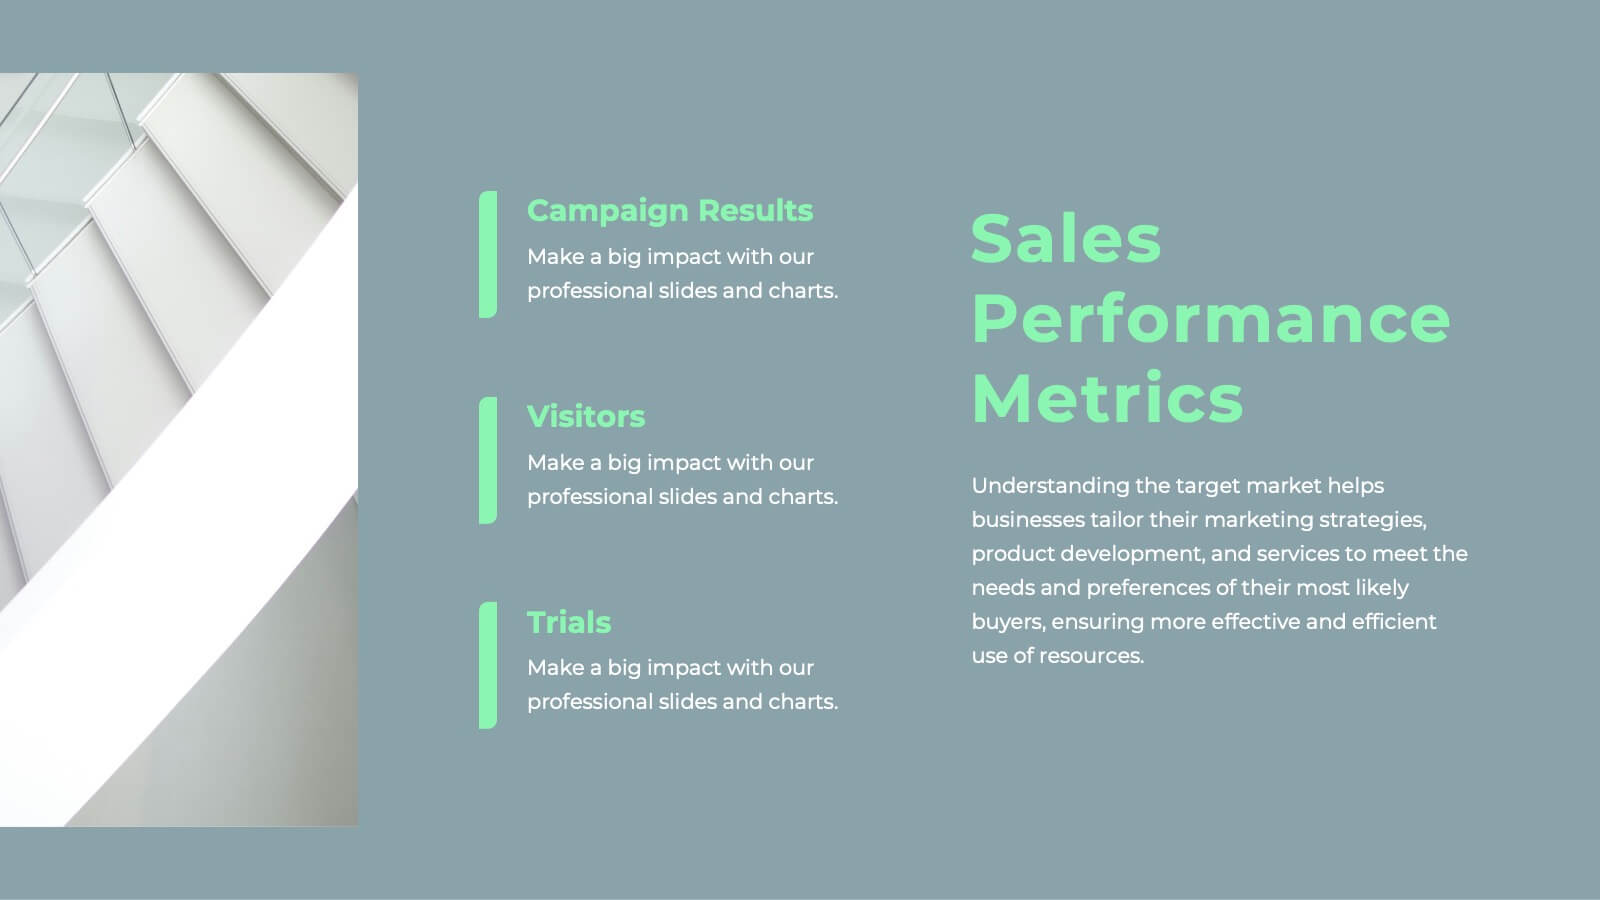
Javelin Sales Strategy Presentation
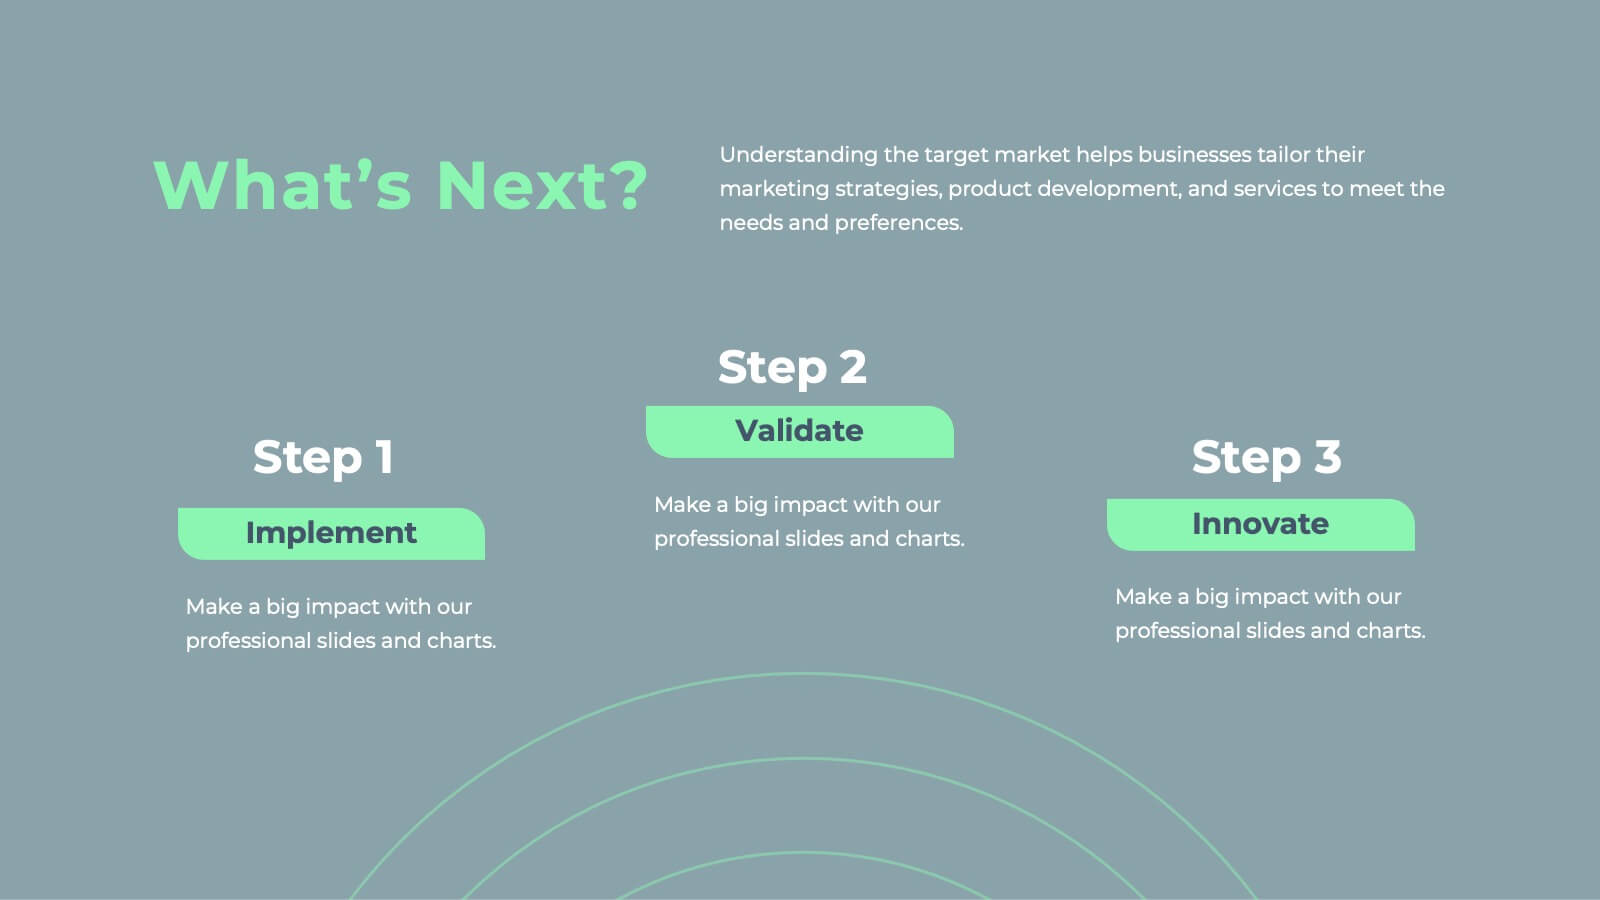
Boost your sales strategy with this sleek template! Perfect for outlining objectives, processes, performance metrics, and future opportunities. Tailored for impactful presentations to clients and teams. Fully customizable and compatible with PowerPoint, Keynote, and Google Slides.


7 slides
Budget Forecasting Infographic Presentation Template
The process of budget forecasting consists of estimates and analysis. By projecting future revenue and expenses you can plan for the future of your business. This technique aims to provide a quantitative assessment of an organization's financial position at a specific point in time. This template will help you budget forecast, organize income and expenses, and track spending over time. This template can be used to give a professional presentation on forecasting and projections. The diagrams and graphs ensure that the numbers are easy to read while the ideas they represent are clearly explained.


6 slides
Horizontal Timeline Infographic
The Horizontal Timeline Infographic is an intuitive and sleek way to display a sequence of events, steps, or progression over time. This versatile template showcases a linear pathway, with each node symbolizing a distinct point in the timeline, where details and descriptions can be inserted. It's an effective visual tool for project milestones, historical events, business plans, or educational timelines. The clear, organized layout ensures that information is easy to follow and understand. Adaptable to PowerPoint, Google Slides, and Keynote, this infographic is perfect for presentations, reports, and educational materials, providing a streamlined narrative of any temporal sequence.


21 slides
Apollo Sales Pitch Deck Template Presentation
Create an impressive sales pitch with this sophisticated template. Highlight your company overview, problem statement, solutions, and market opportunities. Showcase your unique selling proposition and marketing strategy. Ideal for PowerPoint, Keynote, and Google Slides.


2 slides
Designer Portfolio for Client Showcase Presentation
Showcase your creative work with the Designer Portfolio for Client Showcase Presentation. This sleek layout emphasizes visual storytelling, making it ideal for graphic designers, illustrators, and creatives presenting to potential clients. Highlight your projects in a clean, modern format. Compatible with Canva, PowerPoint, Keynote, and Google Slides for full customization.


7 slides
Psychology Infographic Presentation Template
Featuring our psychology infographic template made to provide you with a beautiful presentation that includes all the necessary elements for learning about psychology. Present your research and analysis in a clear, informative and engaging way with this template. Use the theme to highlight the most important concepts in psychology and explain each one with interesting facts, statistics and charts. Use this template to show information about the main topics or areas of psychology. This template is compatible with powerpoint and fully customizable to meet all your requirements!


6 slides
Macro Environment PESTEL Framework
Navigate market forces with confidence using this dynamic PESTEL framework layout—designed to help you assess Political, Economic, Social, Technological, Environmental, and Legal factors with clarity. Whether for strategy planning or external analysis, this slide keeps your insights visually organized and easy to explain. Fully compatible with PowerPoint, Keynote, and Google Slides.


21 slides
Eidora Qualitative Research Findings Presentation
Present your research findings with confidence using this professional and stylish presentation template. Covering key sections like objectives, methodology, data analysis, and recommendations, it helps you communicate complex information with clarity and impact. Perfect for academic or business use. Compatible with PowerPoint, Keynote, and Google Slides for easy customization.


6 slides
Team Work Environment Infographic
A team work environment refers to the conditions and culture within a group of individuals who come together to work collaboratively on a common goal or project. This infographic template highlights the importance of teamwork and fosters a positive team-oriented workplace culture. The design emphasizes the key elements and benefits of a collaborative work environment, encouraging employees to work together effectively and efficiently. This infographic features illustrations that depict employees working together, collaborating, and supporting one another. This reinforces the idea of teamwork and unity within the organization.


4 slides
Team Member Compensation and Benefits
Showcase employee rewards, perks, and compensation structures with this sleek, progressive flow design. Perfect for HR presentations, onboarding materials, or internal updates. Easily customizable in PowerPoint, Keynote, and Google Slides to match your branding needs.


12 slides
Leadership Development and Growth
Highlight leadership skills with this dynamic radar chart template, ideal for tracking individual or team competencies across six core areas. Use this layout to visualize progress in communication, strategy, vision, influence, adaptability, and accountability. Great for HR reviews, training evaluations, or performance dashboards. Fully editable in PowerPoint, Keynote, and Google Slides.


26 slides
Summer Sale Presentation
Soak up the bright, sunny vibes of a presentation template that’s perfectly tailor-made for the lively summer season. Its radiant design, infused with the essence of summer sales and tropical aesthetics, is a perfect match for retail campaigns, travel promotions, or any topic that aims to bring the sizzle of summer into a room. Bright colors, playful graphics, and beach-inspired backgrounds set the stage for vibrant storytelling, whether you're introducing a seasonal team, showcasing hot vacation spots, or highlighting the latest summer fashion. The template not only captures the casual, cheerful spirit of the season but also ensures that your content makes a splash with clear, concise data displays and infographics. It’s a breeze to use across various platforms like PowerPoint, Keynote, and Google Slides, ensuring your summer message is as refreshing as a cool ocean wave.