


Features
- 4 Unique slides
- Fully editable and easy to edit in Microsoft Powerpoint, Keynote and Google Slides
- 16:9 widescreen layout
- Clean and professional designs
- Export to JPG, PDF or send by email


Do you have any questions?
Recommend


5 slides
Timeline Road Infographics
Timelines are important tools for organizing and presenting information chronologically. This timeline infographic is designed to help ensure that all your tasks are completed on time, and that the project stays on track. This is perfect for identifying potential issues that may arise during a project, so that they can be addressed before they become major problems. This template consists of a road or a horizontal line, with markers or milestones placed at specific intervals. Each marker represents a significant event or achievement, and is accompanied by a short description, date or time frame.


5 slides
Workplace Productivity Moments Presentation
Track progress and boost team performance with this clear and colorful productivity grid. Ideal for visualizing routines, task cycles, or time management strategies across a workweek or project phases. Each column and row is fully editable, making it easy to tailor the layout to your goals. Compatible with PowerPoint, Keynote, and Google Slides.


6 slides
Revenue Growth Sales Slide Presentation
Showcase your business success with this Revenue Growth Sales Slide Presentation. The upward-curved arrow design highlights five key milestones, each with customizable titles, icons, and color accents. Perfect for illustrating sales performance, growth metrics, or financial forecasts. Easy to edit in PowerPoint, Keynote, or Google Slides—ideal for sales teams, analysts, and executives.
20 slides
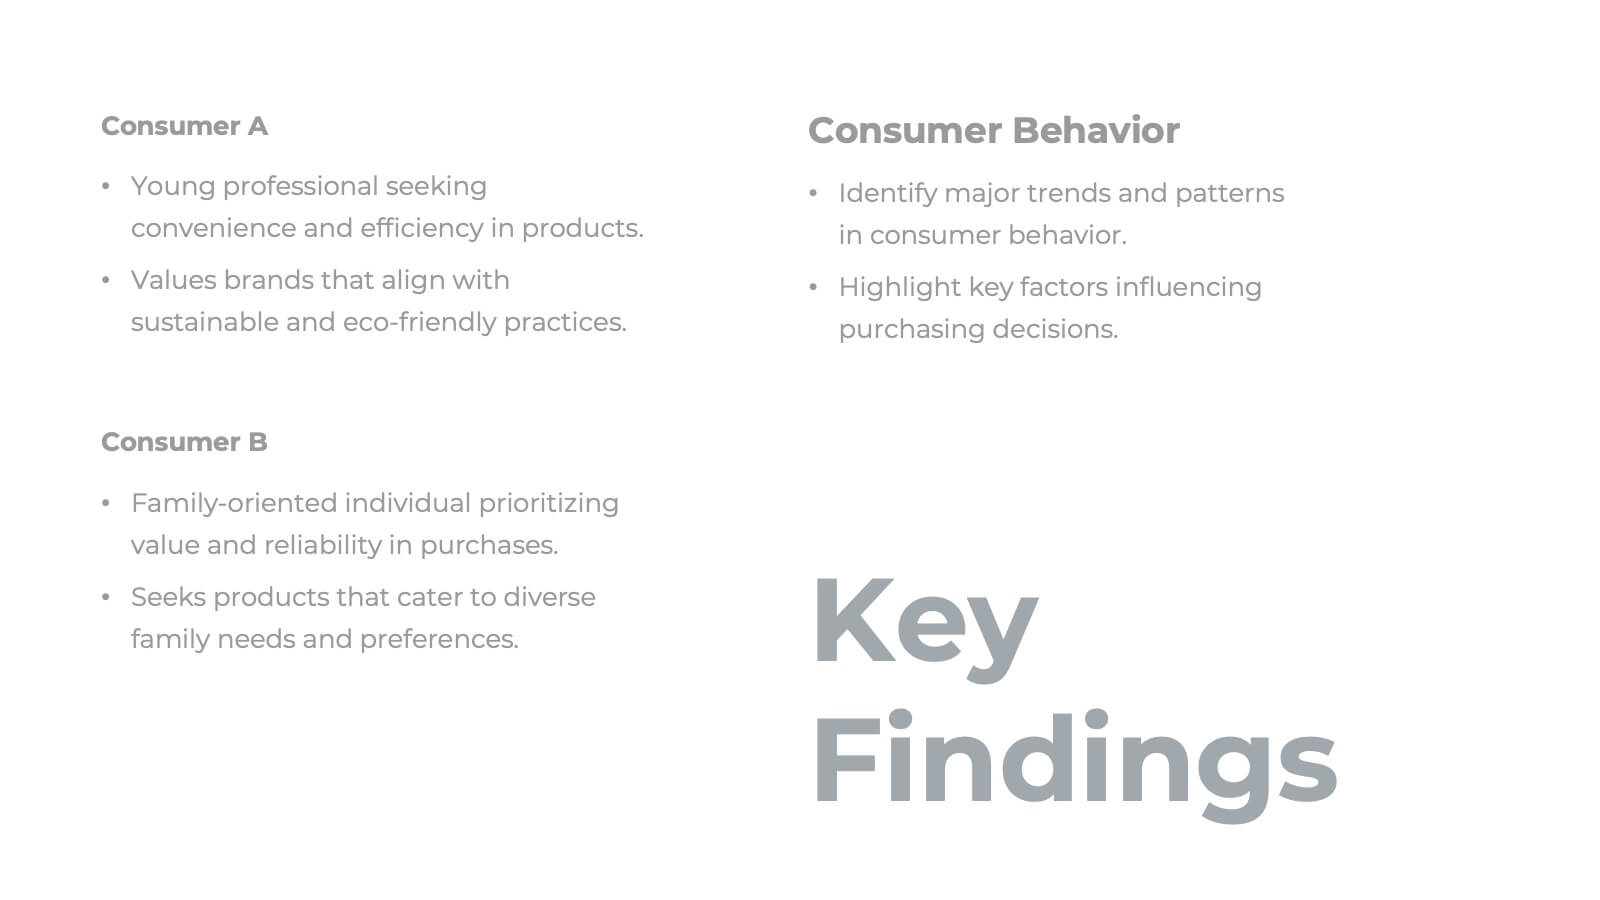
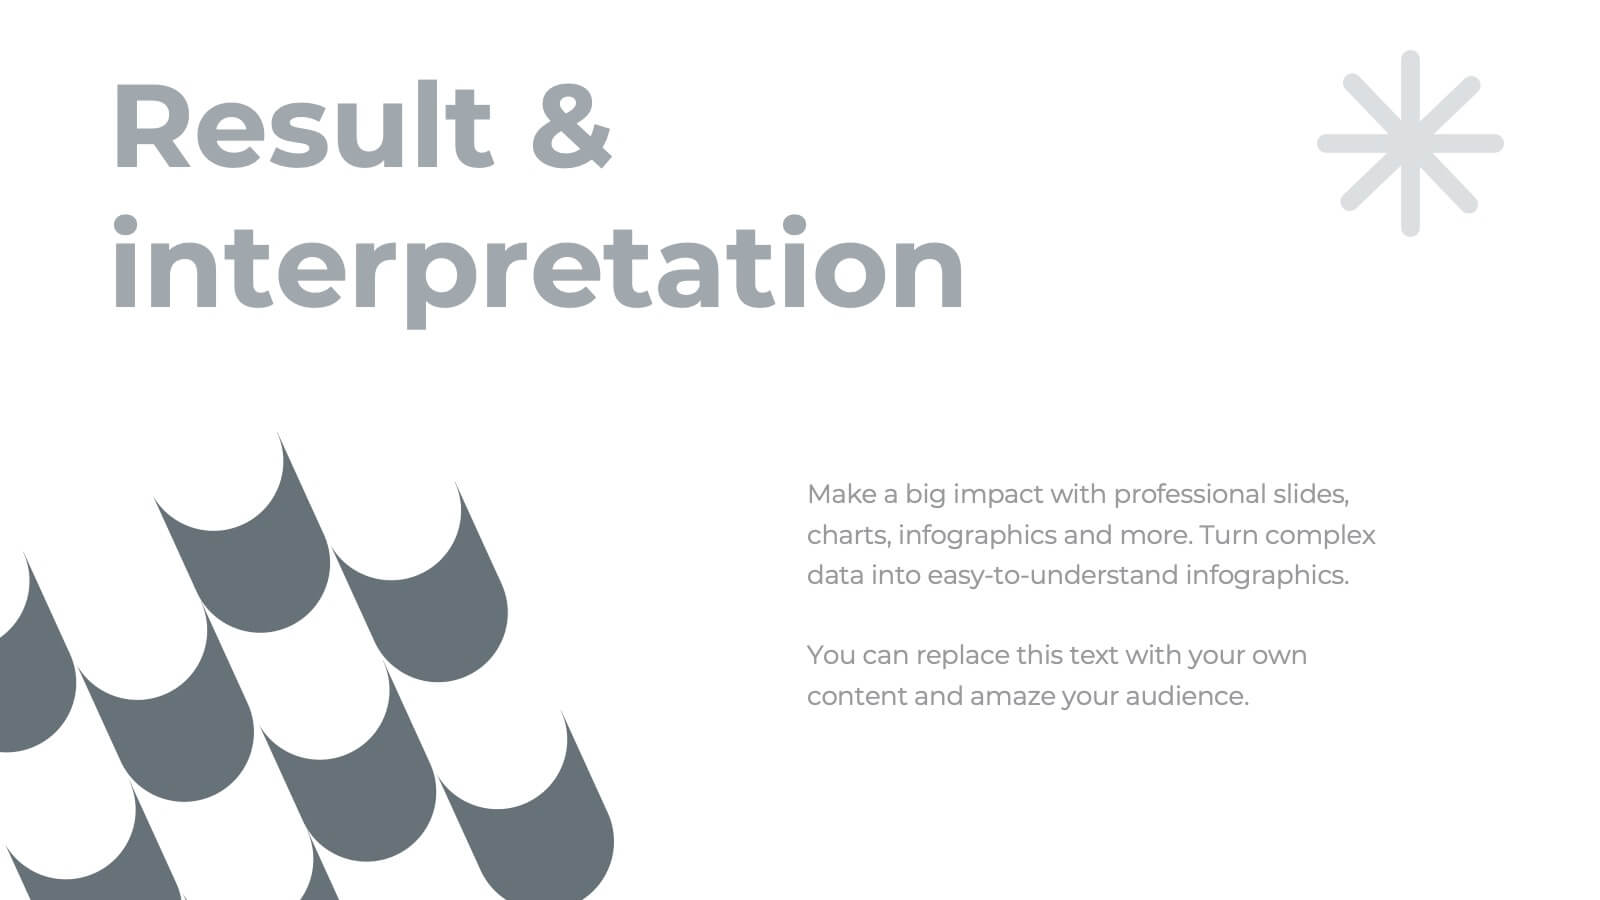
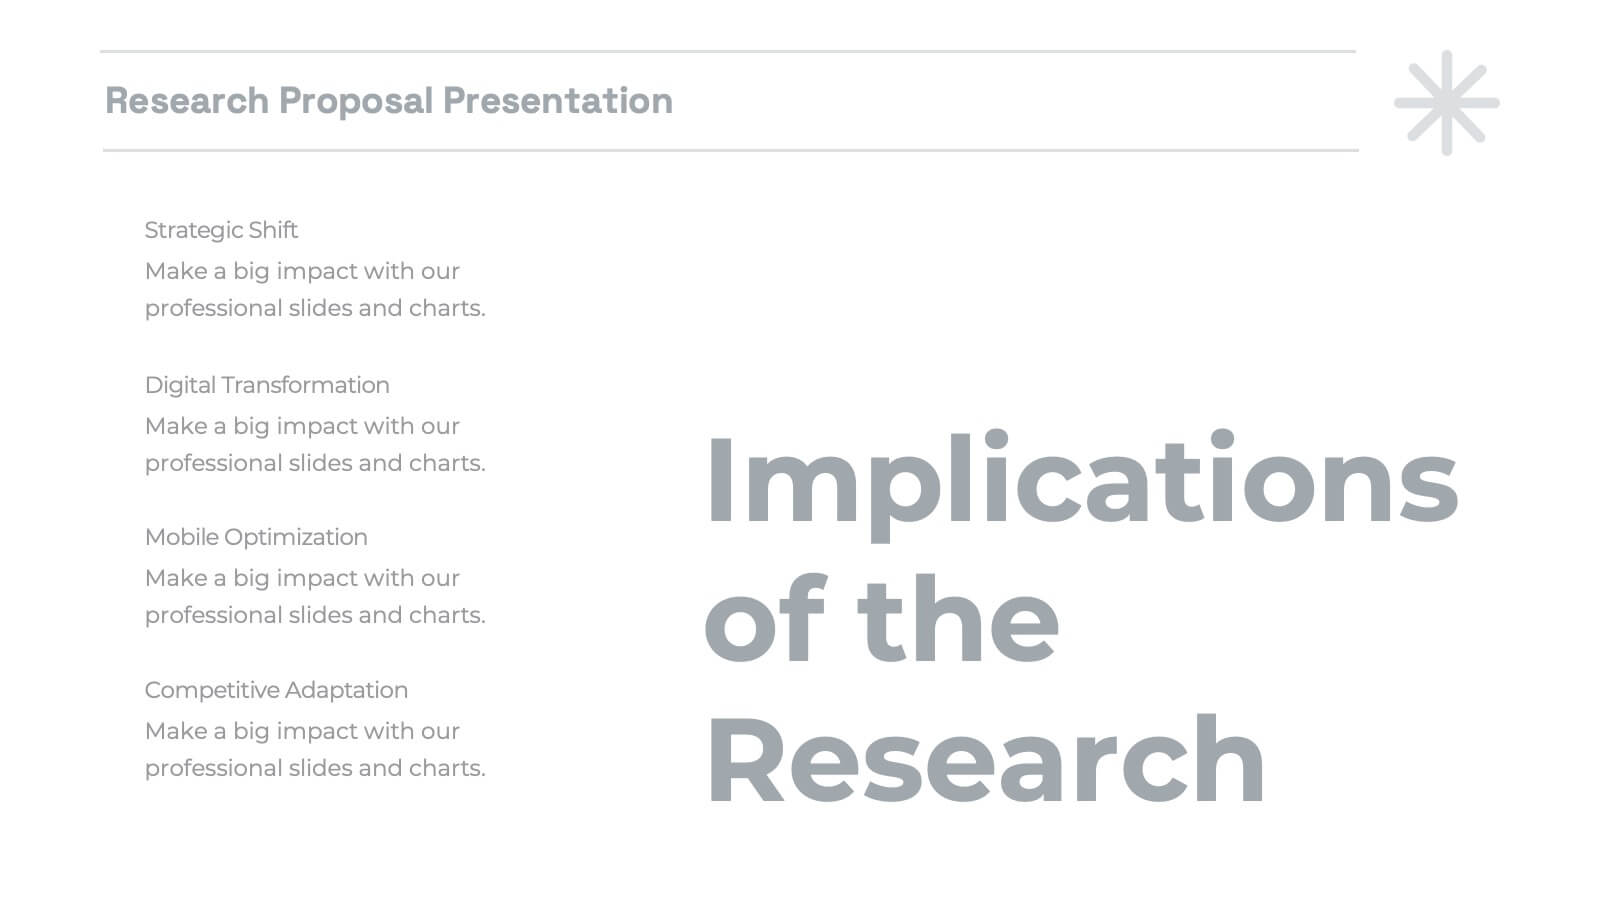
Malachite Research Proposal Presentation
Present your research findings with clarity and professionalism using this structured research presentation template! Covering all essential elements, from research objectives and methodology to key findings and implications, this template ensures your work is communicated effectively. It's perfect for academic, corporate, or scientific presentations. Compatible with PowerPoint, Keynote, and Google Slides, it's versatile and ready for your next project.


6 slides
Unique Intersection Comparison Diagram
Illustrate complex relationships with clarity using the Unique Intersection Comparison Diagram Presentation. This visually engaging 5-circle diagram highlights overlaps and distinct points, ideal for showcasing cross-functional collaboration, multi-variable strategies, or layered comparisons. Each segment supports titles and brief text, making it perfect for business planning, product features, or audience segmentation. Fully editable in PowerPoint, Keynote, and Google Slides.


6 slides
Meeting and Event Planning Schedule Presentation
Plan smarter and meet deadlines with the Meeting and Event Planning Schedule Presentation. This organized layout helps teams visualize phases, dates, and key activities at a glance—perfect for scheduling workshops, meetings, or launch events. Fully customizable in PowerPoint, Keynote, and Google Slides.


8 slides
Team Statistics and Rankings Presentation
Showcase match performance, rankings, and team metrics with this Team Statistics and Rankings Presentation. Visualize key game stats using editable diagrams, heatmaps, and comparison scores. Perfect for sports analysts, coaches, or recap slides. Compatible with PowerPoint, Keynote, and Google Slides—fully customizable for your team’s specific data and branding needs.


5 slides
Key Business Benefits and Value
Present your organization’s core strengths using this 4-part value diagram. Ideal for outlining benefits, service pillars, or strategic goals, the slide features directional arrows with matching icons for clarity and structure. Easy to customize in PowerPoint, Keynote, and Google Slides—adjust text, icons, and colors to align with your business branding.


6 slides
Personal Skills Gap Infographics
Bridge the Personal Skills Gap effectively with our customizable infographic template. This template is fully compatible with popular presentation software such as PowerPoint, Keynote, and Google Slides, enabling you to easily tailor it to address specific skills gaps and development strategies. The Personal Skills Gap infographic template provides a visually appealing platform for identifying and closing gaps in your skillset, whether personal or professional. Whether you're a career-minded individual, a manager, or an educator, this template offers a user-friendly canvas to create informative presentations and self-improvement plans. Boost your personal and professional growth with this SEO-optimized Personal Skills Gap infographic template, thoughtfully designed for clarity and ease of use. Customize it to pinpoint skills in demand, set goals, and outline actionable steps to bridge the gap, ensuring your continuous development and success. Start crafting your personalized infographic today to thrive in a rapidly evolving world.


6 slides
Blue Ocean Trade Infographic
The Blue Ocean strategy is a concept that focuses on creating uncontested market spaces rather than competing in existing market segments. This captivating infographic template showcases the concept of blue ocean trade and its impact on business growth and innovation. It provides an engaging and informative overview of the blue ocean strategy, highlighting its key principles and benefits for businesses. This template provides a comprehensive overview of blue ocean trade and serves as an inspiring resource for those seeking innovative business strategies. Fully compatible with Powerpoint, keynote, and Google Slides.


5 slides
Veterinary Medicine Advances Presentation
Discover the latest in Veterinary Medicine Advances with our engaging presentation template. Designed to highlight key innovations and treatment methods, this template offers a clear visual format for presenting complex information effectively to colleagues and stakeholders in the veterinary field.


7 slides
Value Chain Activity Infographic Presentation
A Value Chain Infographic is a visual representation of the various activities and processes that a company uses to create and deliver a product or service to its customers. This template is a perfect way to analyze a company's competitive advantage by breaking down its activities into primary and support activities. This template includes a series of connected components, each representing a activity or process in the value chain. This infographic includes diagrams, charts, and other visual elements to help explain the flow of goods and services through the various stages of the value chain.


7 slides
Strategic PESTEL Planning Breakdown
Break down complexity into clarity with this puzzle-style PESTEL layout—perfect for visualizing how Political, Economic, Social, Technological, Environmental, and Legal factors shape your strategic decisions. Great for workshops, planning sessions, or executive briefings, it keeps your analysis both organized and engaging. Fully compatible with PowerPoint, Keynote, and Google Slides.

22 slides
Kraken Agency Portfolio Presentation
This agency portfolio template showcases your agency's work and expertise with a sleek, modern design. It features slides for client success stories, case studies, services, market analysis, and creative process. Perfect for demonstrating your team’s skills and approach. Compatible with PowerPoint, Keynote, and Google Slides for easy customization and presentation.


7 slides
Agenda Infographic
Organize and present your meeting or event agendas with our professionally designed slide templates. Each template is tailored to help you clearly outline the schedule and topics, ensuring that your meetings are both structured and efficient. These templates feature a variety of layouts that can accommodate different types of agendas, from detailed hourly breakdowns to high-level overviews. The use of engaging graphics, bullet points, and timeline visuals aids in presenting the sequence of events or discussion topics in a clear and appealing manner. Color coding and distinct typographic hierarchies make it easy to navigate through the agenda, enhancing readability and viewer engagement. Fully customizable, these slides allow you to adapt the design to your corporate colors, add your logos, and rearrange elements to suit your specific meeting needs. Ideal for business meetings, conferences, workshops, and seminars, these agenda slides are essential tools for keeping your events organized and on track.


7 slides
Remote Work Guidelines and Setup Presentation
Bring clarity to your remote work setup with this sleek visual guide—designed to communicate processes, tools, and best practices in one easy-to-follow layout. Whether you're onboarding a team or streamlining operations, this slide helps break it all down step by step. Fully compatible with PowerPoint, Keynote, and Google Slides.


31 slides
Astralis Brand Strategy Report Presentation
Present your brand strategy effectively with this well-structured presentation template. This comprehensive design covers all essential aspects, including vision and positioning, identity components, brand guidelines, and touchpoints. It is perfect for showcasing how your brand stands out, communicates, and connects with its audience. Highlight your unique selling points, ensure visual consistency with color palettes, and emphasize your brand's voice through tailored sections. This template is easy to customize and works seamlessly across PowerPoint, Google Slides, and Keynote, ensuring accessibility for all. Empower your brand strategy discussions with a professional and polished design.