


Features
- 4 Unique slides
- Fully editable and easy to edit in Microsoft Powerpoint, Keynote and Google Slides
- 16:9 widescreen layout
- Clean and professional designs
- Export to JPG, PDF or send by email


Do you have any questions?
Recommend


3 slides
Remote Work Culture and Guidelines Presentation
Bring remote teamwork to life with visuals that speak your culture. This presentation template simplifies how you communicate expectations, structure, and values for virtual teams. Perfect for onboarding, policy updates, or outlining collaboration tools, it’s designed to keep your message clear and consistent. Fully compatible with PowerPoint, Keynote, and Google Slides.


6 slides
Gap Analysis Strategy Infographics
Enhance your understanding of Gap Analysis Strategy with our customizable infographic template. This template is fully compatible with popular presentation software like PowerPoint, Keynote, and Google Slides, allowing you to easily customize it to illustrate and communicate various aspects of gap analysis and its strategic applications. The Gap Analysis Strategy infographic template offers a visually engaging platform to explain the principles, process, and benefits of conducting gap analysis within an organization. Whether you're a business strategist, analyst, or manager, this template provides a user-friendly canvas to create informative presentations and educational materials. Optimize your strategic planning and decision-making with this SEO-optimized Gap Analysis Strategy infographic template, thoughtfully designed for clarity and ease of use. Customize it to showcase the steps involved in gap analysis, the identification of performance gaps, and strategies for closing those gaps, ensuring that your audience gains valuable insights into this crucial tool for organizational improvement. Start crafting your personalized infographic today to excel in Gap Analysis Strategy.


7 slides
Break-Even Model for Revenue Planning Presentation
Simplify financial planning with this break-even model presentation. Designed to visualize the transition from loss to profit, it highlights cost reduction, sales increase, and profit margins. Ideal for strategy sessions, budgeting, or forecasts. Fully editable in PowerPoint, Keynote, and Google Slides for seamless customization across business presentations.


7 slides
Human Resources Management Infographic Presentation
Human Resources are responsible for ensuring that an organization has the right people in the right roles, with the right skills and knowledge, to achieve its goals and objectives. This template is a great way to tell the story of your company and provide information about it. This template is compatible with Powerpoint, Keynote and Google Slides it includes 7 unique slides that are ready for you to design and customize with your own information, text and graphs. You can easily change the colors to your needs and add images. This is an informative way to highlight your business and its vision.


5 slides
Corporate Risk Mitigation Plan Presentation
Visualize your risk strategy with the Corporate Risk Mitigation Plan Presentation. Featuring a segmented umbrella graphic (A–D), this slide is perfect for illustrating coverage areas, response actions, or protection levels. Great for corporate risk managers and planning teams. Editable in PowerPoint, Google Slides, and Canva.


6 slides
Investment Portfolio Breakdown Presentation
Give your financial insights a clean, confident voice with a layout designed to make complex data feel simple and strategic. This presentation helps you compare allocations, highlight key performance areas, and communicate investment decisions with clarity and ease. Fully editable and compatible with PowerPoint, Keynote, and Google Slides.


26 slides
Professional Etiquette Presentation
Navigate the nuances of professional decorum through this tapestry of visuals that articulate the essence of workplace conduct. Against a palette of serene blues, each slide is a chapter in the unwritten manual of corporate finesse. Behold the tableau of contents, a compass that guides through topics from networking nuances to meeting mastery. Profile snapshots reveal the faces behind the expertise, their demeanors a blend of affability and authority. Charts ascend like ladders, each bar a rung towards proficiency, while infographics spiral into knowledge funnels, distilling broad concepts into digestible insights. In the realm of comparison, dichotomies transform into dialogues, contrasting ideas merging into a unified vision of etiquette. Venn diagrams interlock circles of skills, control, and success, illustrating the symbiotic relationship of competencies. Contact slides extend a virtual handshake, inviting engagement and fostering connections. This presentation is an homage to the unspoken - the grace of gratitude, the elegance of silence, and the power of a well-timed gesture - as it crafts an environment where professionalism is not just practiced, but lived.


8 slides
Travel Planning and Itinerary Overview Presentation
Pack your bags—this stylish template makes mapping adventures a breeze! Designed for trip overviews and itinerary planning, it includes world maps, must-see lists, weather forecasts, and schedules all in one layout. Perfect for travel agencies, bloggers, or wanderlust planners. Fully compatible with PowerPoint, Keynote, and Google Slides for easy customization.


21 slides
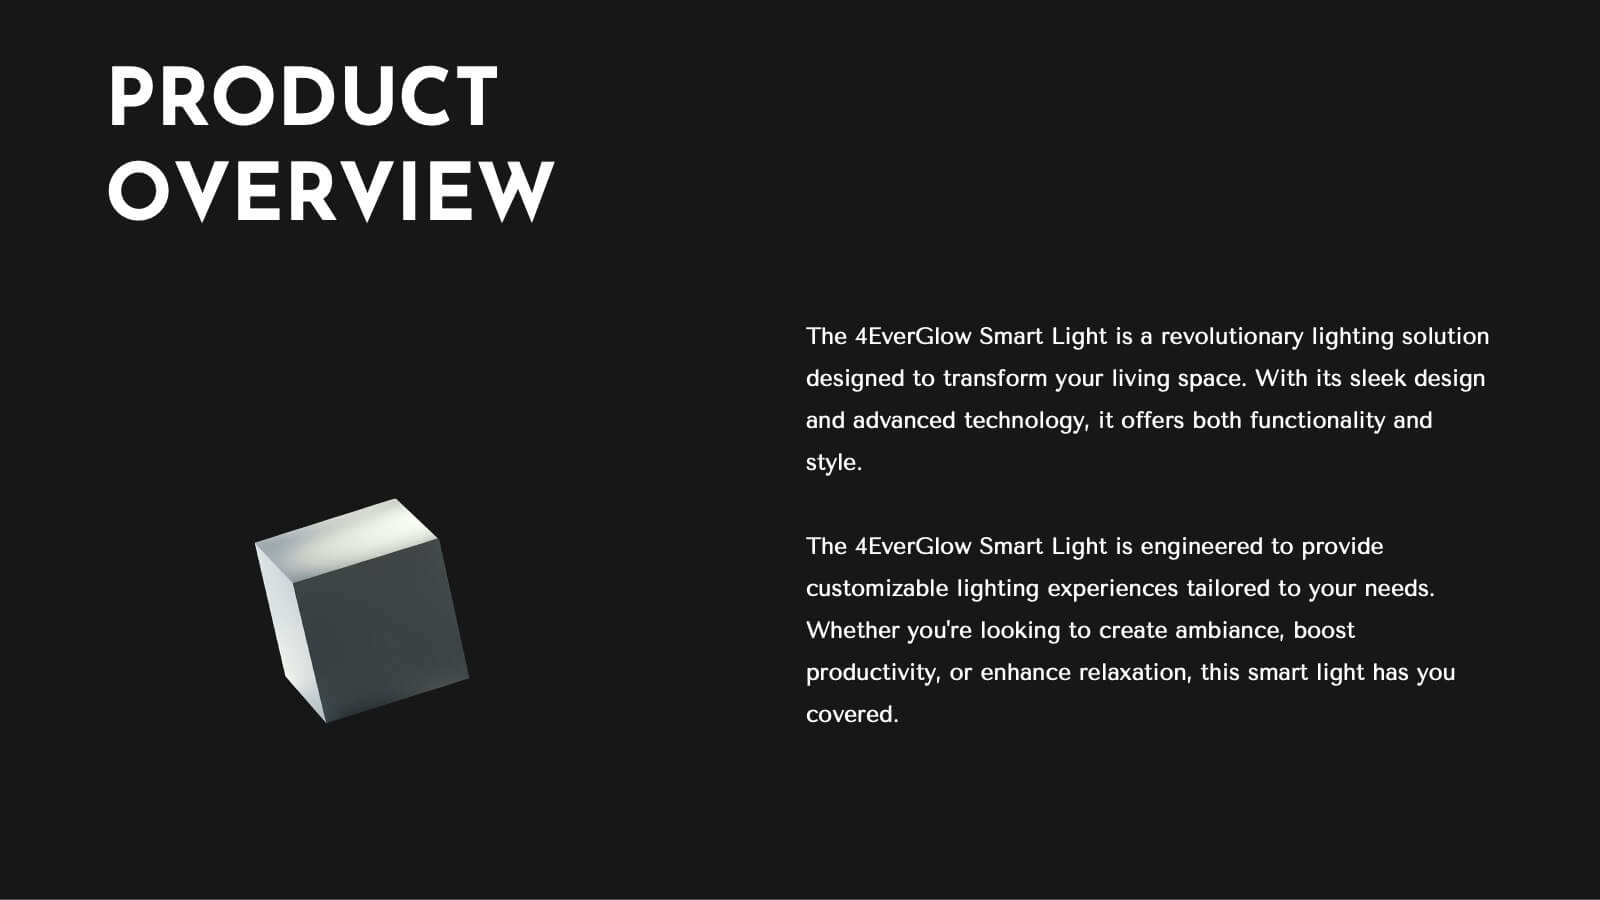
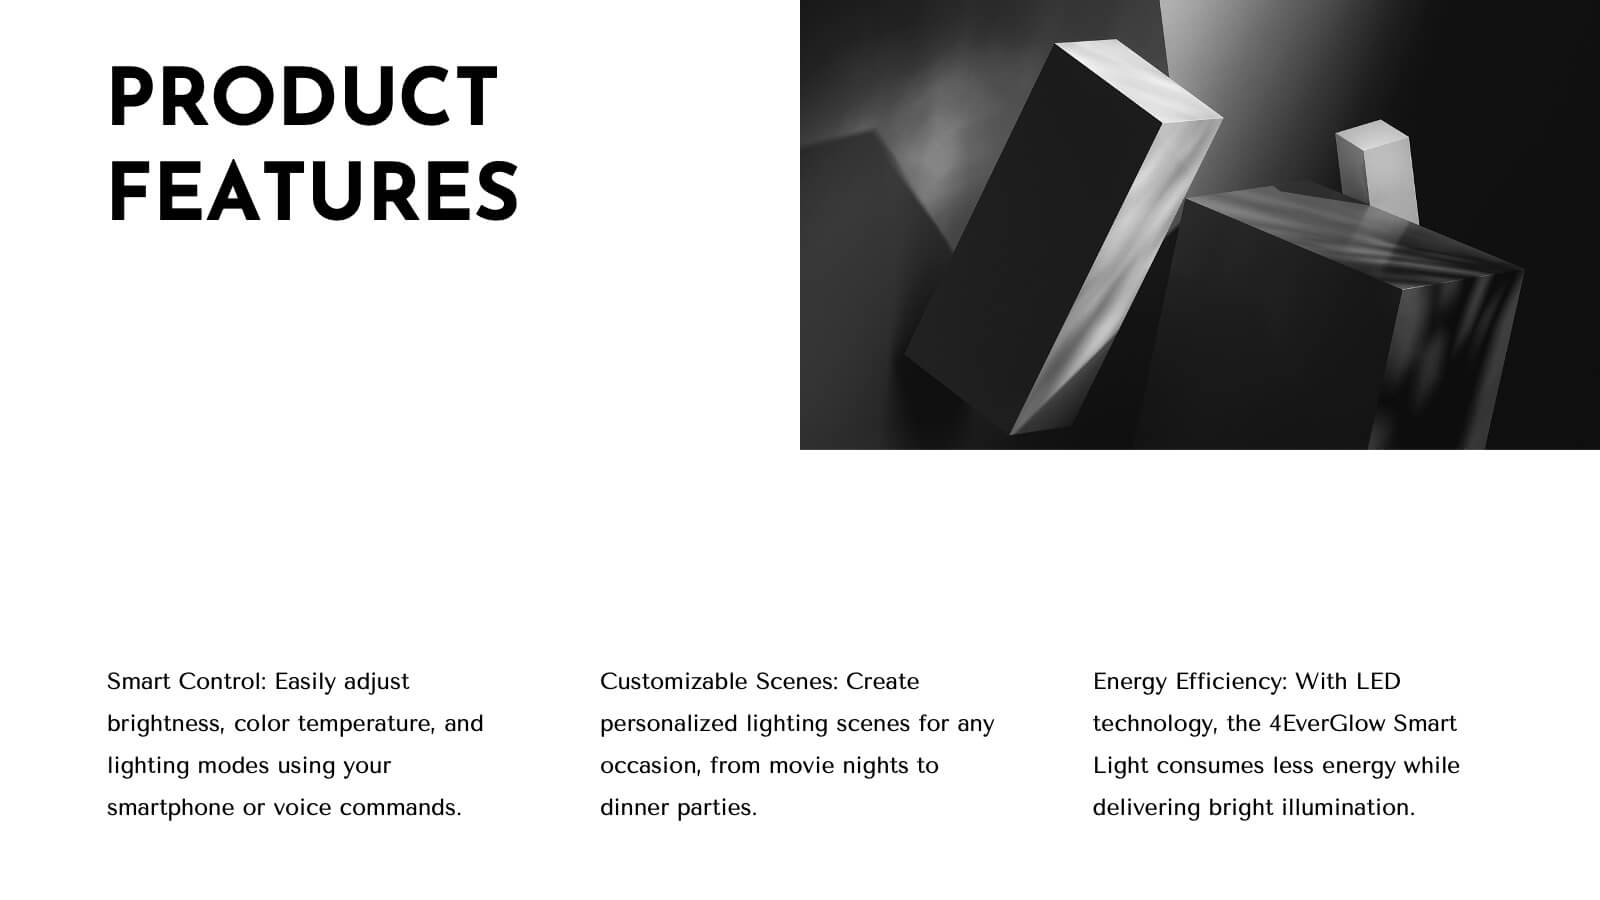
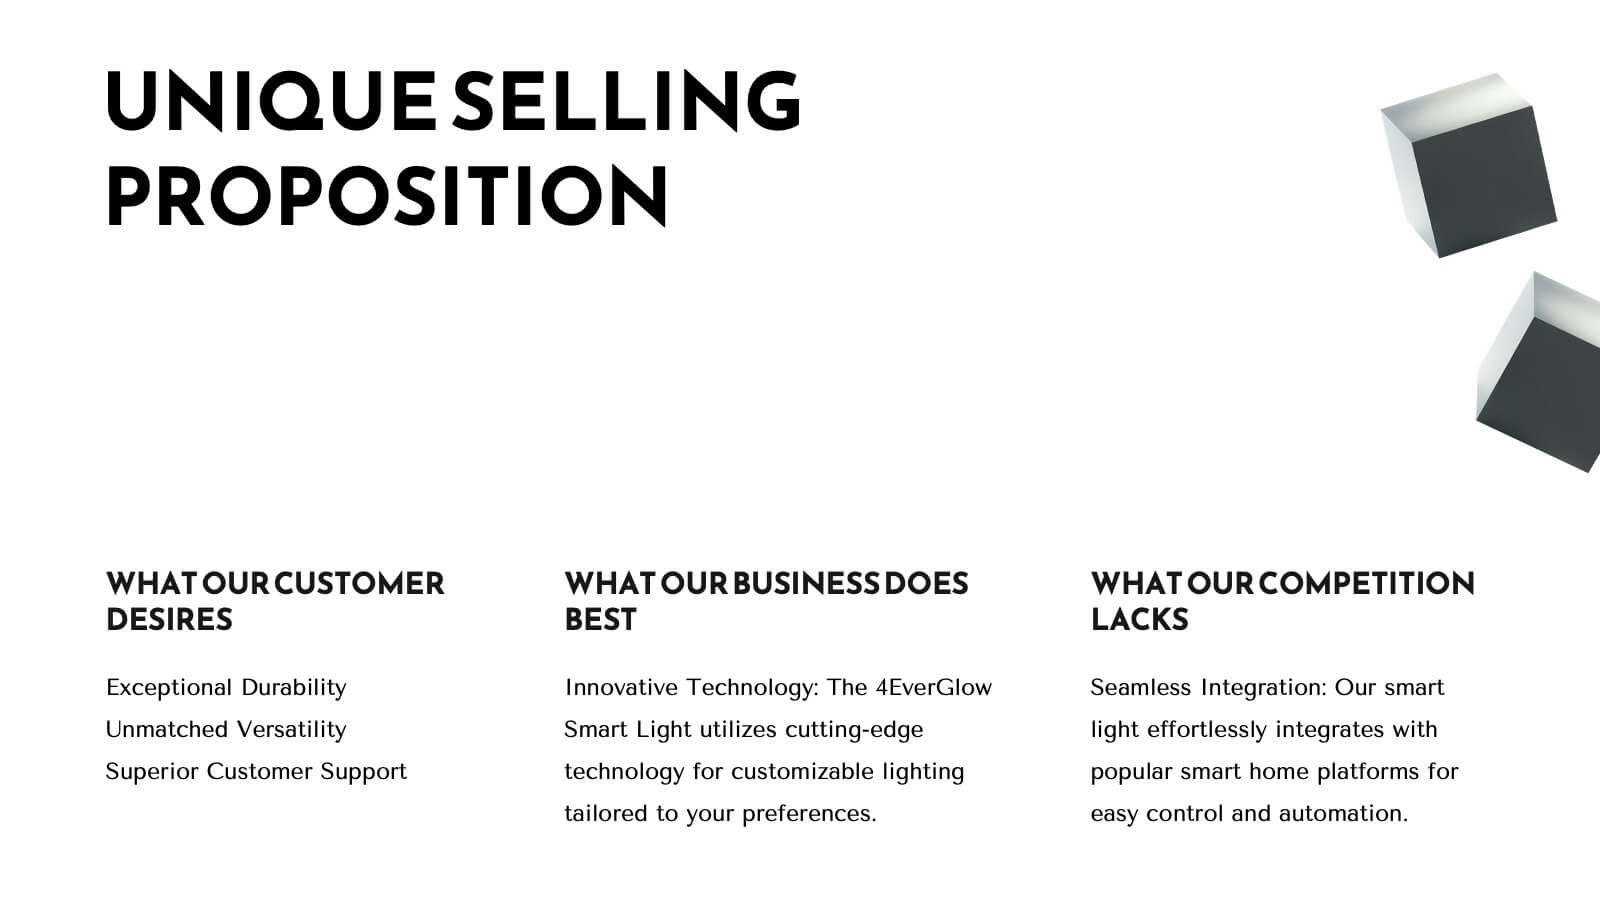
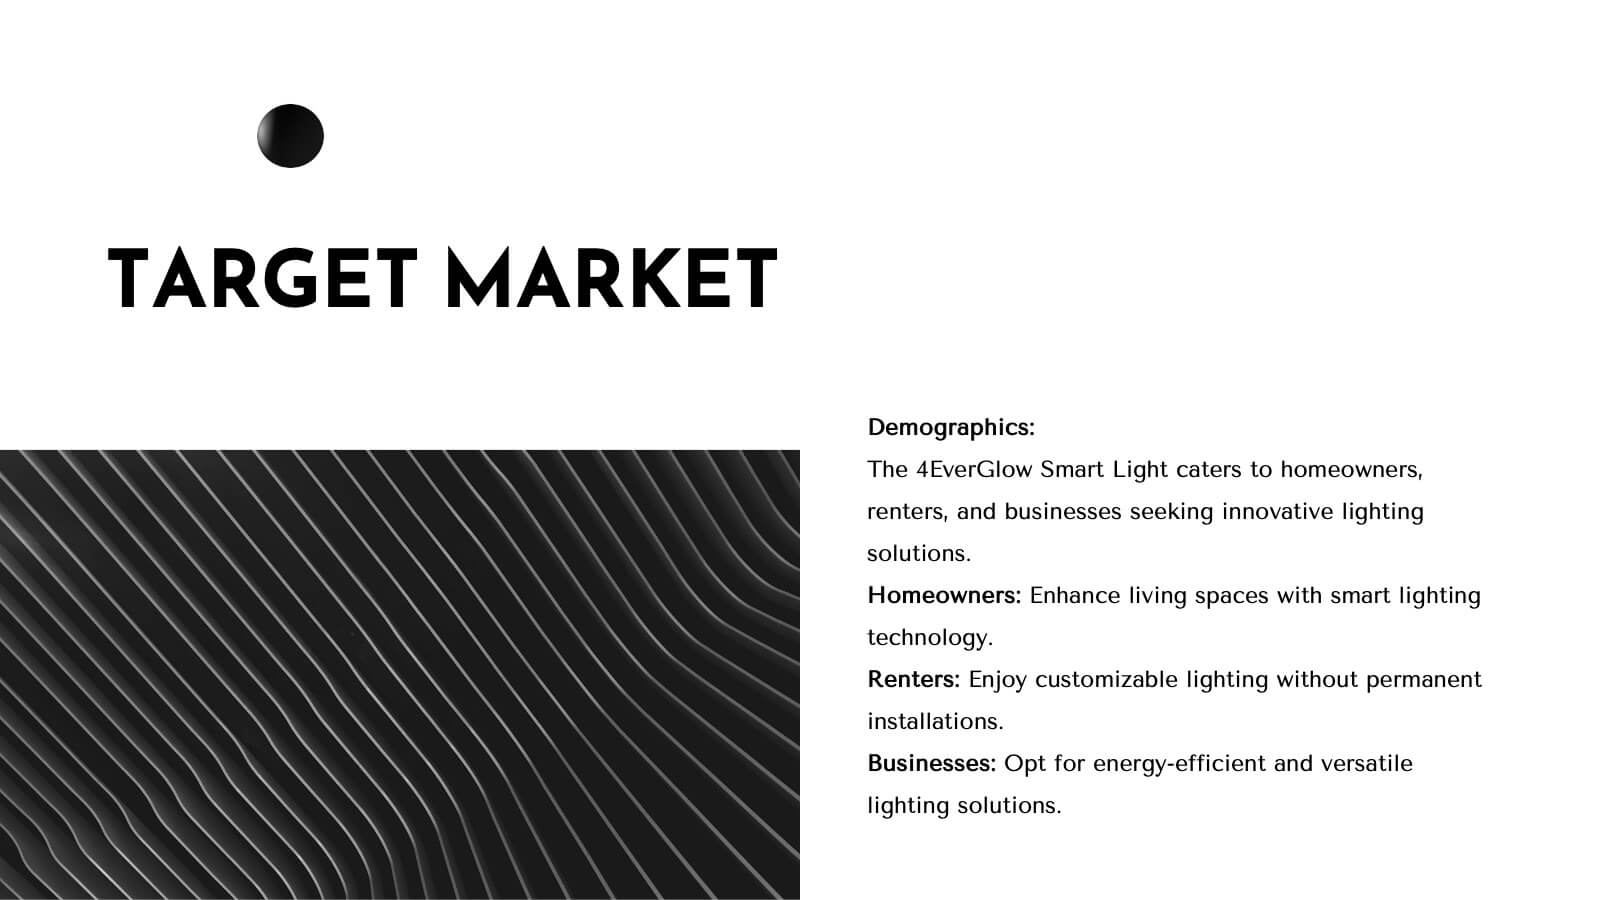
Trident Product Development Plan Presentation
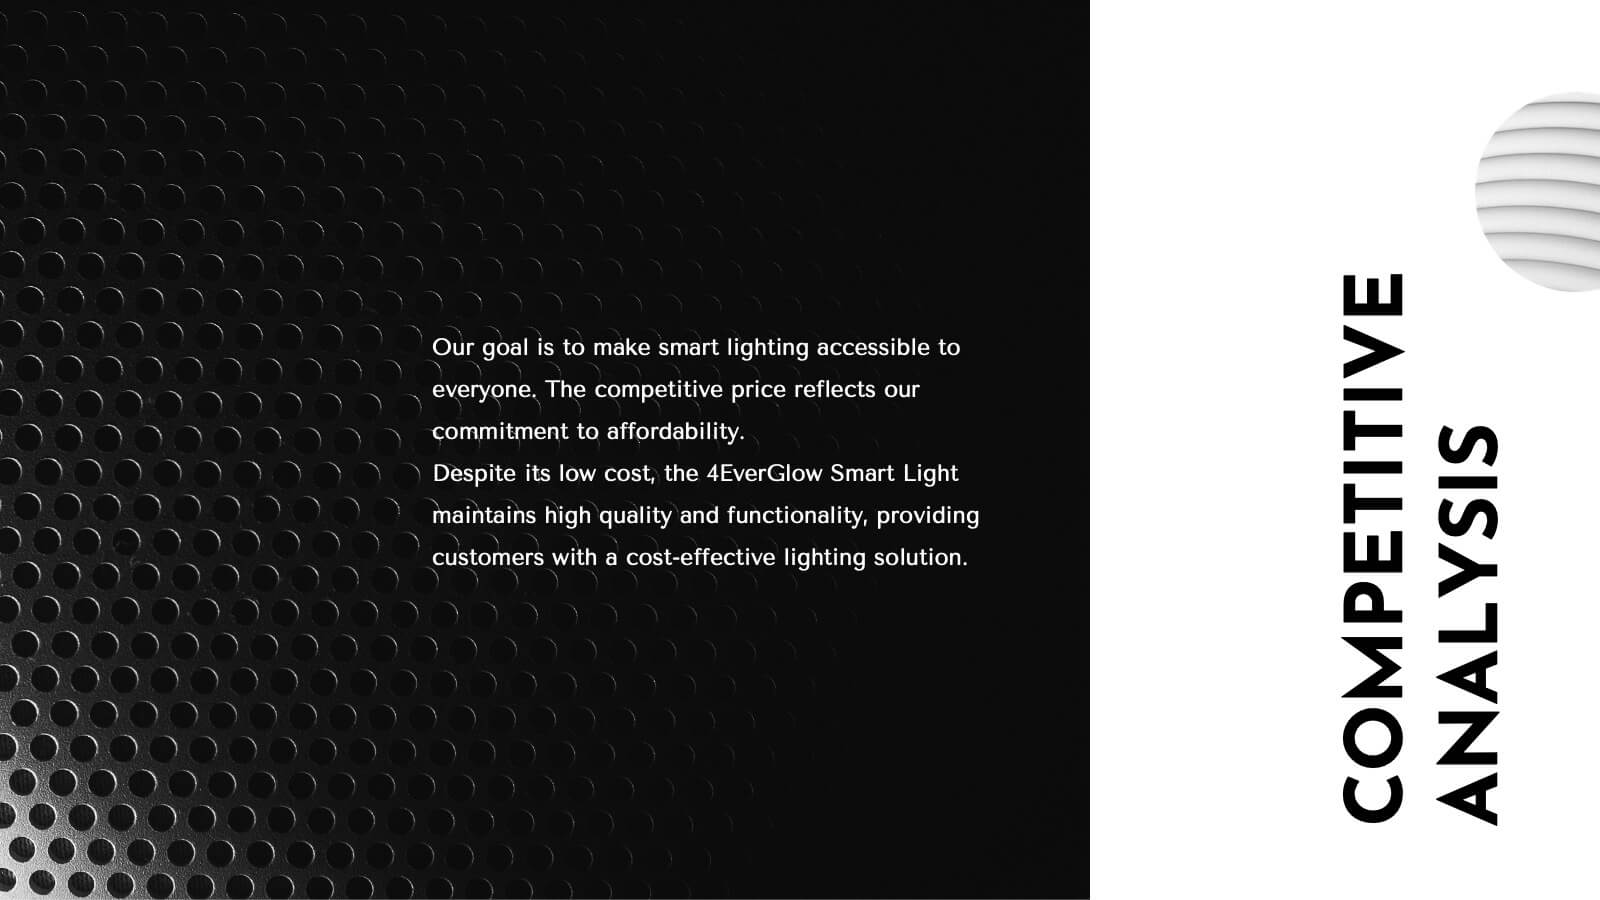
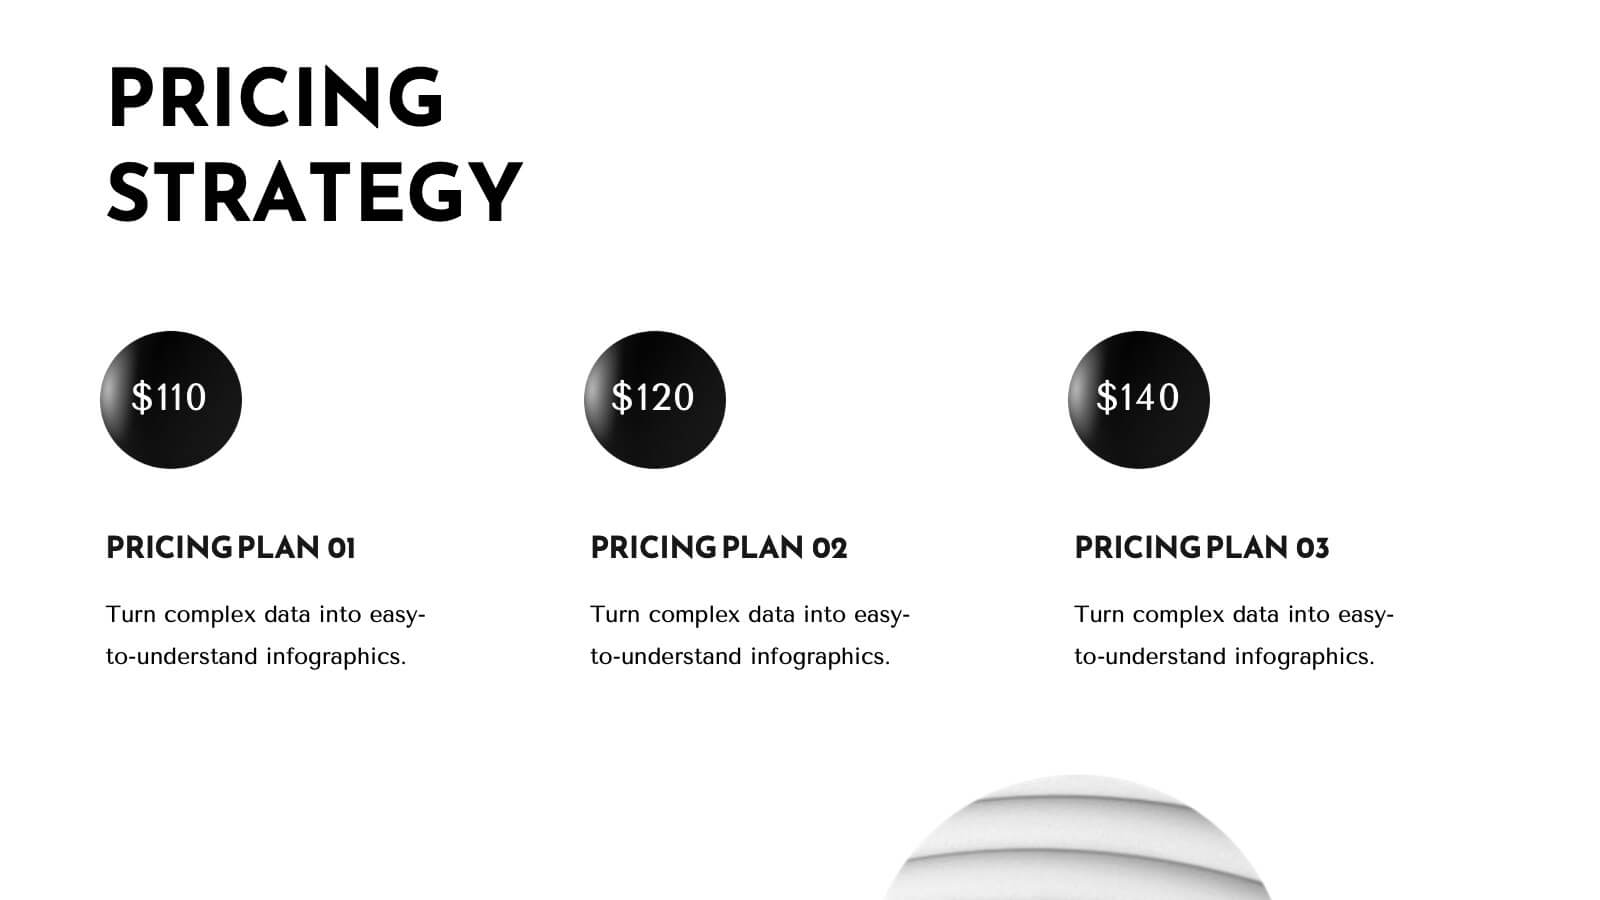
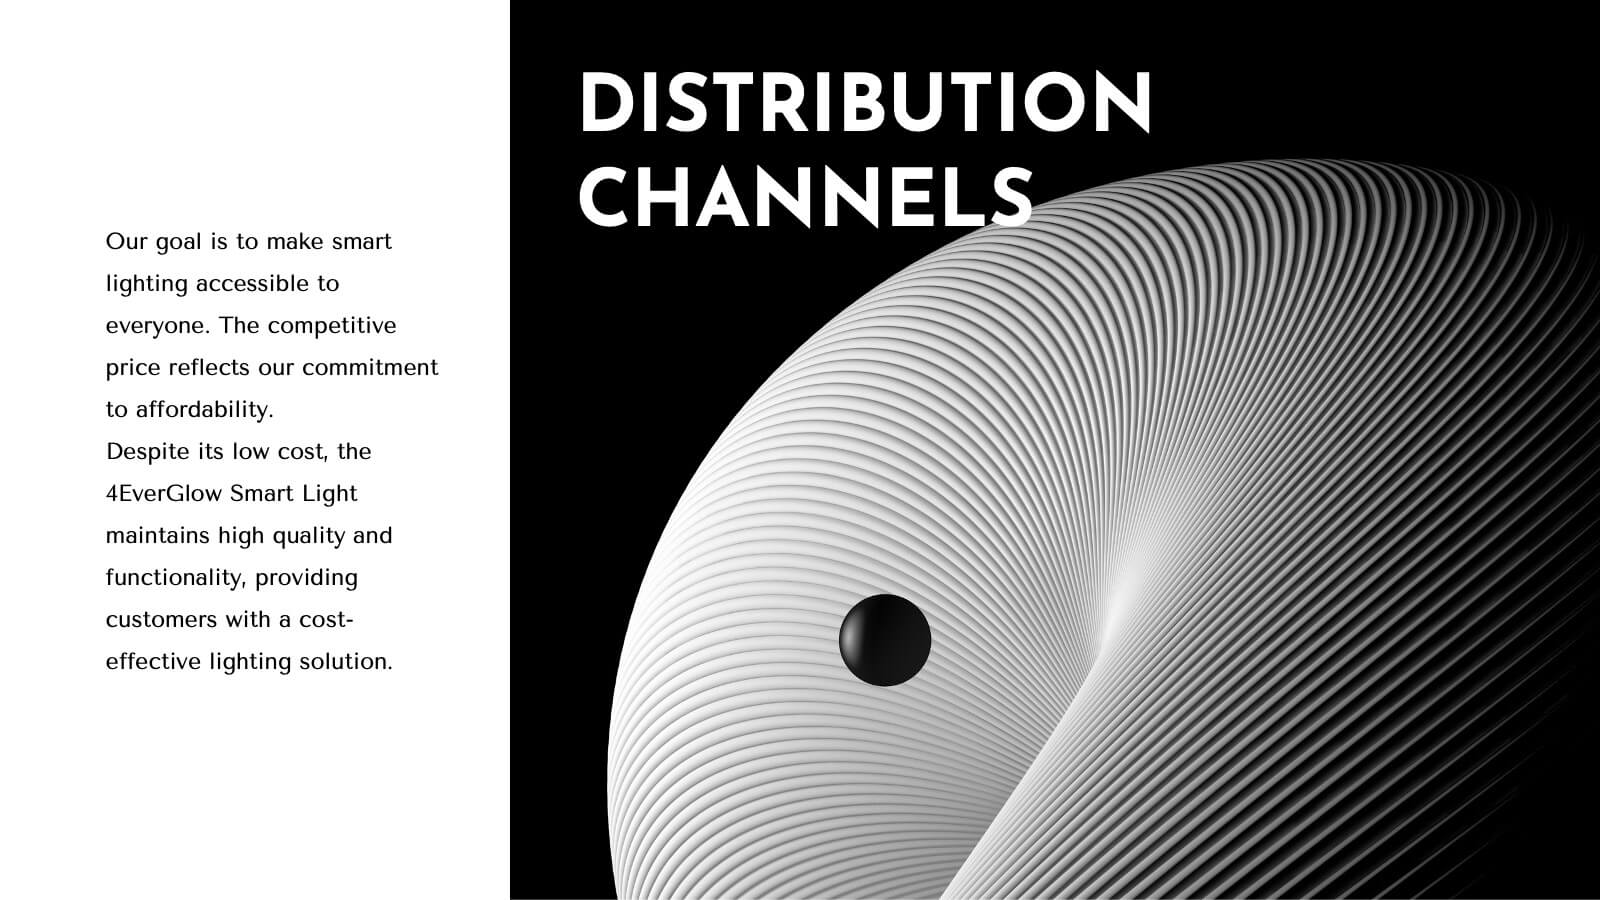
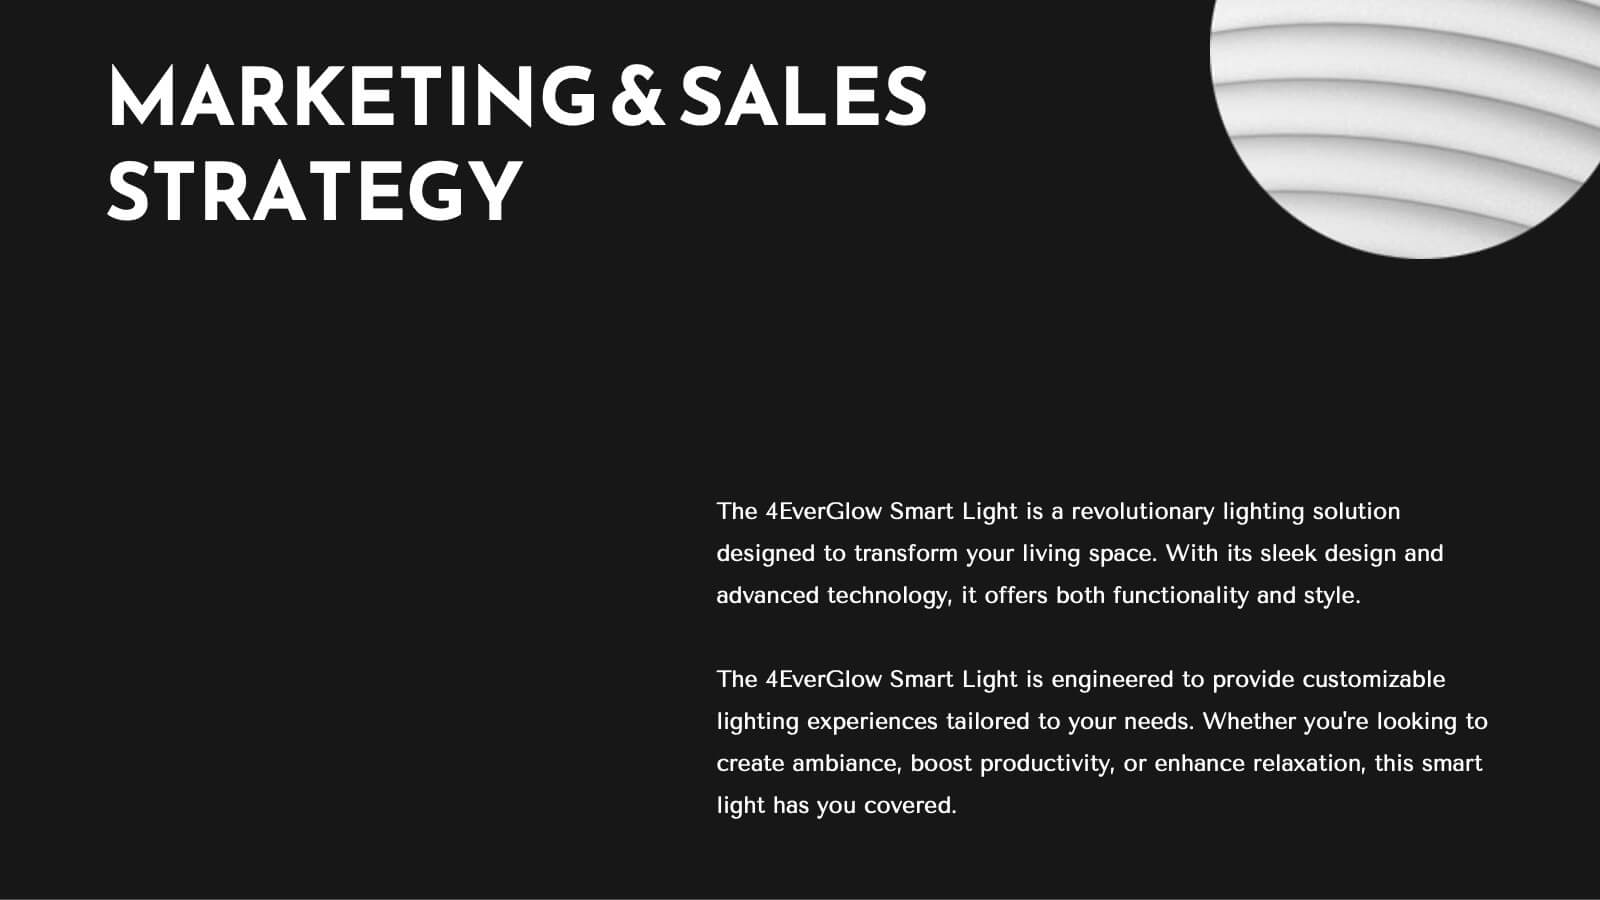
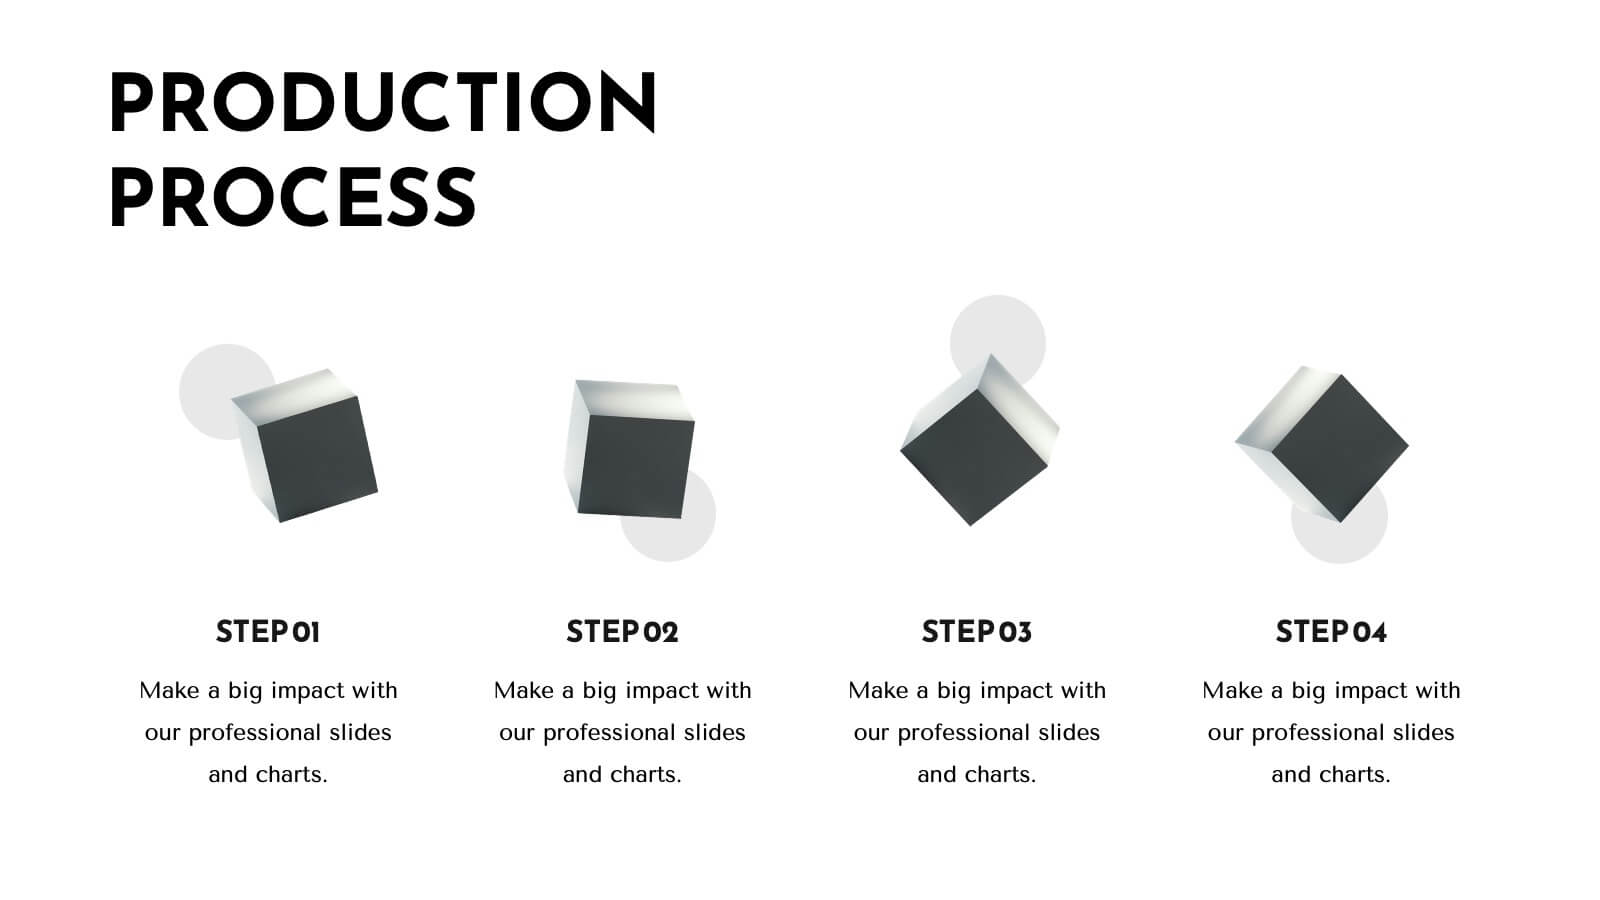
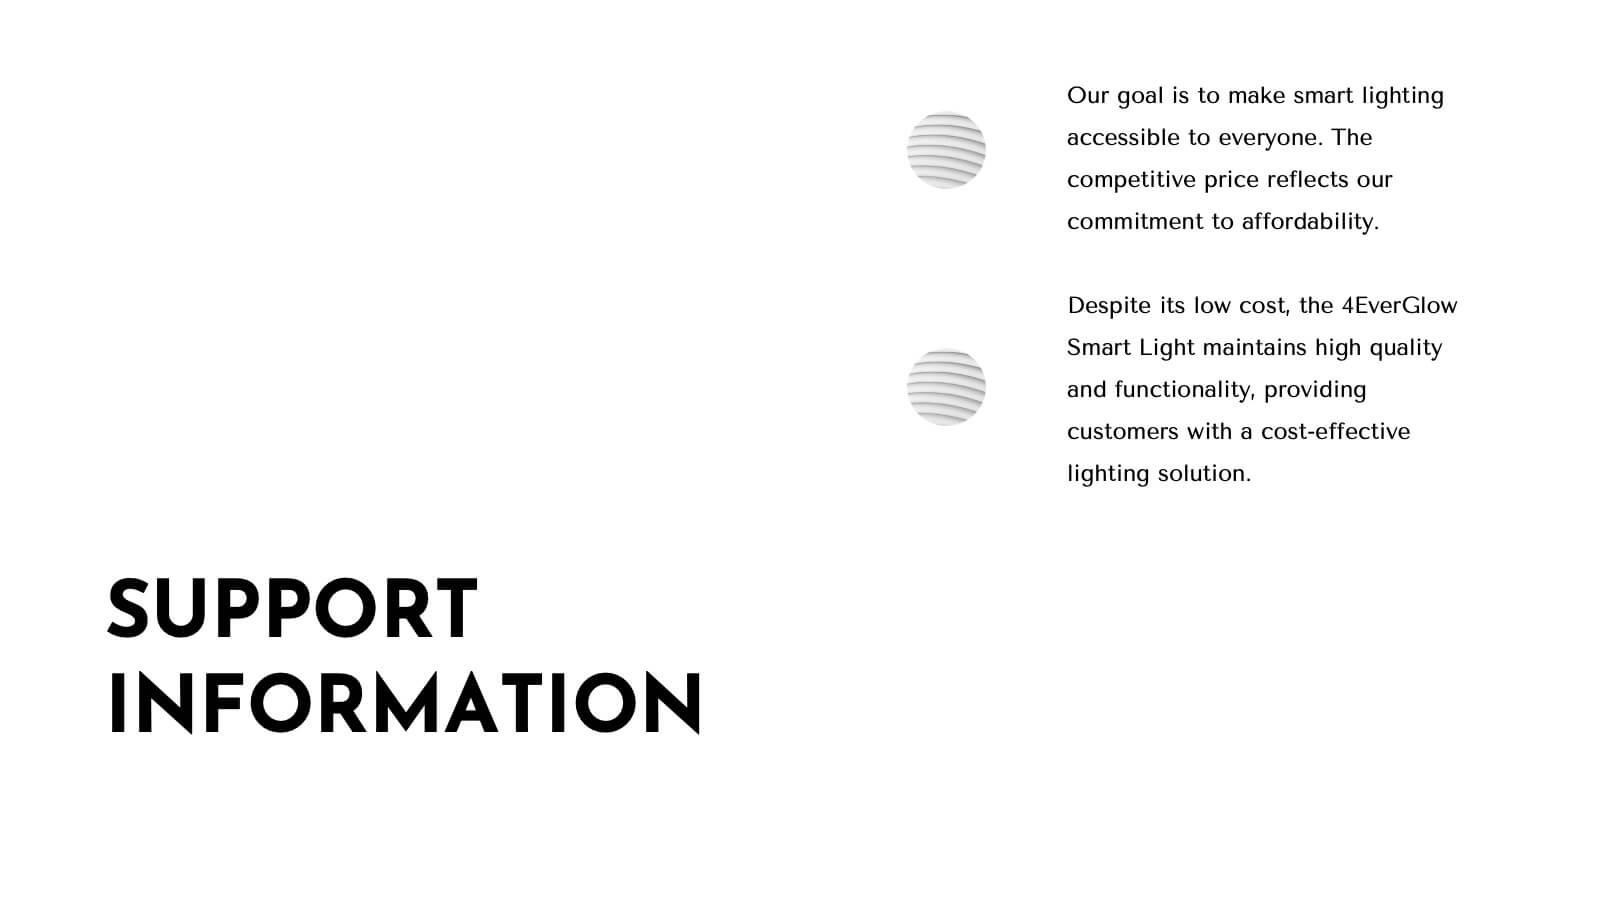
Present your product development strategy with this sleek, professional template! Highlight company overview, product features, and unique selling proposition. Ideal for showcasing market analysis, pricing strategy, and production process. Perfect for developers and project managers. Compatible with PowerPoint, Keynote, and Google Slides.


7 slides
Africa Regions Map Infographic
This Africa Regions Map infographic template is a comprehensive visual tool designed to highlight key data points across the continent's diverse regions. It is versatile and easily adaptable for use in PowerPoint, Google Slides, and Keynote. The template includes various geographic layouts and data visualization elements like human figures for population representation, color-coded regions for quick reference, and icon-based markers for specific data points such as economic indicators or social statistics. Each slide is crafted to allow for clear presentation of information ranging from demographic distributions to project locations, making it an invaluable resource for educators, and organizations working with African continental data.


5 slides
World History Infographic Presentation
Bring the past to life with this engaging World History Infographic presentation. Featuring a circular layout with 4 editable sections, this infographic allows you to highlight key events, historical milestones, or cultural movements. Ideal for educators, students, and history enthusiasts, it’s designed for clarity, storytelling, and visual appeal. Fully compatible with PowerPoint, Keynote, and Google Slides – and easy to customize for any topic or timeline.


23 slides
Ethelin Digital Strategy Presentation
The digital strategy presentation template is designed to showcase your company's goals, market analysis, and strategic initiatives. Featuring slides for SWOT analysis, performance metrics, and action plans, it’s perfect for business planning and stakeholder engagement. Fully customizable and compatible with PowerPoint, Keynote, and Google Slides.


21 slides
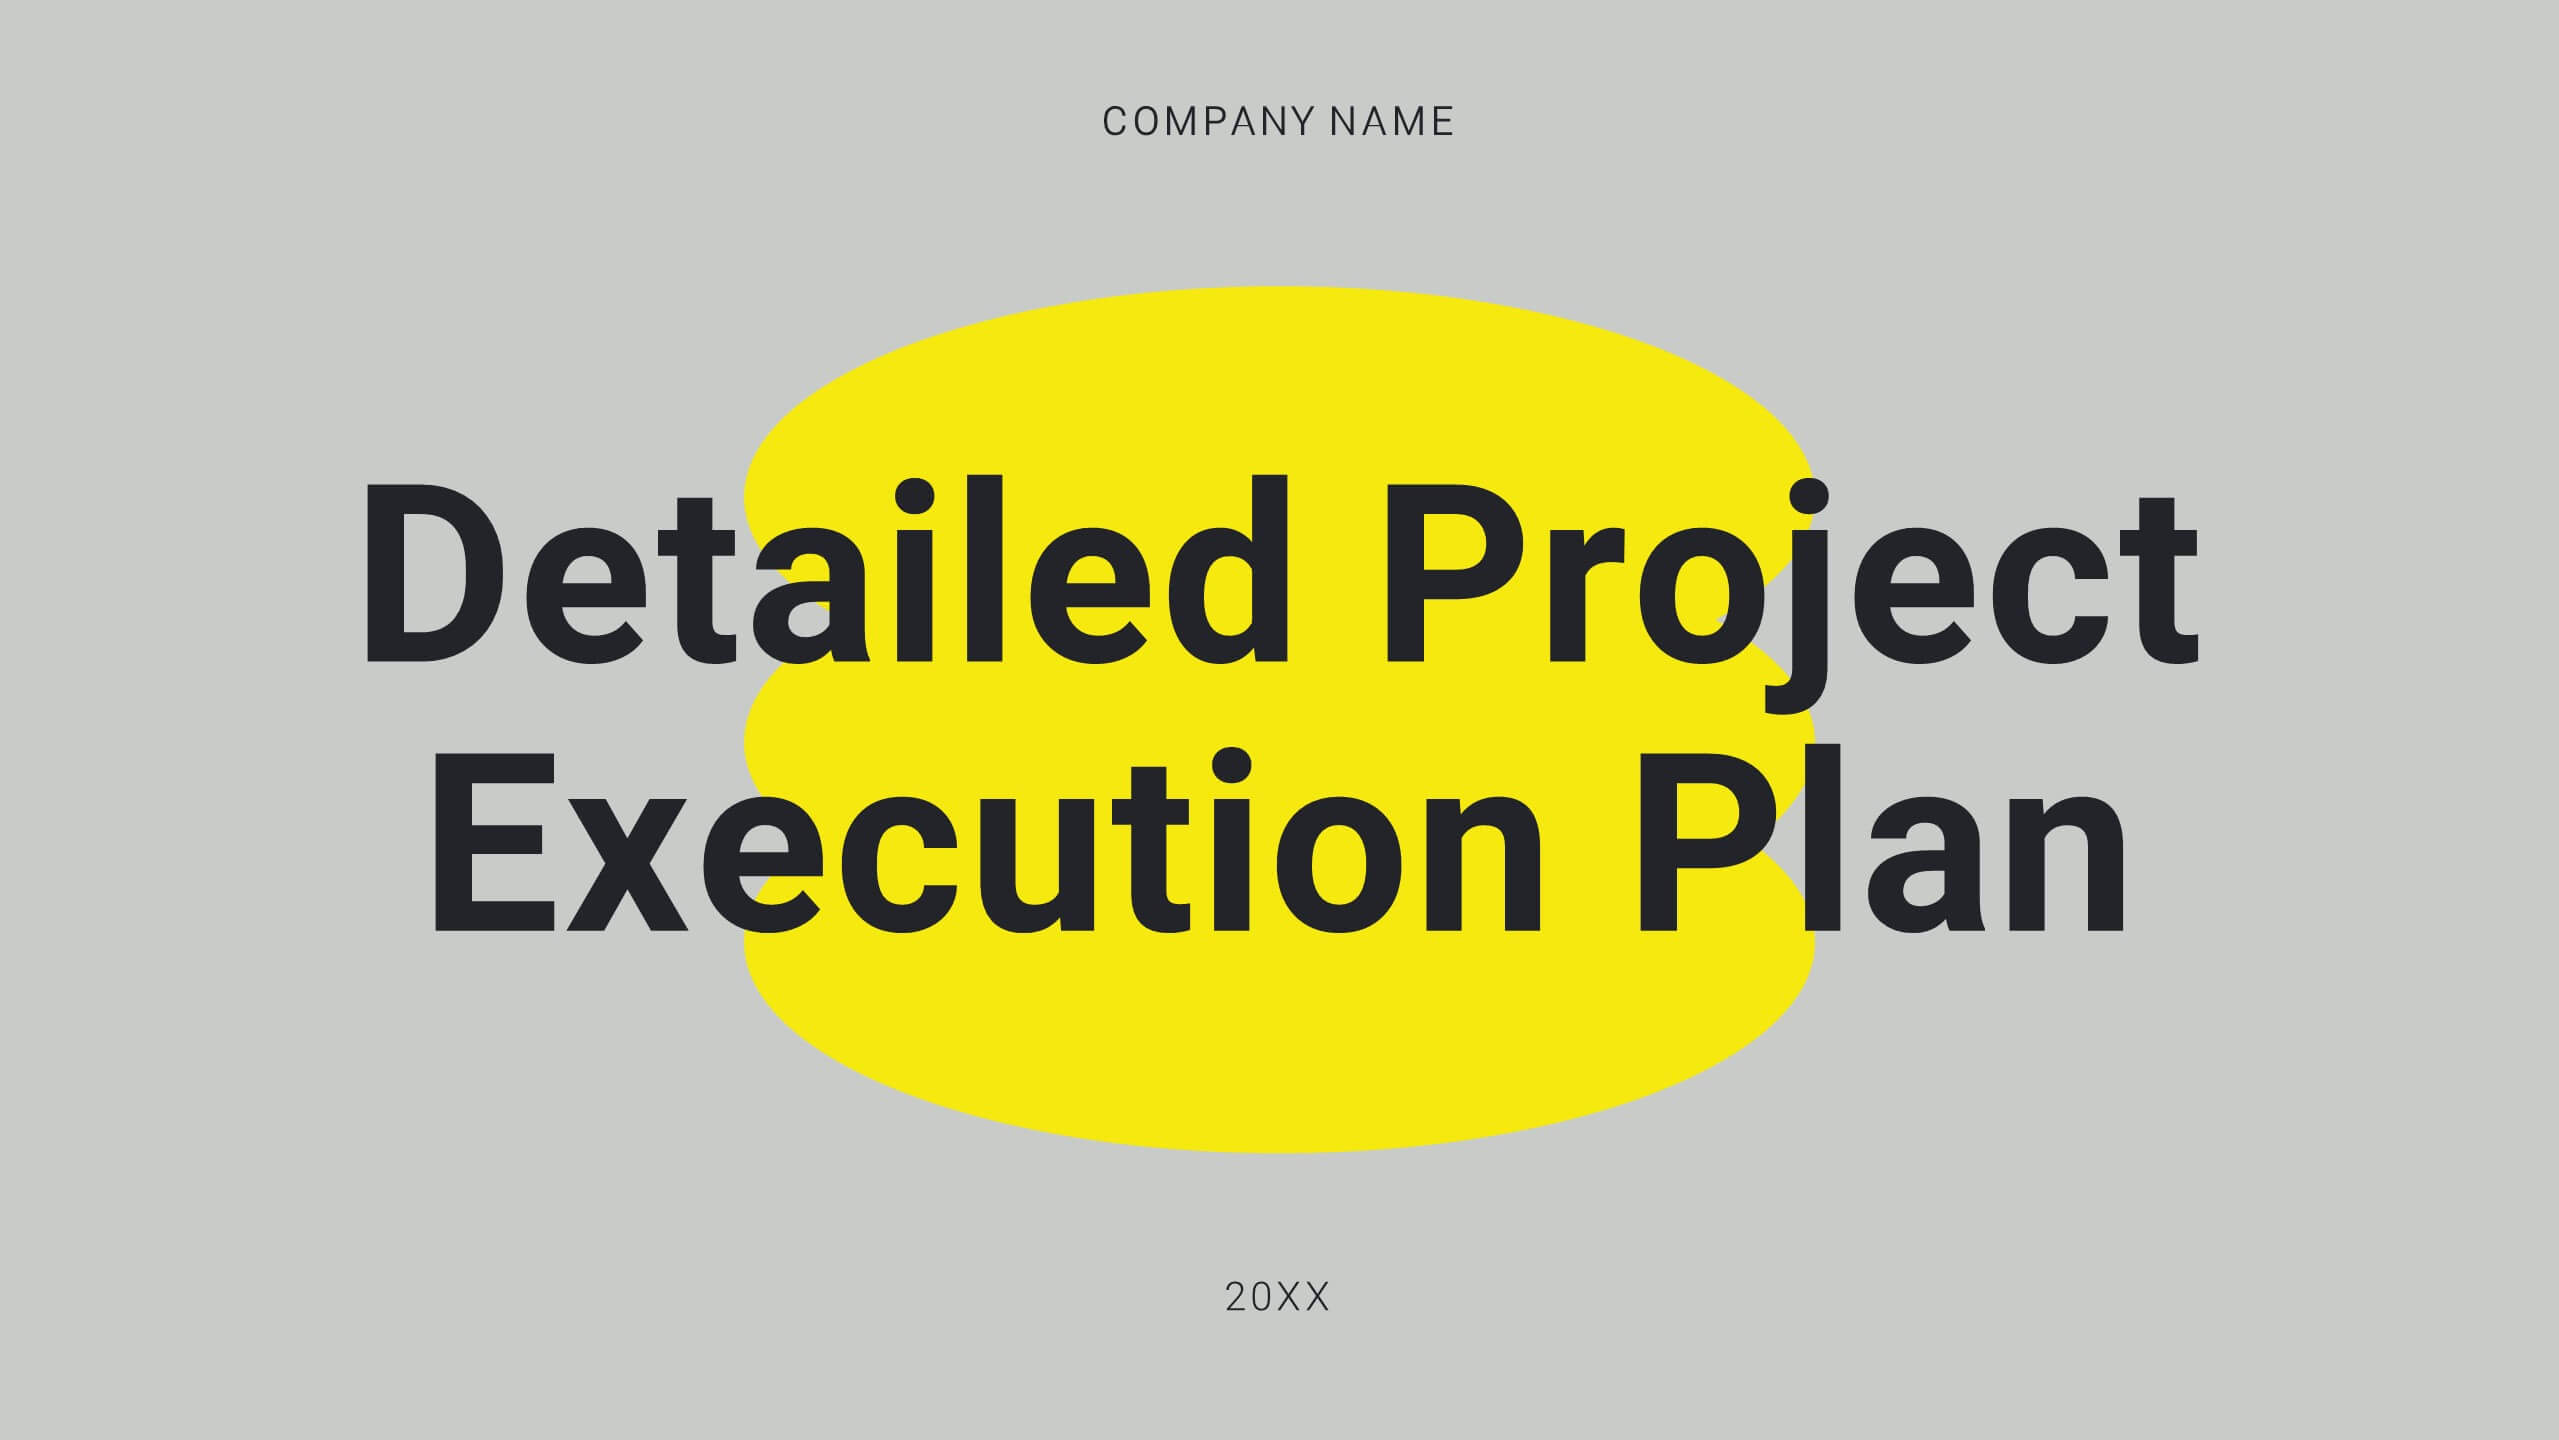
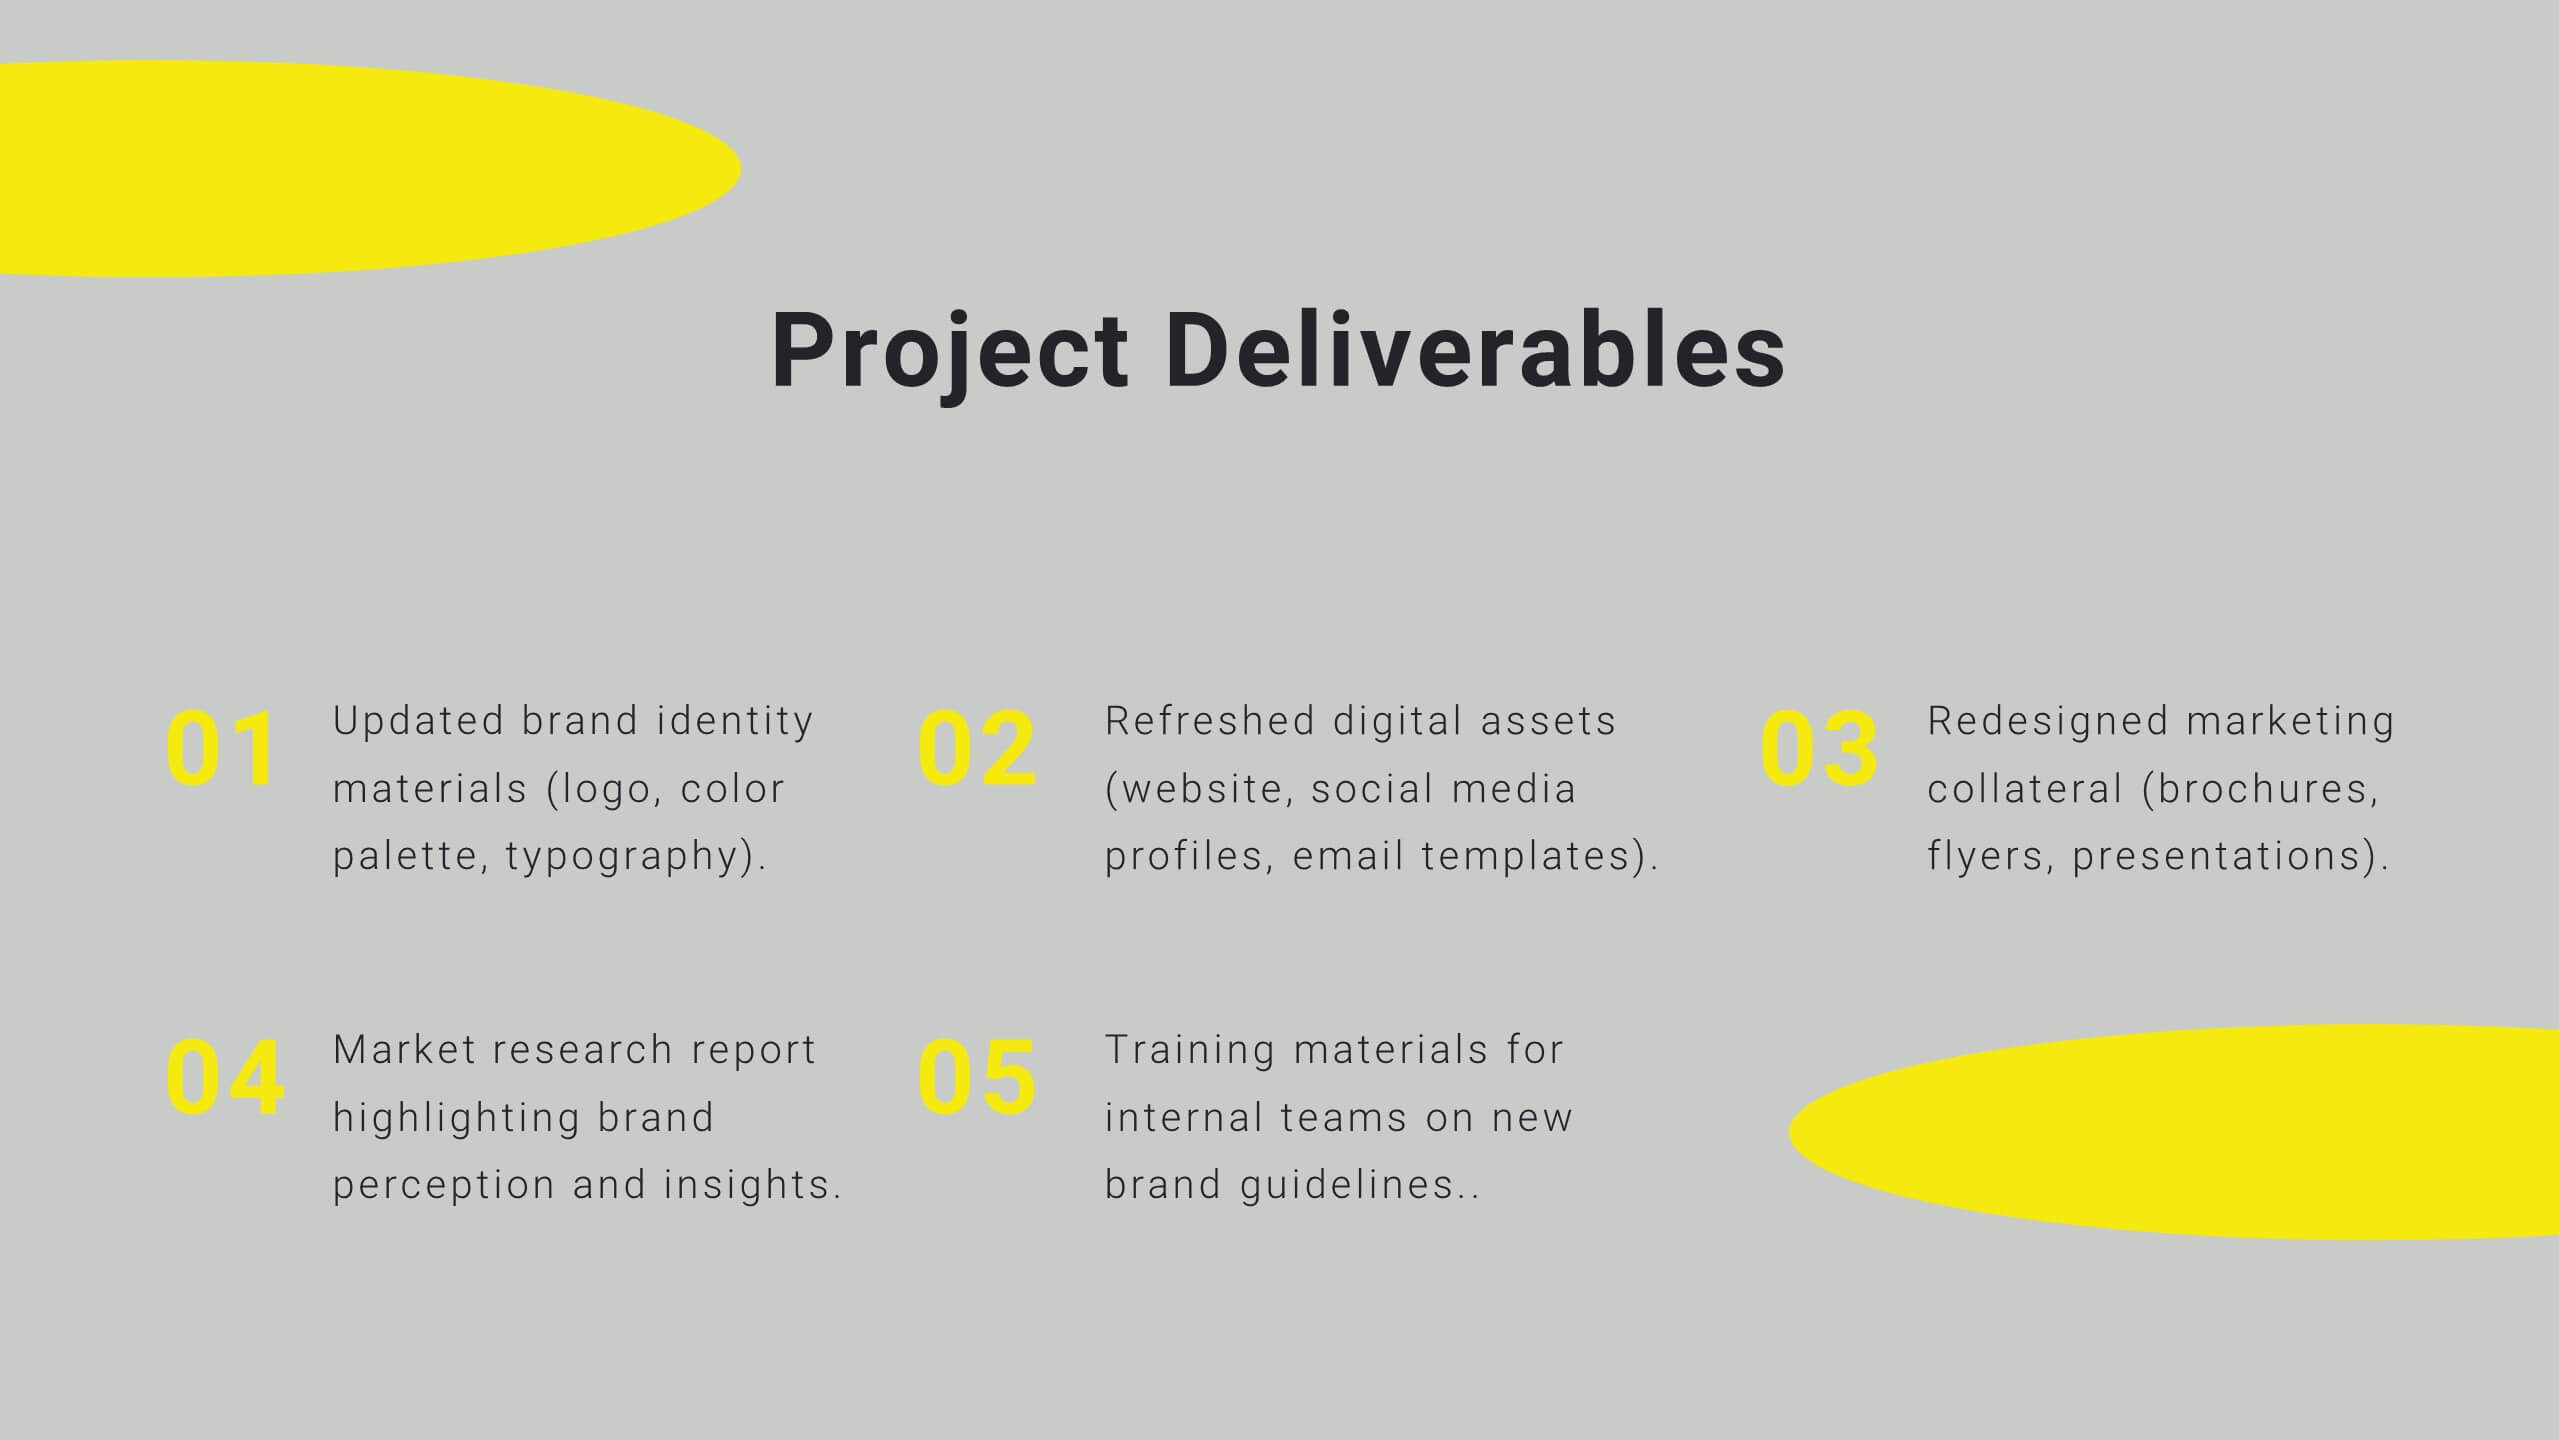
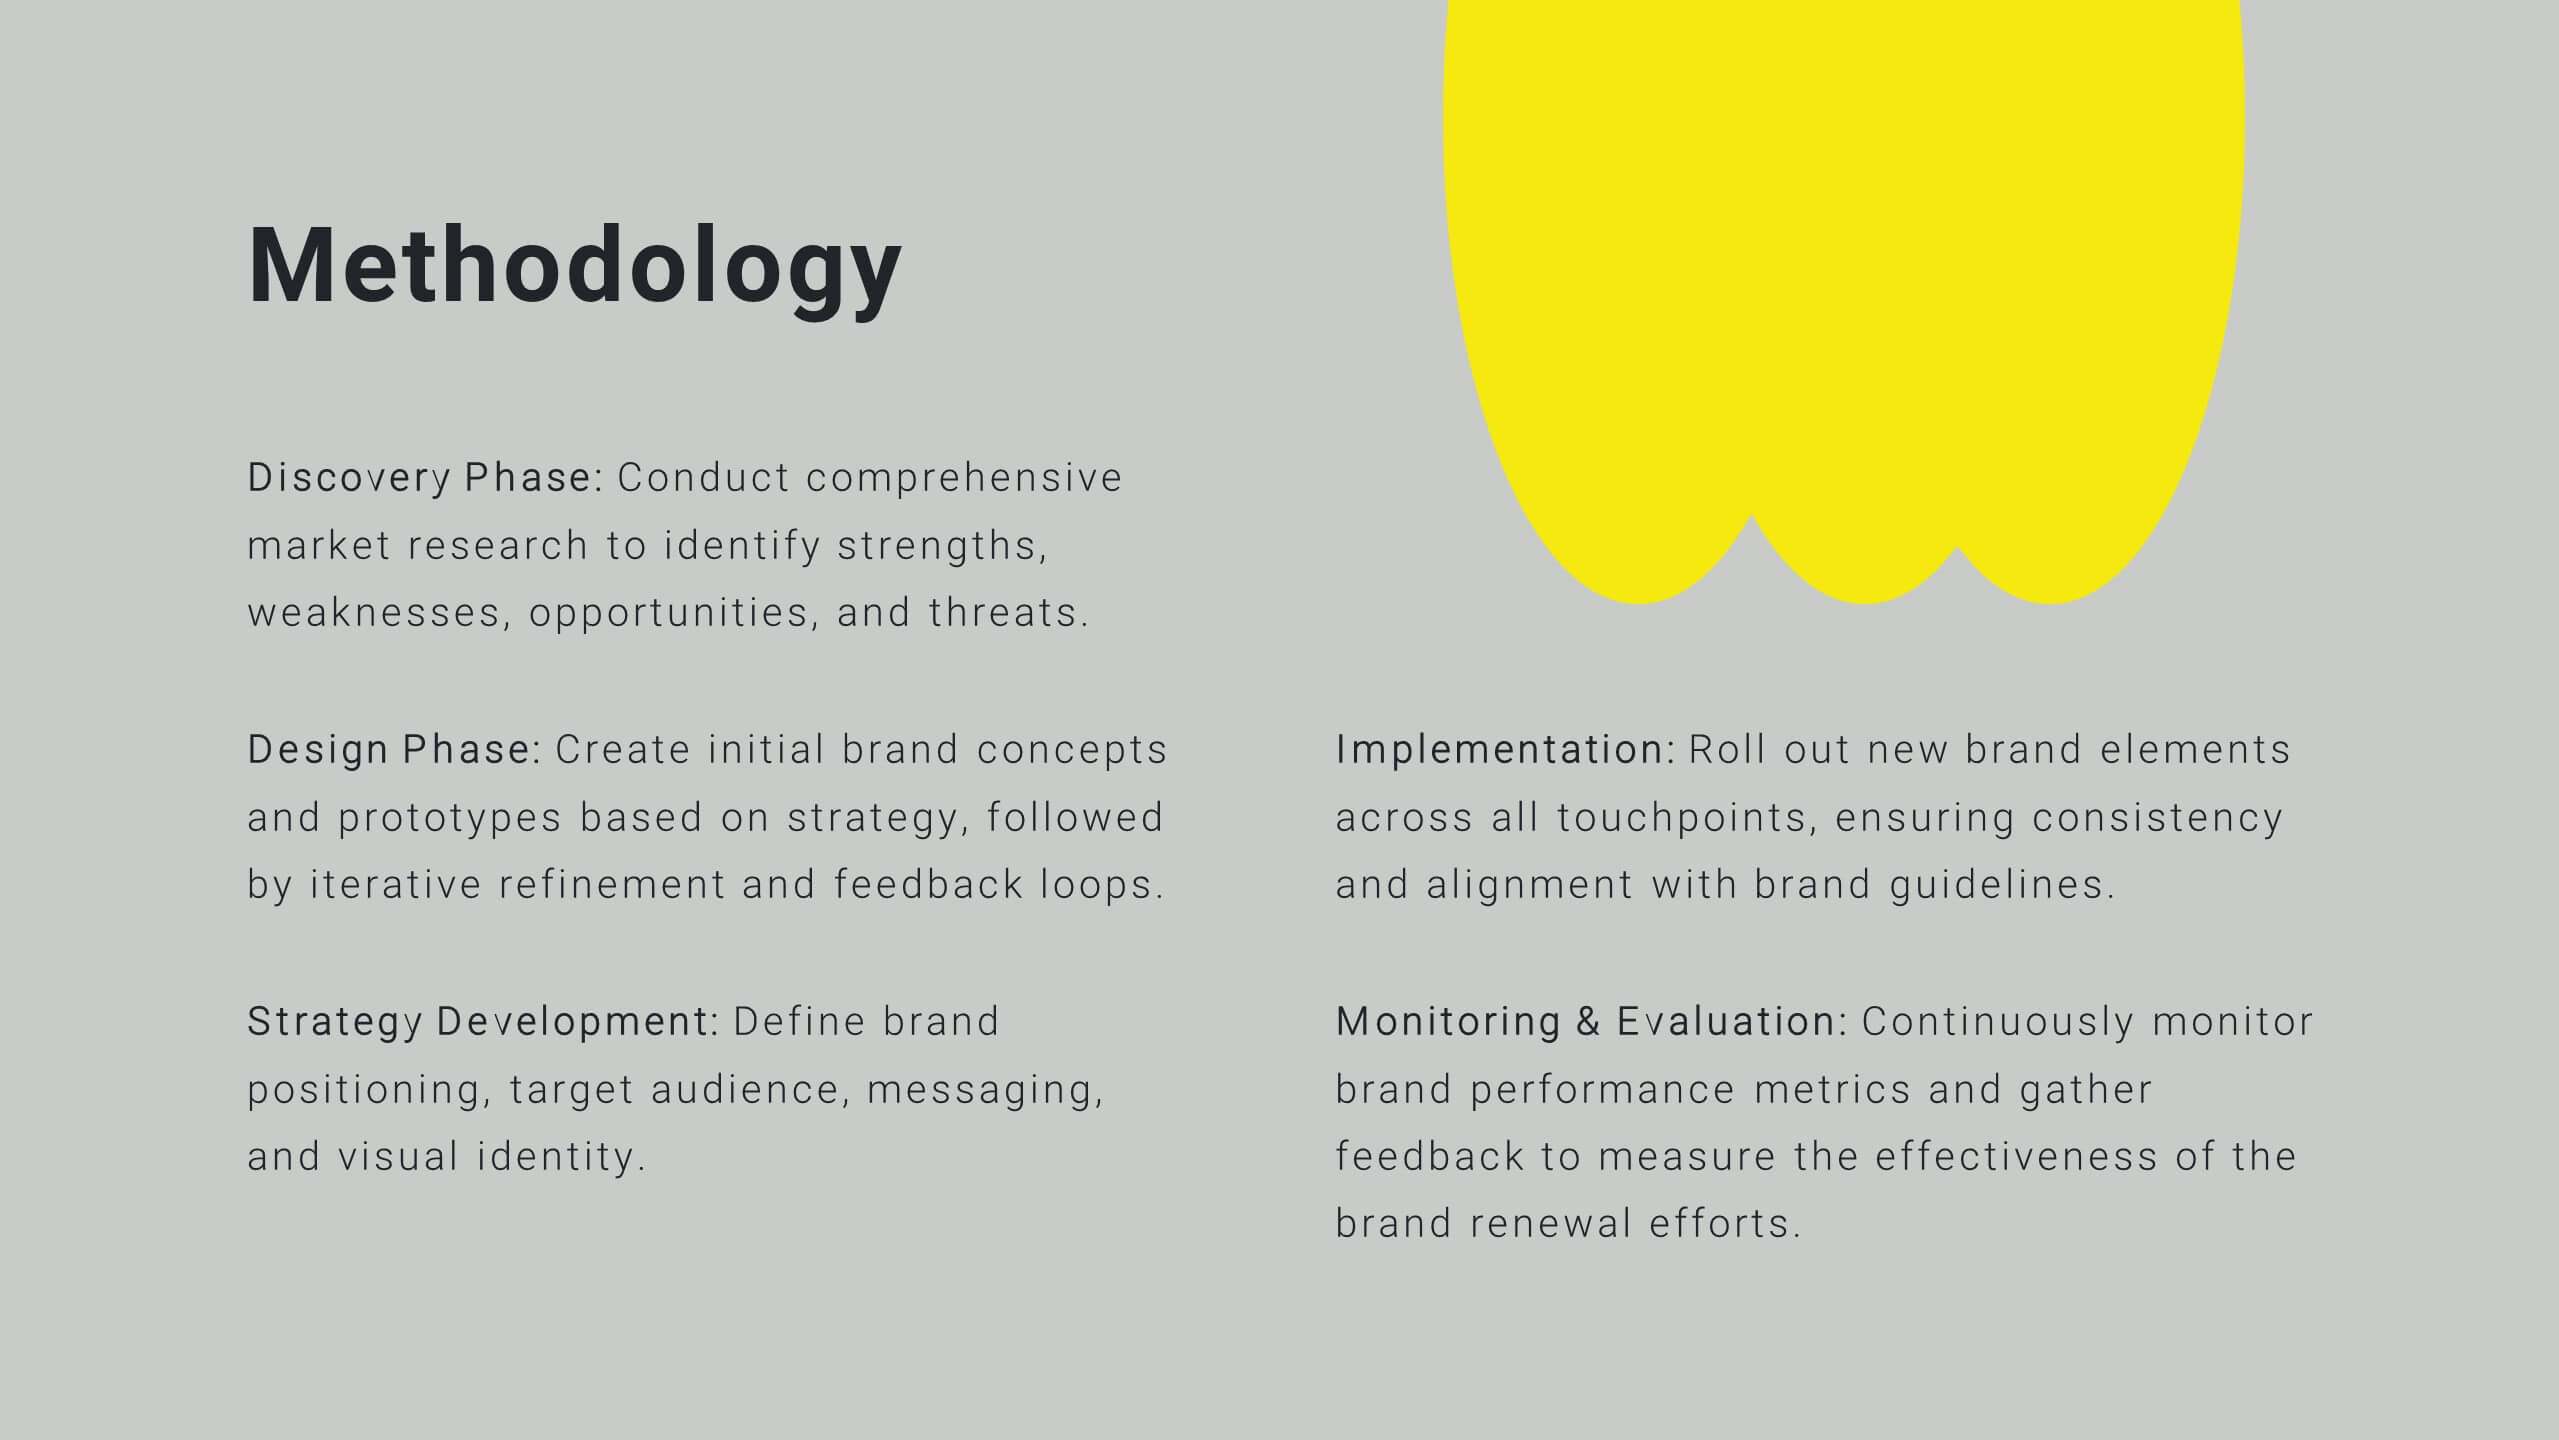
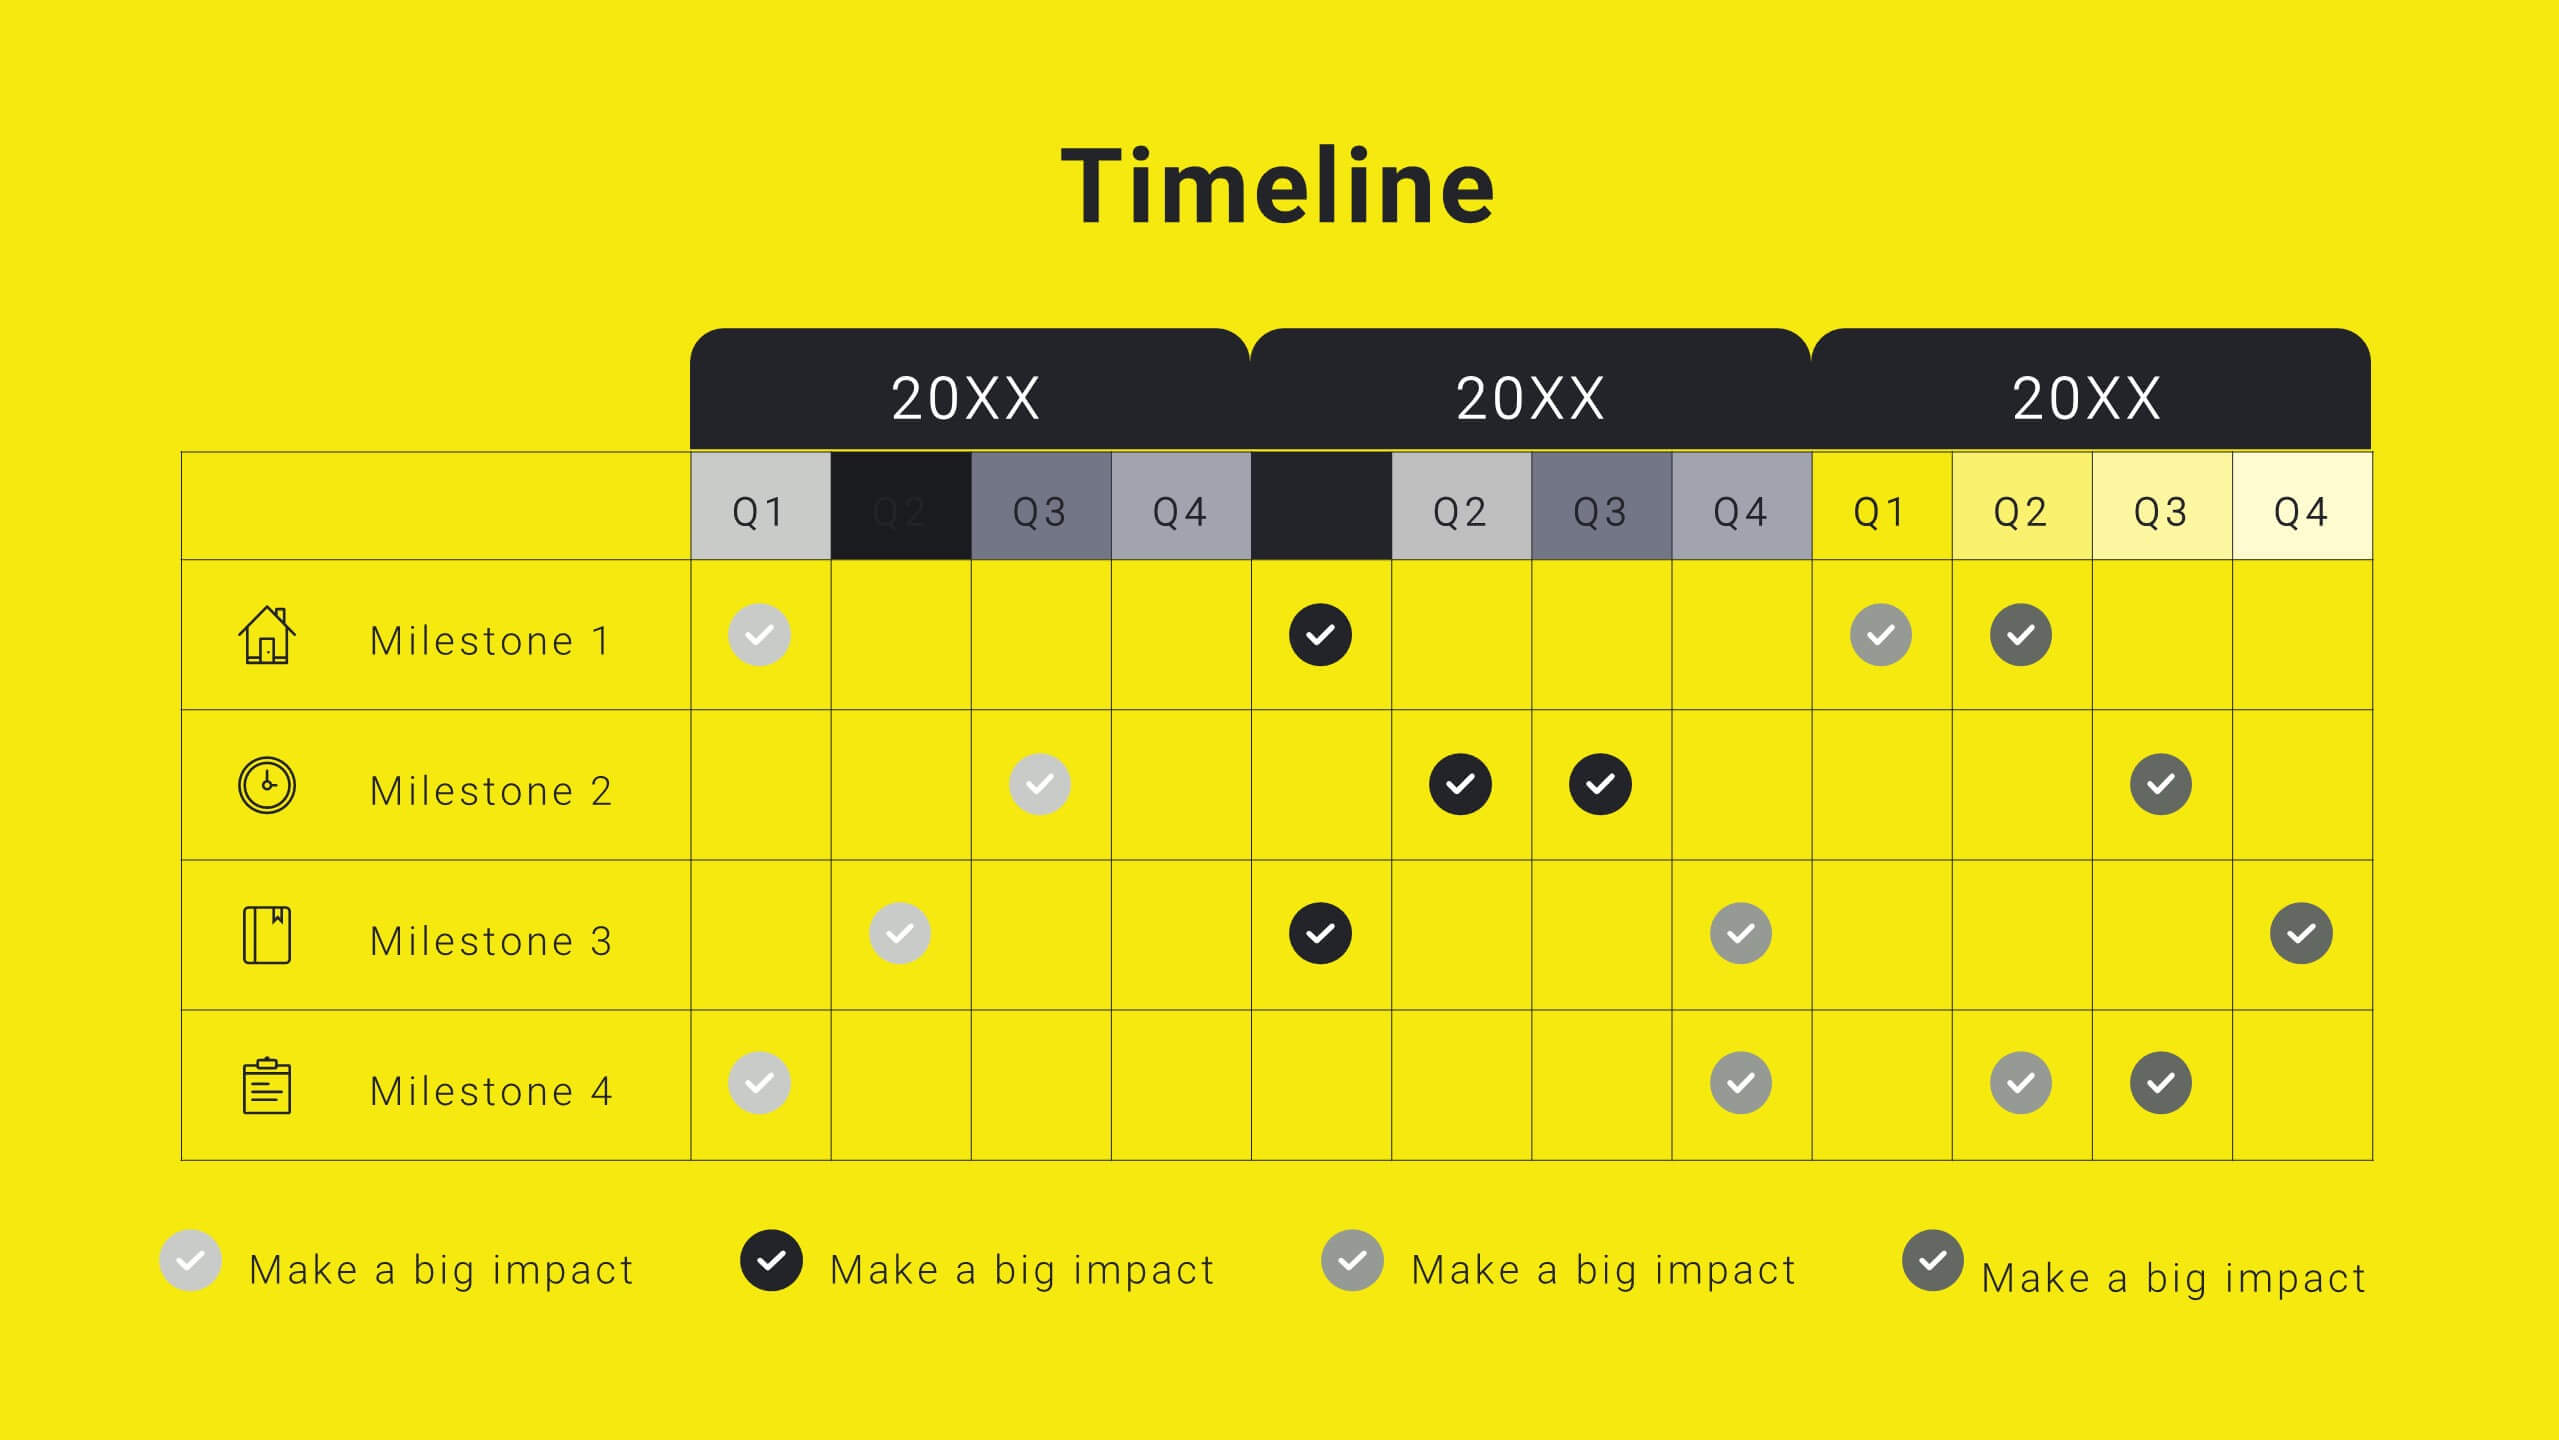
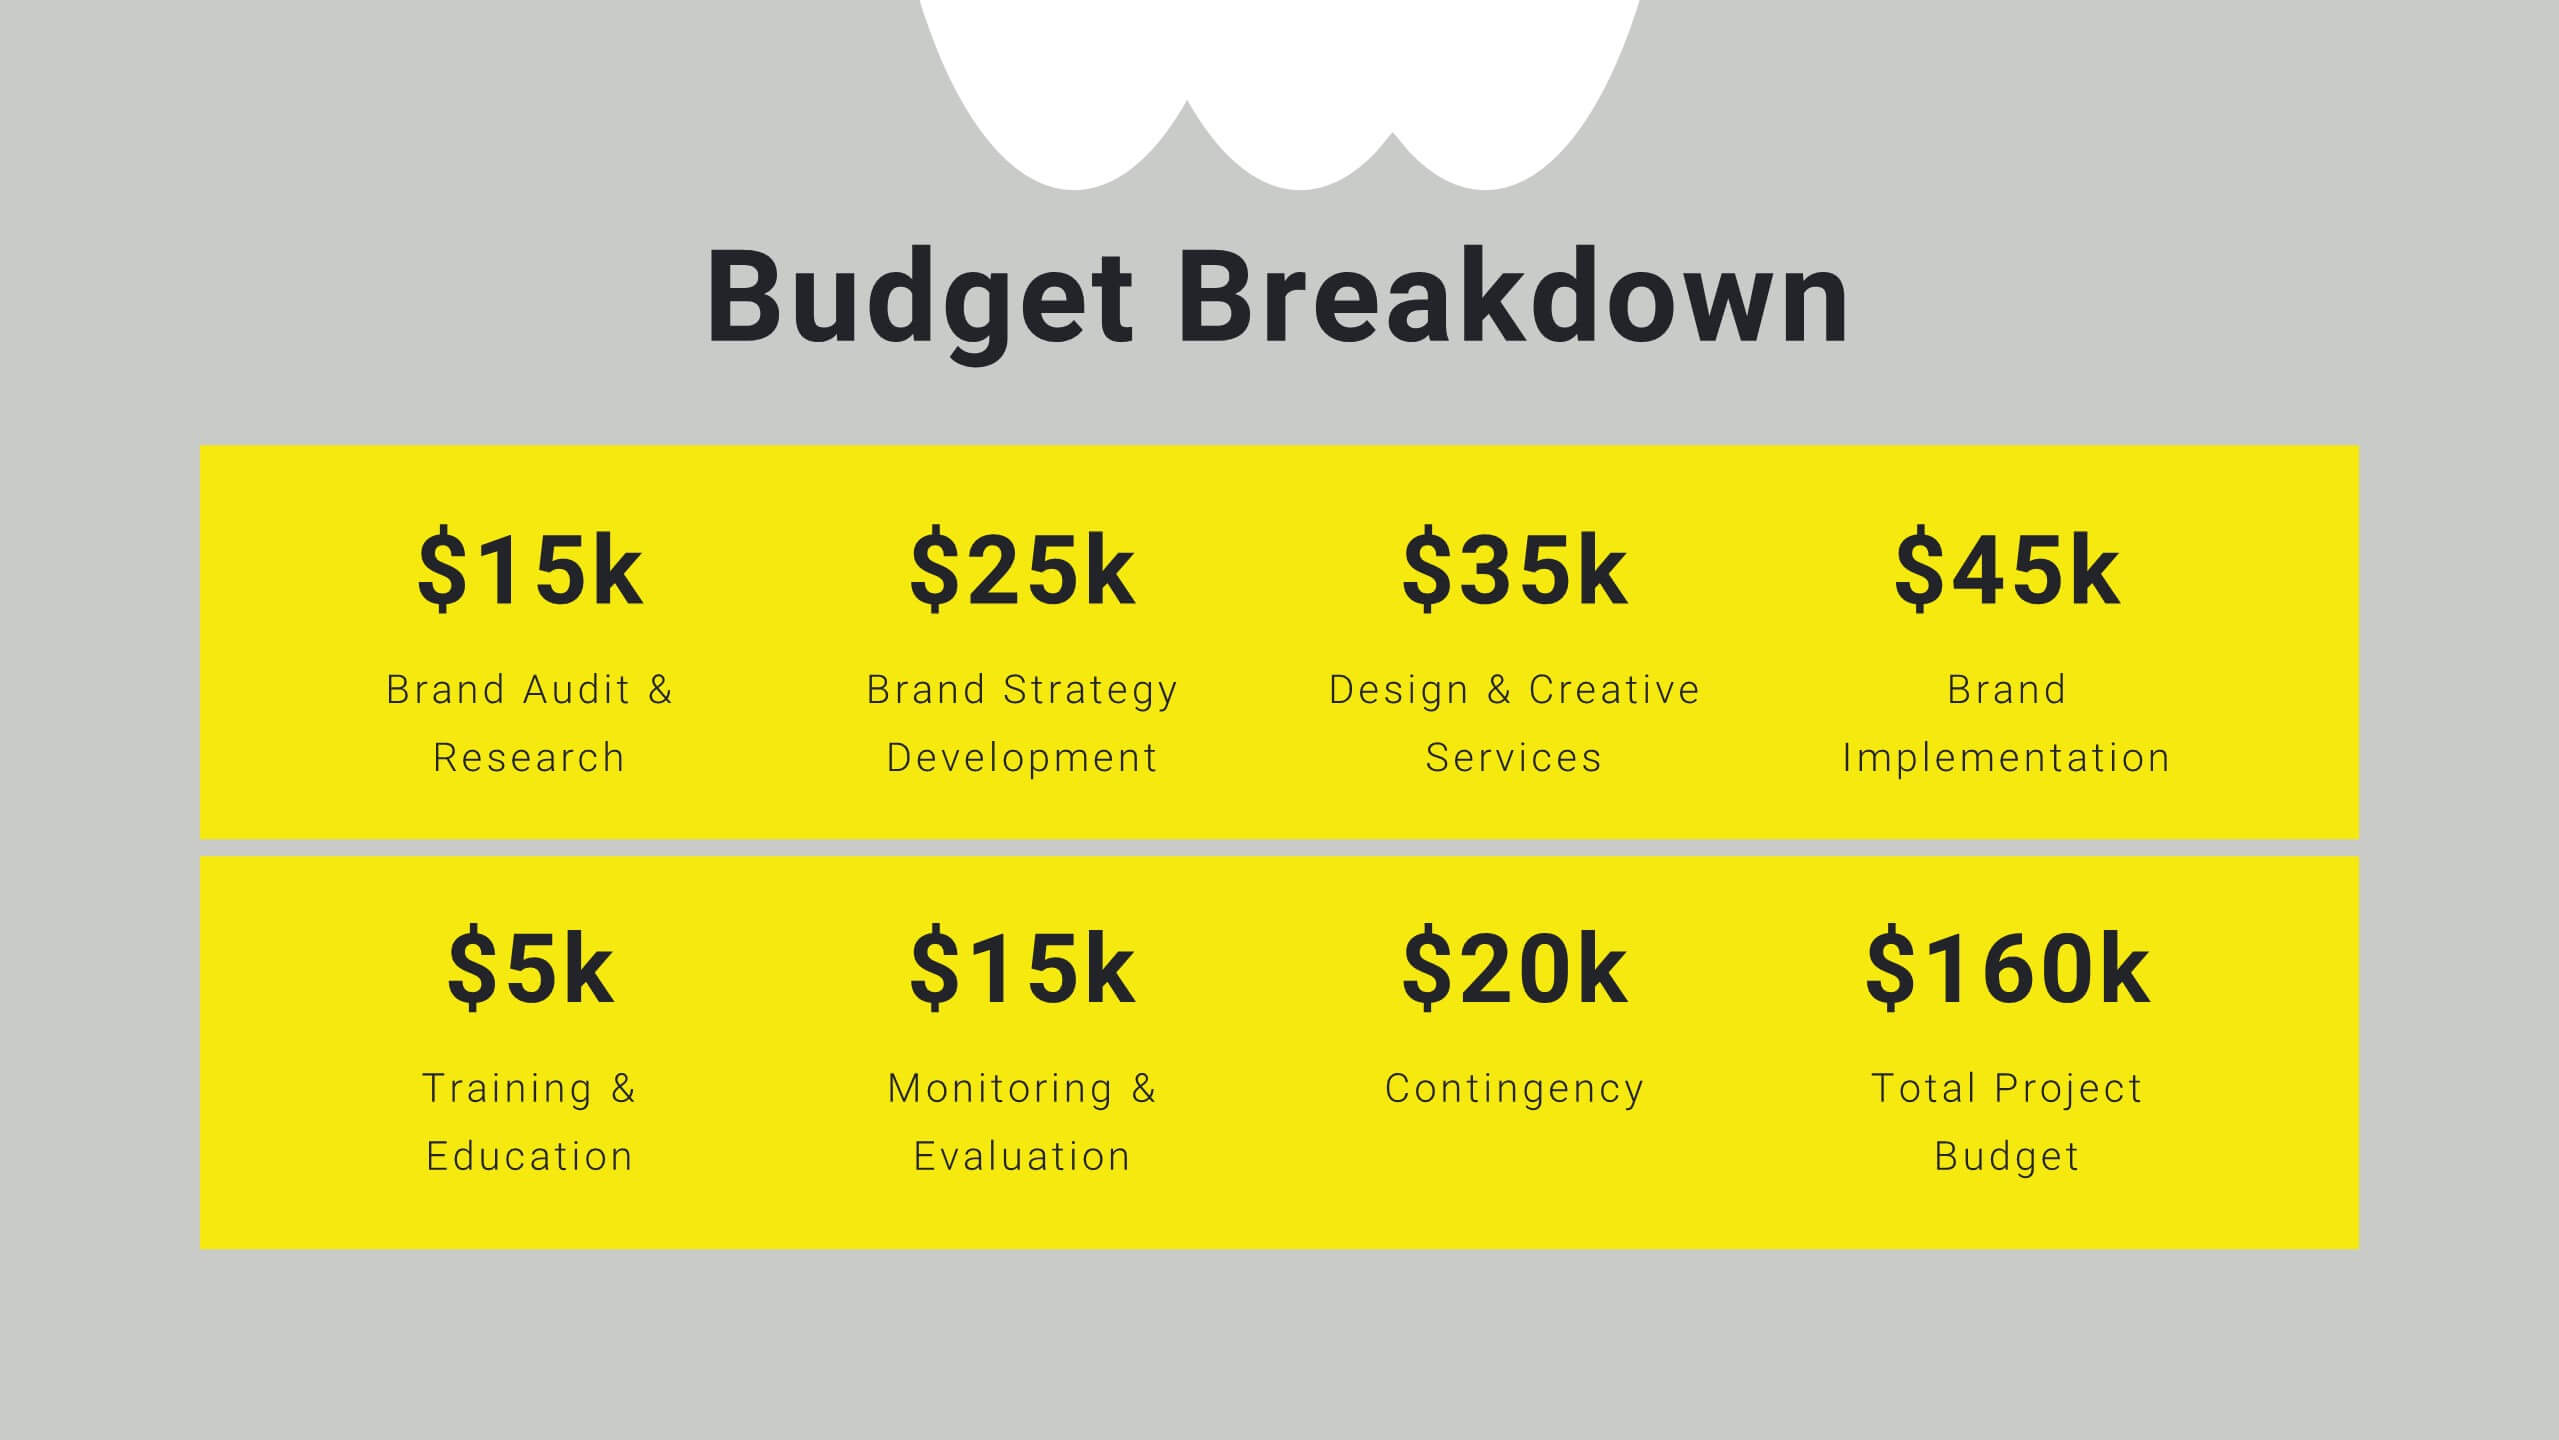
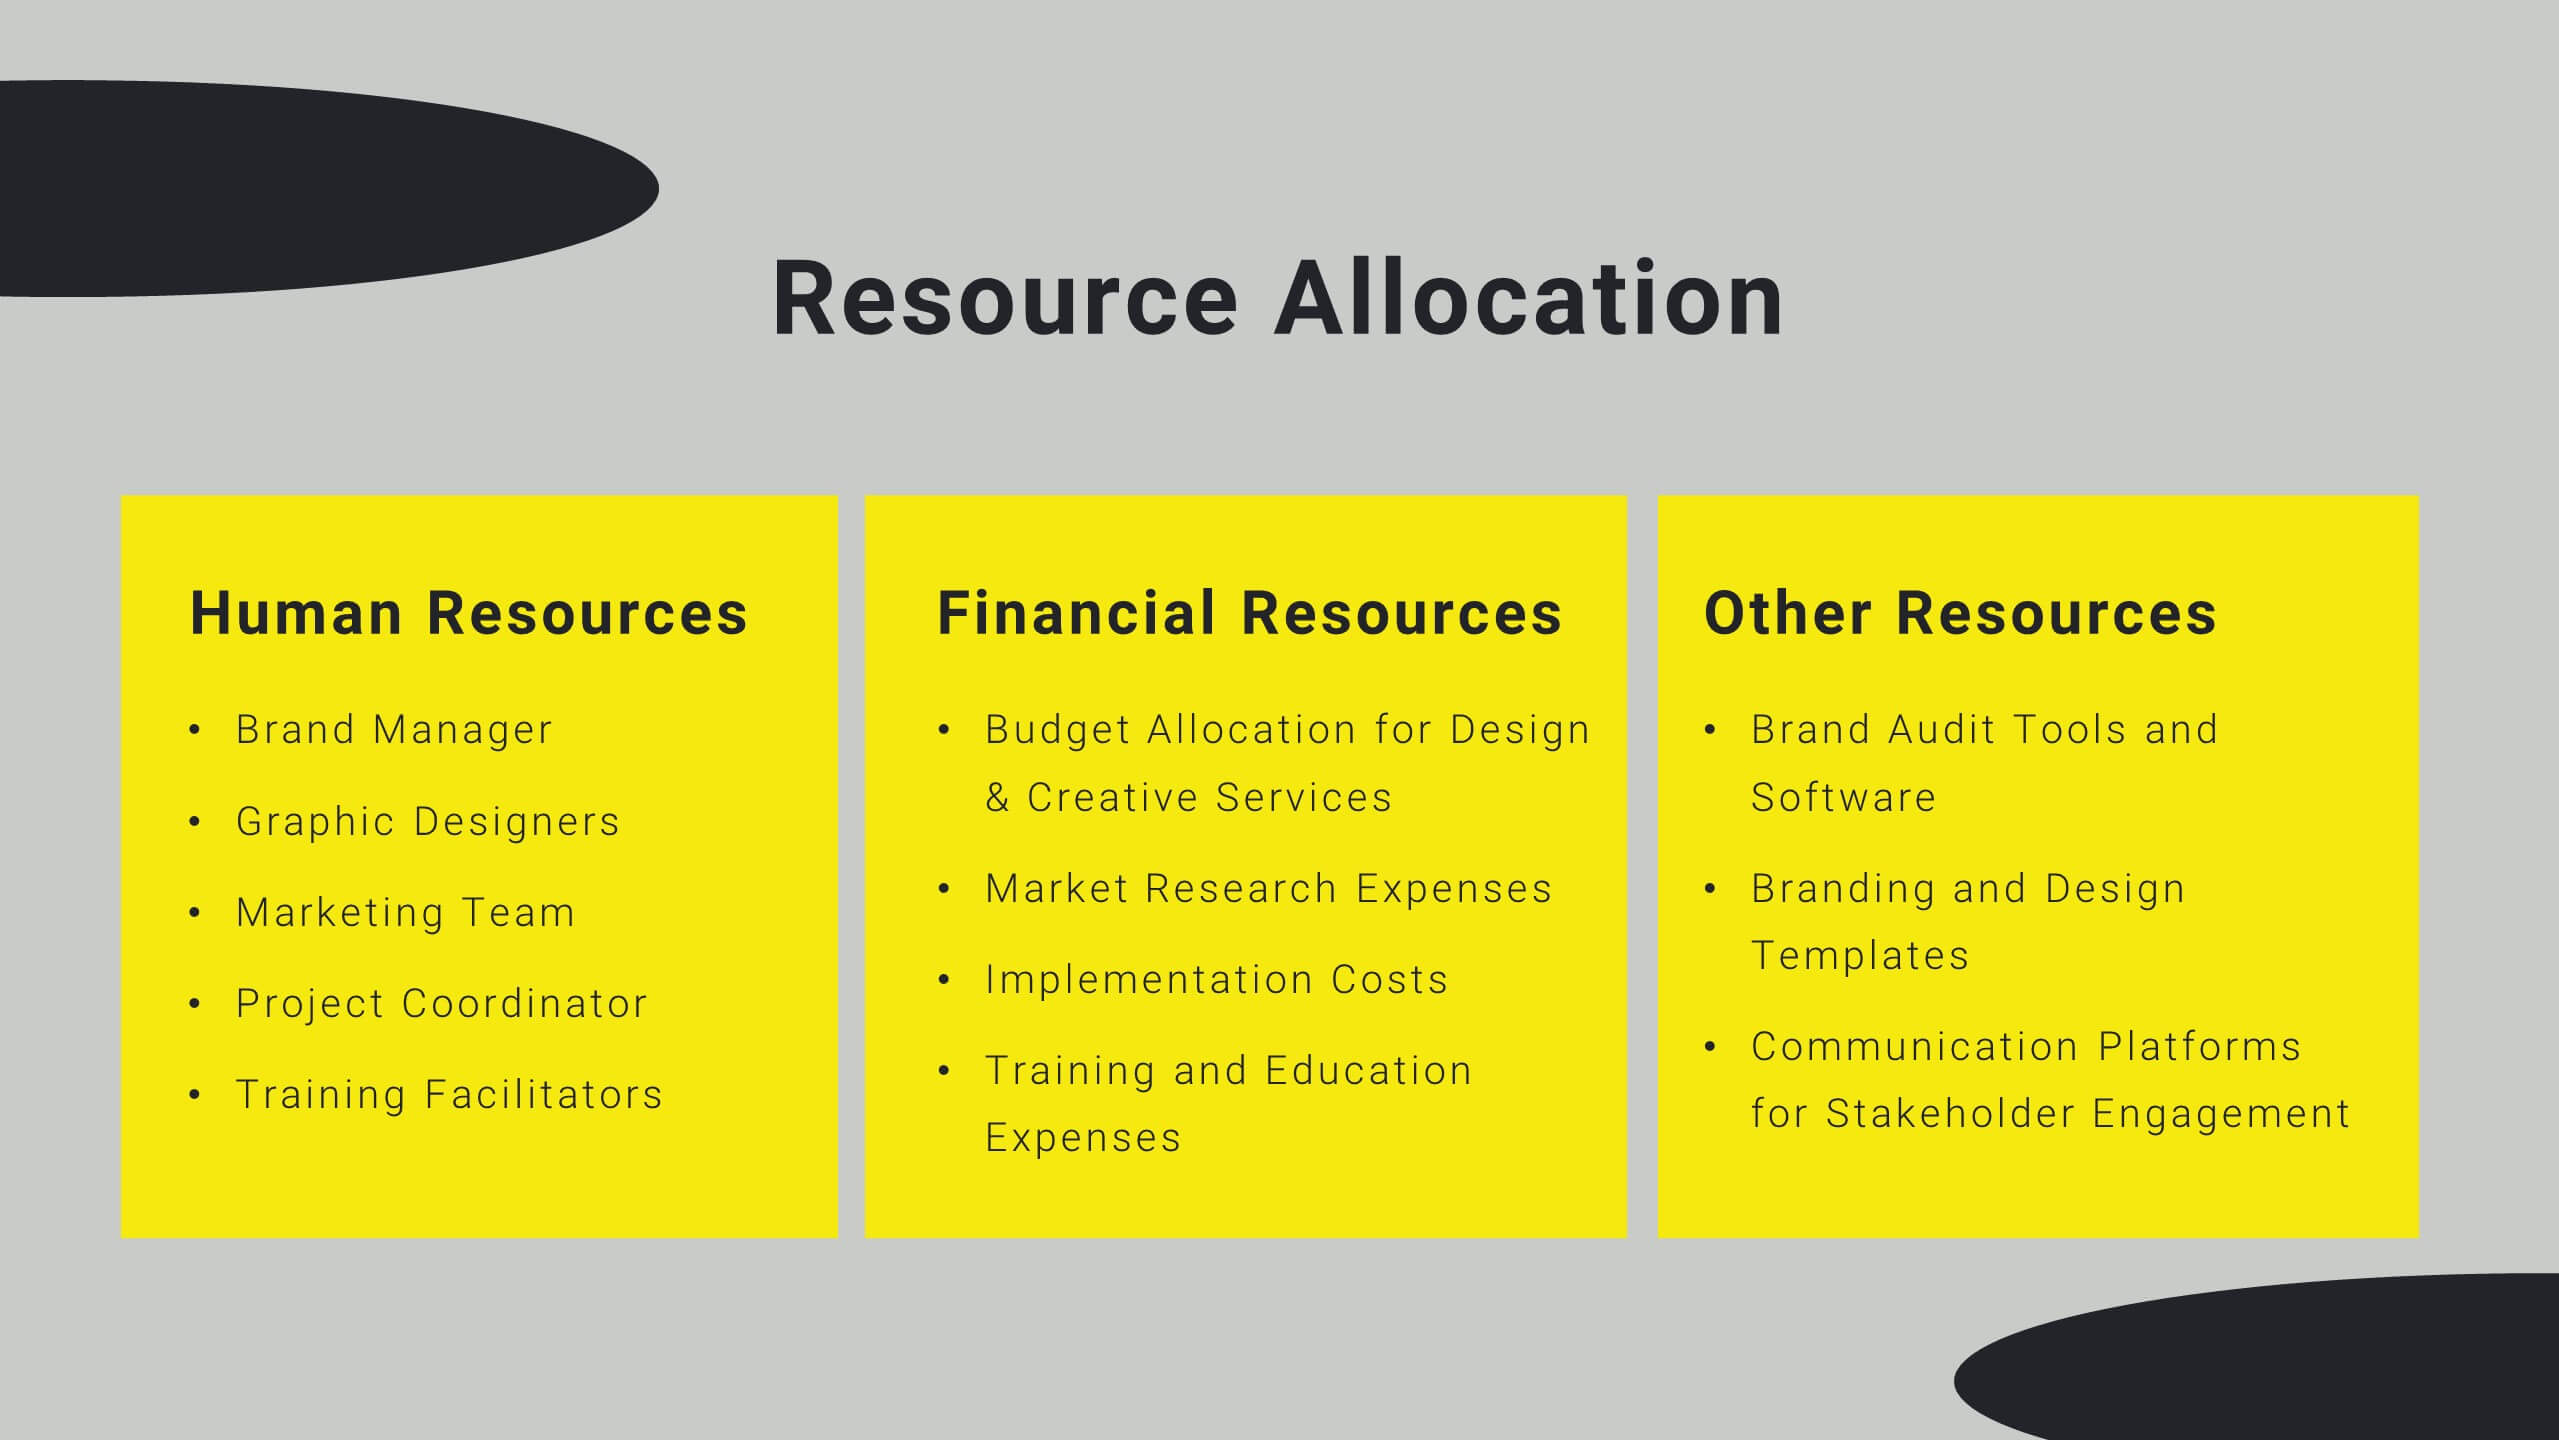
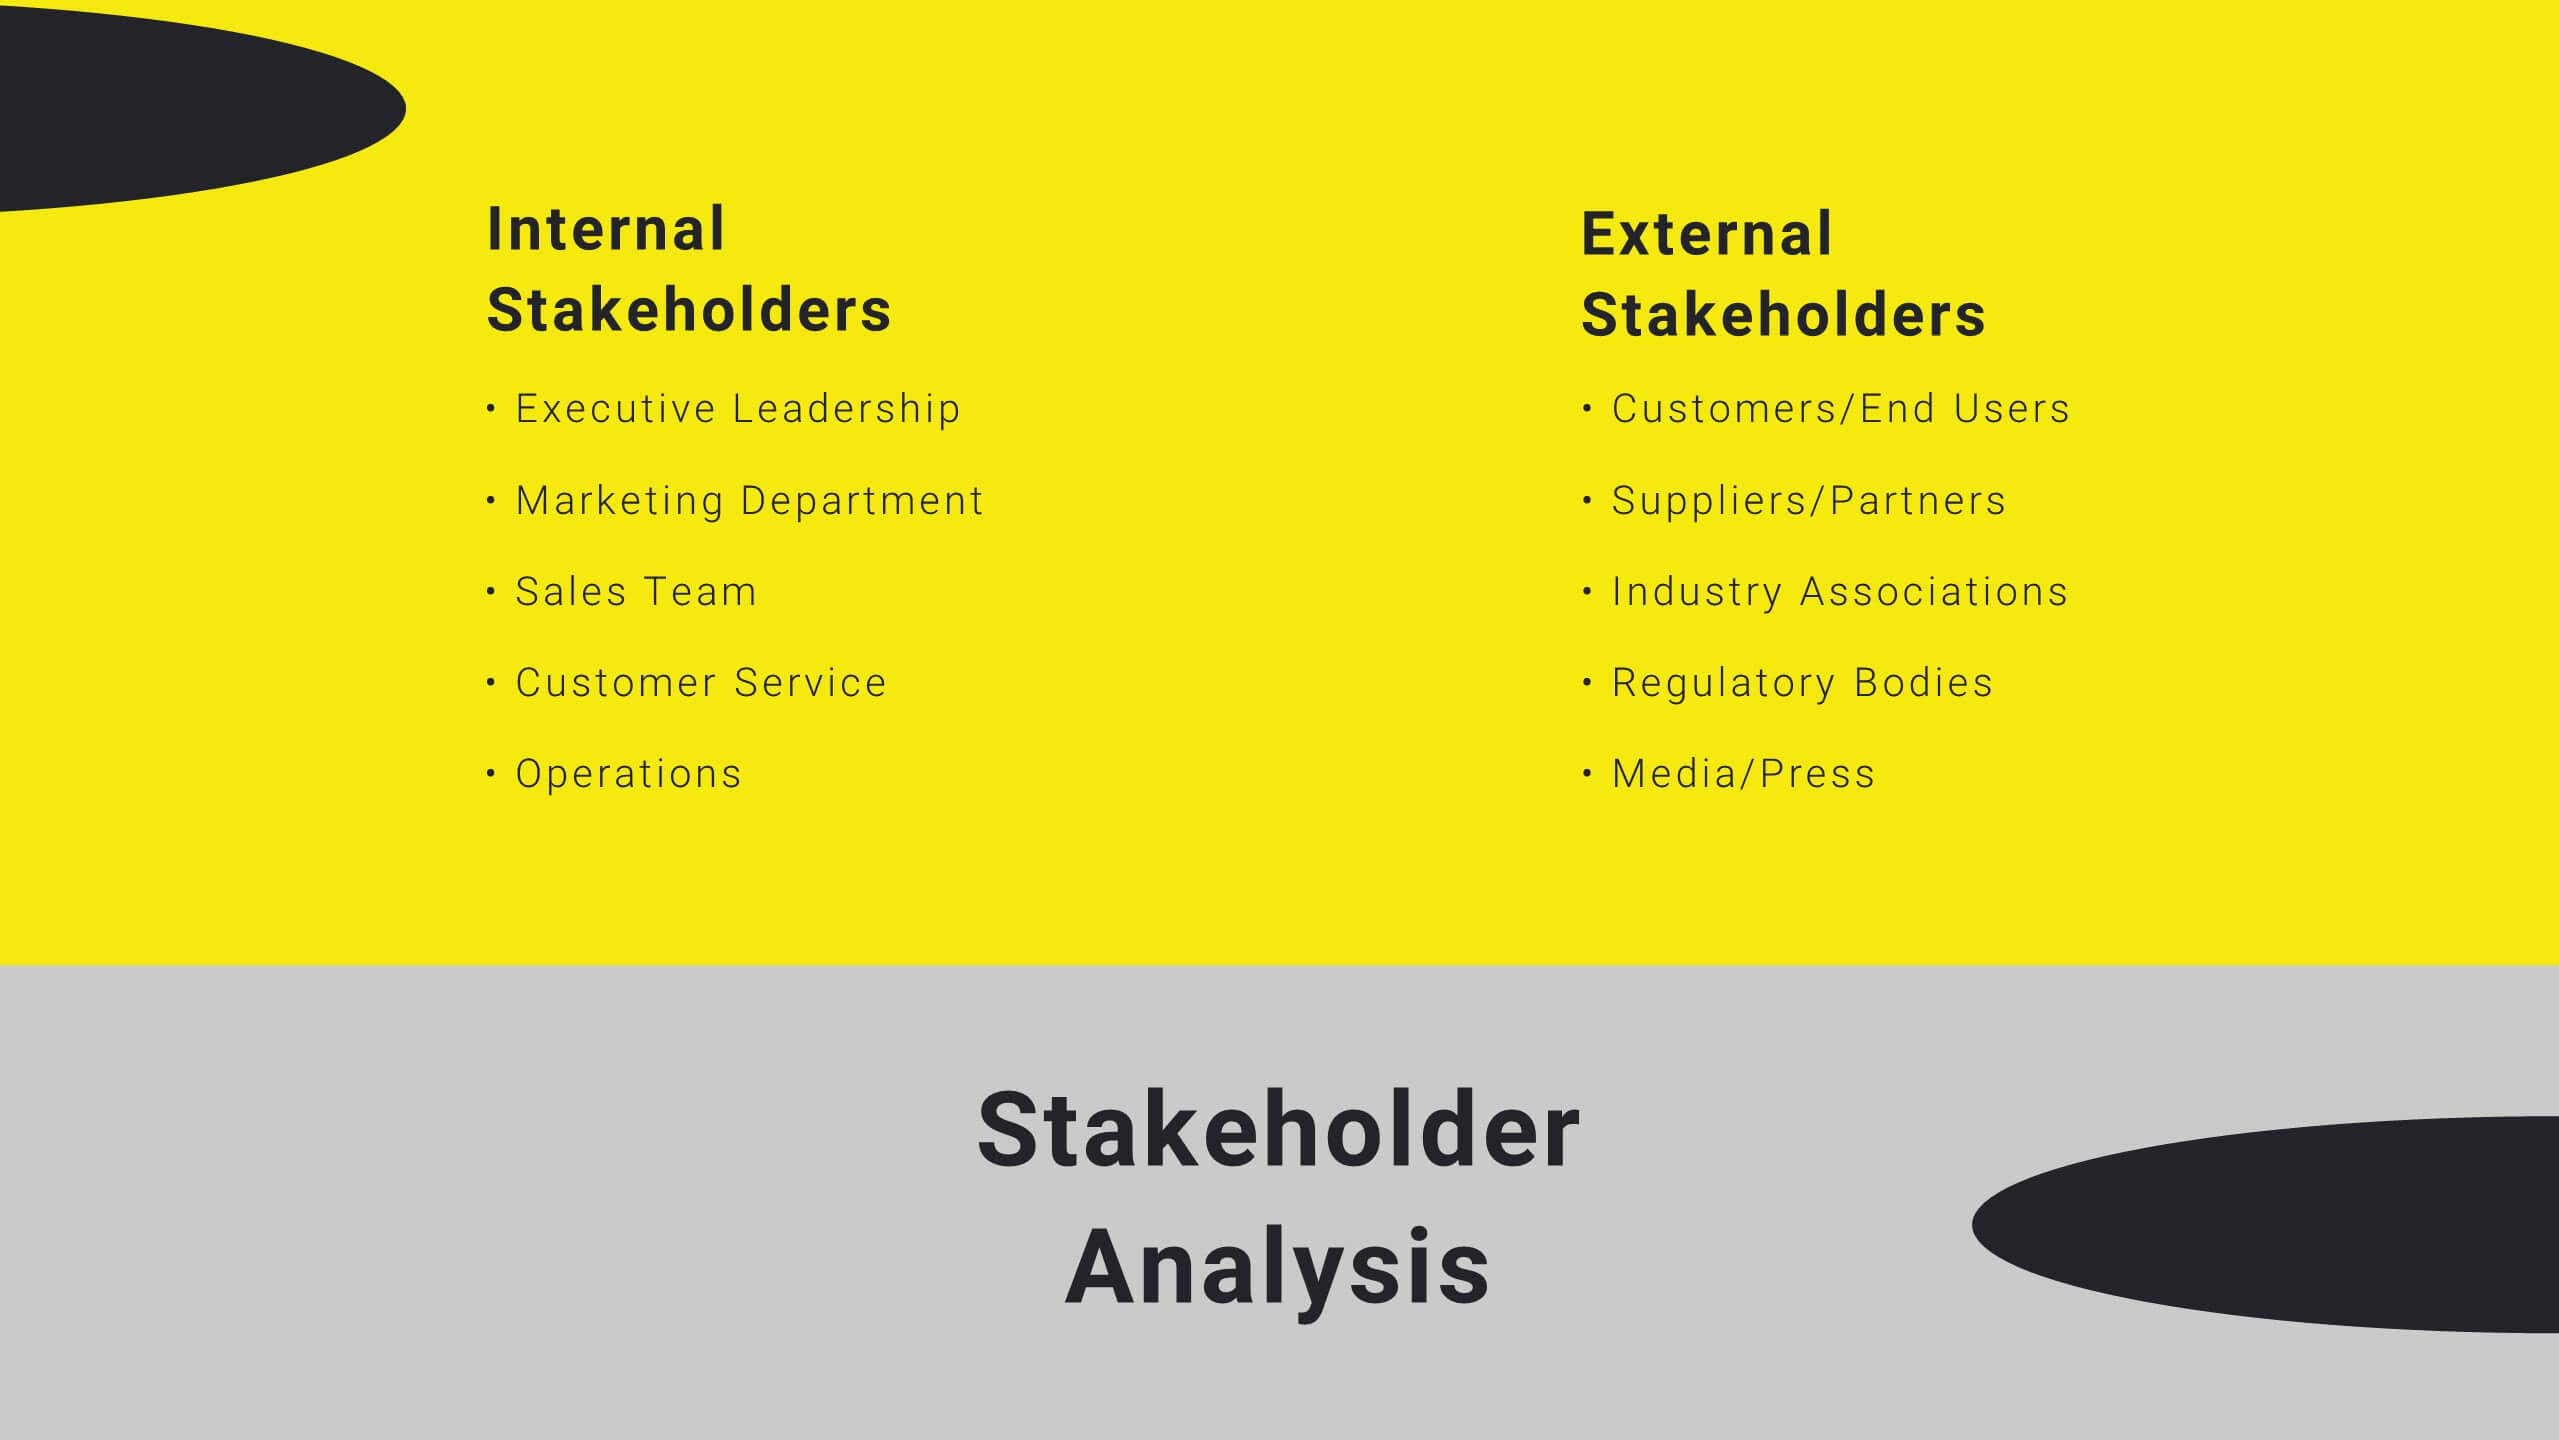
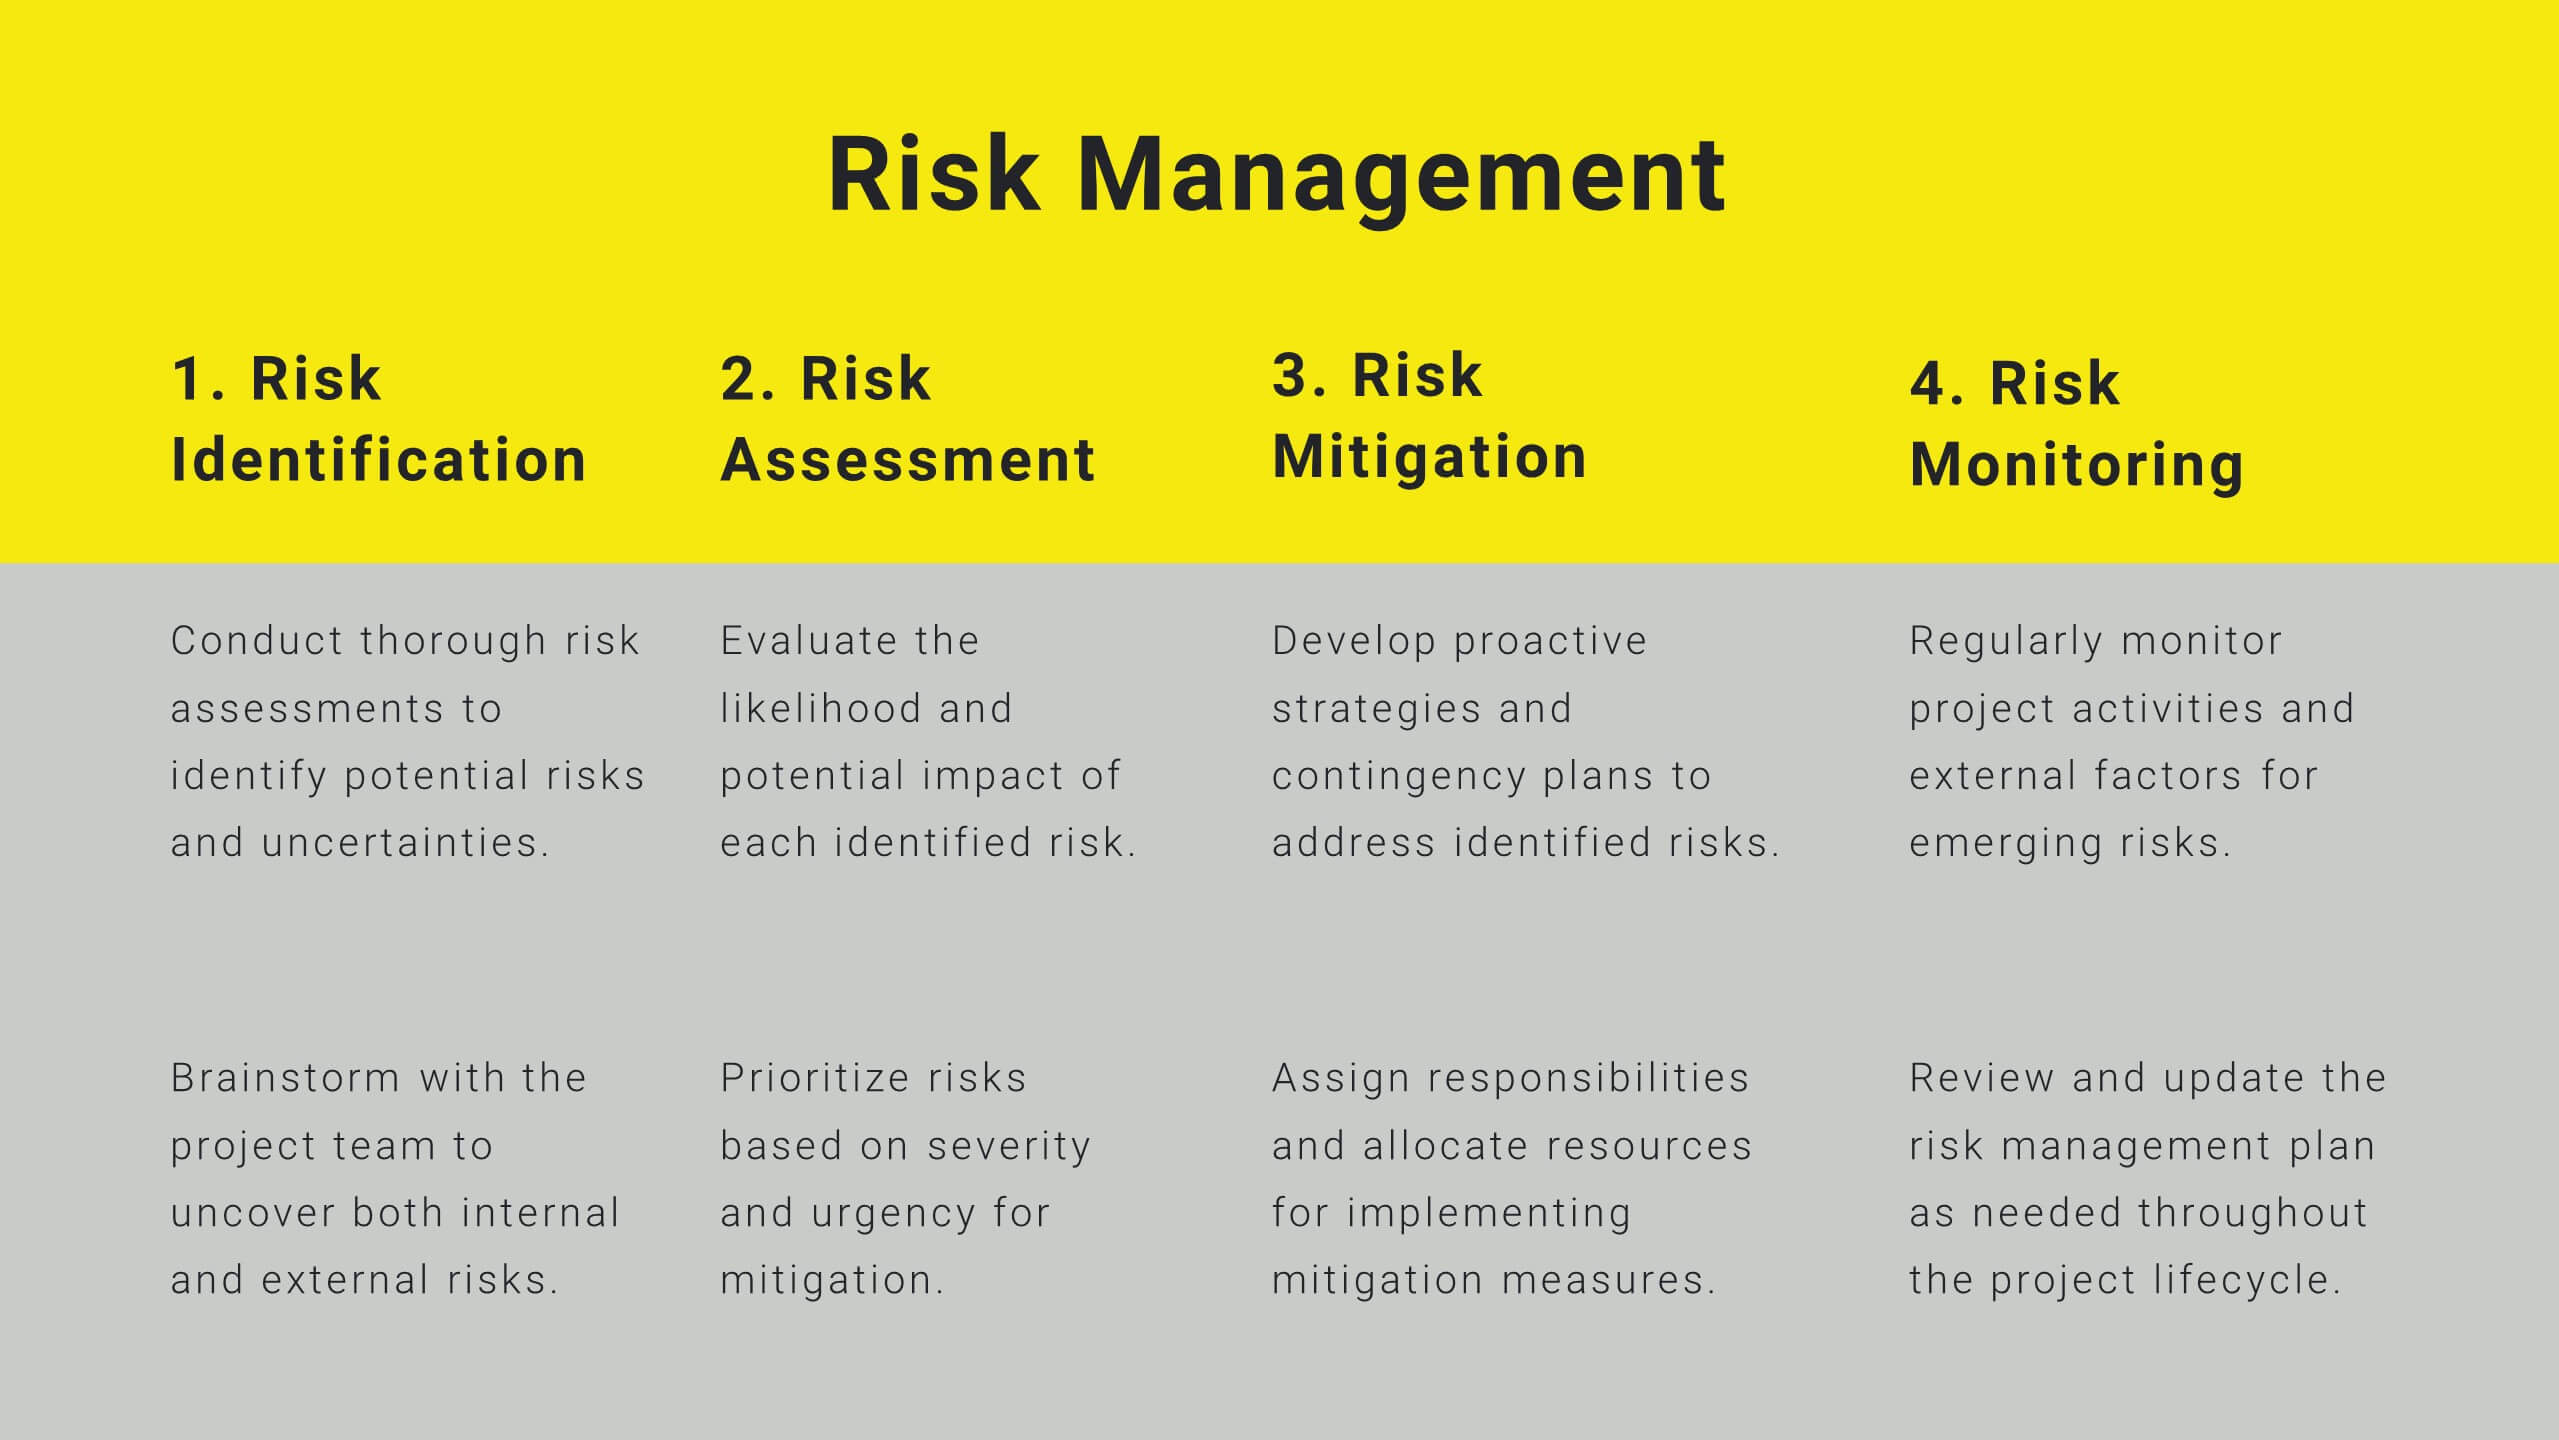
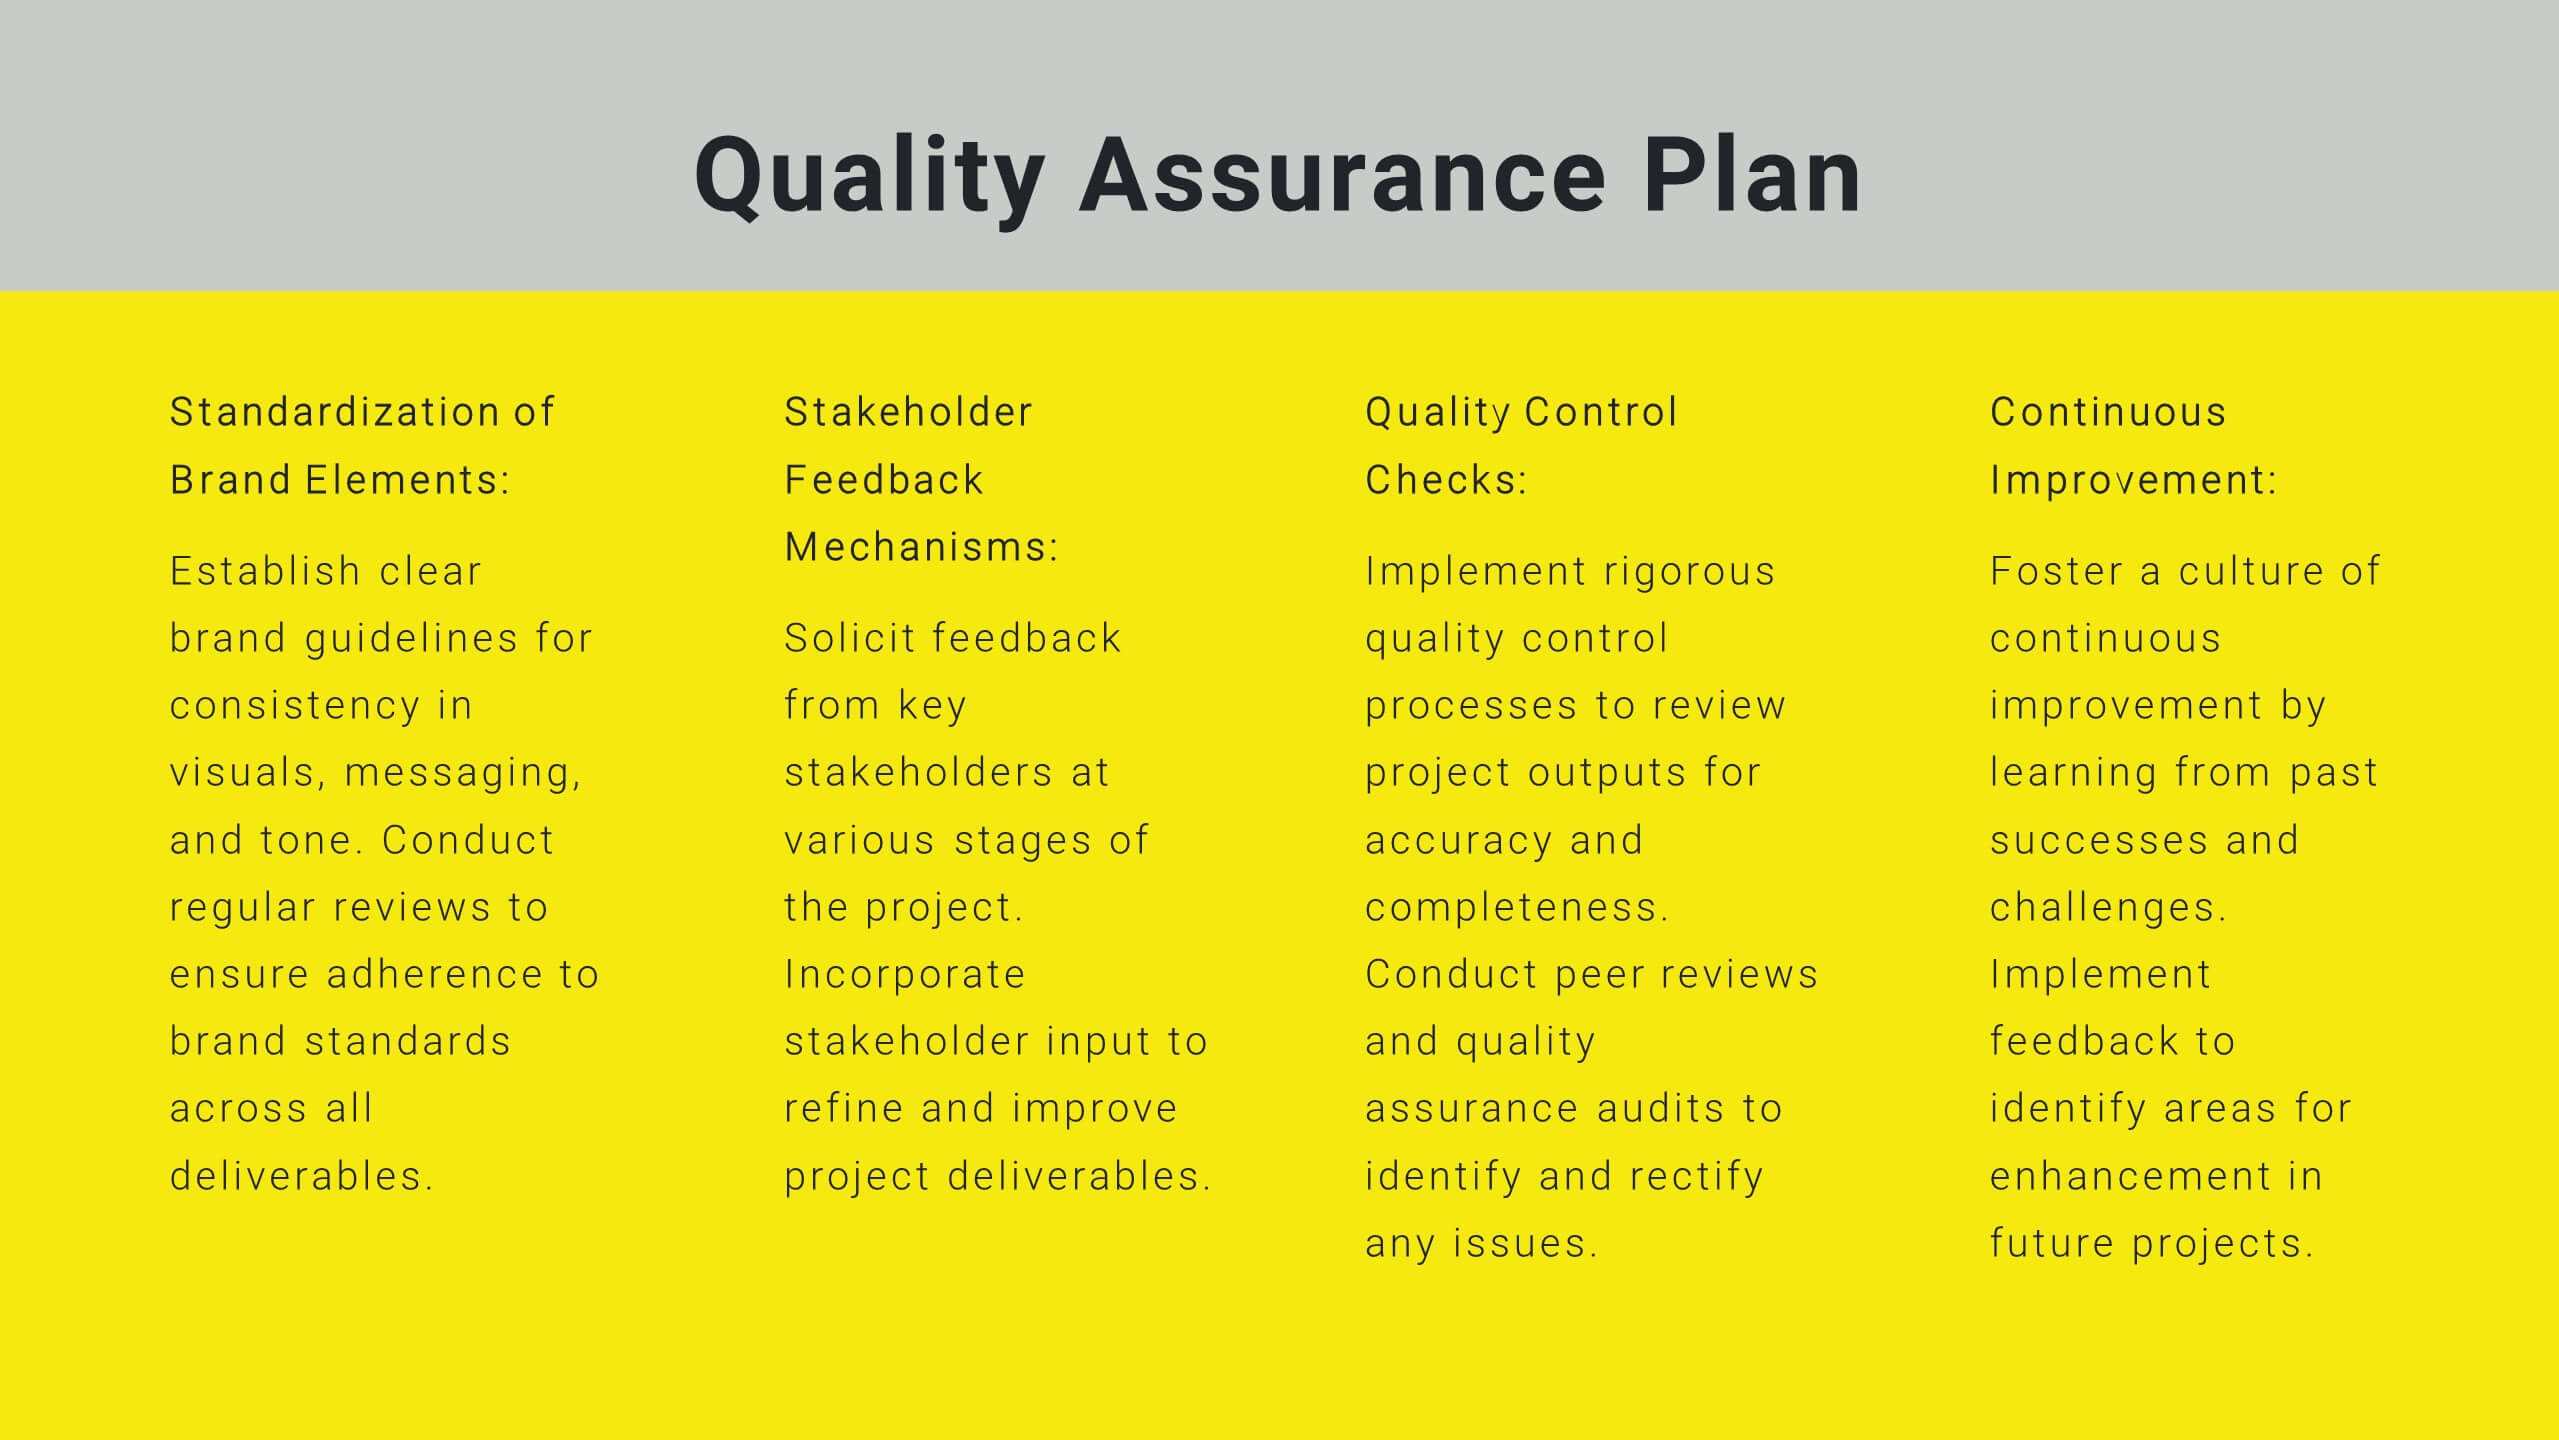
Sable Detailed Project Execution Plan Presentation
Master your project planning with this comprehensive execution plan template! Perfect for detailing project overviews, objectives, and timelines, it includes slides for budget breakdowns, resource allocation, and risk management. Ensure every detail is covered with structured content and clear visuals. Compatible with PowerPoint, Keynote, and Google Slides for seamless presentations on any platform.


5 slides
Market Segmentation by Demographics Presentation
The "Market Segmentation by Demographics" presentation template showcases a circular infographic that effectively visualizes market segments as distinct demographic groups. Each colored section of the circle corresponds to a different demographic characteristic, such as age, income, or location, and is accompanied by key insights or data points in adjacent text placeholders. This format allows for an intuitive comparison of how each segment contributes to the market, facilitating a clear understanding of the audience composition. This visual arrangement is especially useful for presentations that need to highlight demographic data succinctly to support market analysis or strategic marketing decisions.


6 slides
Executive Summary Marketing Infographic
An executive summary is a concise overview of a longer document, report, or proposal, designed to provide readers with a quick understanding of the main points and key takeaways. This infographic template provides a concise and visually appealing overview of a marketing plan, campaign, or strategy. This condenses key information into a format that is easy to understand and presents the most important highlights for decision-makers. This template is a valuable tool to quickly convey the main points and benefits of a document, allowing readers to make informed decisions about whether to delve deeper into the details.


7 slides
Law Infographics Presentation Template
Featuring our Law Infographic template it is a modern and stylish template for making a presentation about law. It comes with a clean design, typography and plenty of space for annotations and is compatible with powerpoint. This template is suitable for a presentation about business, management, finance or marketing. It contains a one page design, illustrations and many different elements to help you build a strong and compelling presentation. Essential and easy to use, this law Infographic template is a great tool for anyone who wants to make an attractive and professional presentation.


6 slides
Financial Report Summary Presentation
Showcase key financial highlights with the Financial Report Summary slide. Featuring a central moneybag icon surrounded by currency symbols, this layout is ideal for presenting up to five critical financial insights or revenue sources. Each label is paired with editable titles and descriptions to keep your content clear and relevant. Fully compatible with PowerPoint, Keynote, and Google Slides for effortless customization.