


Features
- 23 Unique Slides
- Fully editable and easy to edit in Microsoft Powerpoint, Keynote and Google Slides
- 16:9 widescreen layout
- Clean and professional designs
- Export to JPG, PDF or send by email


Do you have any questions?
Recommend


4 slides
Blue Ocean Strategic Differentiation Presentation
Visually compare red and blue ocean strategies with this side-by-side layout. Perfect for showcasing competitive advantages, innovation, and market positioning. Each column highlights key differentiators in a clean, structured format. Ideal for marketing, strategy, or executive presentations. Fully customizable in PowerPoint, Keynote, and Google Slides to match your branding.


5 slides
Projects Milestone Timeline Presentation
Kickstart your story with a clean, engaging timeline that makes every achievement feel purposeful and easy to follow. This presentation helps you outline major milestones, track progress, and communicate project goals with clarity and structure. Ideal for planning, reporting, and strategy sessions. Fully compatible with PowerPoint, Keynote, and Google Slides.


5 slides
Revenue Streams & Expense Management Layout Presentation
Visualize your income and costs with the Revenue Streams & Expense Management Layout Presentation. This slide layout uses a vertical arrow chart to display four data categories, ideal for comparing sources of income and related expenditures. Great for financial reports, budgeting reviews, and strategy discussions. Compatible with Canva, PowerPoint, Google Slides, and Keynote.


10 slides
Project Management Stages
Master project management with our "Project Management Stages" template. This visually engaging presentation design effectively illustrates the project lifecycle across five key stages: Initiation, Planning, Execution, Monitoring, and Closure. Each stage is distinctively represented by a colored 3D block, visually stacked to highlight the progression and foundational importance of each phase. This clear, structured layout simplifies complex processes and emphasizes effective project management techniques. Ideal for project managers, team leaders, and educators, it serves as a vital tool for explaining workflows and responsibilities. Compatible with PowerPoint, Keynote, and Google Slides, this template is perfect for enhancing presentations on project planning and execution.


4 slides
Key Pillar Infographic Slide Presentation
Make your ideas stand tall with this modern pillar-themed infographic layout. Perfect for illustrating strategies, business foundations, or organizational principles, it transforms complex data into visually clear, structured visuals. Fully editable and compatible with PowerPoint, Keynote, and Google Slides for professional and easy-to-customize presentations.


5 slides
Business Matrix Model Presentation
Clearly define your strategy with this Business Matrix Model Presentation. This slide visualizes four key segments in a grid layout, perfect for mapping business priorities, comparing performance, or identifying growth opportunities. Each quadrant is color-coded and labeled, making it easy to explain complex concepts. Ideal for business planning, SWOT analysis, or strategy workshops. Fully editable in PowerPoint, Keynote, and Google Slides.


5 slides
Long-Term Business Strategy Framework
Outline your roadmap to sustainable growth with the Long-Term Business Strategy Framework Presentation. This slide features a bold, horizontal arrow layout divided into four segments—each representing a core phase of your strategic plan. It includes icons and space for key insights under each step, making it perfect for visualizing vision alignment, operational planning, or organizational milestones. Fully customizable in PowerPoint, Keynote, and Google Slides.


4 slides
Governance Practices for Risk Mitigation Presentation
Break down your risk strategy with the Governance Practices for Risk Mitigation Presentation. This slide features a step-stair 3D block visual, ideal for illustrating layered compliance initiatives, control measures, and escalation paths. Perfect for corporate governance teams, compliance officers, and strategic risk planners. Fully editable in PowerPoint, Keynote, and Google Slides.


4 slides
Food Business Concept Pitch Presentation
Bring your culinary vision to life with the Food Business Concept Pitch Presentation. This unique avocado-shaped layout helps you outline up to four key ideas—from menu innovation to service strategy. Perfect for chefs, restaurateurs, or food startups. Fully editable in PowerPoint, Canva, and Google Slides for easy customization.


23 slides
Pomona Business Plan Presentation
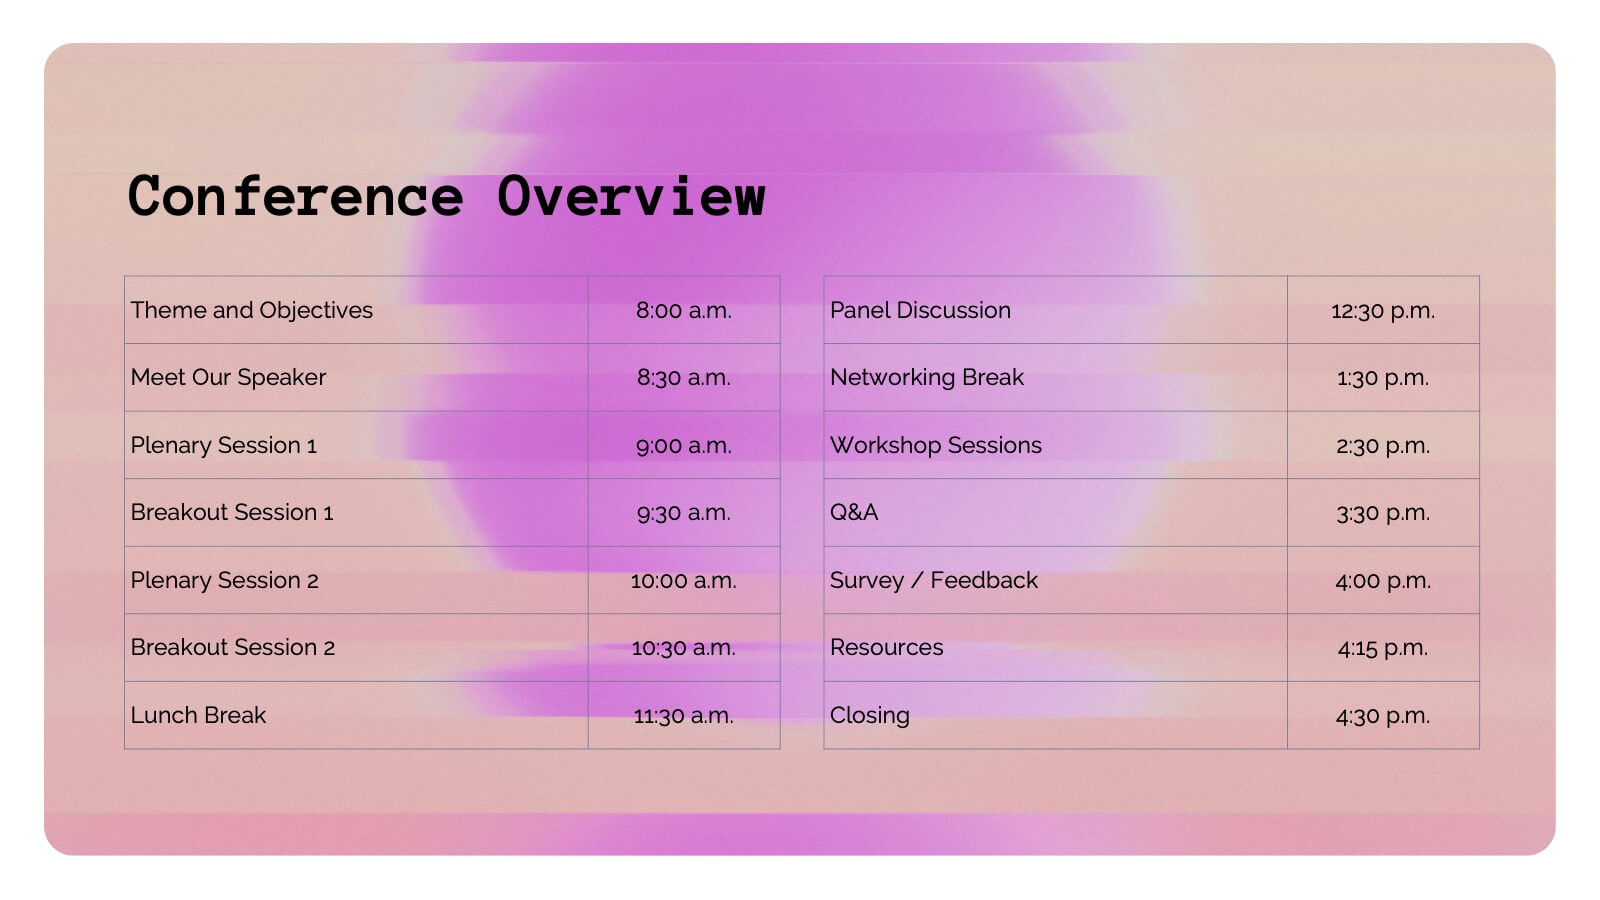
This vibrant and adaptable event agenda template is perfect for organizing your business conference or corporate event. It includes customizable sections for session details, speaker information, and key activities like networking breaks, workshops, and panel discussions. Compatible with PowerPoint, Keynote, and Google Slides, it ensures a smooth and engaging event presentation experience!


4 slides
Device Mockup Display Slide Presentation
Showcase your digital products with this device mockup slide. Ideal for highlighting landing pages, dashboards, or app interfaces, the layout includes clean typography and vibrant shapes for visual balance. Fully editable in PowerPoint, Keynote, and Google Slides—customize text, colors, and images to fit your tech brand or presentation style.


7 slides
Spider Diagram Mind Map Presentation
Turn scattered ideas into structured brilliance with a clean, visual layout that connects every concept effortlessly. This presentation helps you organize thoughts, brainstorm strategies, or map out projects with clarity and flow. Fully editable and compatible with PowerPoint, Keynote, and Google Slides for easy customization and collaboration.


6 slides
Business Decision Venn Diagram Presentation
Make complex decision-making simple and visually impactful with this Business Decision Venn Diagram Presentation. Featuring a bold triangular layout with six segmented areas, this slide is ideal for presenting overlapping factors, interconnected strategies, or priority zones. Perfect for business planning, competitive analysis, or project evaluation. Fully editable in PowerPoint, Keynote, and Google Slides for seamless integration into your presentations.


4 slides
Remote Learning Classroom Engagement Presentation
Make virtual classrooms more engaging with this clear, conversation-inspired visual. Designed for educators, trainers, and e-learning professionals, this infographic helps highlight interaction points, participation levels, or communication flows in remote learning. Easy to customize and fully compatible with PowerPoint, Keynote, and Google Slides.


6 slides
Q&A Slide with Key Questions Presentation
Encourage audience interaction with the Q&A Slide with Key Questions Presentation. This clean and structured layout is perfect for listing common questions, addressing objections, or summarizing audience queries. Featuring a central visual cue and six customizable prompts, it’s ideal for webinars, team updates, or customer feedback sessions. Fully editable in Canva, PowerPoint, Keynote, and Google Slides.


8 slides
Effective Team Building Model Presentation
Visualize your strategy for collaboration with the Effective Team Building Model Presentation. This layered block layout is perfect for illustrating step-by-step frameworks, progressive strategies, or hierarchical team development stages. Clean, modern, and color-coded for clarity, it's ideal for internal planning, training, or leadership presentations. Fully editable in PowerPoint, Keynote, Canva, and Google Slides.


12 slides
Startup Investor Pitch Deck Presentation
Craft a compelling pitch with this Startup Investor Pitch Deck template. Featuring a structured layout, it helps showcase your startup’s vision, market potential, and financial projections. Designed for clarity and engagement, this template ensures a persuasive investor presentation. Fully compatible with PowerPoint, Keynote, and Google Slides for seamless customization.