


Features
- 3 Unique slides
- Fully editable and easy to edit in Microsoft Powerpoint, Keynote and Google Slides
- 16:9 widescreen layout
- Clean and professional designs
- Export to JPG, PDF or send by email


Do you have any questions?
Recommend


7 slides
Company Vision and Future Direction
Bring your company’s future into focus with this sleek, icon-led layout designed to showcase strategic goals, values, and long-term vision. Perfect for leadership presentations, investor updates, or team briefings, this slide turns abstract direction into a clear path forward. Fully compatible with PowerPoint, Keynote, and Google Slides.


2 slides
Business Self-Introduction Presentation
Introduce yourself with confidence using this Business Self-Introduction Slide. Perfect for networking, team meetings, and professional presentations, this template features a modern layout with a dynamic photo cutout, engaging visuals, and structured text areas. Fully customizable for PowerPoint, Keynote, and Google Slides, you can adjust colors, fonts, and content to reflect your personal or business identity.


5 slides
Yoga Poses Infographics
Yoga Poses, also known as asanas, are physical postures practiced in the discipline of yoga. They are designed to promote strength, flexibility, balance, and mindfulness. These infographic templates focuses on illustrating various yoga poses and their benefits. It is designed to help individuals understand and practice different yoga poses effectively. This template features beautifully designed infographics with icons and illustrations that showcase different yoga poses. These covers a wide range of yoga, including balancing poses, Chakra yoga, standing poses, and yoga for pregnancy.


5 slides
Environmental and Social Sustainability Presentation
Explore the synergy of environmental protection and social responsibility with our Environmental and Social Sustainability Presentation template. This visual aid is a compelling tool for discussing key strategies in balancing ecological and social impacts, providing a roadmap for sustainable business practices. Ideal for engaging audiences in discussions about conservation and community engagement, the template is fully compatible with PowerPoint, Keynote, and Google Slides, ensuring a smooth presentation experience in any setting.


5 slides
Organizational Structure Framework
Visualize your company hierarchy with this tiered pyramid diagram. This presentation framework is designed to outline roles and responsibilities across four structured levels, using labels A to D for clear communication. Each section includes iconography and editable text blocks, perfect for leadership, operations, or team management slides. Fully compatible with PowerPoint, Keynote, and Google Slides.


29 slides
Shadowglow Brand Guidelines Proposal Presentation
Present a cohesive brand vision with this professional template, designed for crafting detailed and visually compelling brand guidelines. Highlight essential components like brand vision and mission, brand values, and identity elements, including color palettes, typography, and imagery. This template seamlessly incorporates customer personas, tone and voice guidelines, and brand touchpoints to define the essence of your brand's communication. Utilize slides for website, social media, and packaging strategies to establish consistency across all platforms. Customizable and compatible with PowerPoint, Google Slides, and Keynote, this design ensures clarity and professionalism, making it ideal for agencies or teams presenting comprehensive brand proposals.


5 slides
Ideal Customer Profile Breakdown
Shine a light on your perfect customer with this bright, idea-inspired layout—designed to guide you through the essential traits, needs, and behaviors that define your ideal client. Perfect for marketing strategy, sales enablement, or persona creation. Fully compatible with PowerPoint, Keynote, and Google Slides.


6 slides
McKinsey 7S Model Articles Infographics
Explore the seven critical elements that make up the McKinsey 7S Model, including Strategy, Structure, Systems, Shared Values, Skills, Style, and Staff. Each of these components plays a vital role in shaping your company's success. This infographic is compatible with popular presentation tools like PowerPoint, Keynote, and Google Slides, making it effortless to incorporate into your next business presentation. Unlock the secrets of organizational effectiveness with this concise and visually appealing resource. Enhance your understanding of the McKinsey 7S Model and supercharge your company's performance today. Get ready to transform your business strategy with this user-friendly infographic.


7 slides
Social Media Engagement Infographic
Social media is the most influential tool in today's world. This infographic template is a great way to share the benefits of your services in an easy-to-read format that's sure to get your audience excited about what you have to offer. Whether you're looking to promote a new product line or simply want to provide information to your customers so they can make informed decisions, this infographic will be perfect for your needs. This infographic will help you understand how to use social media to engage with your audience and drive traffic to your site. Fully customizable and compatible with Powerpoint, Keynote, and Google Slides.


8 slides
Team Statistics and Rankings Presentation
Showcase match performance, rankings, and team metrics with this Team Statistics and Rankings Presentation. Visualize key game stats using editable diagrams, heatmaps, and comparison scores. Perfect for sports analysts, coaches, or recap slides. Compatible with PowerPoint, Keynote, and Google Slides—fully customizable for your team’s specific data and branding needs.


5 slides
Team Role Distribution Matrix Presentation
Clarify responsibilities and improve collaboration with the Team Role Distribution Matrix Presentation. This RACI-style slide helps visualize team accountability across multiple tasks, making it ideal for project management, cross-functional teams, or workflow planning. Each layout option includes clearly labeled roles and color-coded responsibilities: Responsible, Accountable, Consulted, and Informed. Fully editable in Canva, PowerPoint, Keynote, and Google Slides.


12 slides
Understanding Digital Currencies Presentation
Simplify the complexity of crypto ecosystems with the Understanding Digital Currencies presentation template. Designed around a wallet-style visual, this layout highlights key features of various cryptocurrencies using six labeled touchpoints. Perfect for introducing Bitcoin, Ethereum, altcoins, and digital wallets in educational, financial, or blockchain-related presentations. Ideal for crypto educators, fintech startups, and investment analysts. Compatible with PowerPoint, Keynote, and Google Slides.


6 slides
Governance Tools Infographics
Enhance your understanding of Governance Tools with our customizable infographic template. This template is fully compatible with popular presentation software like PowerPoint, Keynote, and Google Slides, allowing you to easily customize it to illustrate and communicate various governance tools and practices. The Governance Tools infographic template offers a visually engaging platform to explore and explain the tools, frameworks, and strategies used to facilitate effective governance within organizations. Whether you're a governance professional, business leader, or interested in corporate governance, this template provides a user-friendly canvas to create informative presentations and educational materials. Deepen your knowledge of Governance Tools with this SEO-optimized infographic template, thoughtfully designed for clarity and ease of use. Customize it to showcase governance frameworks, compliance mechanisms, risk management tools, and best practices, ensuring that your audience gains valuable insights into this critical field. Start crafting your personalized infographic today to delve into the world of Governance Tools.


6 slides
Section Breakdown Table of Content Presentation
Present your topics in a clear, structured way with the Section Breakdown Table of Content template. Featuring a two-column layout with colorful icons and labeled sections, it’s perfect for outlining multiple categories. Fully editable in Canva, PowerPoint, and Google Slides to match your brand style and improve presentation flow.


6 slides
Mental Health Infographics
The "Mental Health" infographic template, suitable for PowerPoint, Keynote, and Google Slides, is an essential resource for healthcare professionals, educators, and mental health advocates. This sensitive and informative template is designed to communicate important aspects of mental health in a compassionate and accessible manner. This template covers critical topics such as mental health awareness, coping strategies, and support resources. It is structured to facilitate discussions on mental well-being, making it an invaluable tool for educational presentations, awareness campaigns, and support group discussions. Featuring a calming and empathetic design, the template uses a soothing color scheme with pastel shades of light blue, green, and lavender. This creates a serene and understanding atmosphere that is supportive of mental health topics. Whether used in a clinical setting, classroom, or community workshop, this template ensures that information about mental health is presented in a sensitive, informative, and visually appealing way.


22 slides
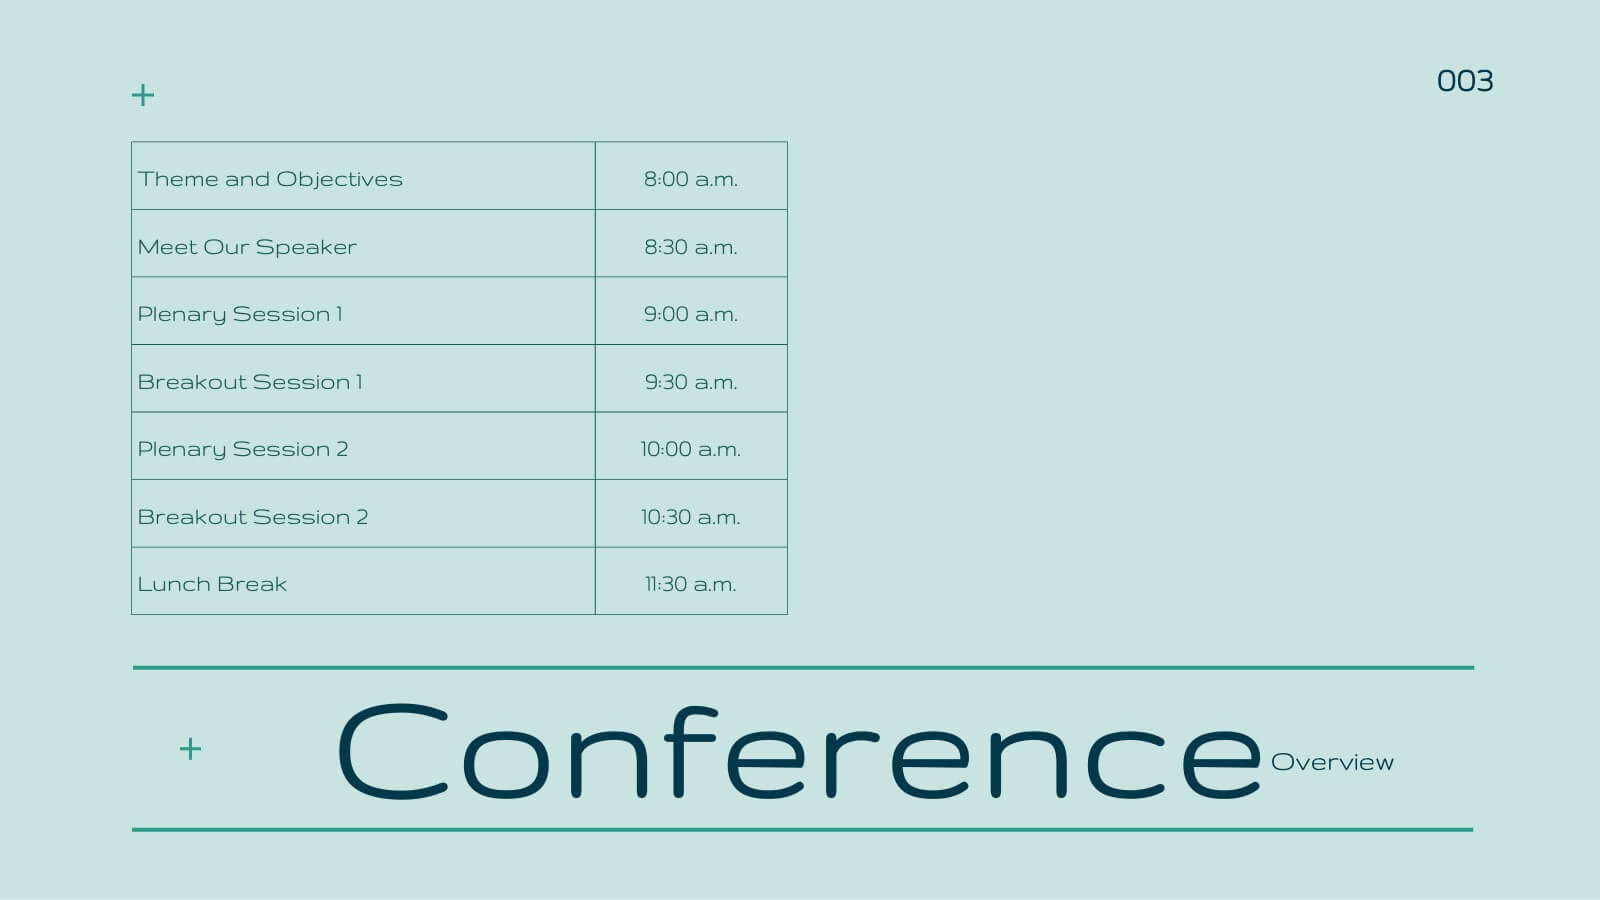
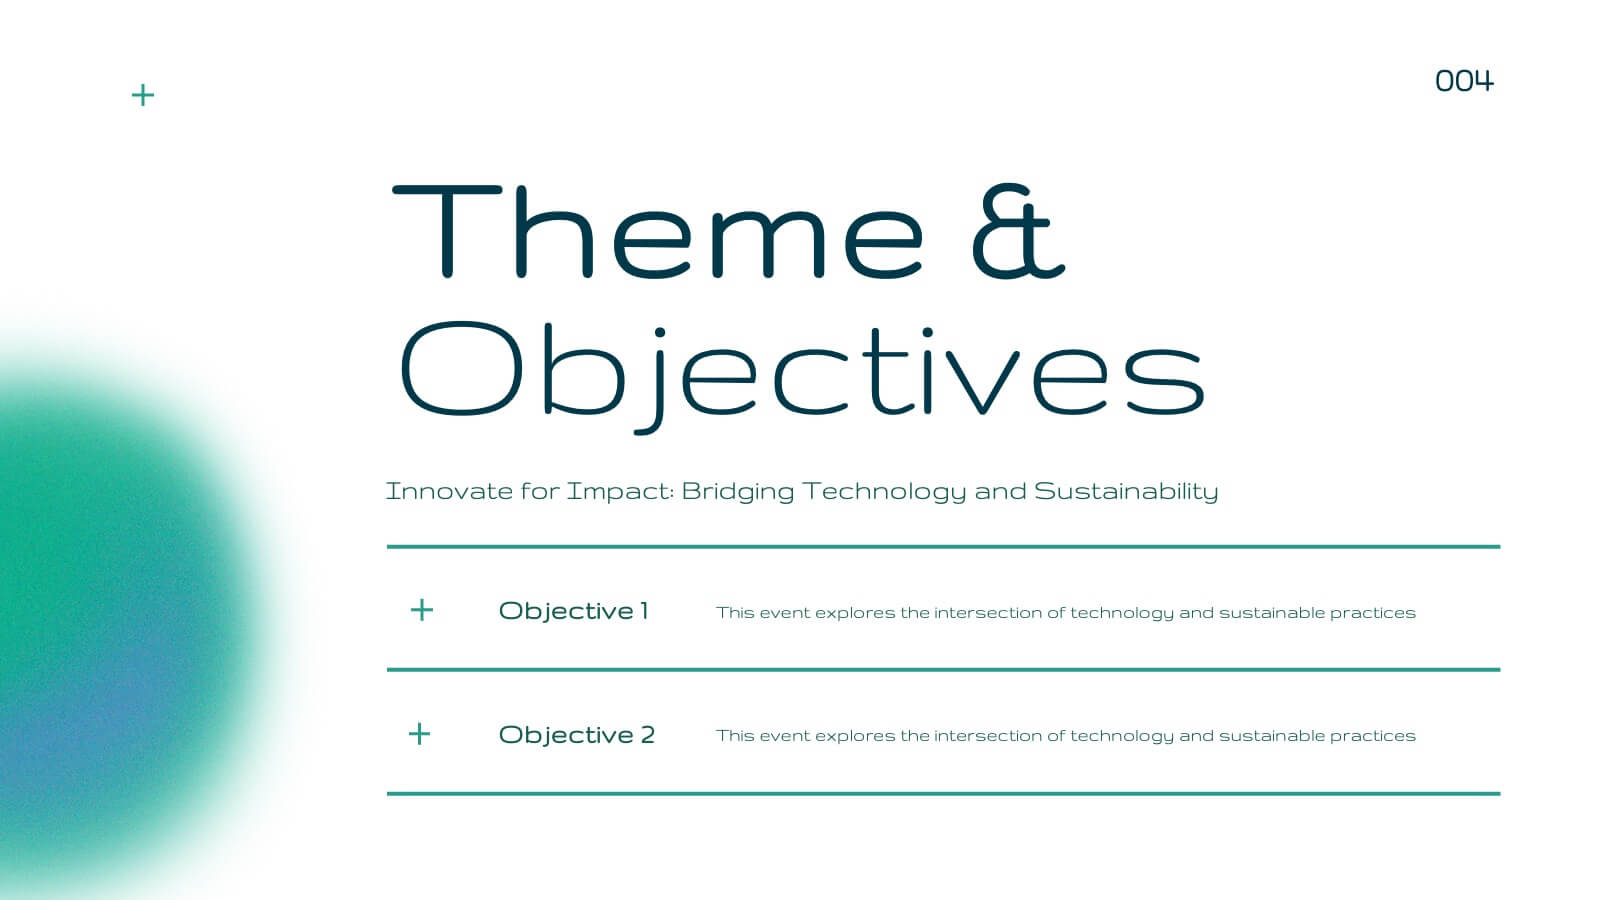
Blaze Business Operations Plan Presentation
Elevate your business presentations with this elegant, modern template designed for comprehensive business operations. Perfect for covering themes, objectives, workshops, and panel discussions, it ensures a professional and engaging delivery. The clean design and structured layout enhance clarity and impact. Compatible with PowerPoint, Keynote, and Google Slides, it’s versatile for any platform.


4 slides
Task and Role Allocation Matrix
Clarify team responsibilities with this modern Task and Role Allocation Matrix. Easily visualize who is Responsible, Accountable, Contributing, and Informed for each task. Ideal for team leaders, HR planners, and project coordinators. Fully customizable in PowerPoint, Keynote, and Google Slides.