


Features
- 6 Unique slides
- Fully editable and easy to edit in Microsoft Powerpoint, Keynote and Google Slides
- 16:9 widescreen layout
- Clean and professional designs
- Export to JPG, PDF or send by email


Do you have any questions?
Recommend


8 slides
Success Strategy Triangle Presentation
Craft a winning strategy with the Success Strategy Triangle template. This structured design helps visualize key business components in a step-by-step format, making it ideal for growth planning, decision-making, and performance analysis. Fully customizable and easy to use, it’s compatible with PowerPoint, Keynote, and Google Slides for seamless integration.


5 slides
Aviation Industry Market Analysis
Break down key metrics in the aviation sector with this sleek, aircraft-themed layout. Ideal for highlighting five data points or insights, each icon aligns with a section of the airplane to reinforce structure and clarity. Perfect for presentations on industry trends, airline strategies, or market performance. Fully editable in PowerPoint, Keynote, and Google Slides.
21 slides
Wyrm Marketing Strategy Plan Presentation
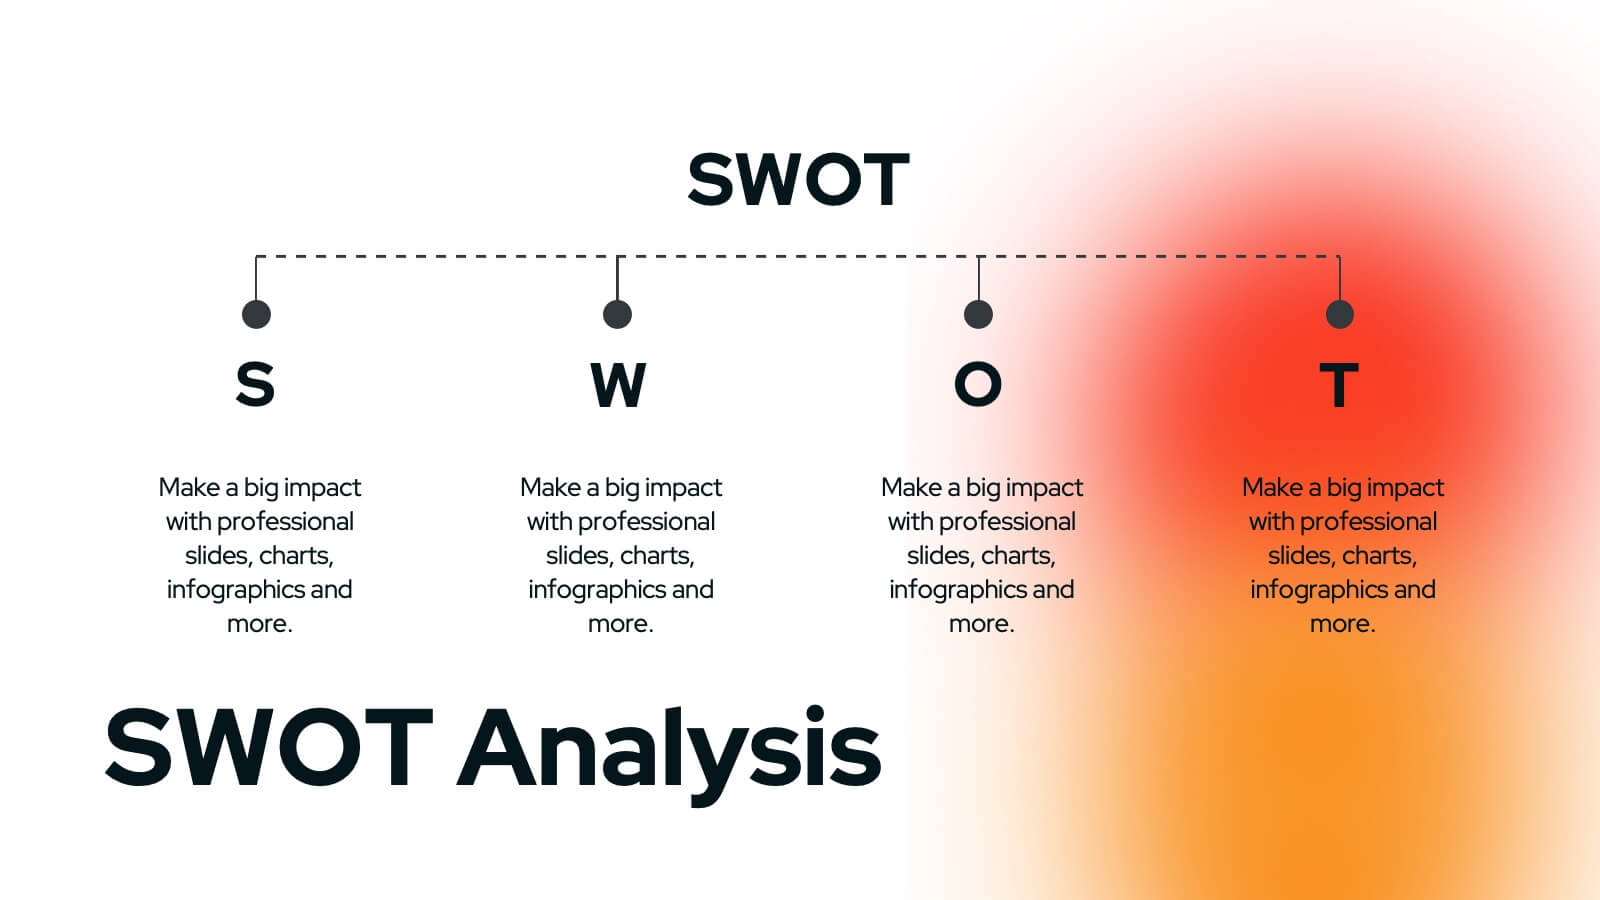
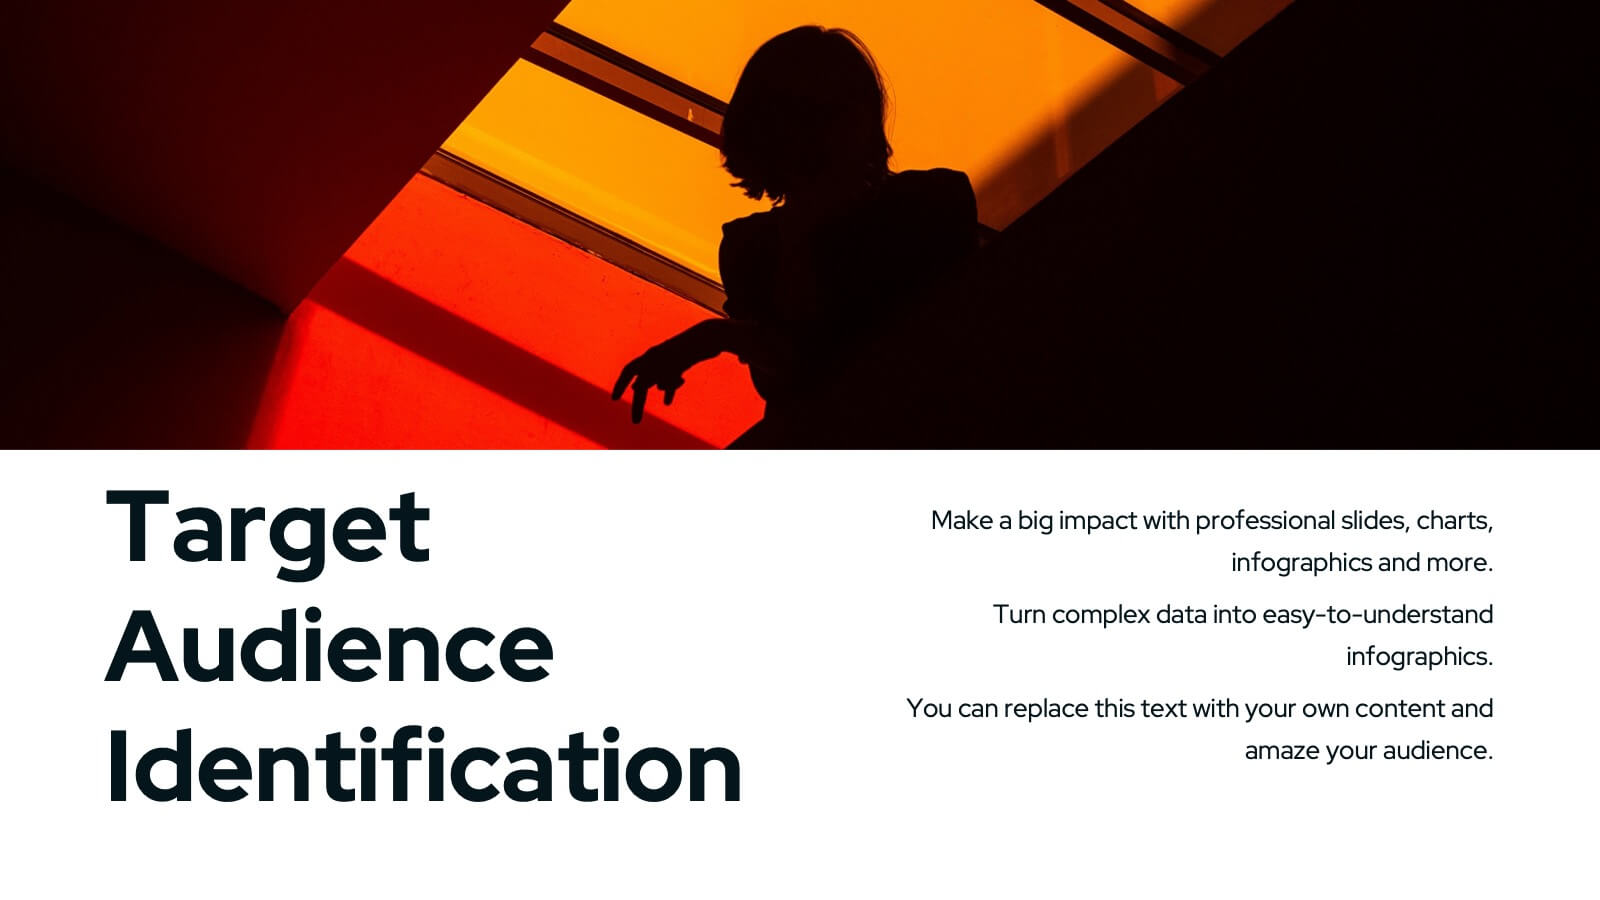
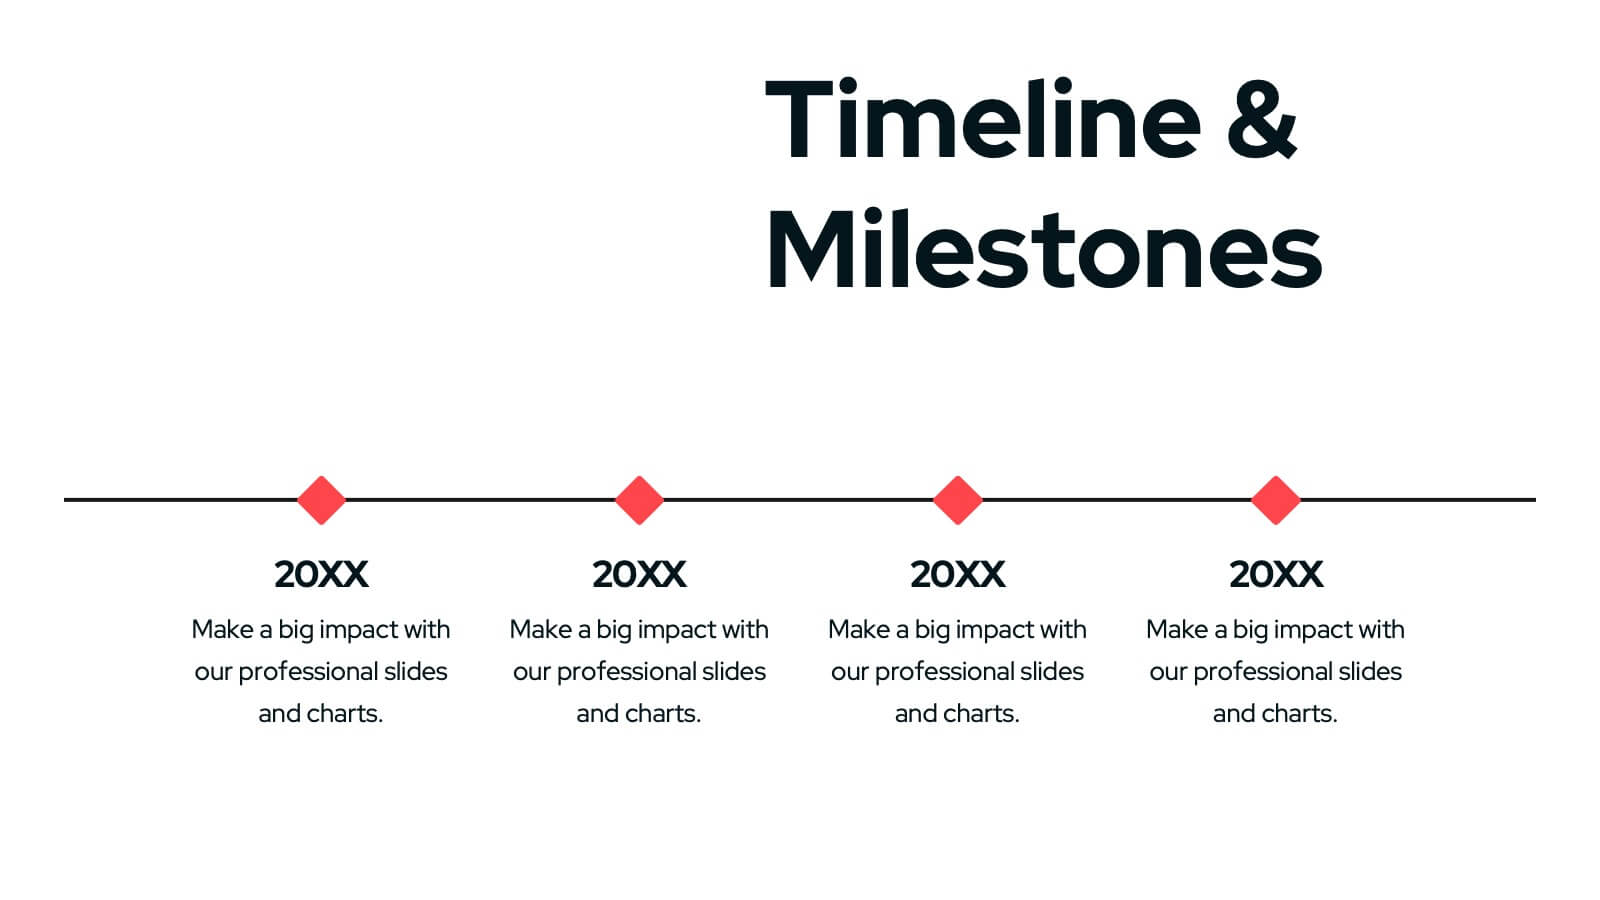
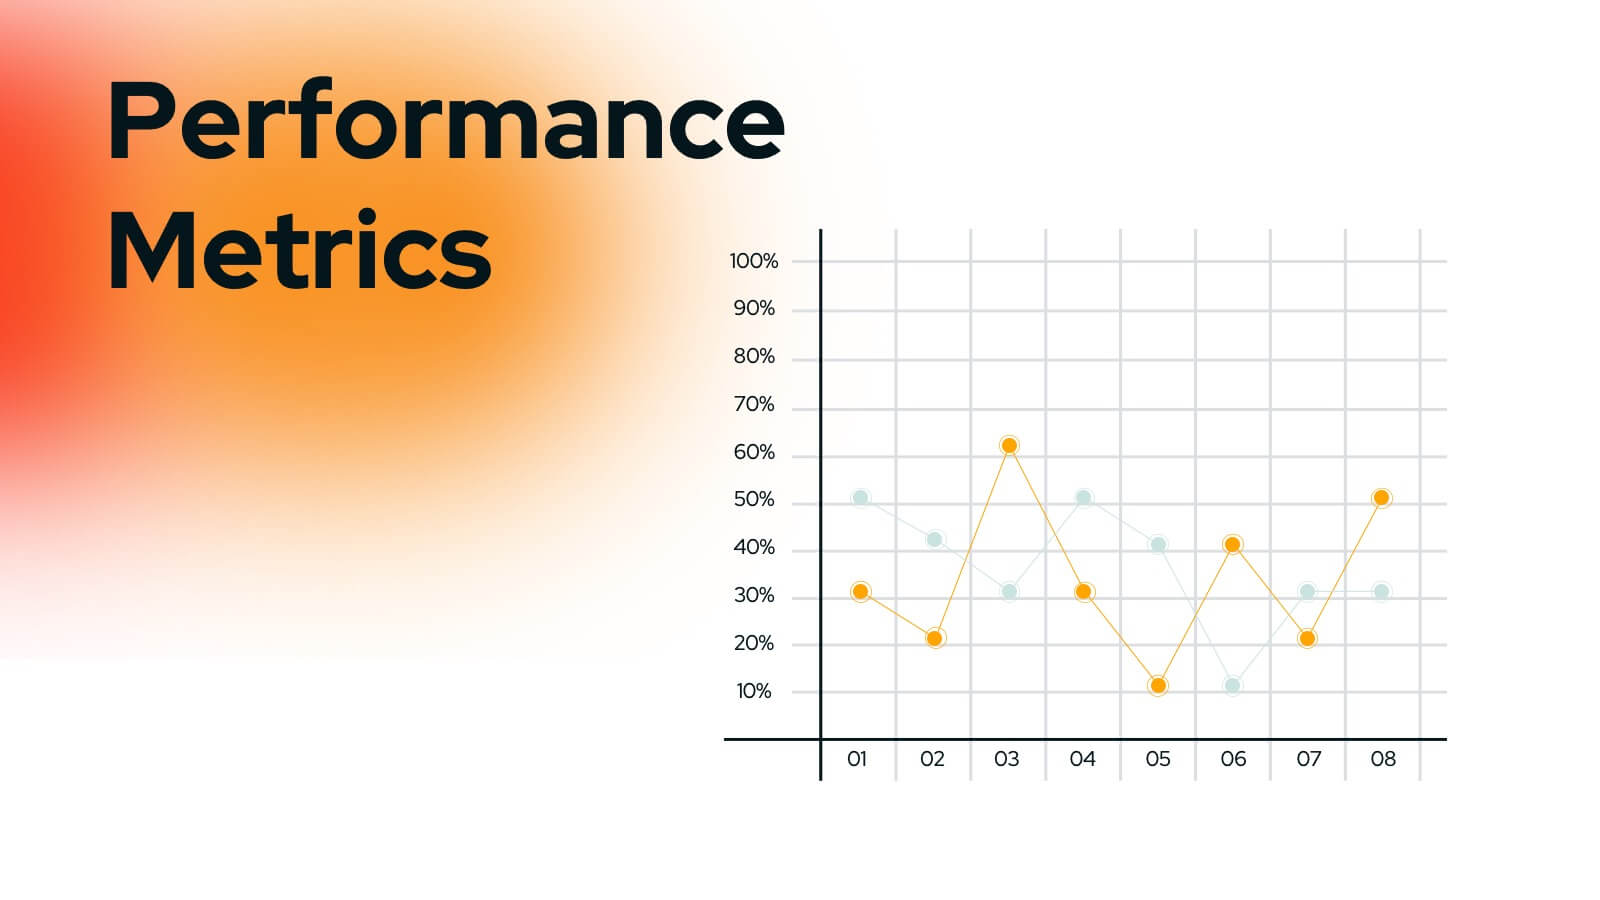
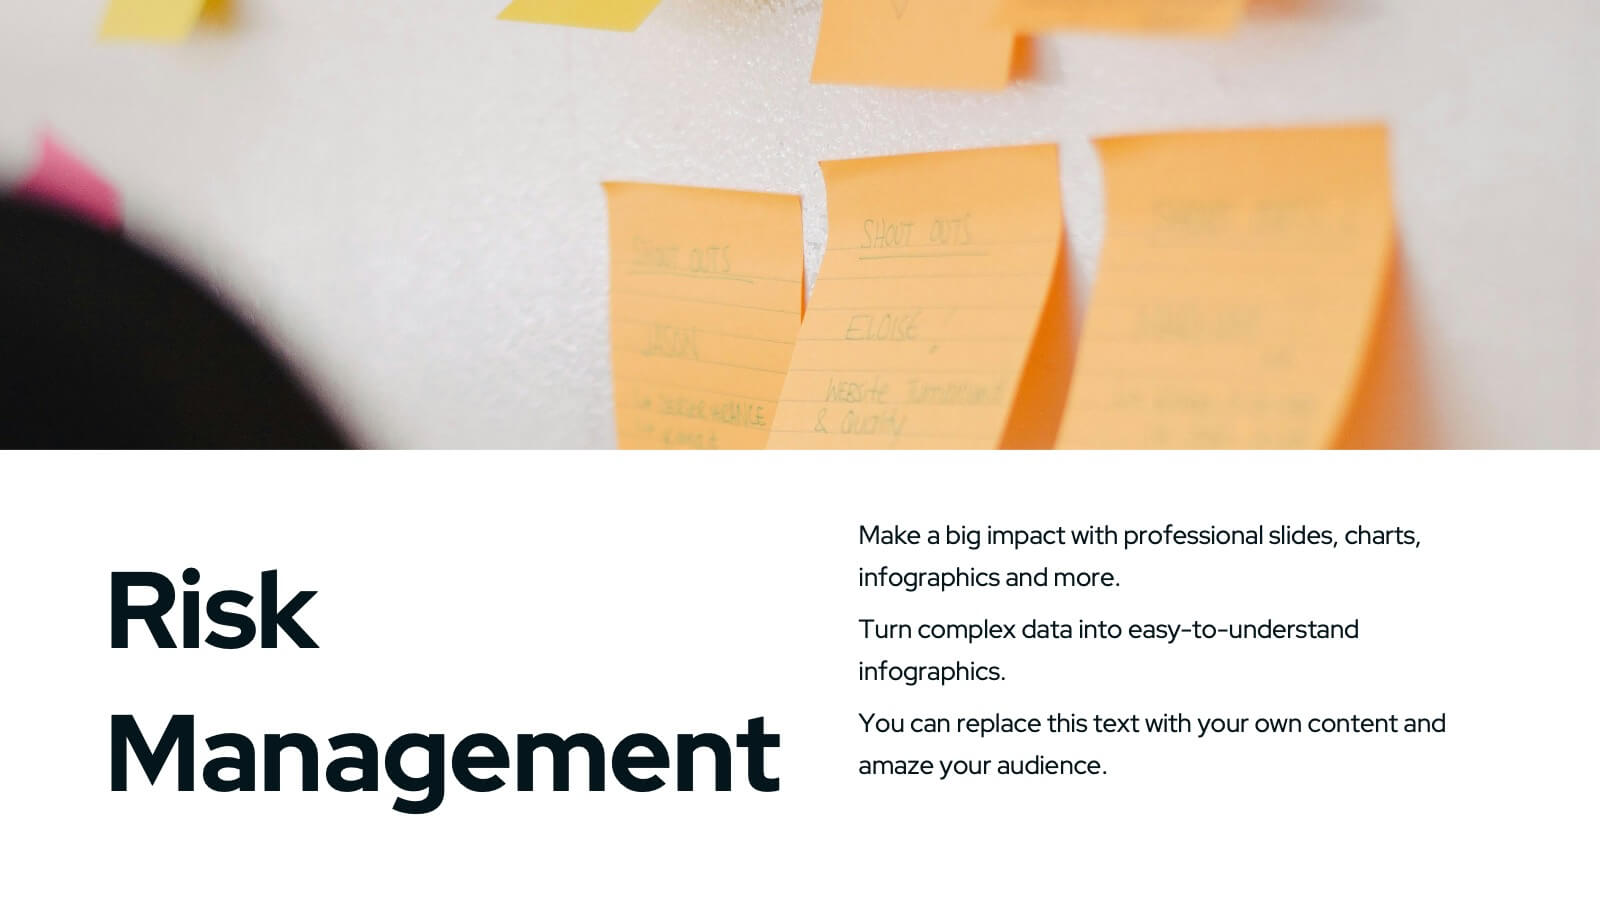
Unleash the power of your marketing strategy with this bold and dynamic presentation template! Perfect for covering everything from landscape analysis and target audience identification to performance metrics and risk management. This template helps guide your audience through key challenges, SWOT analysis, and strategic initiatives with clarity and impact. Compatible with PowerPoint, Keynote, and Google Slides for effortless and engaging presentations.


7 slides
Finance Infographic Presentation Template
Finance is a field that deals with the study of investments and the management of money. Finance Infographics are visual representations of financial information, data, and concepts. This template uses charts, graphs, diagrams, and illustrations to help explain complex financial information in a simple and easy-to-understand way. This Finance Infographic can cover a range of topics including budgeting, investments, expenses, and market analysis, among others. This is the perfect template to use for businesses, financial organizations, and educators to help people understand financial concepts.


7 slides
Modern Education Infographic
Immerse yourself in the evolving world of learning with our Modern Education Infographic. With a crisp white canvas, the design incorporates an energizing mix of orange, the trust-building hue of blue, and a dash of passionate red. This template boasts modern infographics, bespoke icons, and versatile image placeholders, offering a visual guide to contemporary educational methods, tools, and trends. Precision-made for Powerpoint, Keynote, or Google Slides. Ideal for educators, curriculum developers, edtech startups, or any professional keen on showcasing the transformation in learning techniques.


6 slides
Iceberg Chart Infographic
An iceberg infographic is a visual representation that uses the metaphor of an iceberg to convey information. This infographic template is designed to highlights the idea that only a small portion of the iceberg is visible above the waterline, while the majority of its mass remains hidden beneath the surface. The larger portion of the iceberg, submerged below the waterline, symbolizes the deeper or less obvious aspects of a topic. This can include underlying causes, complexities, challenges, or additional information that may not be immediately apparent. This is fully customizable and compatible with Powerpoint, Keynote, and Google Slides.


4 slides
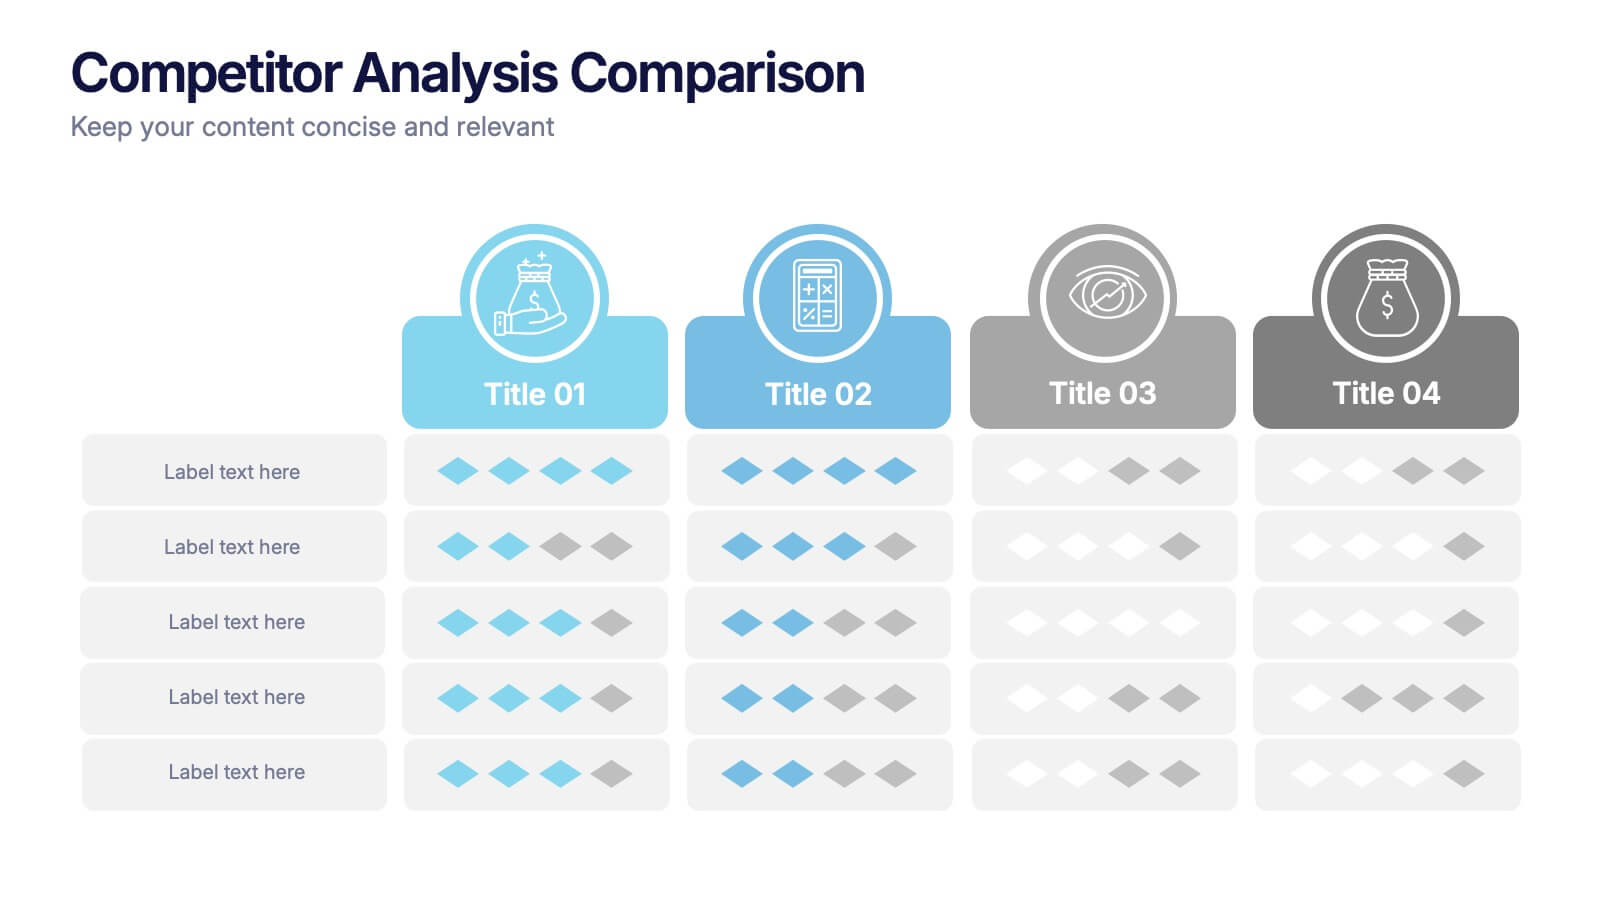
Competitor Analysis Comparison Presentation
Quickly evaluate strengths and weaknesses across your market landscape with this Competitor Analysis Comparison Presentation. Featuring clean tables, icons, and rating visuals, it's ideal for highlighting where your brand stands out. Fully editable in PowerPoint, Keynote, and Google Slides.


23 slides
Solarae Investor Pitch Presentation
This Investor Pitch Deck Presentation is designed to impress potential investors with a modern, professional layout. Covering key topics like company overview, financials, competitive landscape, and milestones, it's fully customizable and easy to edit in PowerPoint, Keynote, and Google Slides. Perfect for startups seeking funding opportunities.


8 slides
Training and Development Onboarding Presentation
Streamline the training and development process for new hires with a structured onboarding funnel. This Training and Development Onboarding template provides a clear, step-by-step visualization of how employees progress through the learning process. Perfect for HR managers, trainers, and corporate educators. Fully editable and compatible with PowerPoint, Keynote, and Google Slides for easy customization.


7 slides
Risk Management Plan Infographics
This Risk Management Plan infographic template is a comprehensive tool for identifying and assessing potential risks in projects or business operations. Compatible with PowerPoint, Google Slides, and Keynote, it features a range of visual aids including risk matrices, probability scales, and impact graphs. Each slide is tailored to categorize risks by severity, from low to high, and includes customizable fields for detailed risk descriptions and mitigation strategies. The color-coding aids in quick recognition of risk levels, and the straightforward design ensures clarity in communication. Ideal for project managers and business strategists, this template streamlines the process of risk analysis and planning in any professional presentation.


22 slides
Thistlewisp Advertising Agency Proposal Presentation
Win clients and showcase your agency’s capabilities with this sleek and comprehensive proposal presentation! It highlights essential sections like mission and vision, client success stories, case studies, market trends, and creative processes to create a compelling pitch. Ideal for client presentations, this template is fully compatible with PowerPoint, Keynote, and Google Slides.


22 slides
Tranquil Project Status Report Presentation
This dynamic project report template delivers key insights with a bold, modern design. From performance metrics to market trends and client feedback, it's crafted for comprehensive yet visually appealing updates. Perfect for team presentations, this template ensures clarity and engagement. Compatible with PowerPoint, Keynote, and Google Slides, it’s ideal for project leaders!


5 slides
Concentric Circle Model Presentation
Make your ideas ripple outward with a layered, modern design that visualizes relationships and hierarchies in a clear, engaging way. Perfect for mapping influence, impact, or organizational structures, this layout brings balance to your visuals. Fully editable and compatible with PowerPoint, Keynote, and Google Slides for seamless customization.


8 slides
Vision and Mission Alignment Presentation
Harmonize your organization's aspirations and objectives with our "Vision and Mission Alignment" presentation template. This template provides a visually appealing way to present your company's vision and mission, ensuring clarity and coherence in communication. Perfect for strategic meetings and workshops, it is compatible with PowerPoint, Keynote, and Google Slides. Make use of this design to bridge the gap between where you are and where you want to be.


6 slides
Governance Information Infographic
Governance refers to the system of rules, practices, and processes by which an organization or entity is directed, controlled, and regulated. This infographic template is designed to present key information about a governance structure, guidelines, or principles. The layout of this template is organized logically, maintaining a clear flow from one section to another. Summarize the benefits and importance of effective governance. This template will encourage you audience to learn more about the governance or its implementation. This template is fully customizable and compatible with Powerpoint, Keynote, and Google Slides.


6 slides
Circular Concept Diagram for Strategy Presentation
Visualize interconnected ideas with this circular concept diagram, ideal for showcasing six key strategic pillars or processes. Each segment is clearly labeled and icon-supported, creating an easy-to-follow layout. Perfect for business planning, marketing strategies, or organizational models. Compatible with PowerPoint, Keynote, and Google Slides for full customization.


7 slides
Competitive Advantage Through Value Chain
Make your value chain comparison stand out with this bold, visual slide that maps two sides head-to-head. Perfect for highlighting competitive advantages, strategic differences, and operational gaps. This template is clear, customizable, and ready to plug into PowerPoint, Keynote, or Google Slides.