


Features
- 5 Unique slides
- Fully editable and easy to edit in Microsoft Powerpoint, Keynote and Google Slides
- 16:9 widescreen layout
- Clean and professional designs
- Export to JPG, PDF or send by email


Do you have any questions?
Recommend


5 slides
Value Chain Business Model Presentation
Spark fresh insight into how your organization creates value with this clean, arrow-based layout that makes every step feel intuitive and action-ready. This presentation breaks down key activities, support processes, and improvement opportunities in a clear visual flow perfect for strategy discussions. Fully compatible with PowerPoint, Keynote, and Google Slides.


5 slides
Marketing Concepts Infographics
Marketing Concepts refer to the various strategies and philosophies that guide the marketing efforts of businesses and organizations. Our marketing concept infographics are visual representations of the different marketing concepts and strategies that businesses use to promote their products or services. These infographics can cover a wide range of marketing topics, including target audience, product positioning, branding, advertising, and video marketing. The purpose of these infographics is to provide a easy-to-understand overview of key marketing concepts that businesses can use to drive sales and increase brand awareness.


6 slides
Industry Analysis Porter's 5 Forces Presentation
Analyze industry competition with this Porter's Five Forces template! This structured layout visually breaks down key factors like buyer power, supplier influence, competitive rivalry, new market entrants, and substitution threats, making it ideal for strategic planning and market assessments. Fully customizable and compatible with PowerPoint, Keynote, and Google Slides.


6 slides
Preventative Healthcare and Fitness Presentation
Promote wellness and proactive care with this colorful and clean slide layout. Featuring a clipboard-style design with stacked icons and aligned descriptions from A to E, it’s perfect for presenting fitness tips, health programs, or preventative strategies. The vibrant sections help guide viewers through key points at a glance. Fully editable and compatible with PowerPoint, Keynote, and Google Slides.


8 slides
Green Business Sustainability Strategy Presentation
Promote eco-friendly business strategies with the Green Business Sustainability Strategy infographic. Featuring a circular flow diagram, this template highlights key sustainable initiatives, resource management, and environmental impact strategies. Fully editable and compatible with PowerPoint, Keynote, and Google Slides.


22 slides
Galileo Advertising Agency Proposal Presentation
Present your advertising agency’s capabilities with a proposal template designed to captivate and convince. This sleek and professional layout is perfect for agencies looking to showcase their services, team expertise, and strategic approach to clients. Highlight key sections such as your mission, client success stories, market analysis, and creative process, ensuring every detail is covered. Dive into campaign execution plans, resource allocation, and testimonials to build trust and credibility. Visualize your strategy development with data-driven slides and impactful case study layouts. Fully customizable in PowerPoint, Google Slides, and Keynote, this template is tailored for seamless editing to reflect your agency’s branding. The clean design, bold accents, and structured content make it ideal for pitches, client proposals, or business development meetings. Take your presentations to the next level and leave a lasting impression on potential clients.


20 slides
Harmony Sales Forecast Presentation
Elevate your sales forecasting presentations with this vibrant and engaging template! Designed to captivate your audience, it covers all critical areas such as objectives, strategy, performance metrics, and opportunities. Keep your team motivated with visually striking layouts and an easy-to-follow structure. Compatible with PowerPoint, Keynote, and Google Slides for seamless integration!


21 slides
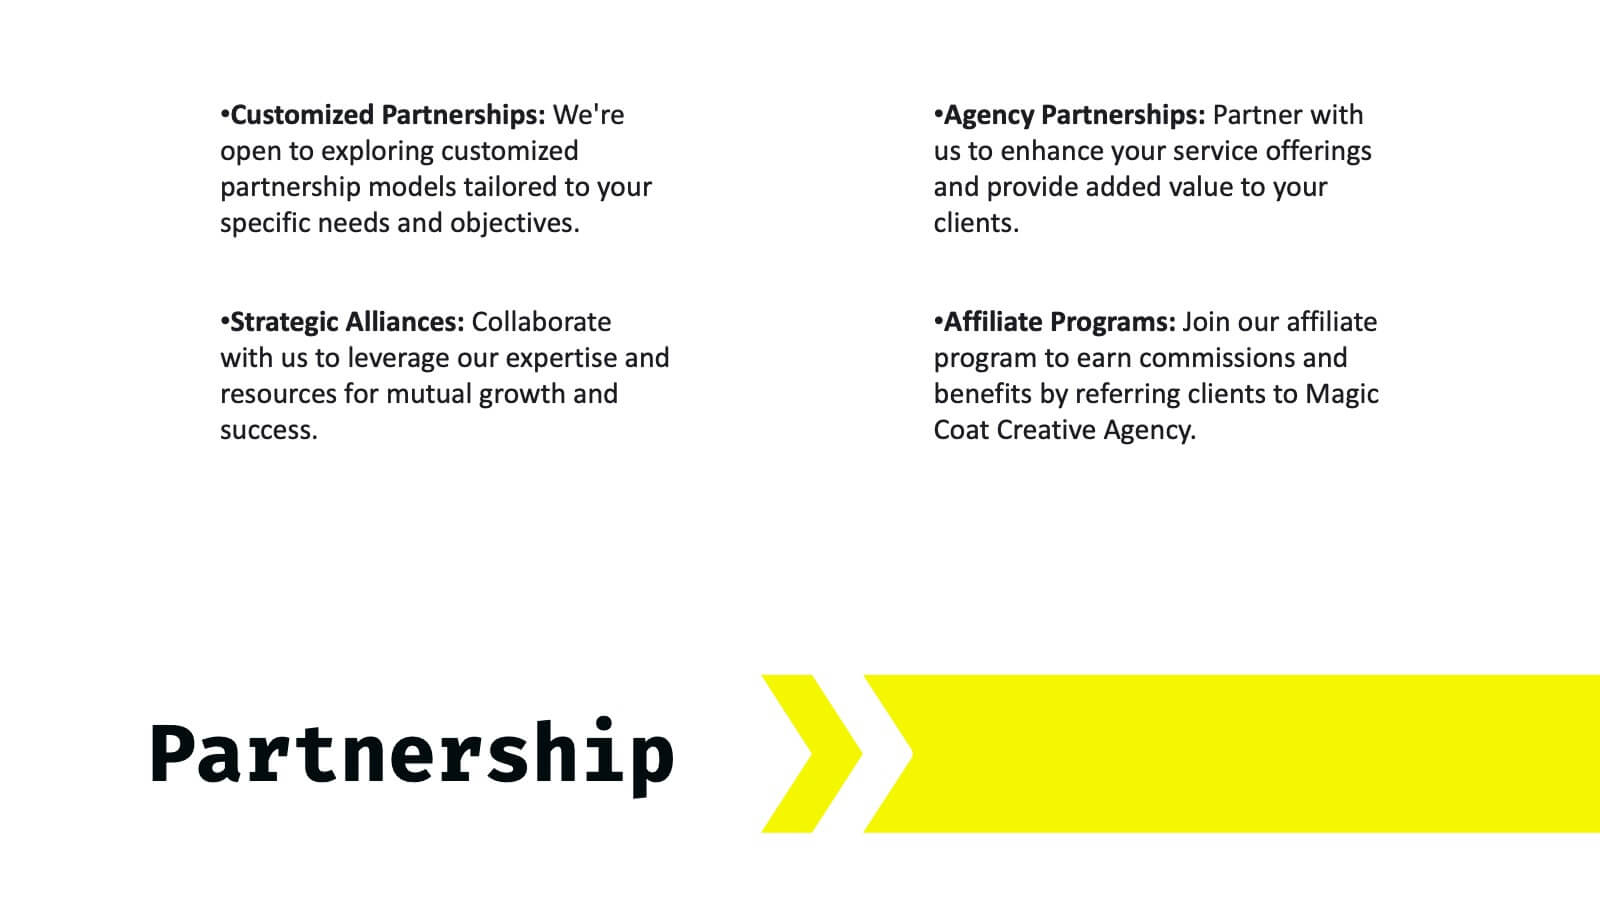
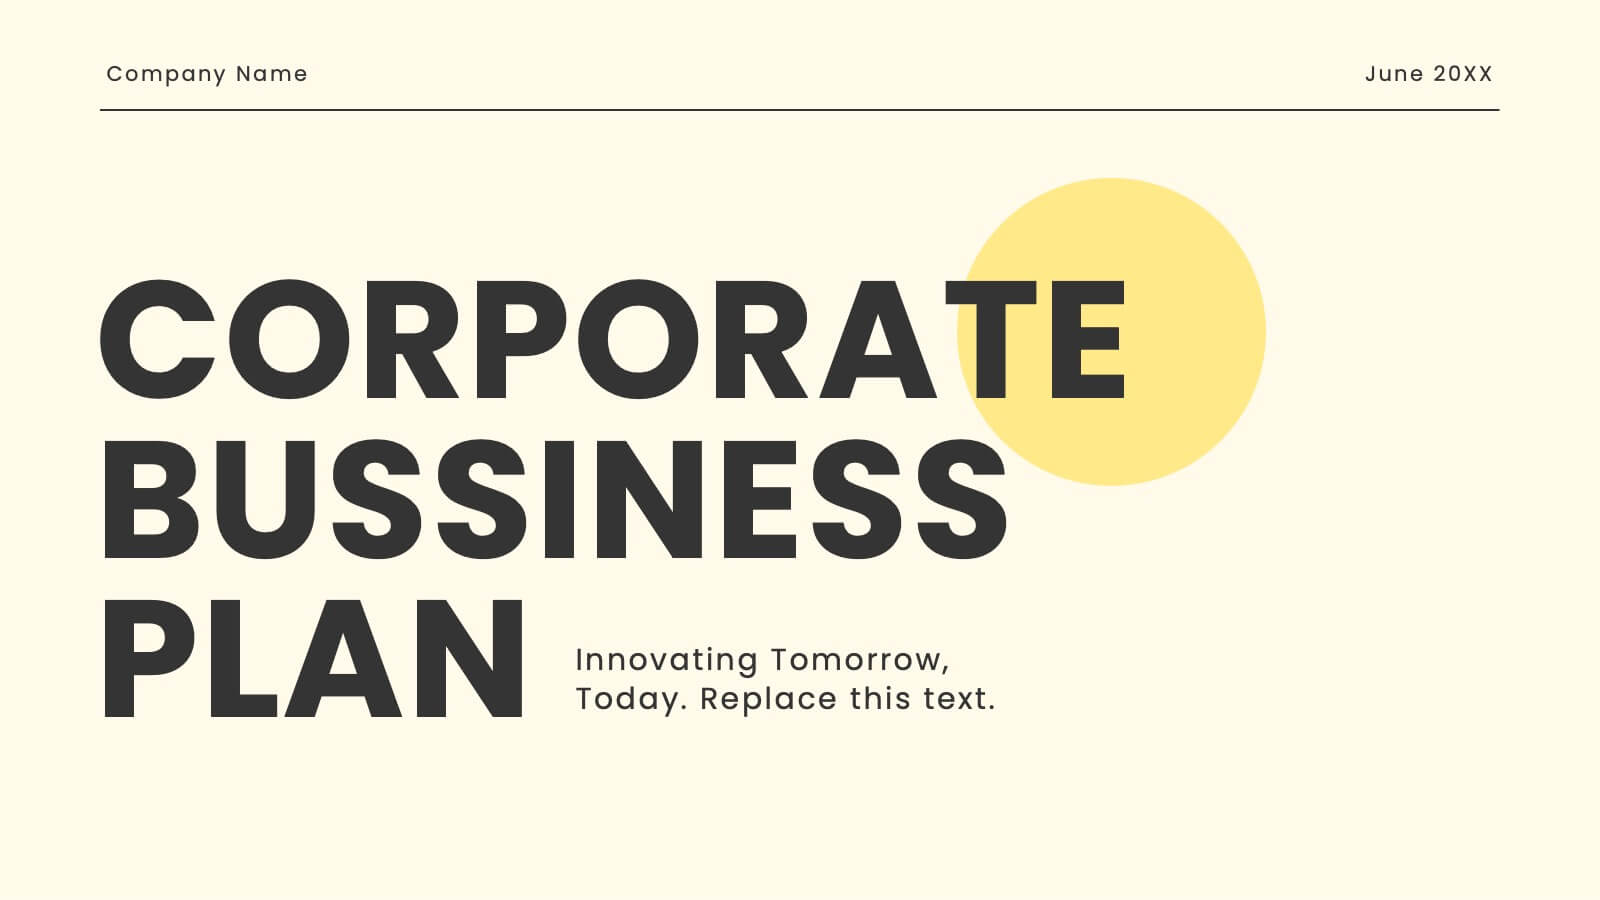
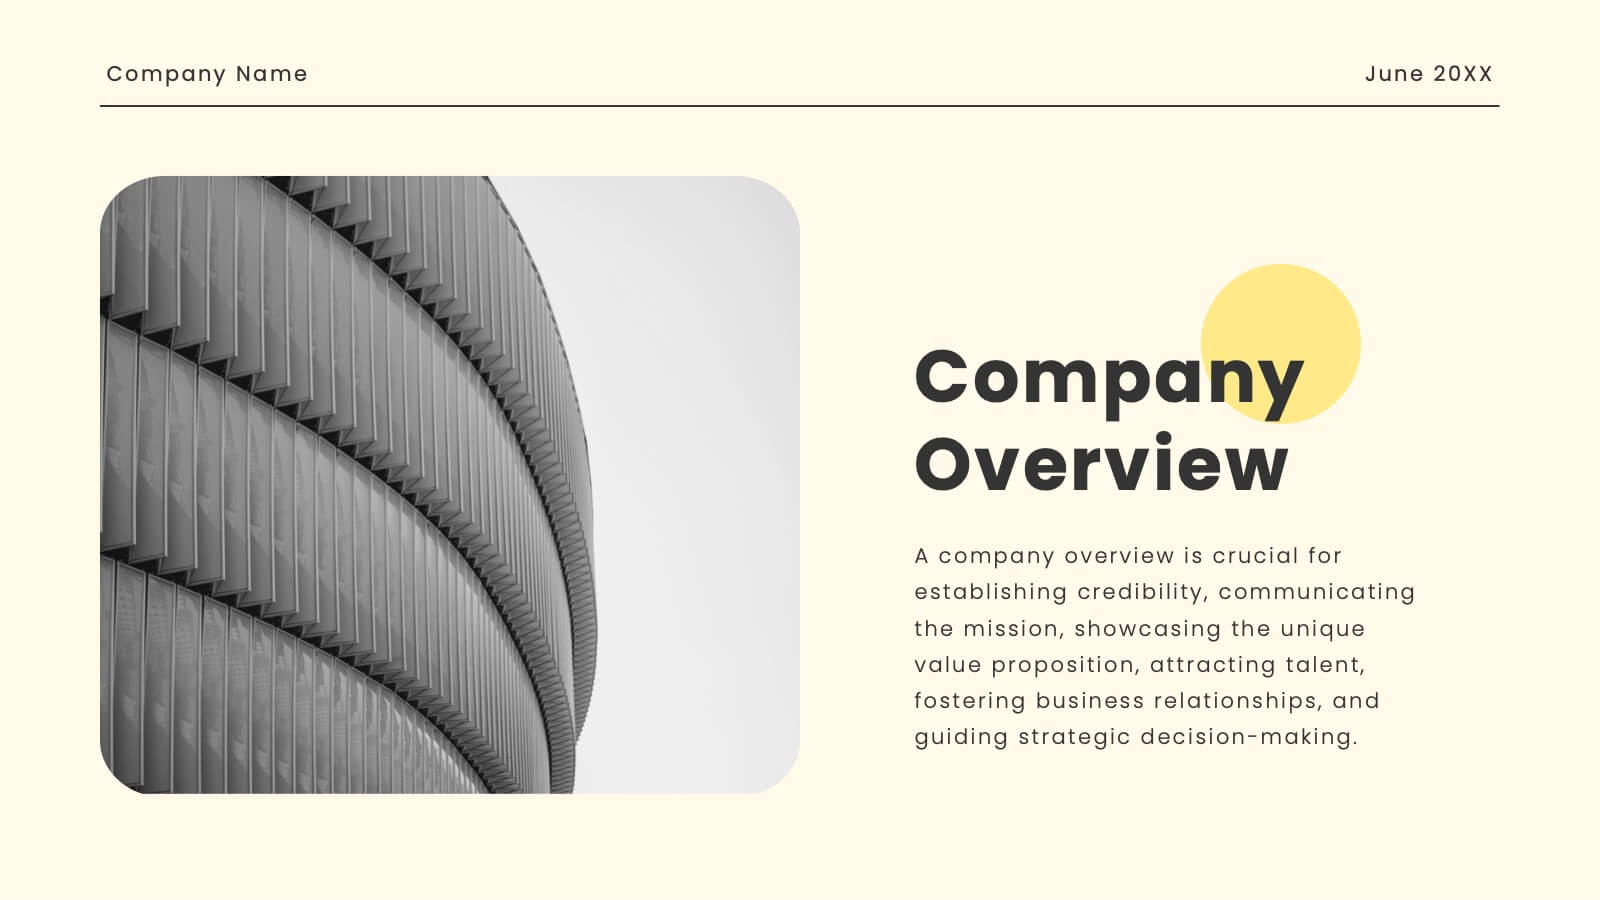
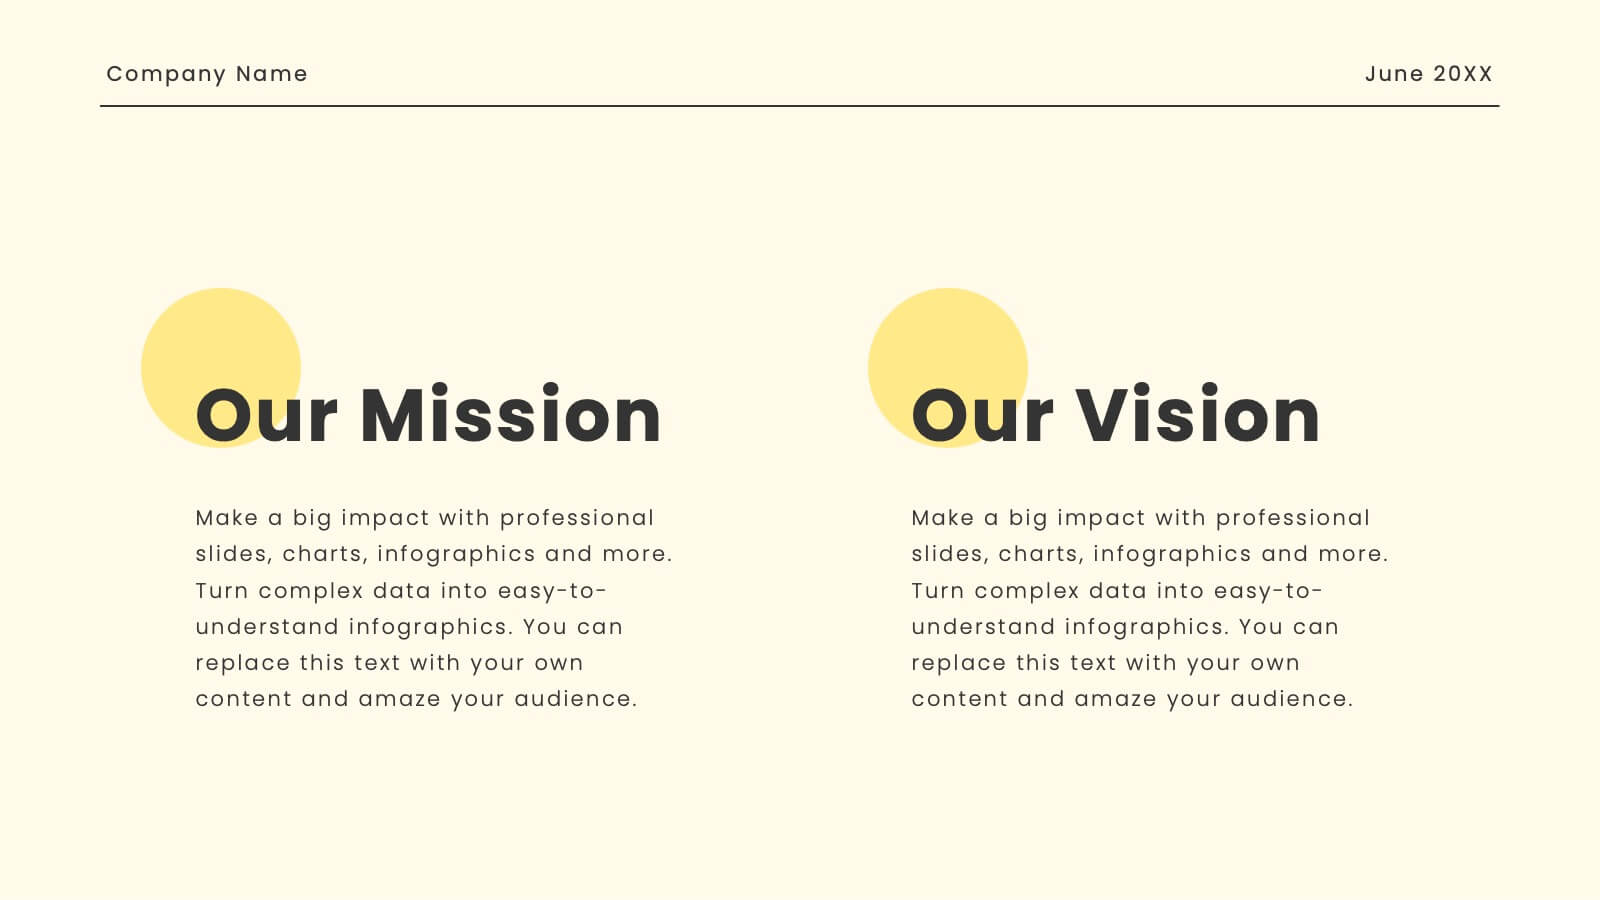
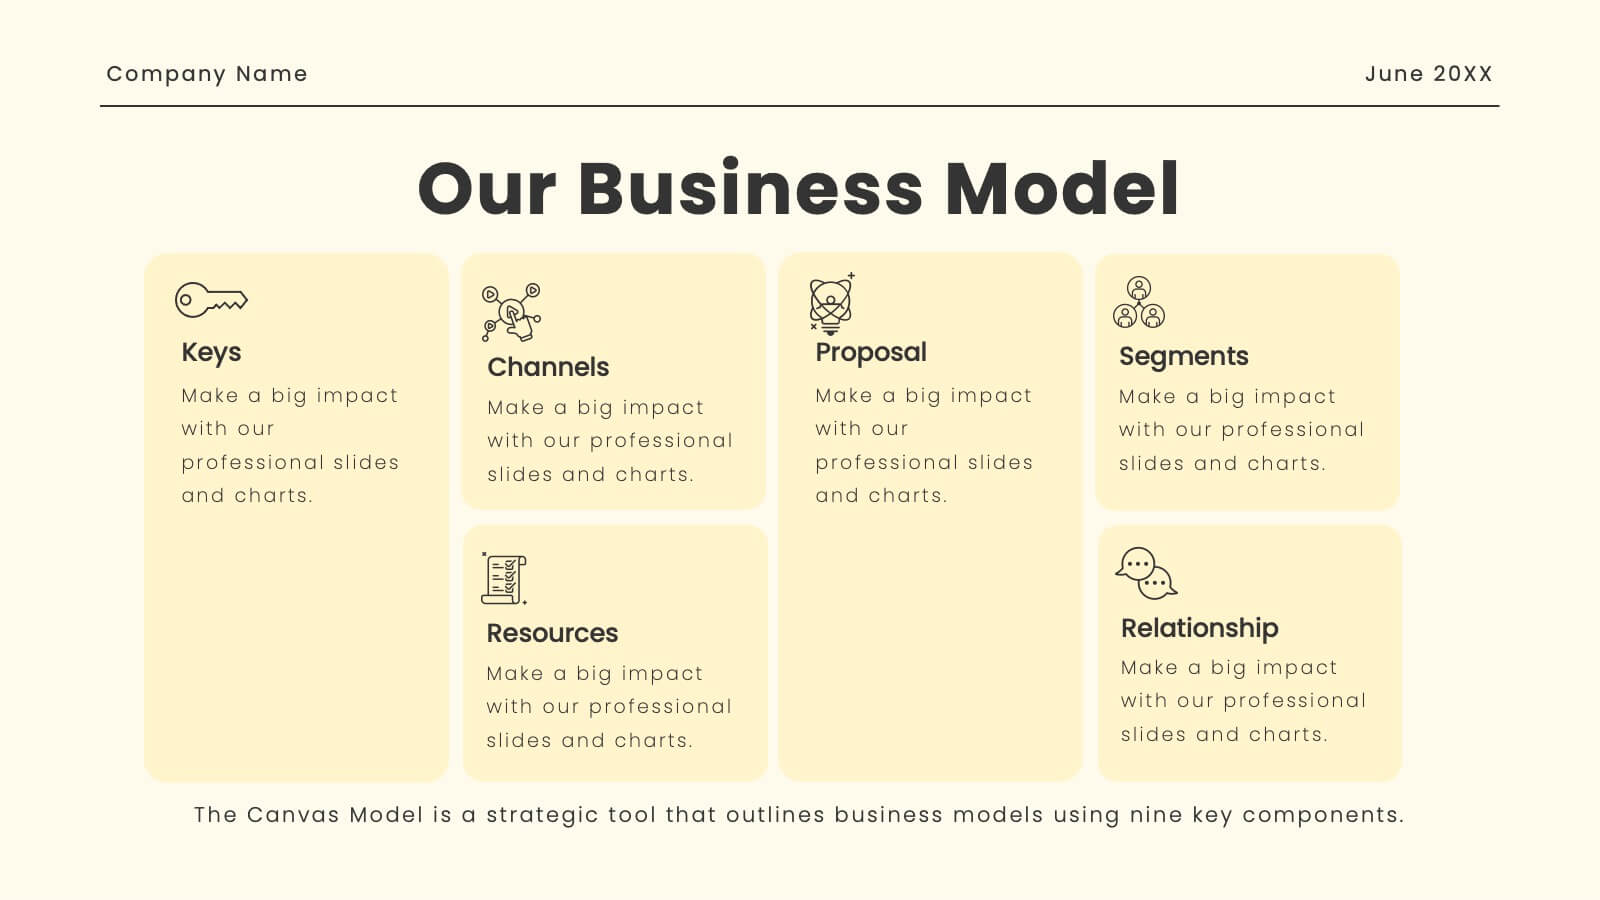
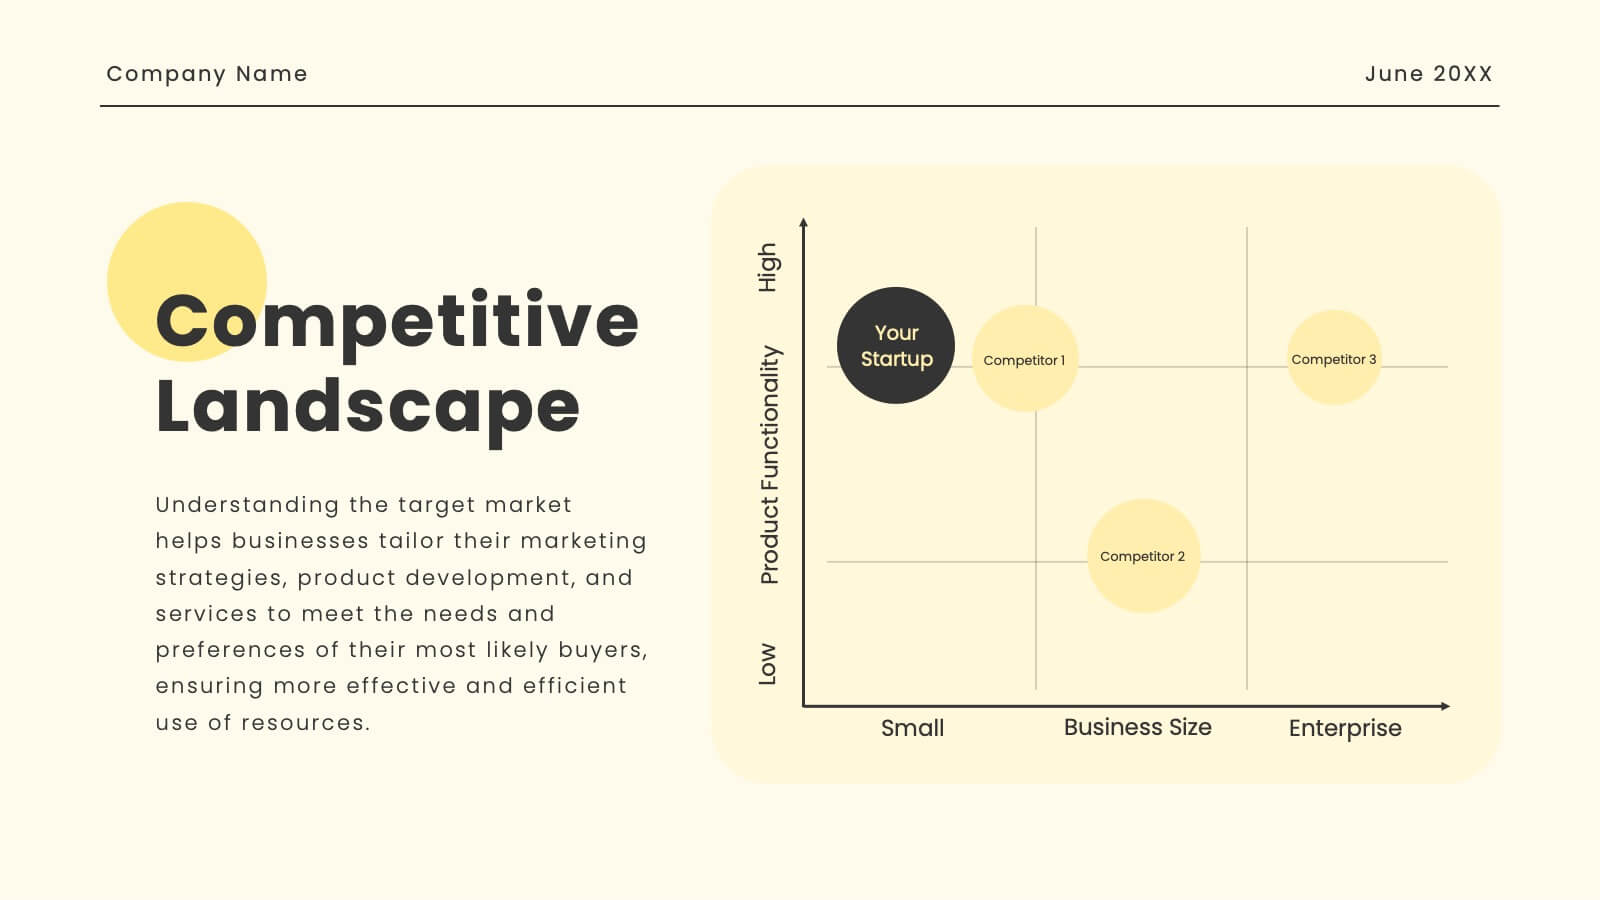
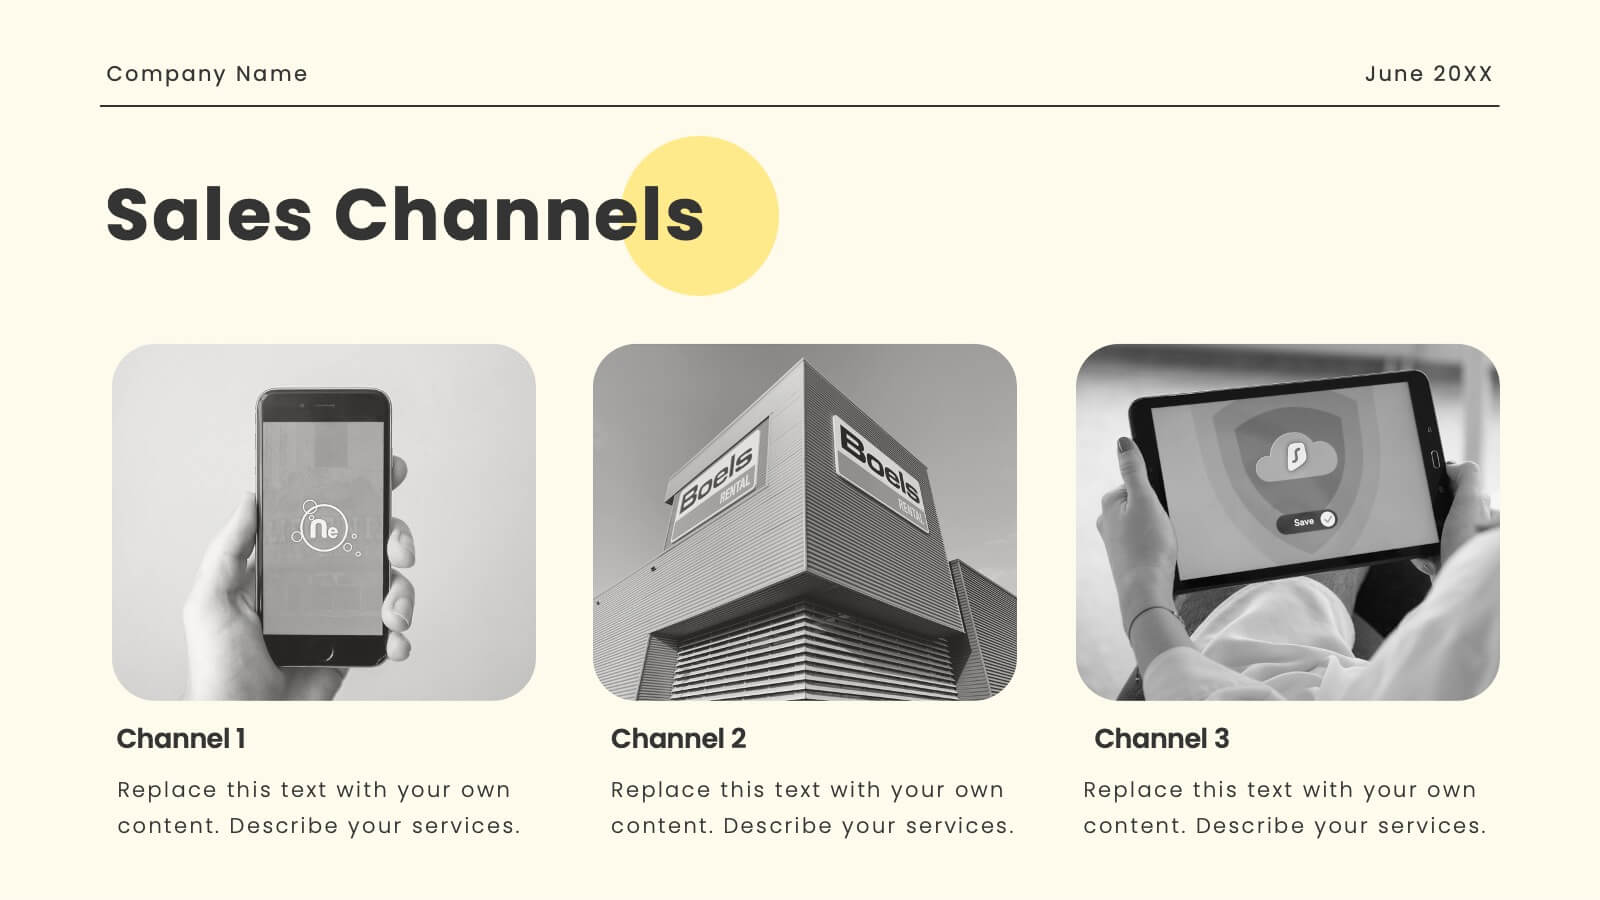
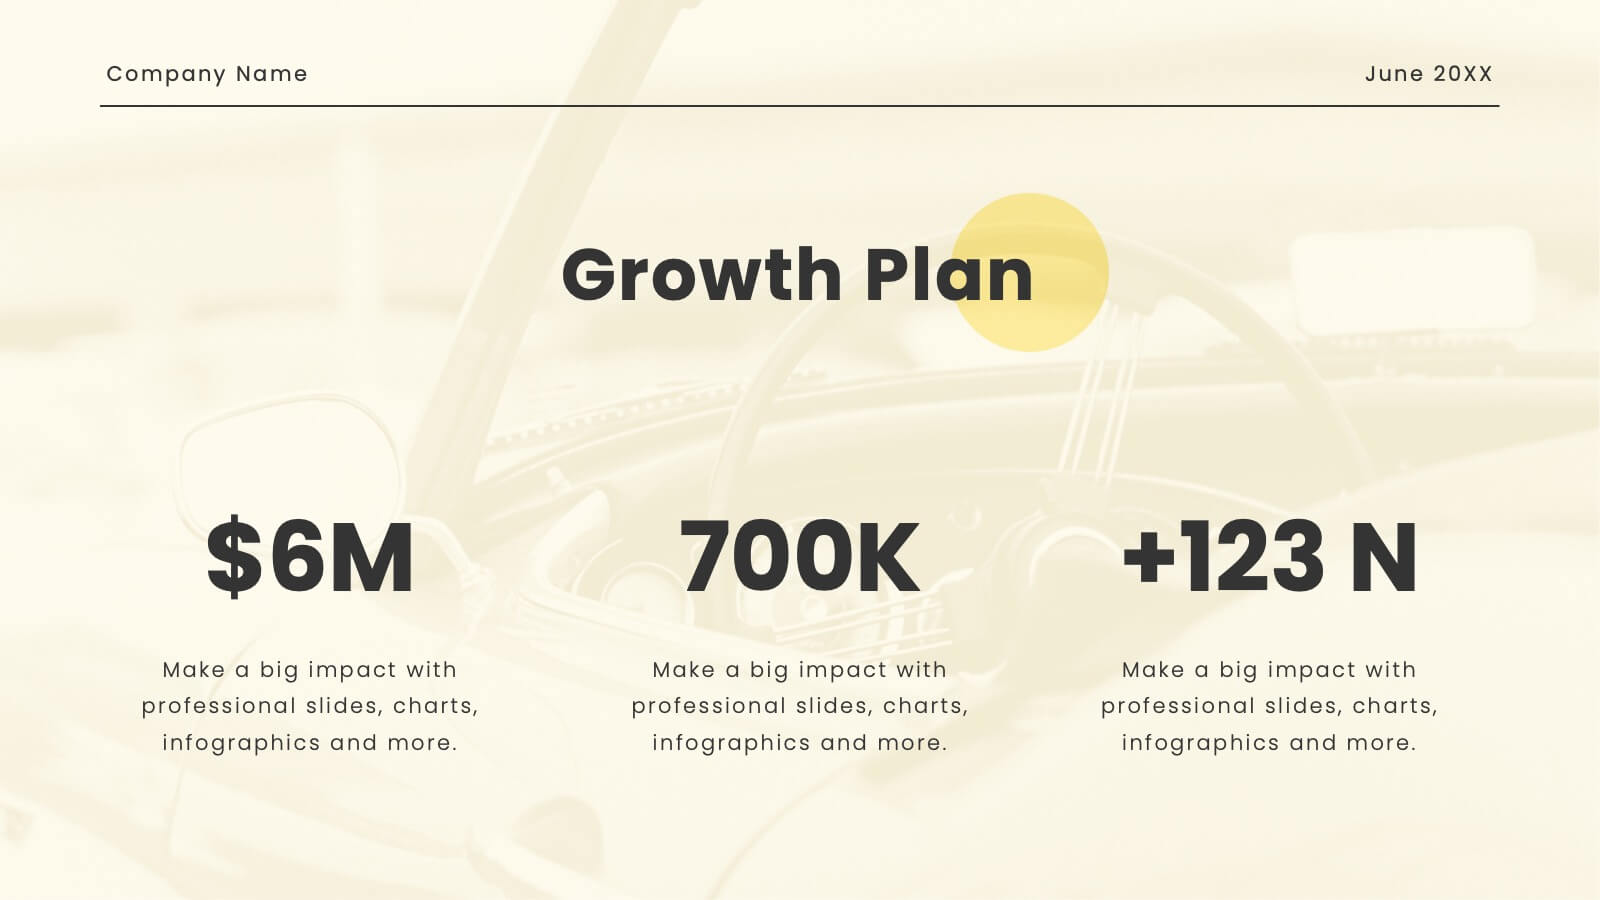
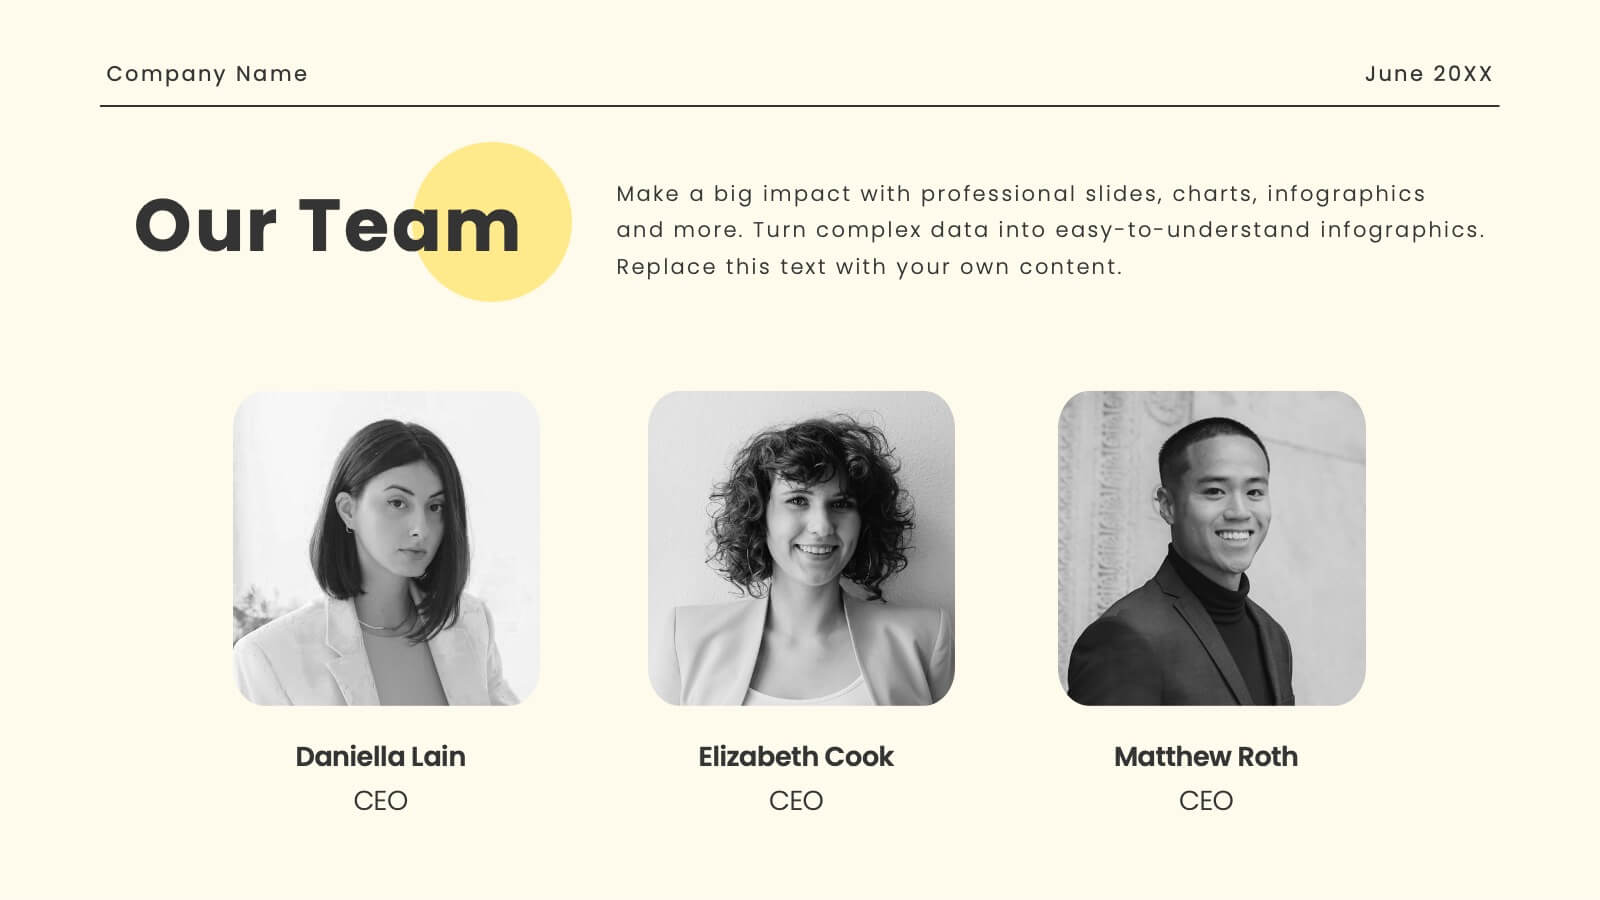
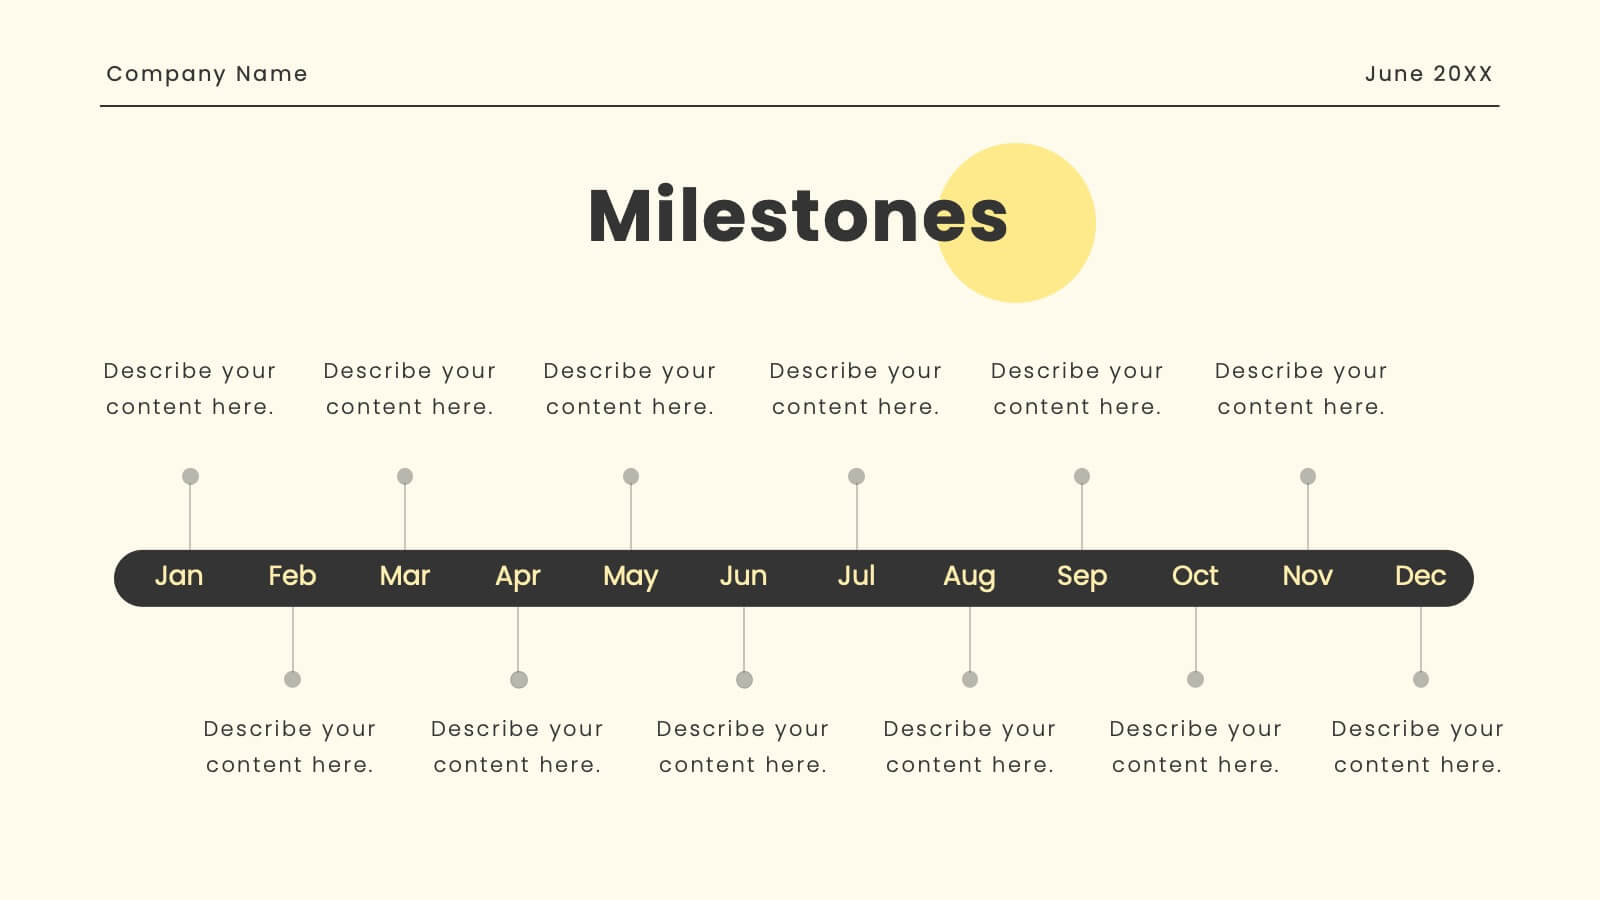
Oasis Startup Business Plan Presentation
Present your corporate business plan with confidence! This template includes sections for company overview, mission, vision, services, target market, and more. Showcase your market strategy, sales channels, growth plan, and financial overview. Perfect for conveying a professional and comprehensive business plan. Compatible with PowerPoint, Keynote, and Google Slides. Impress your audience today!


6 slides
Money Conversion Infographics
Convert currencies effectively with our Money Conversion infographic template. This template is fully compatible with popular presentation software like PowerPoint, Keynote, and Google Slides, allowing you to easily customize it to illustrate and communicate currency conversion rates and methods. The Money Conversion infographic template offers a visually engaging platform to explain the process of converting one currency to another, including exchange rates, conversion tools, and tips for international travelers or businesses. Whether you're a traveler, finance professional, or anyone dealing with currency exchange, this template provides a user-friendly canvas to create informative presentations and educational materials. Optimize your currency conversion knowledge with this SEO-optimized Money Conversion infographic template, thoughtfully designed for clarity and ease of use. Customize it to showcase currency conversion tools, real-time exchange rate sources, and practical examples, ensuring that your audience gains valuable insights into this important aspect of finance. Start crafting your personalized infographic today to become more proficient in money conversion.


6 slides
Monthly Agenda and Events Presentation
The "Monthly Agenda and Events" presentation template features a calendar format, segmented by months, for detailed planning and tracking of events. Each month is color-coded for easy reference and contains placeholders for listing specific tasks or events. This template is perfect for individuals and teams who need to organize and visualize monthly activities, providing a clear overview of upcoming commitments and timelines, ensuring that all events and tasks are completed efficiently throughout the year.


4 slides
Identifying Performance Gaps
Clearly showcase the steps needed to bridge critical performance gaps with this modern template. Ideal for strategic planning, business reviews, and goal-setting sessions. Highlight each stage of growth with dynamic visuals. Fully customizable for PowerPoint, Keynote, and Google Slides.


5 slides
Business and Personal Goal Planning Presentation
Align your vision with action using the Business and Personal Goal Planning slide. This clean, professional layout helps break down up to four key objectives using flag-themed visuals, customizable text blocks, and supportive icons. Perfect for comparing business goals with personal development targets in a single view. Fully editable in PowerPoint, Keynote, and Google Slides—ideal for team meetings, coaching sessions, or strategic planning.


6 slides
International Breast Cancer Day Infographics
Celebrate International Breast Cancer Day with our customizable infographic template, designed to raise awareness and share vital information about breast cancer. This template is fully compatible with popular presentation software such as PowerPoint, Keynote, and Google Slides, allowing you to easily personalize it to convey your unique message. The International Breast Cancer Day infographic template serves as a versatile canvas for displaying facts, statistics, prevention methods, and support resources related to breast cancer. Whether you're a healthcare professional, advocate, or someone passionate about promoting breast health, this template offers a user-friendly platform to create informative presentations and awareness materials. Make an impact with this SEO-optimized International Breast Cancer Day infographic template, meticulously crafted for clarity and ease of use. Customize it to share stories of survivors, highlight the importance of early detection, and spread the message of hope and support. Start creating your personalized infographic to contribute to the cause today!


8 slides
Pet Care and Veterinary Clinic Business Presentation
Highlight your clinic’s services with this engaging, paw-themed slide featuring a veterinarian illustration and four colorful pawprints. Perfect for pet care presentations, animal health pitches, or client brochures. Fully editable in PowerPoint, Keynote, or Google Slides for easy customization.


4 slides
Medical Research and Healthcare Trends Presentation
Stay ahead in the healthcare industry with the Medical Research and Healthcare Trends Presentation template. This structured layout highlights key statistics, research insights, and emerging trends in the medical field. Ideal for healthcare professionals, analysts, and policymakers, this fully customizable template is compatible with PowerPoint, Keynote, and Google Slides.


6 slides
Workforce Development Strategy Presentation
Enhance your workforce development strategies with our "Workforce Development Strategy Presentation" template. This infographic effectively displays essential workforce statistics and initiatives, organizing data into visually distinct segments for clarity. It covers various demographics and departmental roles, color-coded to differentiate data points like gender distribution and participation rates. Ideal for HR professionals and corporate trainers, this template supports strategic decisions in talent management and training. It simplifies complex information, making it accessible for all stakeholders. Compatible with PowerPoint, Keynote, and Google Slides, this template is essential for delivering impactful and strategic human resource presentations.


4 slides
Impact of 5G on Business and Innovation Presentation
Illustrate how next-gen connectivity is transforming industries with this sleek 5G innovation infographic. Featuring a 3D smartphone and signal waves, this slide presents four gradient-colored segments ideal for showcasing business use cases, digital transformation, and market impact. Ideal for tech startups, consultants, and enterprise innovation teams. Easily editable in PowerPoint, Keynote, and Google Slides.