


Features
- 5 Unique slides
- Fully editable and easy to edit in Microsoft Powerpoint, Keynote and Google Slides
- 16:9 widescreen layout
- Clean and professional designs
- Export to JPG, PDF or send by email


Do you have any questions?
Recommend


5 slides
Impacts of Information Technology Infographics
Information Technology has had a profound impact on various aspects of society, including business, communication, education, healthcare, and entertainment. These infographic templates are designed to help you communicate complex technological concepts in a visually compelling way, making it suitable for IT professionals, businesses, or anyone interested in understanding and highlighting the transformative power of information technology. The template features a sleek design with customizable layouts, icons, and color schemes that can be adjusted to match your branding. It is compatible with PowerPoint, Keynote, and Google Slides.


5 slides
Company History and Growth Timeline Presentation
Present your milestones with clarity using the Company History and Growth Timeline presentation. Ideal for startups, enterprises, and project retrospectives, this timeline layout helps you highlight key achievements, growth phases, and expansion years in a visually structured format. With modern design elements, editable text fields, and dynamic year markers, it's perfect for telling your brand story or progress journey. Fully compatible with PowerPoint, Keynote, and Google Slides.


5 slides
Behavioral Psychology Diagram Presentation
Give your audience something to think about—literally. This bold and modern infographic layout lets you visualize complex human behavior patterns through simple, colorful brain-mapping diagrams. Perfect for presenting psychological insights, decision-making models, or behavioral science data. Fully compatible with PowerPoint, Keynote, and Google Slides for easy customization and professional use.


7 slides
Innovation Technology Infographics
Innovation technology refers to the application of technology or the use of innovative approaches to create new products, services, processes, or business models. This infographic template is designed to showcase the cutting-edge technologies shaping our future. Let the vibrant visuals and insightful content guide you through the exciting realm of innovation and technology. Compatible with Powerpoint, Keynote, and Google Slides. Fully customizable, explore this infographic and step into the future. The visuals are designed to ignite your imagination and enlighten your audience about the limitless potential of innovation and technology.


21 slides
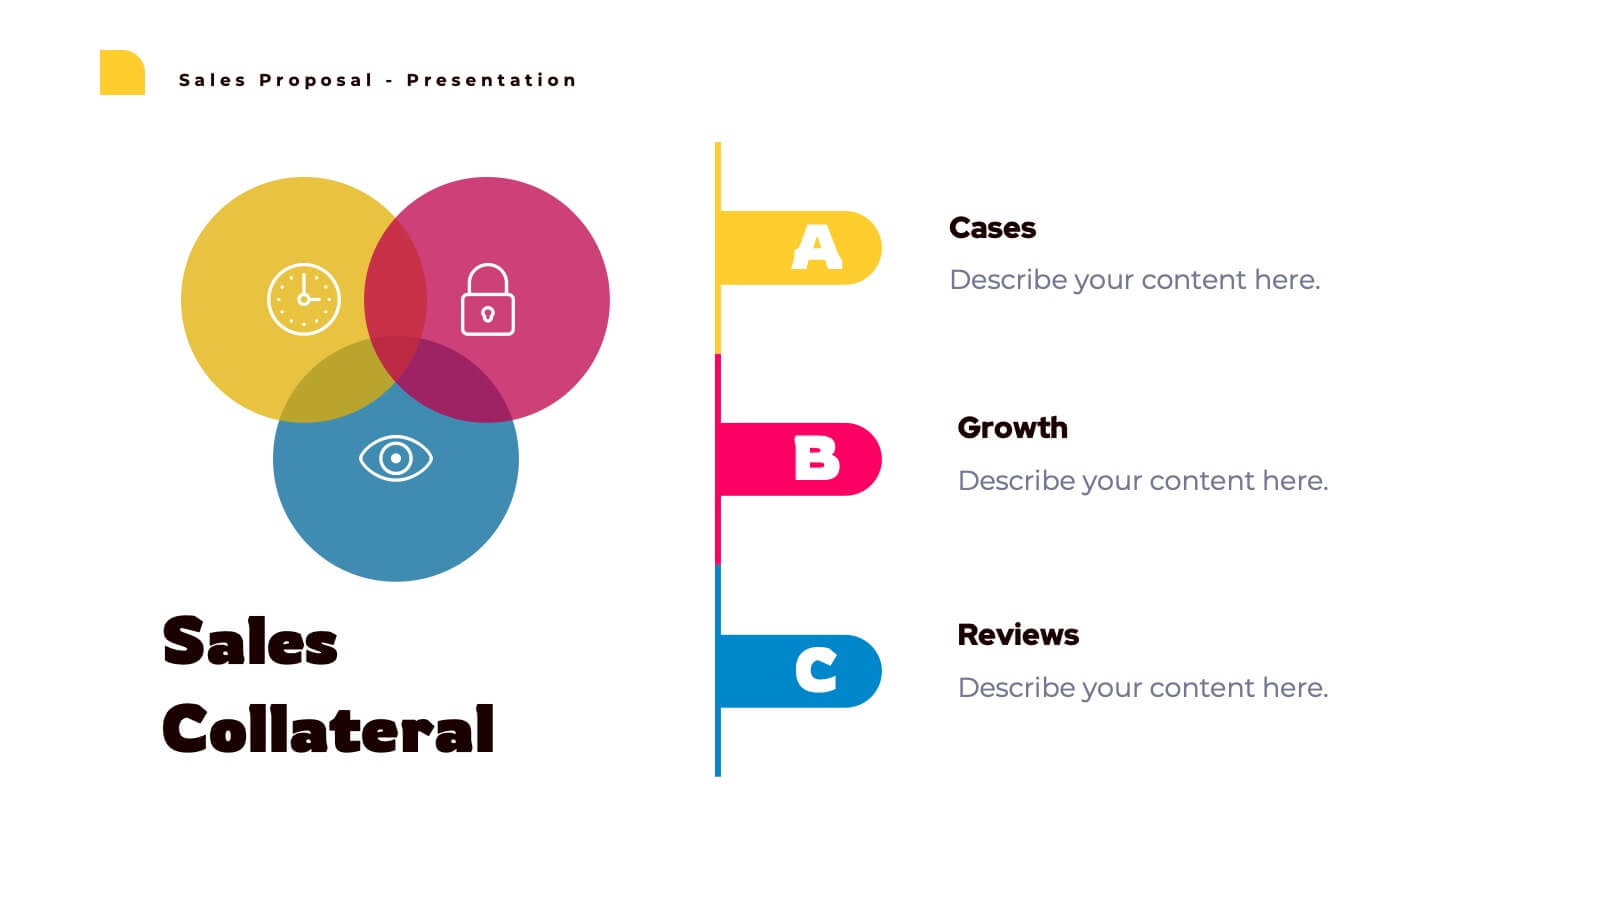
Lunaris Sales Proposal Presentation
An engaging and professional presentation designed to showcase sales proposals effectively. It features slides for objectives, market analysis, pricing strategies, team introductions, and performance metrics. The vibrant design ensures impactful communication with stakeholders. Fully editable and compatible with PowerPoint, Keynote, and Google Slides for seamless customization and presentation delivery.


4 slides
Veterinary Care and Health Tips Presentation
Keep your audience engaged with this clean, friendly infographic layout perfect for sharing animal care advice and clinic insights. Ideal for veterinarians or pet health professionals, it helps communicate tips, services, and best practices clearly. Fully editable and compatible with PowerPoint, Keynote, and Google Slides for easy customization.


5 slides
Human Resource Functions Infographics
Illuminate the complexities of people management with our human resource functions infographics template. Cast in the professional yet warm palette of black, orange, pink, and red, this template is an essential tool for HR professionals, corporate trainers, and business leaders. It elegantly dissects various HR realms with its sleek graphics, intuitive icons, and dedicated image placeholders, making it perfect for showcasing recruitment processes, employee engagement strategies, or organizational culture principles. Its creative, vertical style is designed to hold the attention and fuel the imagination, turning any HR presentation into a compelling narrative.


4 slides
Cyber Threat Prevention Strategies Presentation
Clearly communicate your cybersecurity roadmap using this sleek timeline-style slide design. Each step is represented by a distinct icon and color-coded milestone, ideal for outlining protocols such as threat detection, employee training, or system hardening. Designed for IT teams, security analysts, and corporate risk departments. Fully editable and compatible with PowerPoint, Keynote, and Google Slides.


5 slides
Institutional Historical Highlights Presentation
Present milestones with impact using this vertical bar layout designed to showcase historical achievements clearly. With icons, aligned titles, and color-coded steps, it’s perfect for timelines, growth overviews, or academic evolution. Fully editable in PowerPoint, Keynote, and Google Slides, it offers structured storytelling with a sleek, professional design.


6 slides
Defined Company Objectives Breakdown
Break down your company’s key priorities using this Defined Company Objectives slide. Featuring upward-pointing arrows from a central base, it visually maps out strategic goals in a clear, directional format. Fully customizable in PowerPoint, Keynote, and Google Slides.


5 slides
Digital Marketing Strategy Infographics
A digital marketing strategy refers to a plan of action that businesses or organizations develop to achieve their marketing goals using digital channels and technologies. These vertical infographics outline the key elements of a successful digital marketing strategy. They are designed for marketers, business owners, and individuals seeking to understand and implement effective digital marketing practices. Guide your audience through the process of defining specific objectives, such as increasing website traffic, improving lead generation, or enhancing brand awareness. These can cover strategies and leverage social media analytics.


7 slides
Business Strategy with 7S Model
Clearly map out your organizational alignment using this Business Strategy with 7S Model template. Perfect for strategy consultants, leadership teams, and business educators, it illustrates the interconnectedness of structure, strategy, systems, style, staff, skills, and shared values. Fully customizable in PowerPoint, Keynote, and Google Slides.


10 slides
Strategic SWOT Cubes Presentation
Visualize strategic insights with the SWOT Cubes Infographic. This dynamic layout organizes strengths, weaknesses, opportunities, and threats into 3D cubes, making business analysis clear and engaging. Ideal for strategic planning, risk assessment, and competitive positioning. Fully customizable and compatible with PowerPoint, Keynote, and Google Slides for seamless editing.


5 slides
Investment Opportunity Business Case
Visualize the value behind your proposal with this key-themed layout, ideal for presenting compelling reasons to invest. Each section highlights a unique point, making it easy to walk stakeholders through critical benefits and insights. Fully editable and compatible with PowerPoint, Keynote, and Google Slides.


7 slides
Venn Diagram Statistics Infographic Presentation
Venn diagrams are important because they show relationships between two or more ideas. The circles—either filled in with color or left empty—create a picture of how things relate to one another, while arrows show which things are overlapping. This template is easy to use and has a cool green color scheme that is easy on the eyes. It has a customizable layout to make your presentation unique! With this template, you can create awesome Venn Diagrams that will help you compare and contrast information in a way that is easy to understand. This is perfect for school projects or even work presentations.


5 slides
Training Needs Through Skills Gap Analysis Presentation
Clearly identify training gaps and skill development priorities with the Training Needs Through Skills Gap Analysis Presentation. This structured layout helps HR teams and managers map out competency levels, prioritize development, and align learning paths with business goals. Fully editable in PowerPoint, Keynote, Canva, and Google Slides.


21 slides
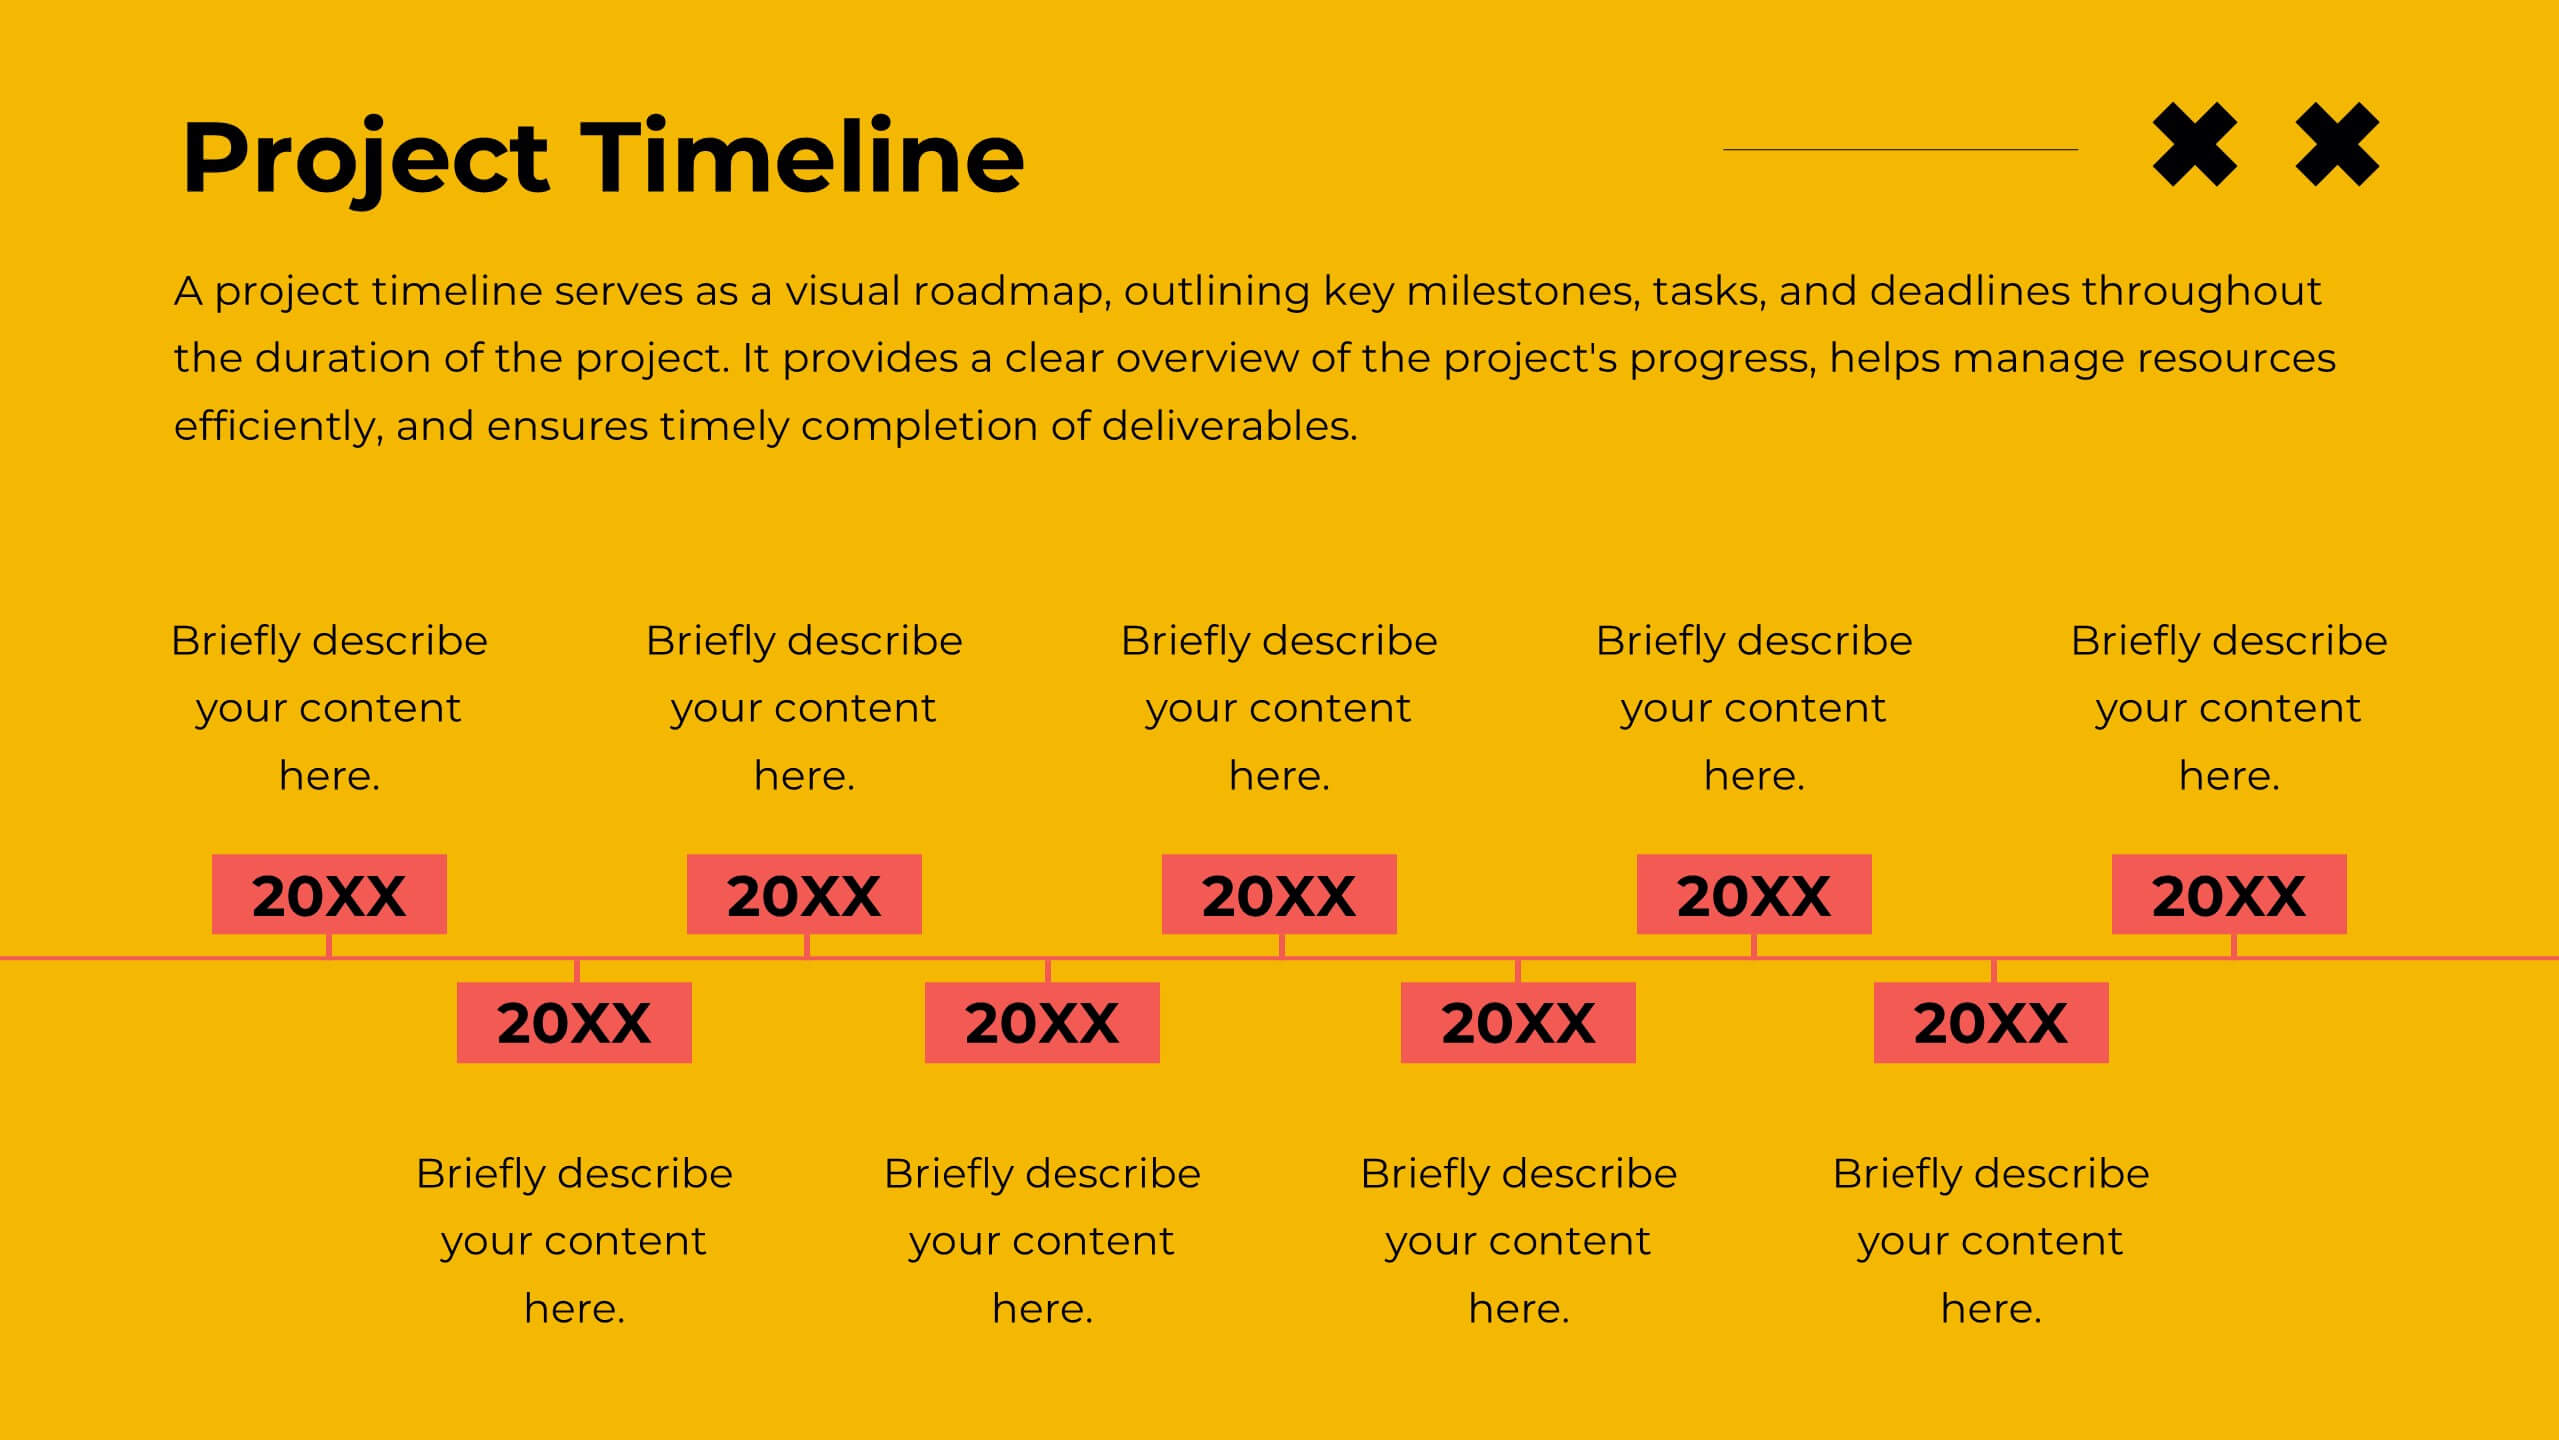
Oslo Design Strategy Proposal Presentation
This design strategy proposal template is tailored to present your creative process with bold colors and clean layouts. It includes sections like overview, design brief, concept development, design process, mood board, and project timeline, giving you a comprehensive structure for showcasing your approach. Compatible with PowerPoint, Keynote, and Google Slides, it ensures seamless presentations.