


Features
- 21 Unique slides
- Fully editable and easy to edit in Microsoft Powerpoint, Keynote and Google Slides
- 16:9 widescreen layout
- Clean and professional designs
- Export to JPG, PDF or send by email


Do you have any questions?
Recommend


23 slides
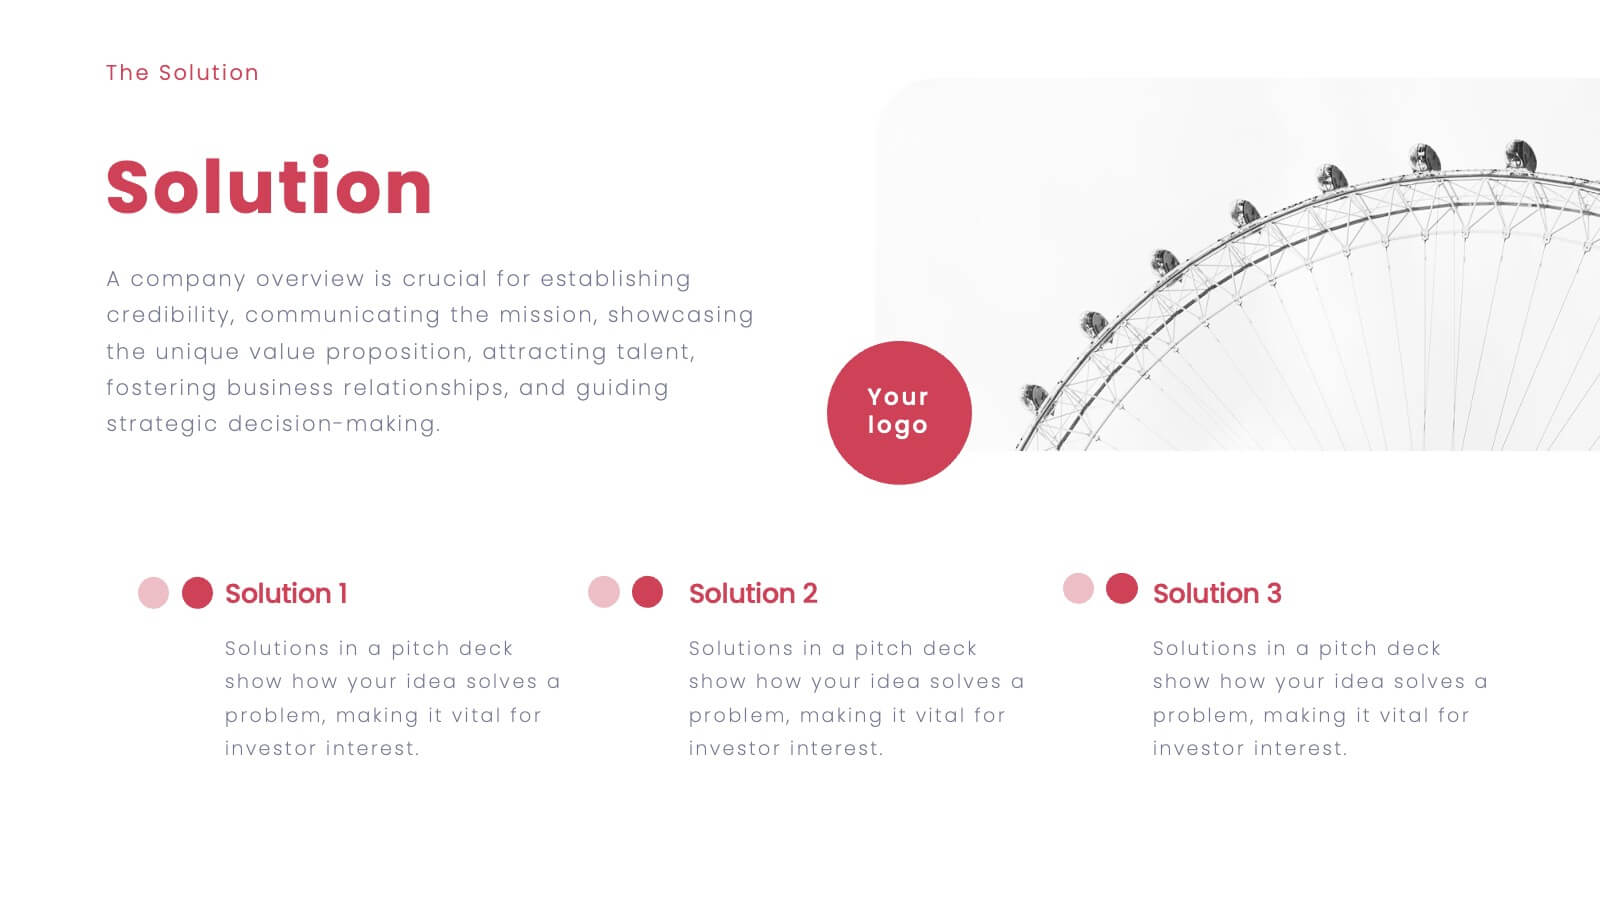
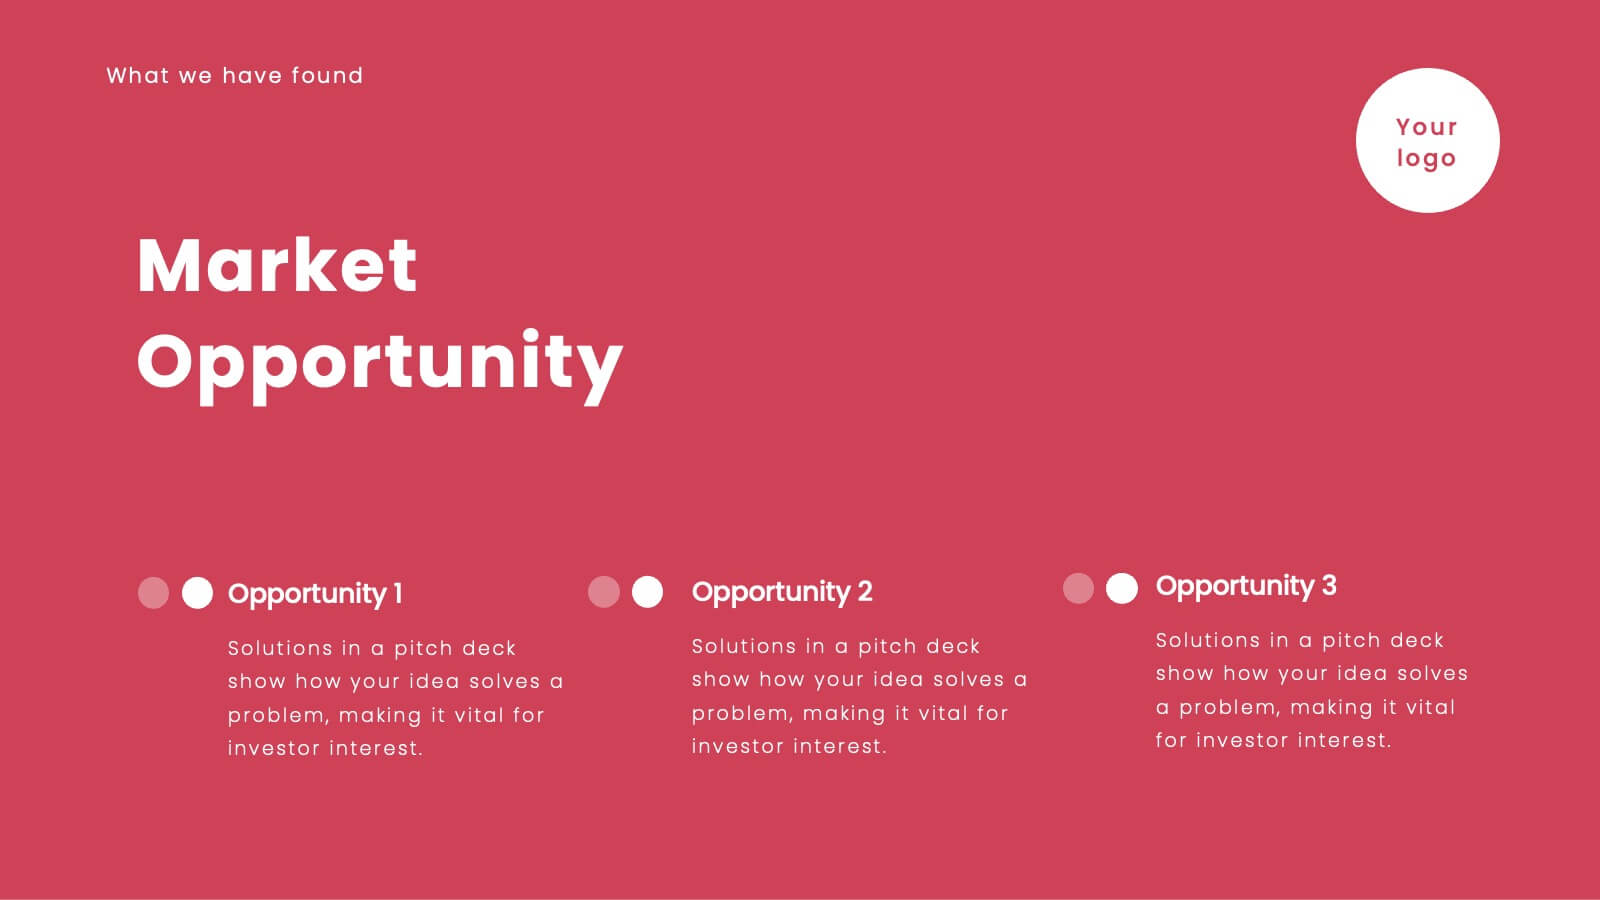
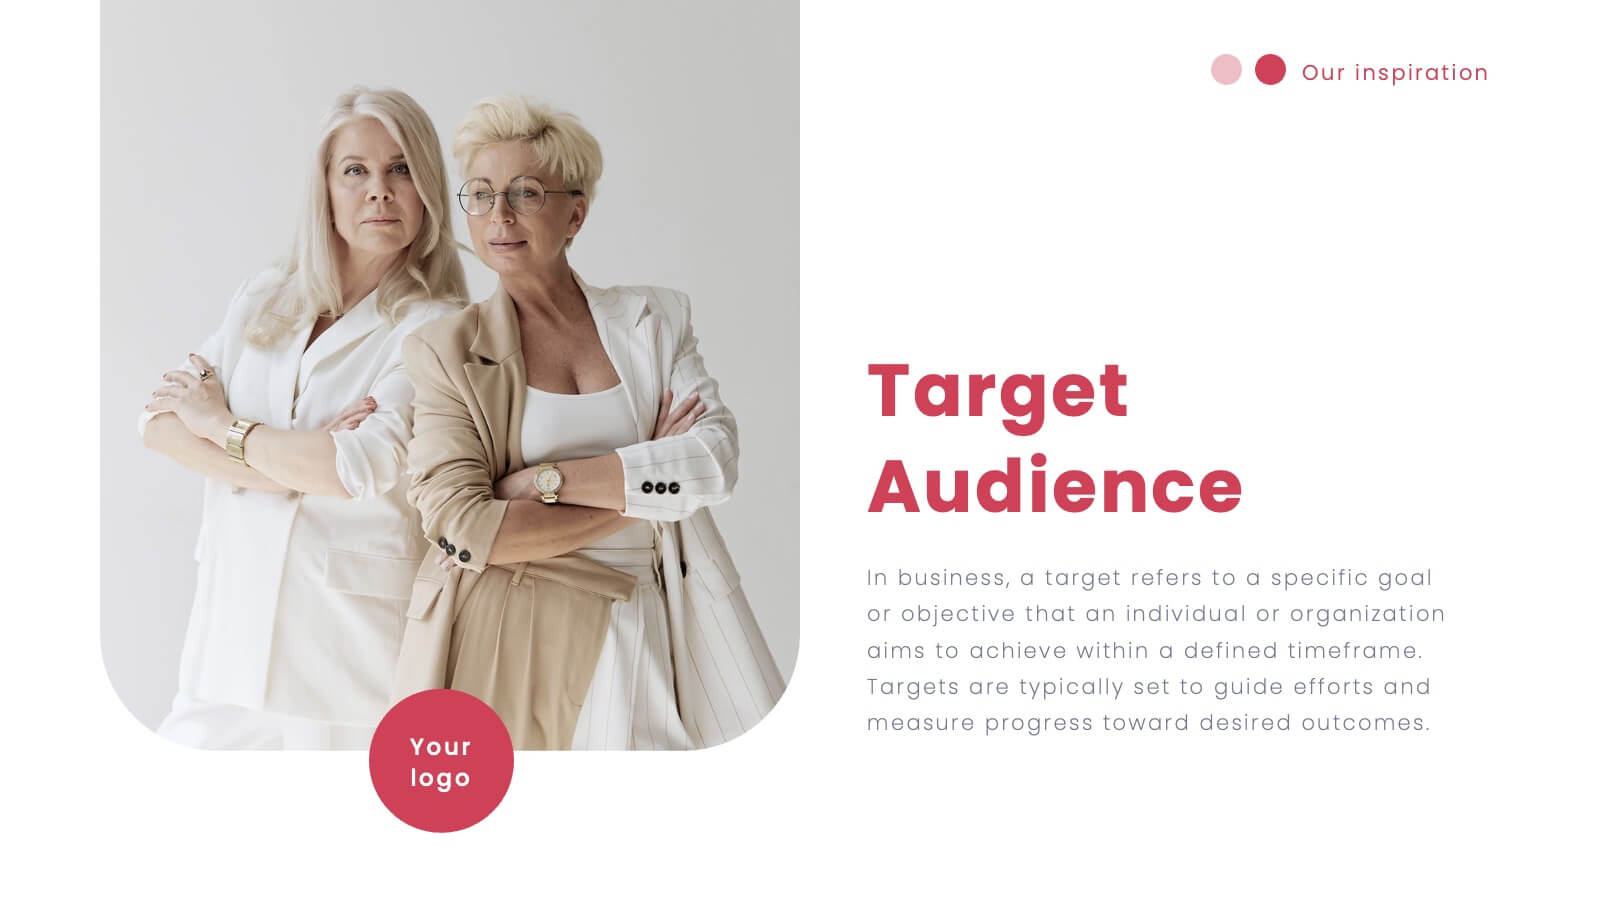
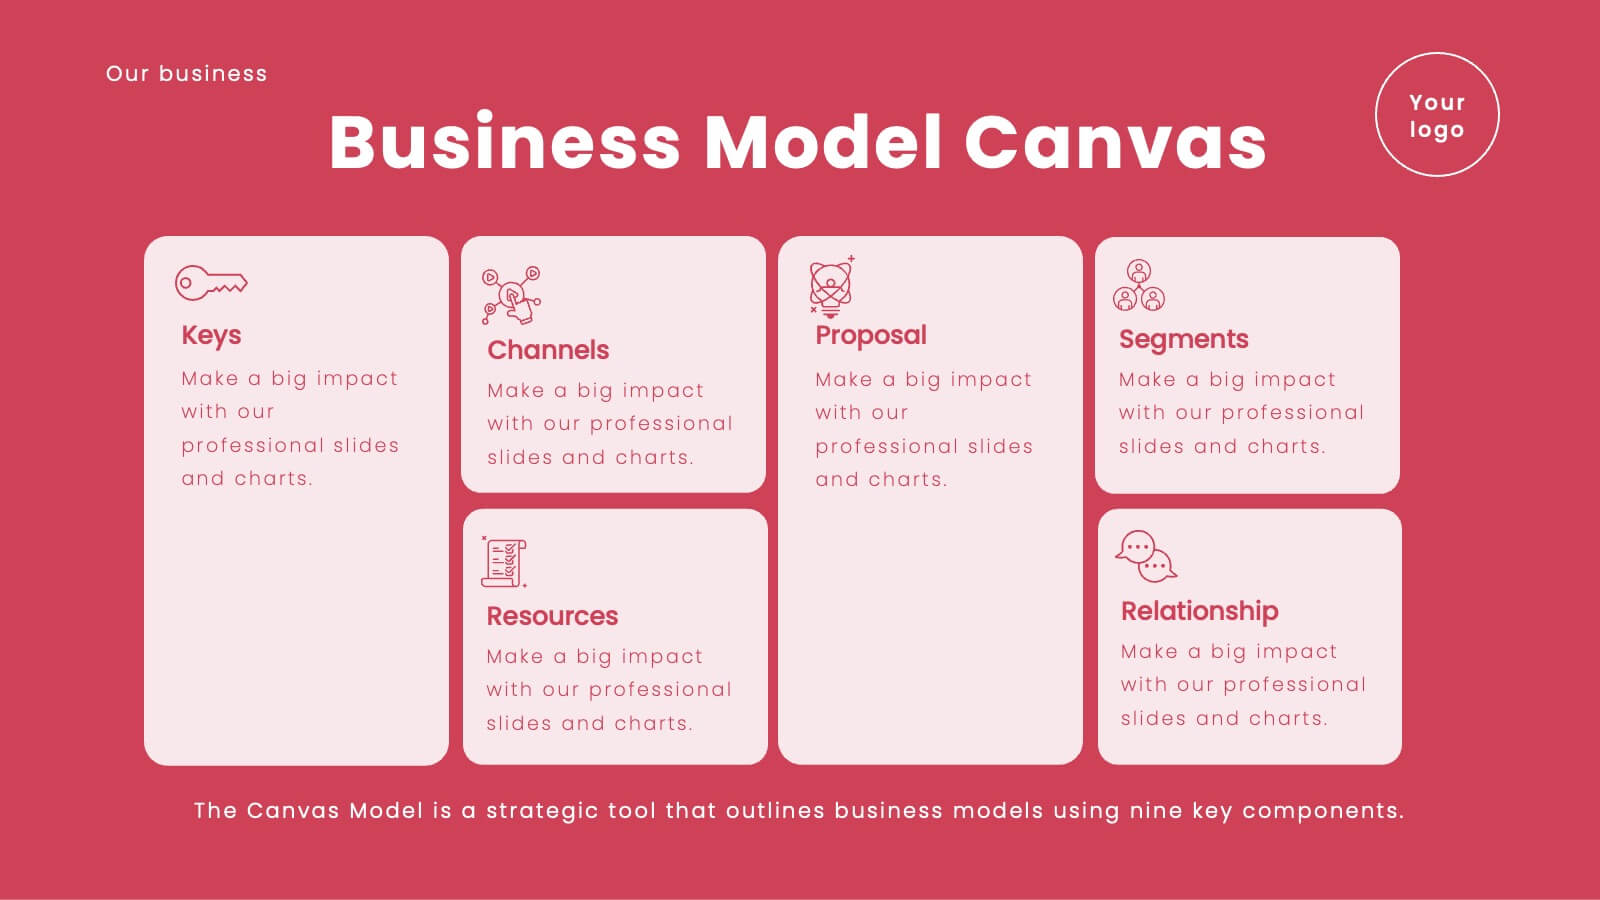
Twilora Business Plan Presentation
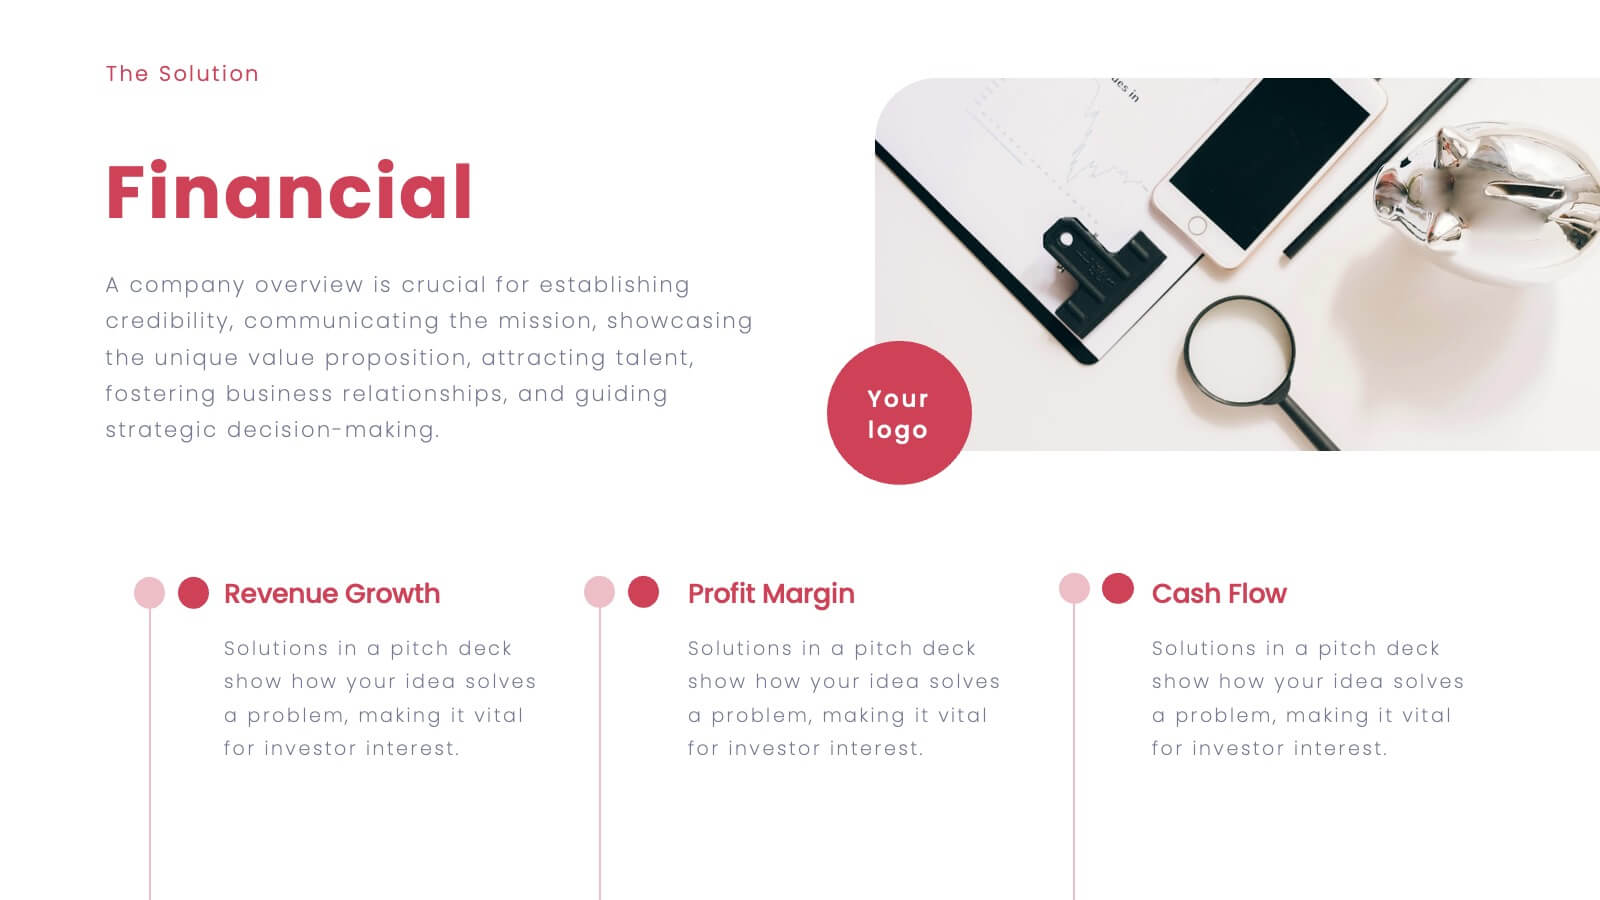
Present your business strategy with a comprehensive and visually engaging template designed to impress stakeholders and investors. This template covers key elements of a business plan, including company background, market opportunities, business objectives, and key milestones. Showcase your product offerings, target audience, and competitive advantages through clear, professional visuals and data-driven charts. Highlight your financial performance, investment opportunities, and operational plans with precision and clarity. Tailor the design to reflect your brand's identity and goals. Fully compatible with PowerPoint, Google Slides, and Keynote, this versatile template is perfect for startups, established businesses, and entrepreneurs aiming to present a strong and compelling business case.


5 slides
Target Market and Audience Segmentation Presentation
Identify and engage your ideal audience with the Target Market and Audience Segmentation presentation. This clear, timeline-style infographic uses a bullseye layout to highlight key market segments and their progression. Ideal for marketing strategies, customer profiling, and campaign planning. Fully customizable in Canva, PowerPoint, and Google Slides.


5 slides
WFH Policy Overview Presentation
Bring clarity and confidence to your remote-work guidelines with a clean, puzzle-style layout that makes every policy easy to follow. This presentation explains key expectations, communication standards, and workflow essentials designed to support productive work-from-home environments. Fully customizable and compatible with PowerPoint, Keynote, and Google Slides.


21 slides
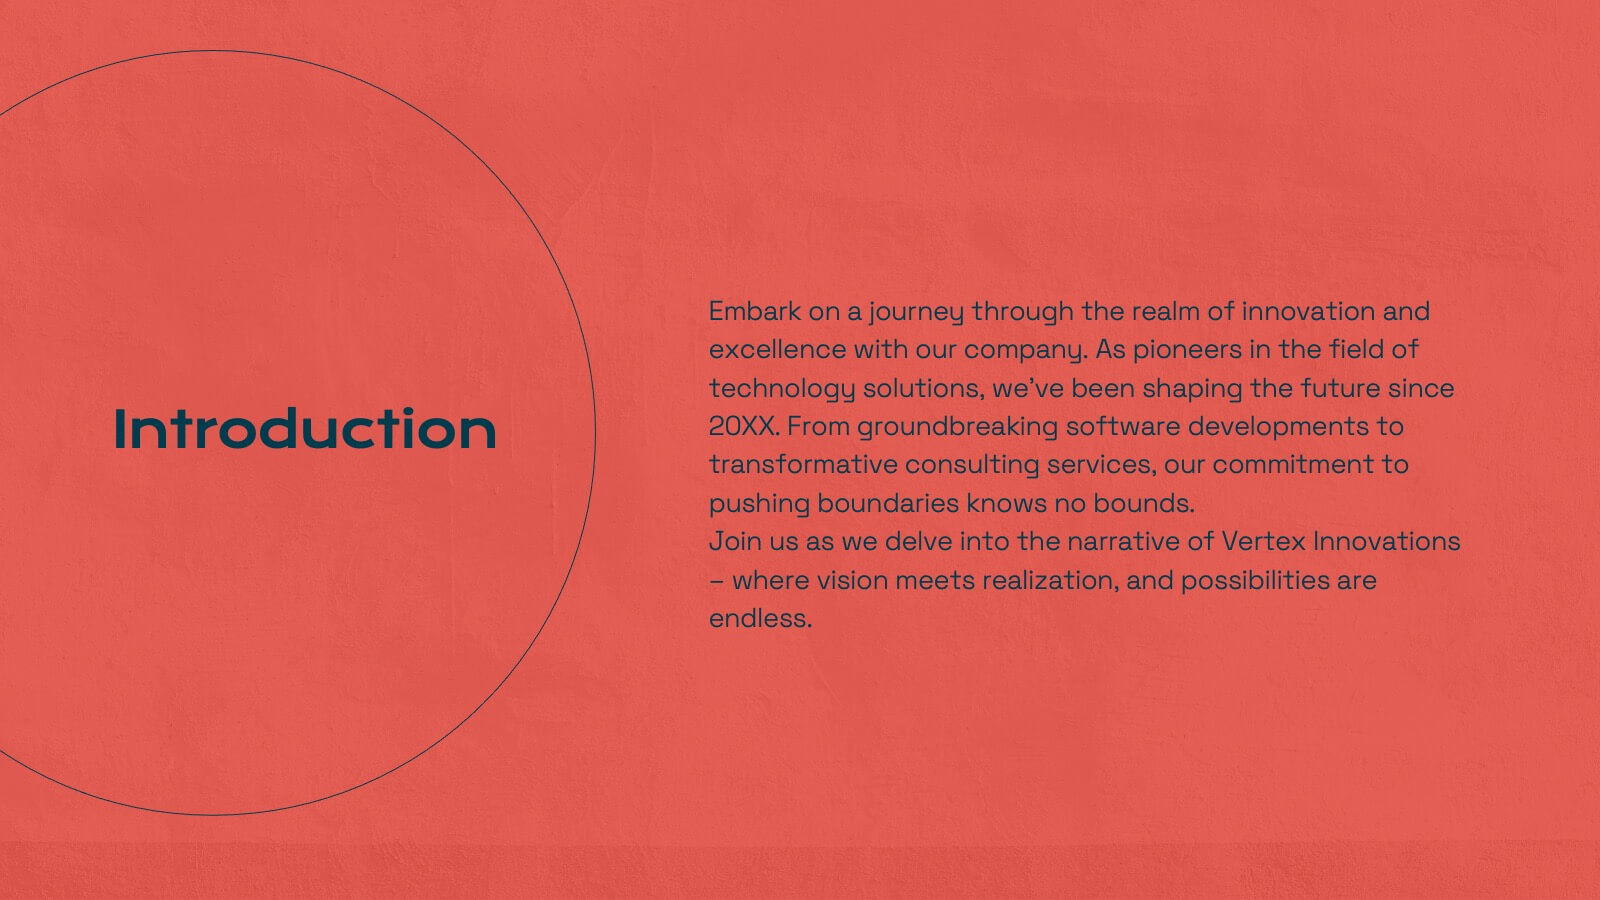
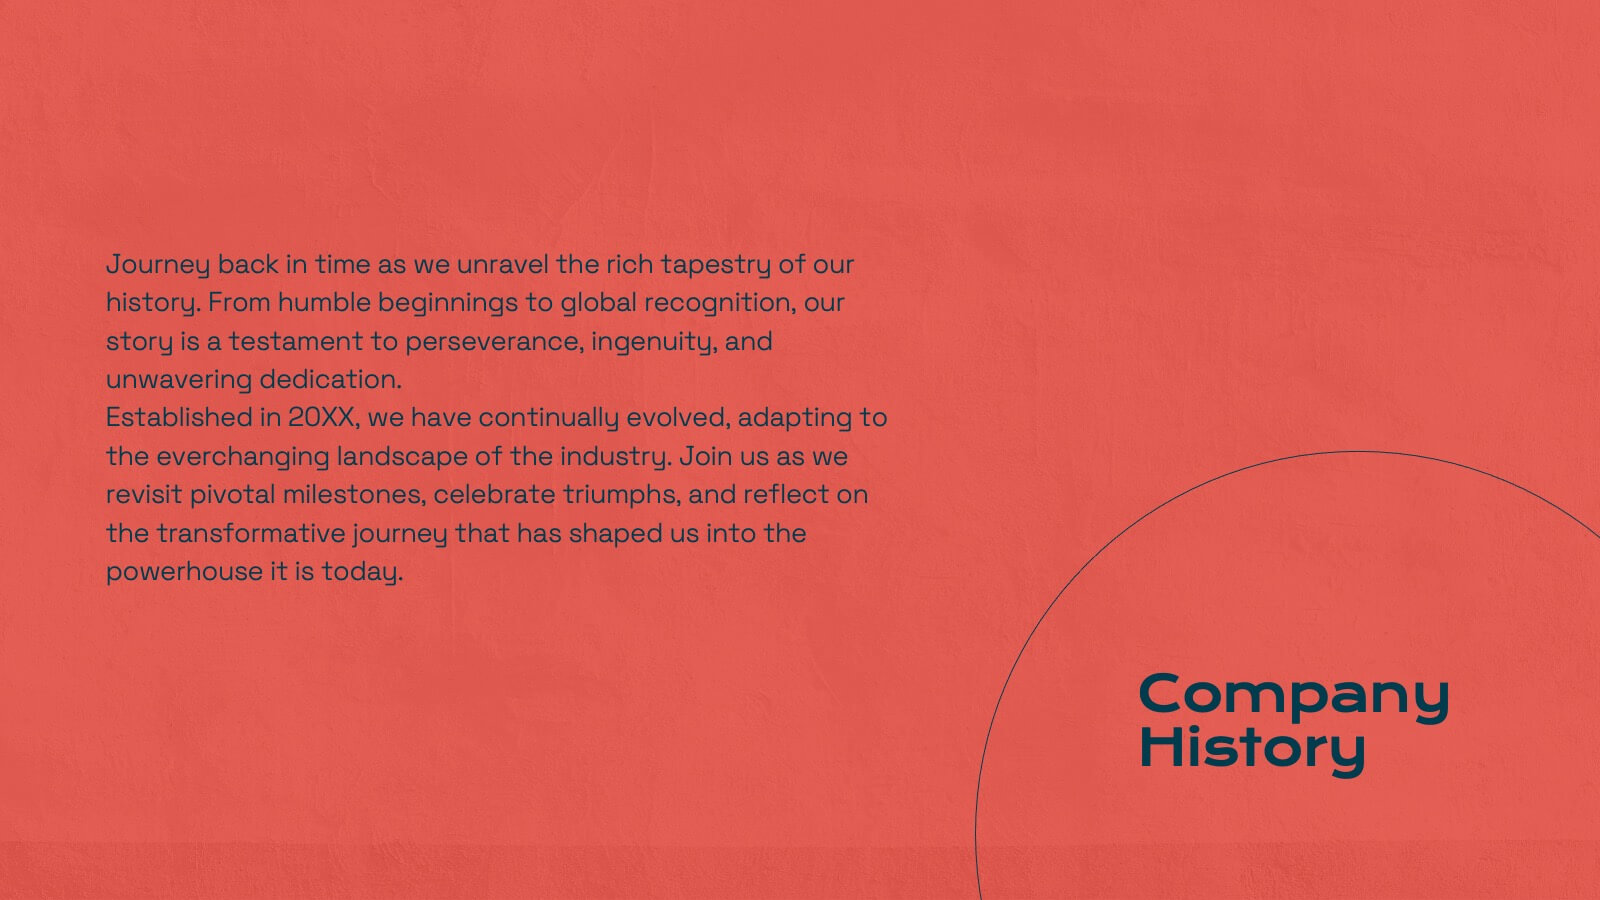
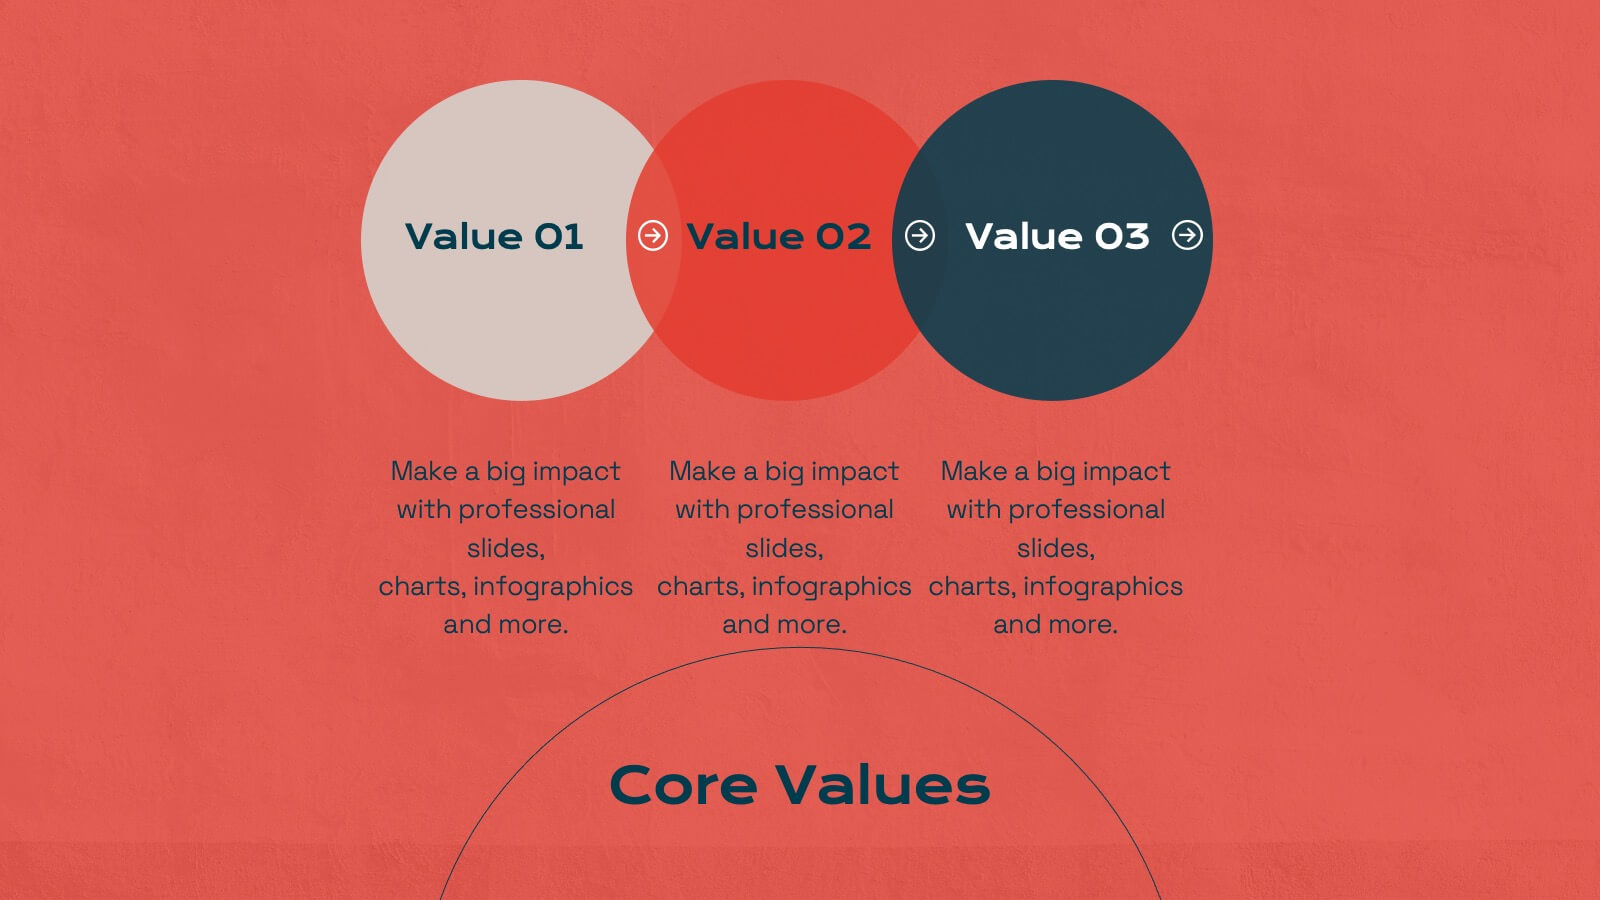
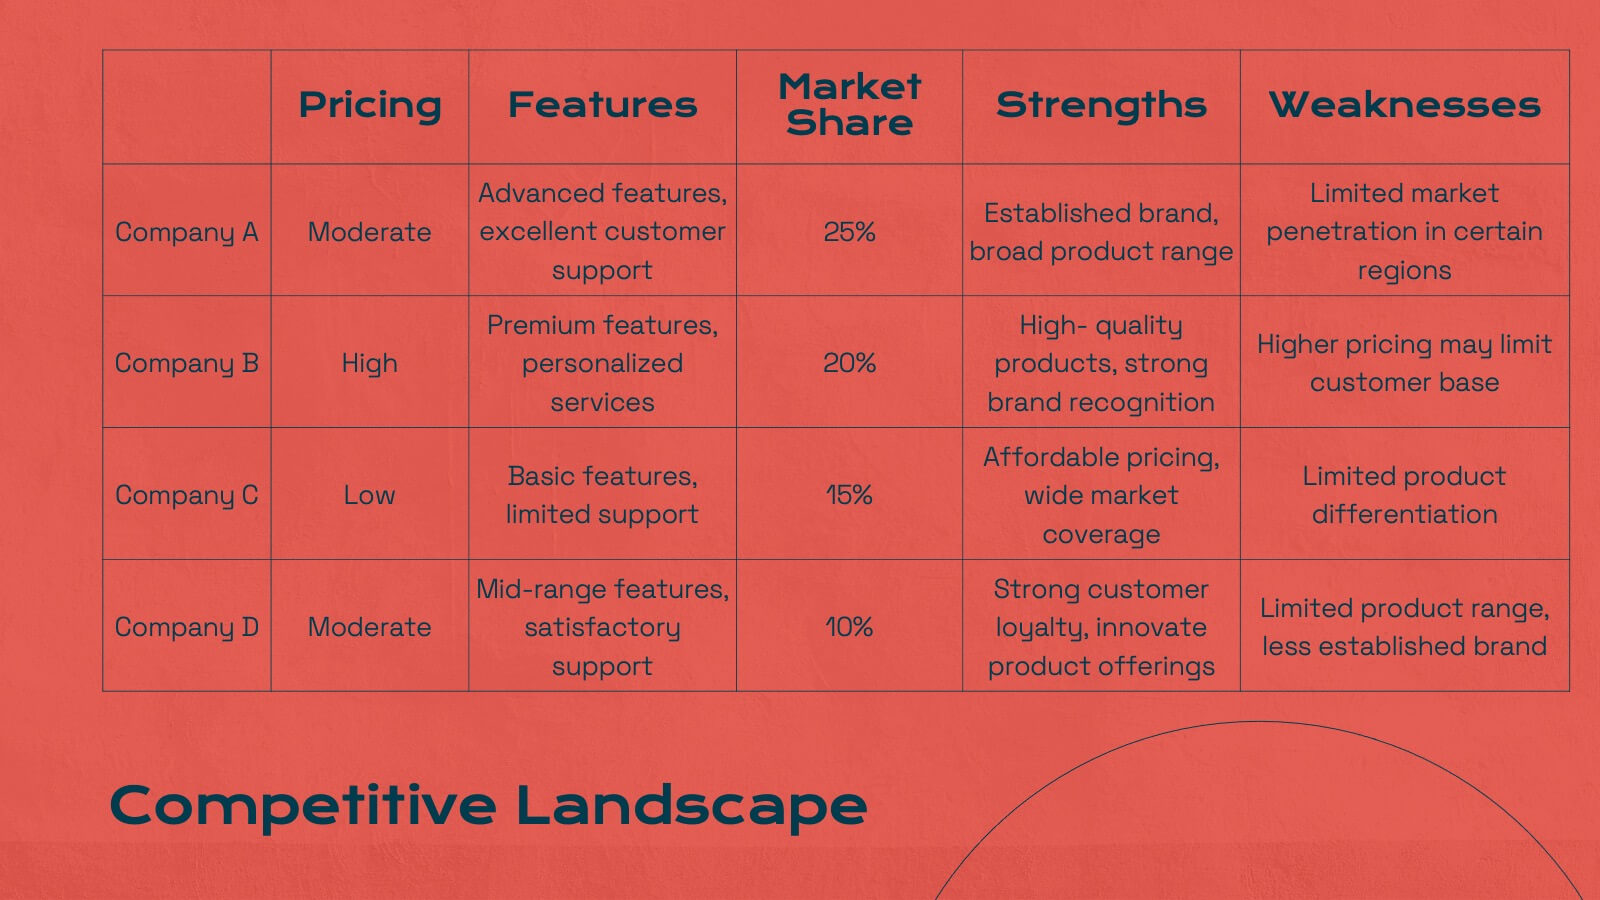
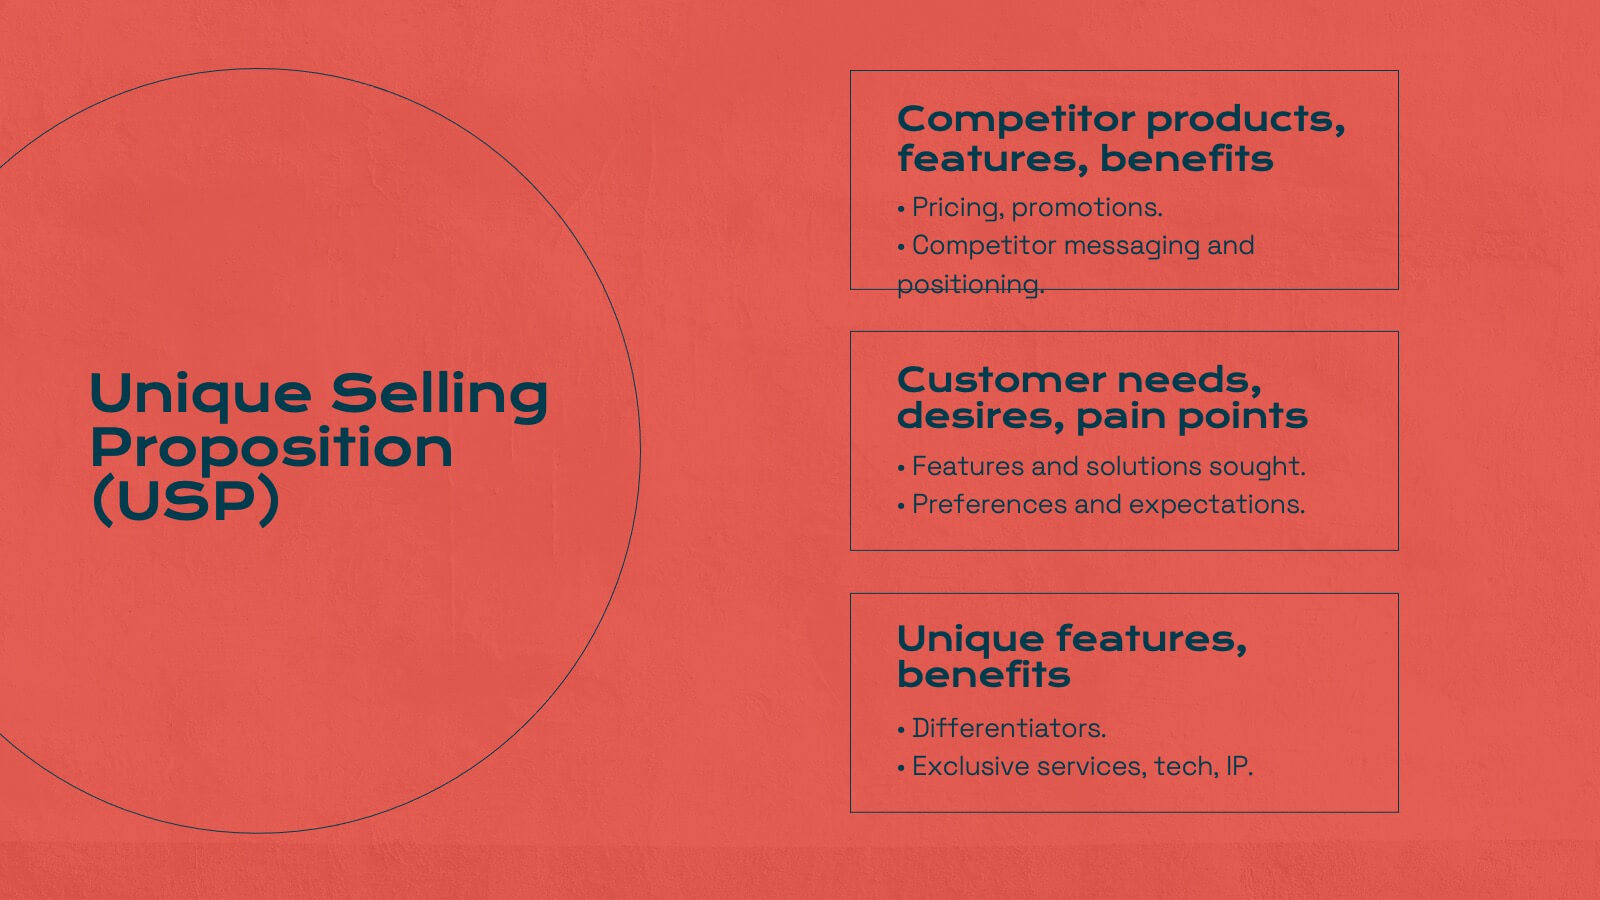
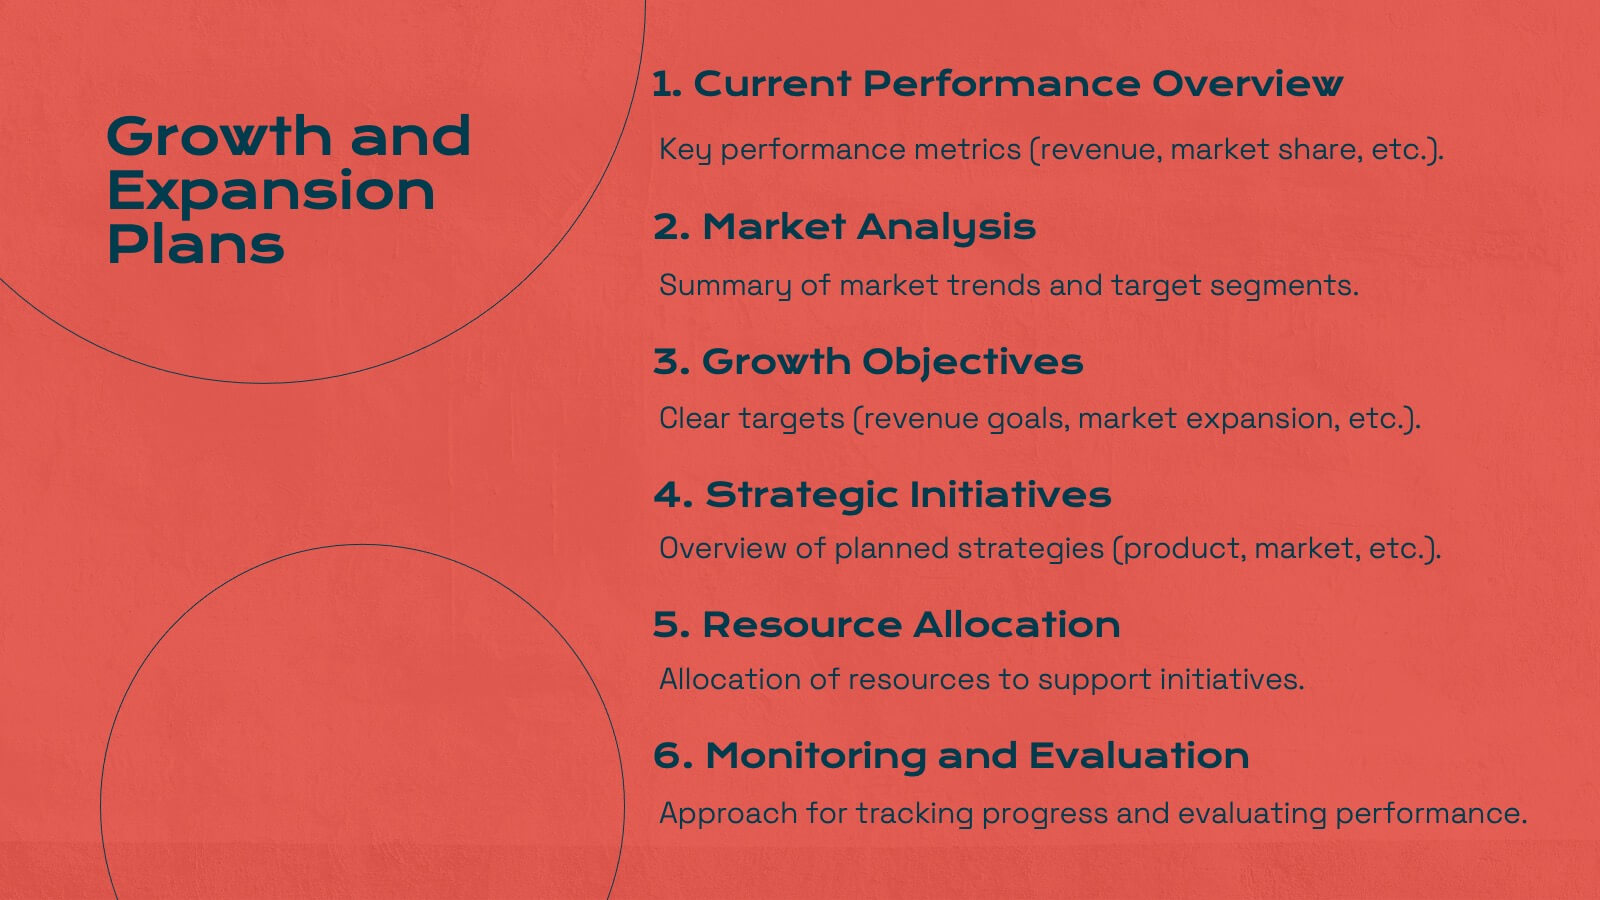
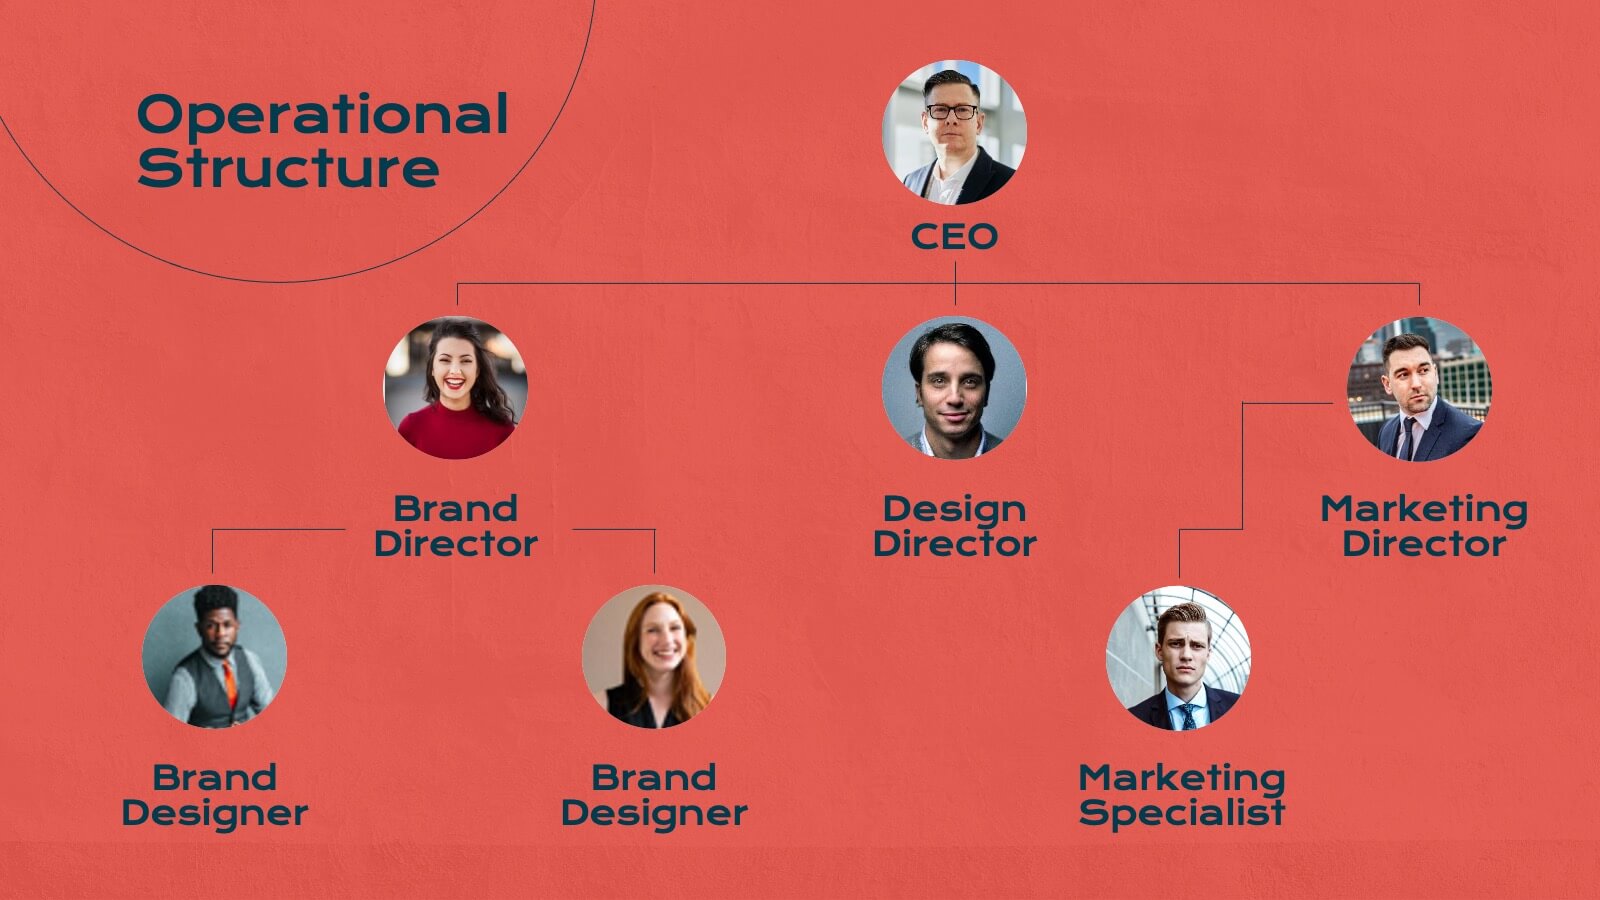
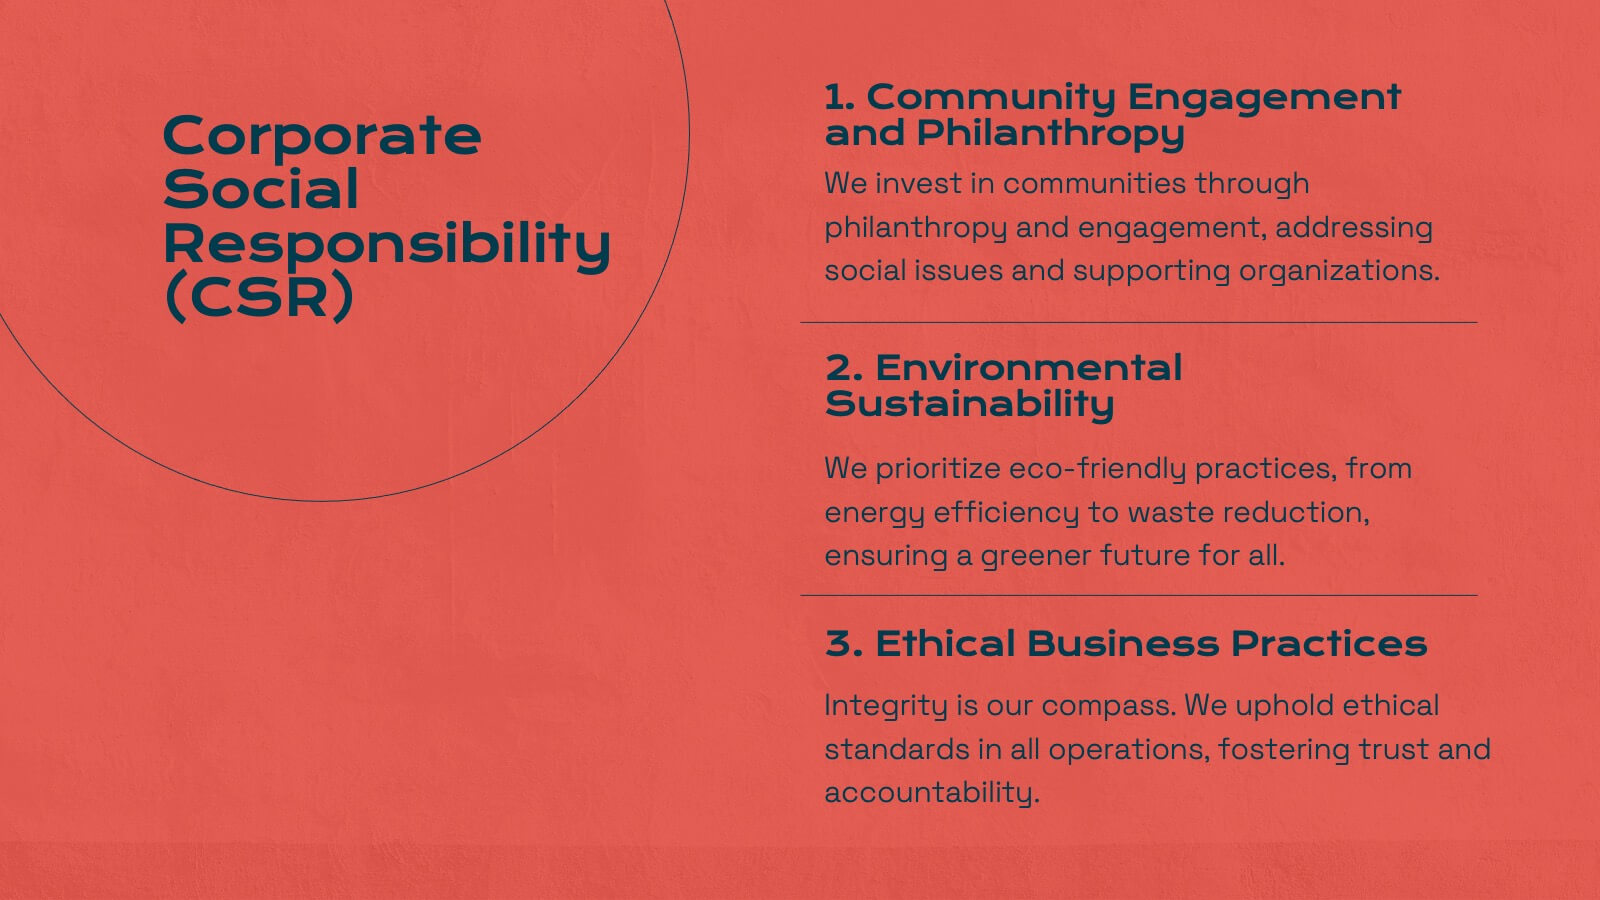
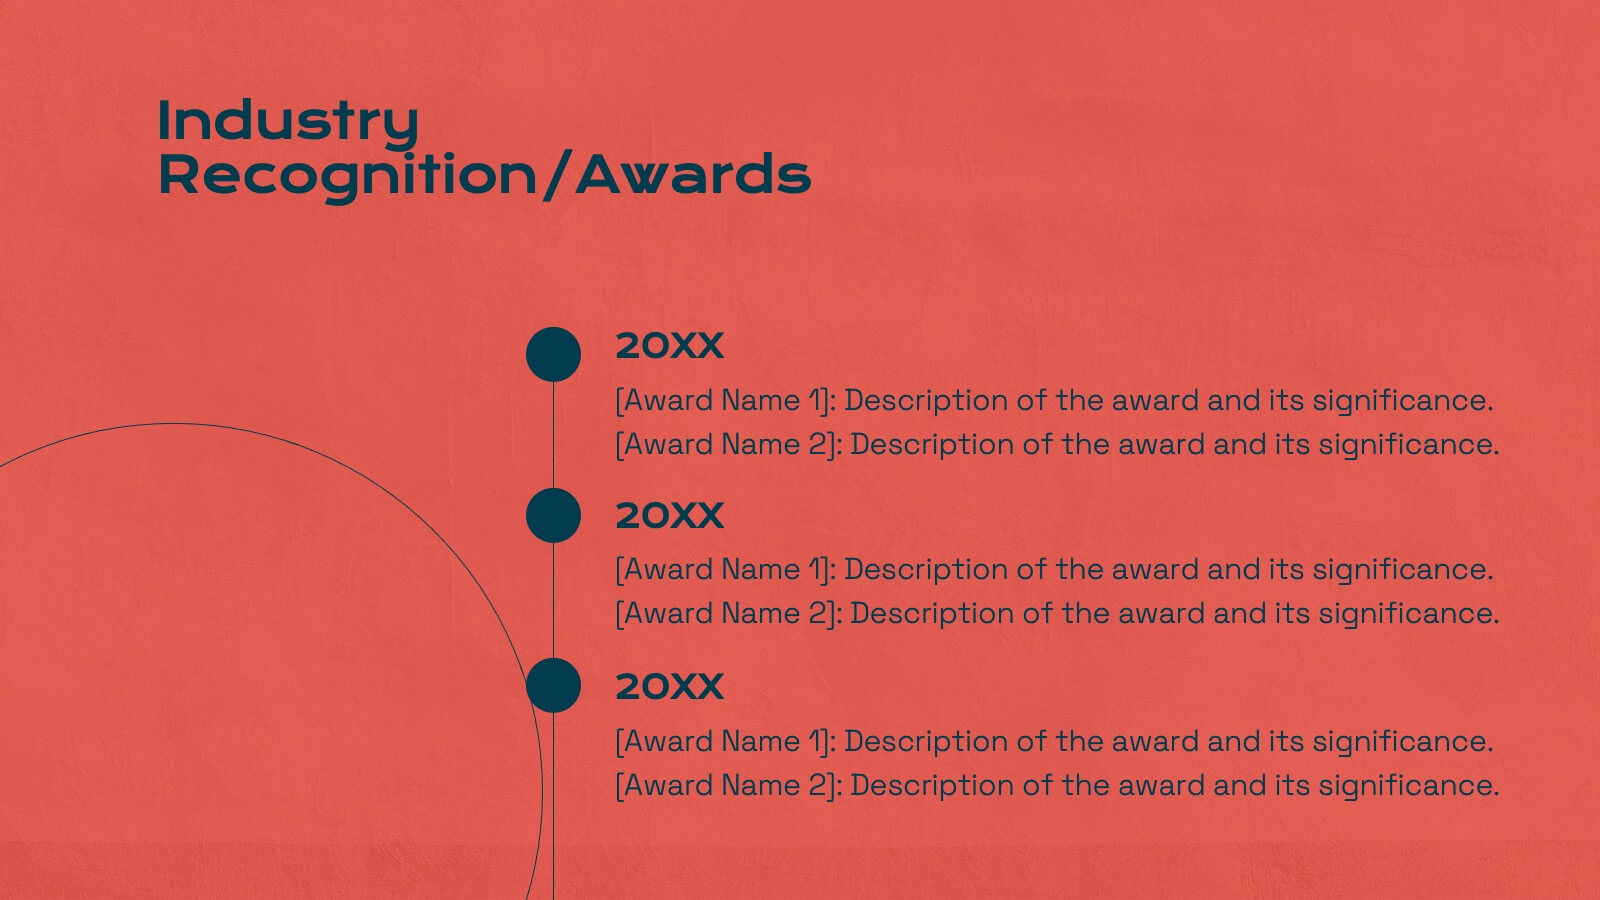
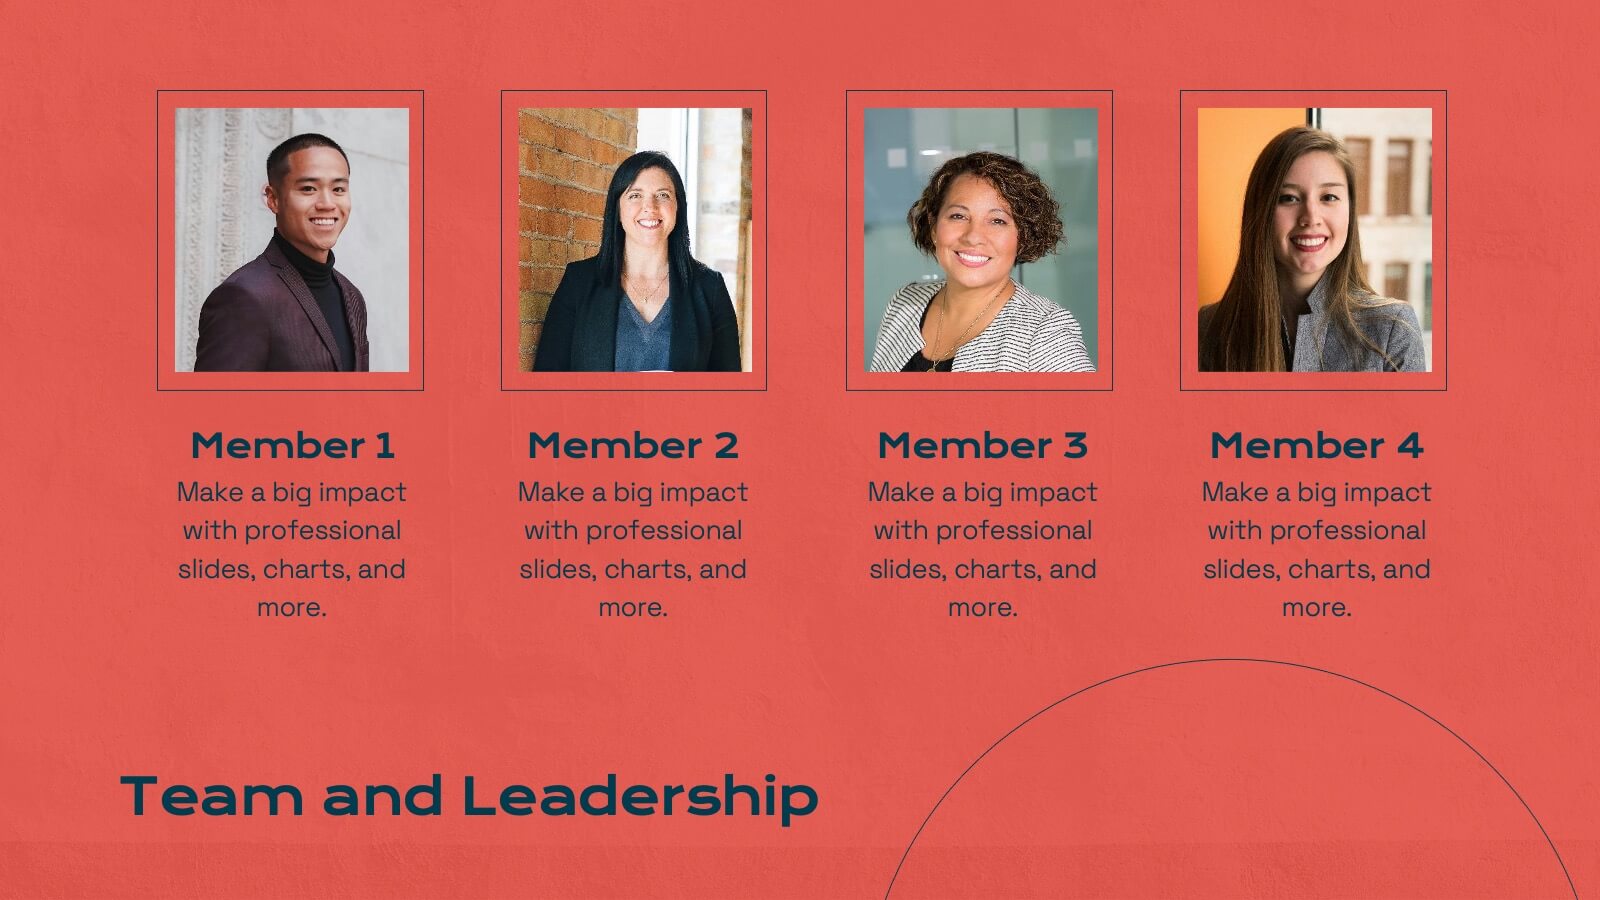
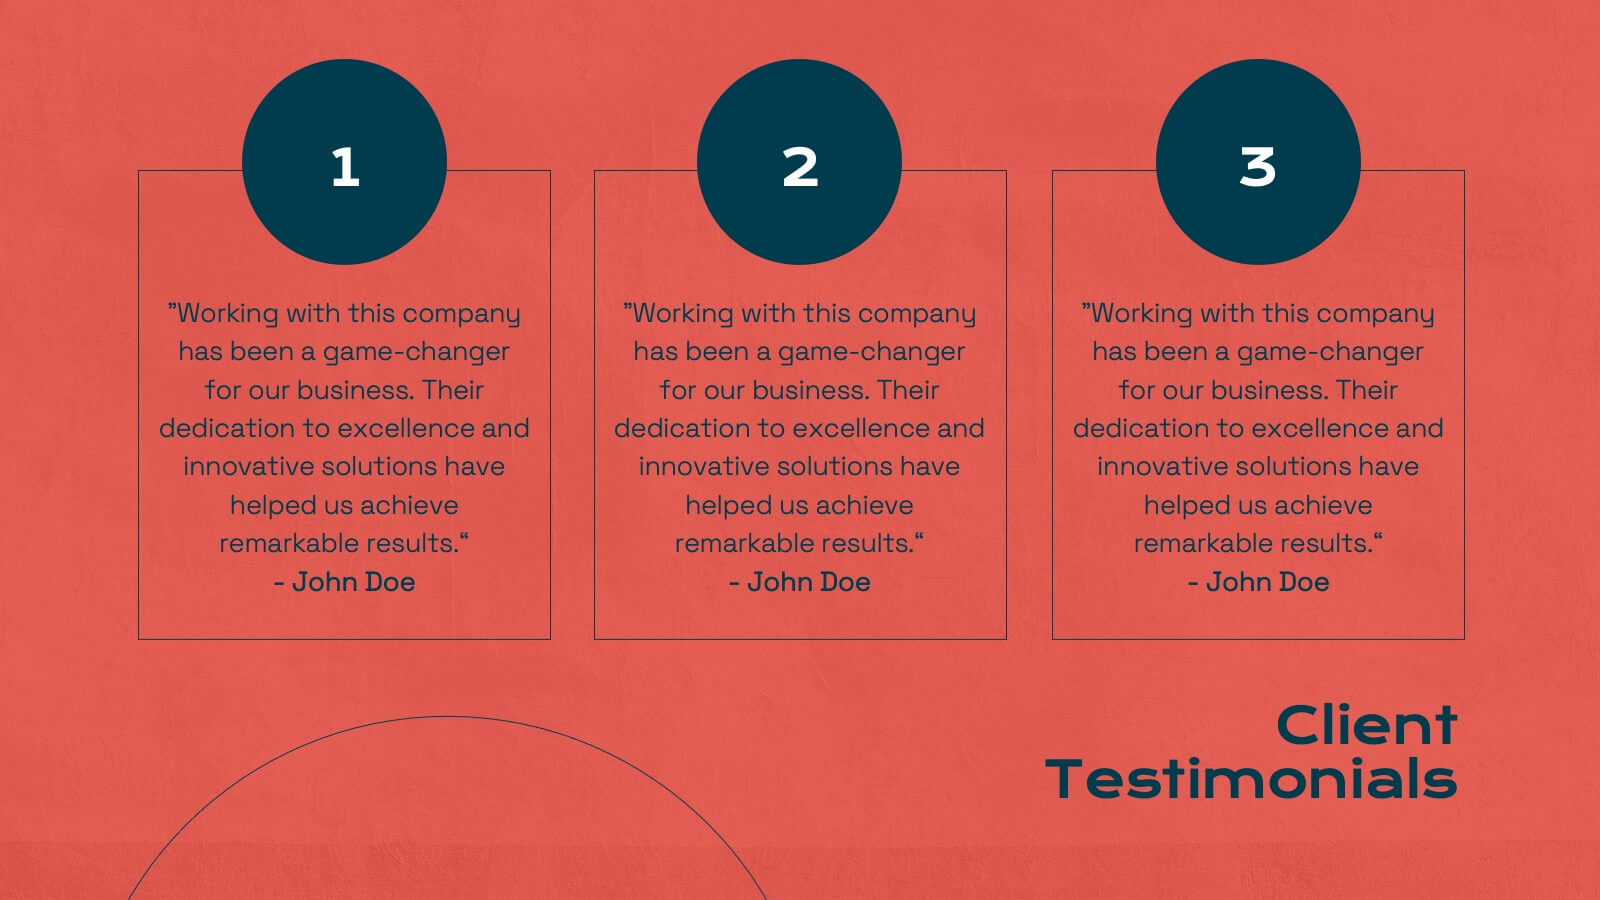
Titan Marketing Research Report Presentation
Energize your marketing research presentations with this bold, vibrant template. Perfect for detailing company history, market presence, and competitive landscapes, it features a striking red design that captures attention. Highlight key insights like target audience, financial highlights, and growth plans to engage your audience. Compatible with PowerPoint, Keynote, and Google Slides, it ensures seamless presentations on any platform.


4 slides
Corporate Role Hierarchy Structure Presentation
Visualize your company’s reporting structure with this modern corporate role hierarchy diagram. Perfect for team overviews, leadership charts, or onboarding sessions. Each role node is clearly connected for easy understanding. Fully editable in Canva, PowerPoint, or Google Slides—ideal for HR teams, managers, or organizational planning presentations.


5 slides
Rental Business Milestone Timeline Presentation
Showcase your company's growth journey with this clean Rental Business Milestone Timeline layout. Designed for tracking key achievements, it features a horizontal timeline with icons and customizable date markers. Perfect for business reviews or investor updates, it’s fully editable in PowerPoint, Keynote, and Google Slides for a professional presentation


5 slides
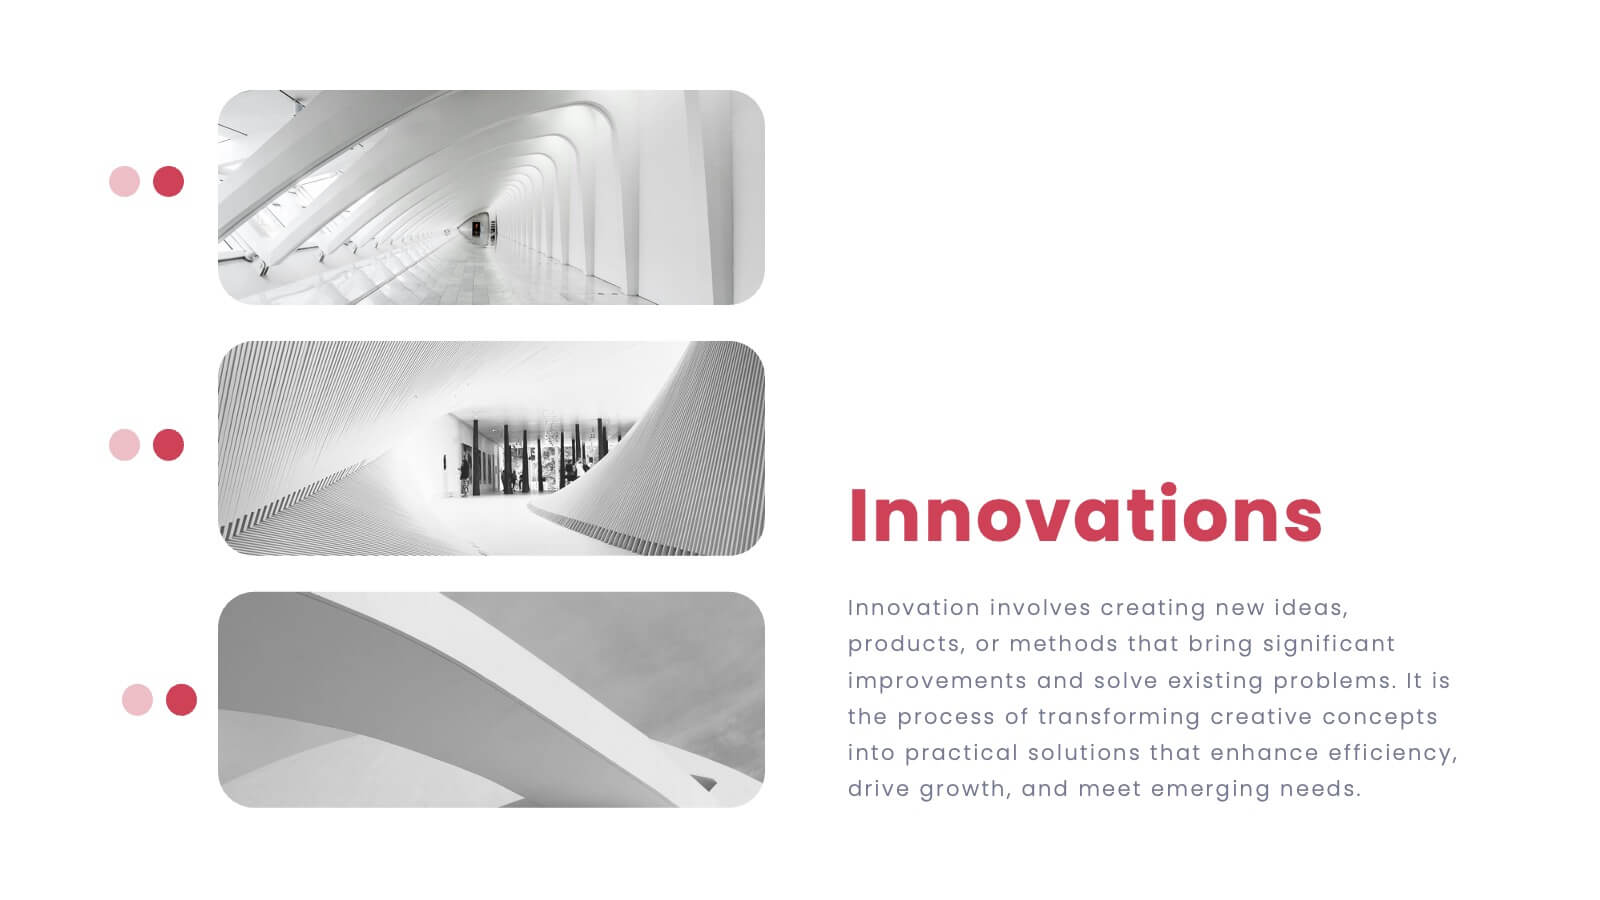
Innovation Framework Presentation
Turn bold ideas into structured success with this engaging presentation design. Perfect for mapping creative processes, innovation systems, and project development stages, it helps present ideas clearly and visually. Fully editable and easy to customize, this presentation is compatible with PowerPoint, Keynote, and Google Slides for effortless use.

22 slides
Vortex Startup Pitch Deck Presentation
Launch your ideas into action with this vibrant red pitch deck template, designed to captivate and inform potential investors. It covers everything from company overview to financials and market strategy, ensuring your vision is communicated effectively. Compatible with PowerPoint, Google Slides, and Keynote, this template is perfect for startups seeking to impress and engage.


6 slides
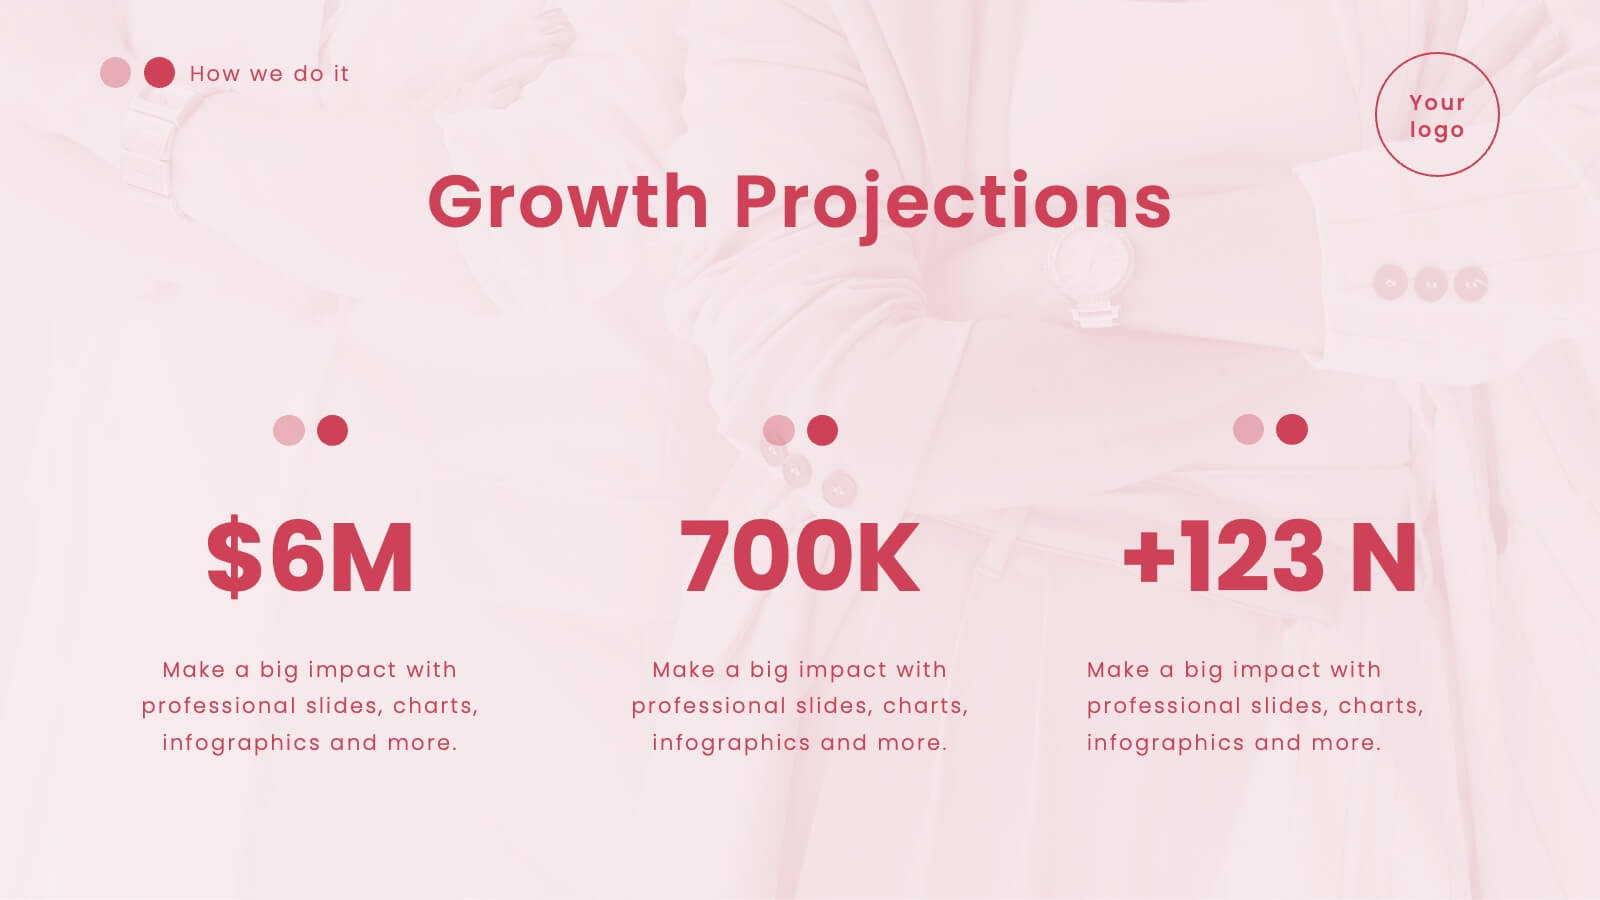
Professional Company Portfolio Presentation
Showcase Your Business Success with a Sleek Portfolio! The Professional Company Portfolio template is designed to highlight key achievements, performance metrics, and strategic insights with a modern, image-driven layout. Featuring three visually appealing sections, this template allows you to present KPIs, revenue growth, and business milestones in a compelling and structured way. Fully customizable in PowerPoint, Keynote, and Google Slides, this portfolio template is perfect for presentations, investor updates, and corporate showcases.


19 slides
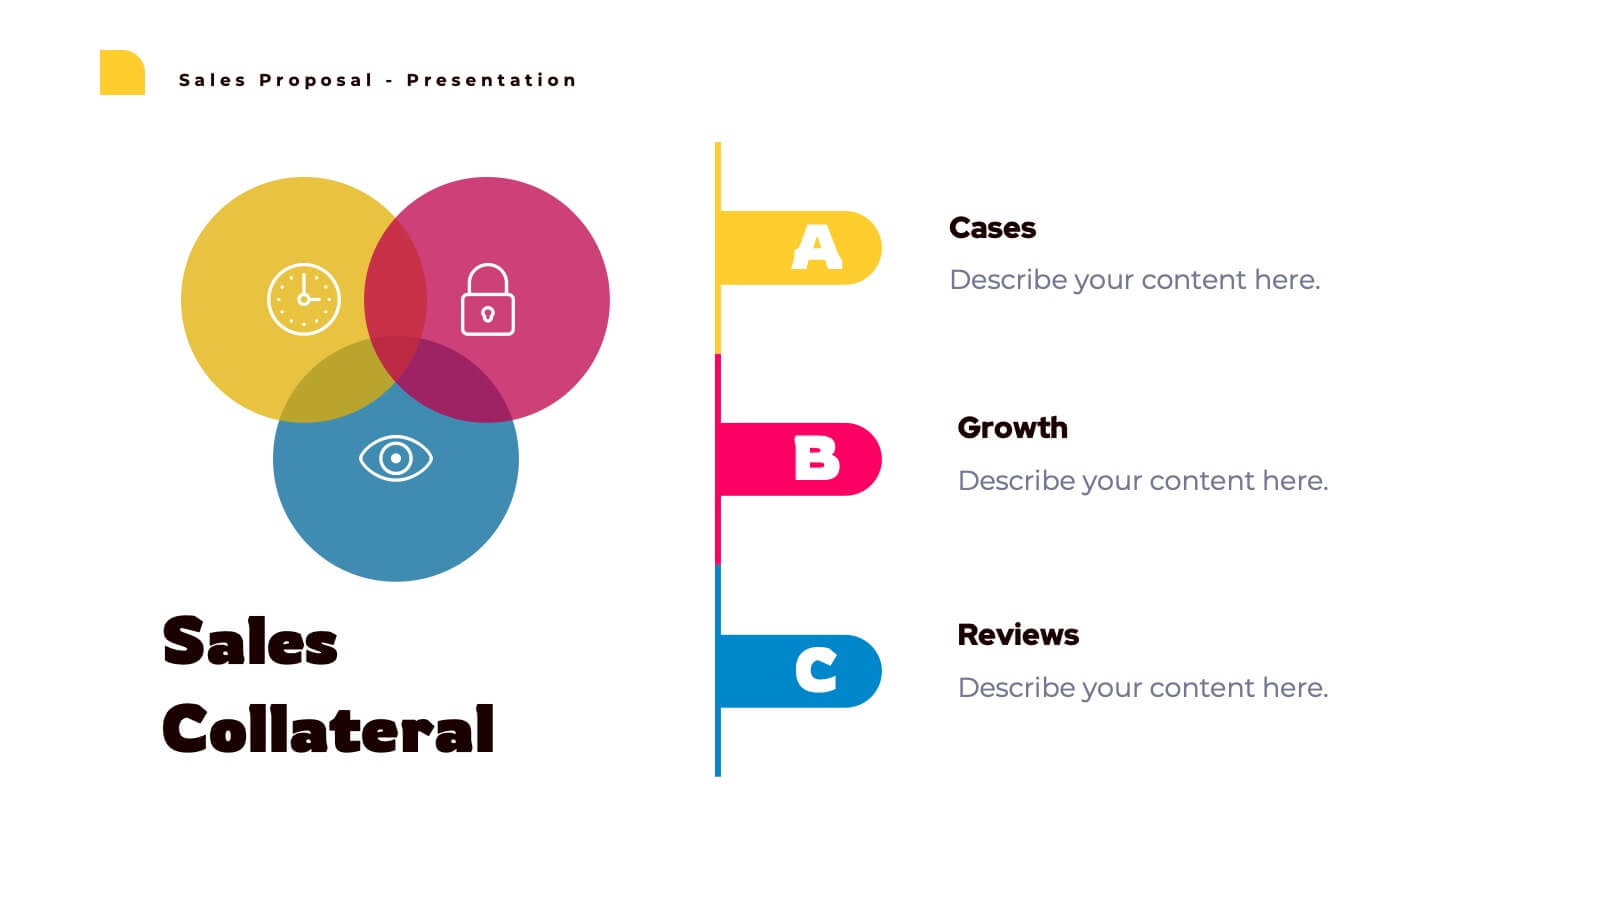
Zenith Sales Proposal Presentation
Get ready to blow your clients away with this electrifying sales proposal template! Packed with sections on project scope, bold objectives, timelines, and jaw-dropping pricing, it’s designed to make a powerful impact. The sleek, cutting-edge design ensures you’ll leave a lasting impression. Fully compatible with PowerPoint, Keynote, and Google Slides!


5 slides
Innovation in Digital Technologies Presentation
Highlight key advancements with this Innovation in Digital Technologies Presentation. Designed with four modern icon segments, this slide helps communicate your digital transformation journey clearly. Ideal for showcasing emerging tools, platforms, or strategies. Fully editable in Canva, PowerPoint, or Google Slides for seamless integration into any tech-focused presentation.


4 slides
Target Audience and Buyer Persona Analysis Presentation
Visually map out your core audience segments with this modern target diagram layout. This presentation features a concentric ring graphic to represent buyer personas and user data, alongside three editable text sections with icons for clear and structured insights. Ideal for marketing strategies, customer profiling, and campaign planning. Easily customizable in PowerPoint, Keynote, and Google Slides.


30 slides
Fusoria Brand Guidelines Proposal Presentation
Build a strong and cohesive brand identity with this sleek and professional brand guidelines proposal presentation. Covering essential topics like typography, color palettes, visual direction, and branding principles, this template helps you define and communicate your brand’s essence. Fully customizable and compatible with PowerPoint, Keynote, and Google Slides for a seamless presentation experience.


5 slides
Product Development to Decline Model Presentation
Showcase the full journey of a product from its inception to phase-out with the Product Development to Decline Model presentation. This circular diagram clearly outlines the four core stages, ideal for product managers, business analysts, and strategic planners. Each section features clean icons and editable text zones to highlight key insights and milestones. Fully customizable in PowerPoint, Keynote, and Google Slides.


5 slides
Revenue Streams & Expense Management Layout Presentation
Visualize your income and costs with the Revenue Streams & Expense Management Layout Presentation. This slide layout uses a vertical arrow chart to display four data categories, ideal for comparing sources of income and related expenditures. Great for financial reports, budgeting reviews, and strategy discussions. Compatible with Canva, PowerPoint, Google Slides, and Keynote.


10 slides
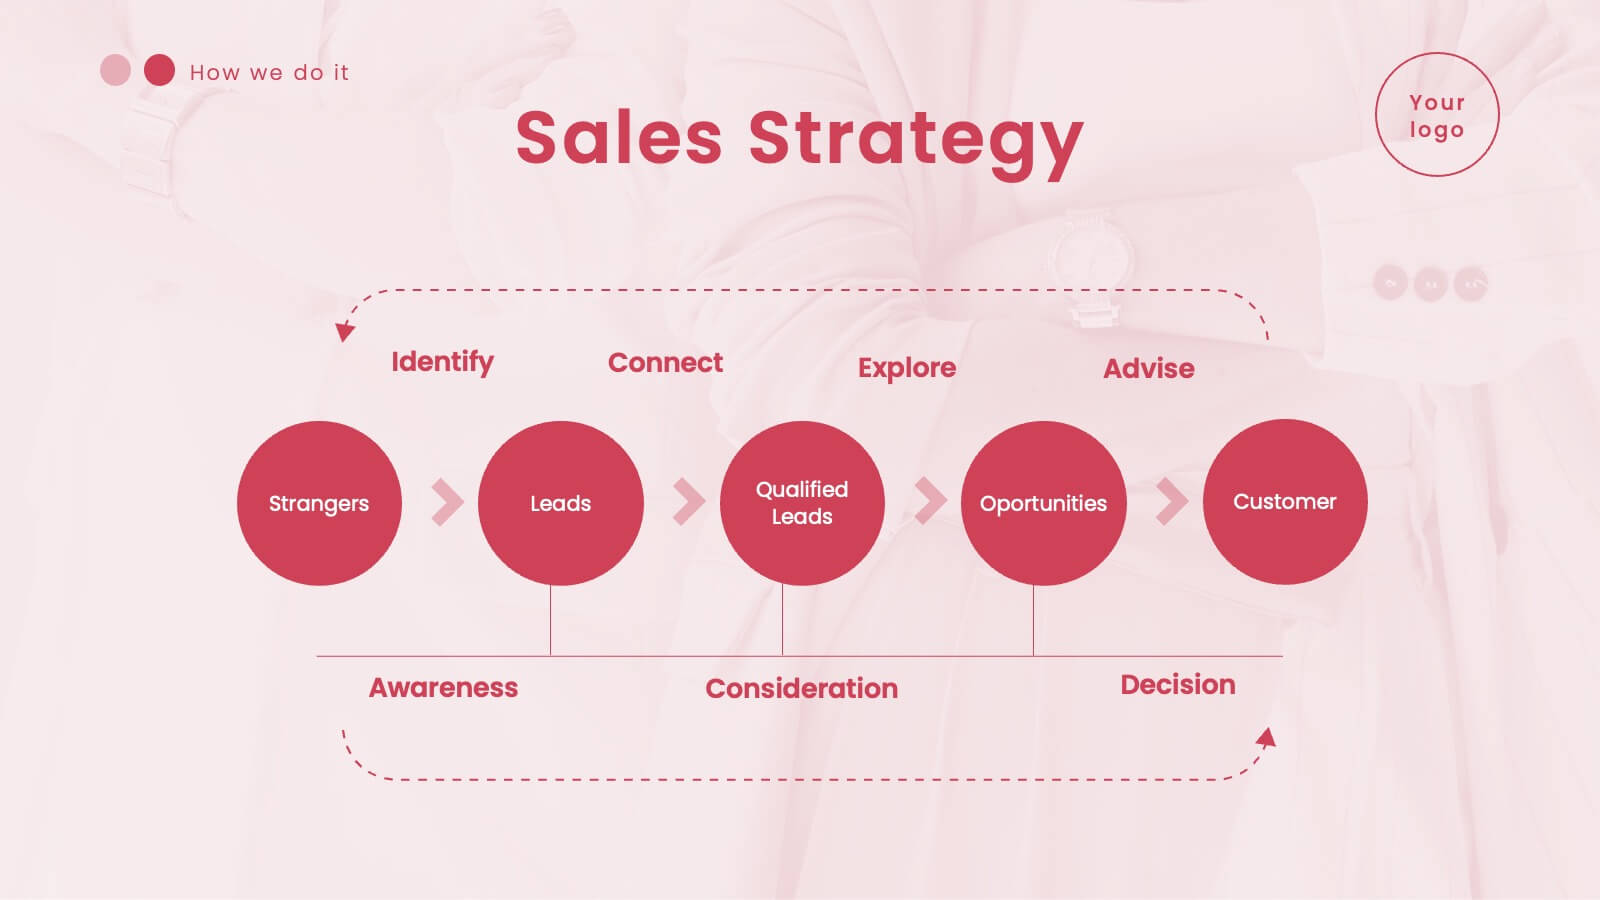
Business Growth through Target Market Analysis Presentation
Showcase how strategic insights drive expansion with this step-by-step infographic. Designed with layered growth icons and space for titles and text, this layout helps illustrate the phases of market targeting, consumer profiling, and sales development. Perfect for marketing strategies, business development roadmaps, and client presentations. Fully customizable in PowerPoint, Keynote, and Google Slides


5 slides
Role Assignment Matrix Framework Presentation
Simplify task delegation with the Role Assignment Matrix Framework Presentation. Ideal for defining roles and responsibilities in a clear, table-based layout, this matrix helps organize who does what across departments or project phases. Perfect for RACI charts or team alignment. Fully editable in PowerPoint, Google Slides, Keynote, and Canva.