


Features
- 6 Unique slides
- Fully editable and easy to edit in Microsoft Powerpoint, Keynote and Google Slides
- 16:9 widescreen layout
- Clean and professional designs
- Export to JPG, PDF or send by email


Do you have any questions?
Recommend


5 slides
Sports Industry Market Trends Presentation
Visualize key metrics in the sports sector with this dynamic Sports Industry Market Trends slide. Designed with a timeline layout and medal-inspired percentage rings, it allows you to highlight four core insights or data points. Ideal for industry overviews, competitor benchmarking, or annual sports business reports. Fully editable in PowerPoint, Keynote, and Google Slides.


8 slides
Value Creation Strategy
Present your strategic pillars with clarity using this linear, milestone-style layout. Ideal for business consultants, growth strategists, and product teams aiming to showcase value drivers, innovation stages, or competitive differentiators. Fully editable in PowerPoint, Keynote, and Google Slides—customize icons, colors, and text for a branded, professional finish.


5 slides
Startup Growth Roadmap and Milestones Presentation
Present your startup journey clearly with the Startup Growth Roadmap and Milestones Presentation. This timeline-style layout breaks down your key phases, from initial concept to market traction. Ideal for investor decks, pitch presentations, or internal planning. Fully editable in PowerPoint, Canva, and Google Slides for seamless customization.


10 slides
Watercolor Ideas Infographic Presentation
A watercolor infographic is a type of visual graphic that uses watercolor illustrations and designs to convey information. The water colors add a touch of personality and creativity to the template design and can help capture the viewer's attention. Use this infographic to present data, explain a process, or showcase a product or service. This watercolor infographic is compatible with Powerpoint, Keynote and Google Slides. This unique and visually appealing template can be used for any kind of business or academic project. Just download, add your content and make a creative presentation!


6 slides
Closing Summary and Key Takeaways Presentation
Wrap up your presentation with clarity using the Closing Summary and Key Takeaways Presentation. This slide features a semi-circular segmented layout, ideal for highlighting 3–5 final points, action steps, or reflections. Clean, modern, and easy to customize in PowerPoint, Keynote, Google Slides, or Canva—perfect for impactful conclusions.


5 slides
Water Crisis Infographics
Navigate the pressing issues of the global water crisis with our water crisis infographics template. Rendered in profound shades of blue, this creative and vertical design emulates the urgency surrounding water-related concerns. It's an essential asset for environmental activists, and educational institutions, facilitating the dissemination of crucial data and impactful stories. Compatible with Powerpoint, Keynote, and Google Slides. This collection integrates striking graphics, thematic icons, and flexible image placeholders, designed to convey complex information on water scarcity, conservation strategies, and global impacts in an accessible, visually engaging manner.


12 slides
Risk Management and Security Compliance Presentation
Enhance your organizational resilience with the 'Risk Management and Security Compliance' presentation template. This intuitive design helps you communicate complex compliance standards and risk mitigation strategies effectively. Ideal for training sessions, board meetings, and compliance audits, ensuring your team stays informed and proactive in managing risks.


21 slides
Kyanite Small Business Pitch Deck Presentation
Make your business pitch stand out with this vibrant and engaging presentation! Featuring sections like project overviews, team updates, performance metrics, and collaboration opportunities, it helps convey your ideas with clarity and impact. Whether for internal reviews or investor pitches, this template works seamlessly with PowerPoint, Keynote, and Google Slides.


6 slides
Modern Science Report Presentation
Bring your findings to life with a clean, dynamic layout designed to make scientific insights easy to follow. This presentation highlights key data, research points, and lab observations in a structured, visually engaging format that supports clarity and accuracy. Fully compatible with PowerPoint, Keynote, and Google Slides.


6 slides
Medical Technologies Infographics
Explore the forefront of medical technology with this informative and sleek infographic template, tailored for professionals and students in the medical field. This template effectively presents key advancements and projects in medical technology, using a modern and clear design that is easy to follow. The slides are organized to detail different aspects of technology in healthcare, such as innovation in patient care, technological integration into existing systems, and future trends in the industry. Each section uses vibrant graphics and concise text to highlight important data and statistics, ensuring the information is both accessible and engaging. The color scheme is professionally chosen to represent trust and clarity, utilizing shades of blue and red to differentiate topics effectively. This not only enhances readability but also aligns with the themes of healthcare and technology. This template is a perfect tool for presenting at conferences, in educational settings, or during professional meetings where understanding the impact of technology on healthcare is crucial. It helps to convey complex information in a structured and visually appealing manner, making it an invaluable resource for anyone involved in the health technology sector.


4 slides
Soft Watercolor Background Slides Presentation
Add a soft, elegant touch to your presentation with this Soft Watercolor Background Slides Presentation. Designed with gentle gray brushstroke textures and clean, modern layout, it's perfect for conveying ideas clearly while maintaining visual appeal. Ideal for creative, wellness, or professional topics. Fully editable in PowerPoint, Google Slides, and Canva.


4 slides
Sustainability in Water Conservation Presentation
Highlight your eco-initiatives with this visually engaging Sustainability in Water Conservation presentation. Featuring a puzzle-style water drop diagram, this slide helps communicate four core strategies or ideas clearly and effectively. The clean layout and modern icons ensure your message is both professional and impactful, making it ideal for presentations on sustainability goals, environmental education, or water-saving initiatives. Fully editable and compatible with PowerPoint, Keynote, and Google Slides.


5 slides
Progress and Performance Yearly Review Presentation
Highlight key milestones along your business journey with this winding roadmap-style slide. Designed for annual reviews, it features five flag markers for progress tracking, goals, or achievements. Ideal for reports or team updates. Fully customizable in PowerPoint, Keynote, and Google Slides for seamless adaptation to your yearly metrics.


21 slides
Elixara Startup Funding Proposal Presentation
Give your startup the pitch it deserves with this elegantly designed funding proposal presentation. Covering key areas like business model, competitive analysis, financial overview, and growth strategies, this template helps you present your vision with confidence. Fully customizable and compatible with PowerPoint, Keynote, and Google Slides for a seamless investor-ready experience.


5 slides
Meet the Team Layout Presentation
Meet the team with a layout that feels fresh, upbeat, and effortlessly clear. This presentation helps you introduce key members, highlight roles, and showcase expertise in a clean, engaging format perfect for leadership updates or project kickoffs. Fully editable and compatible with PowerPoint, Keynote, and Google Slides.


23 slides
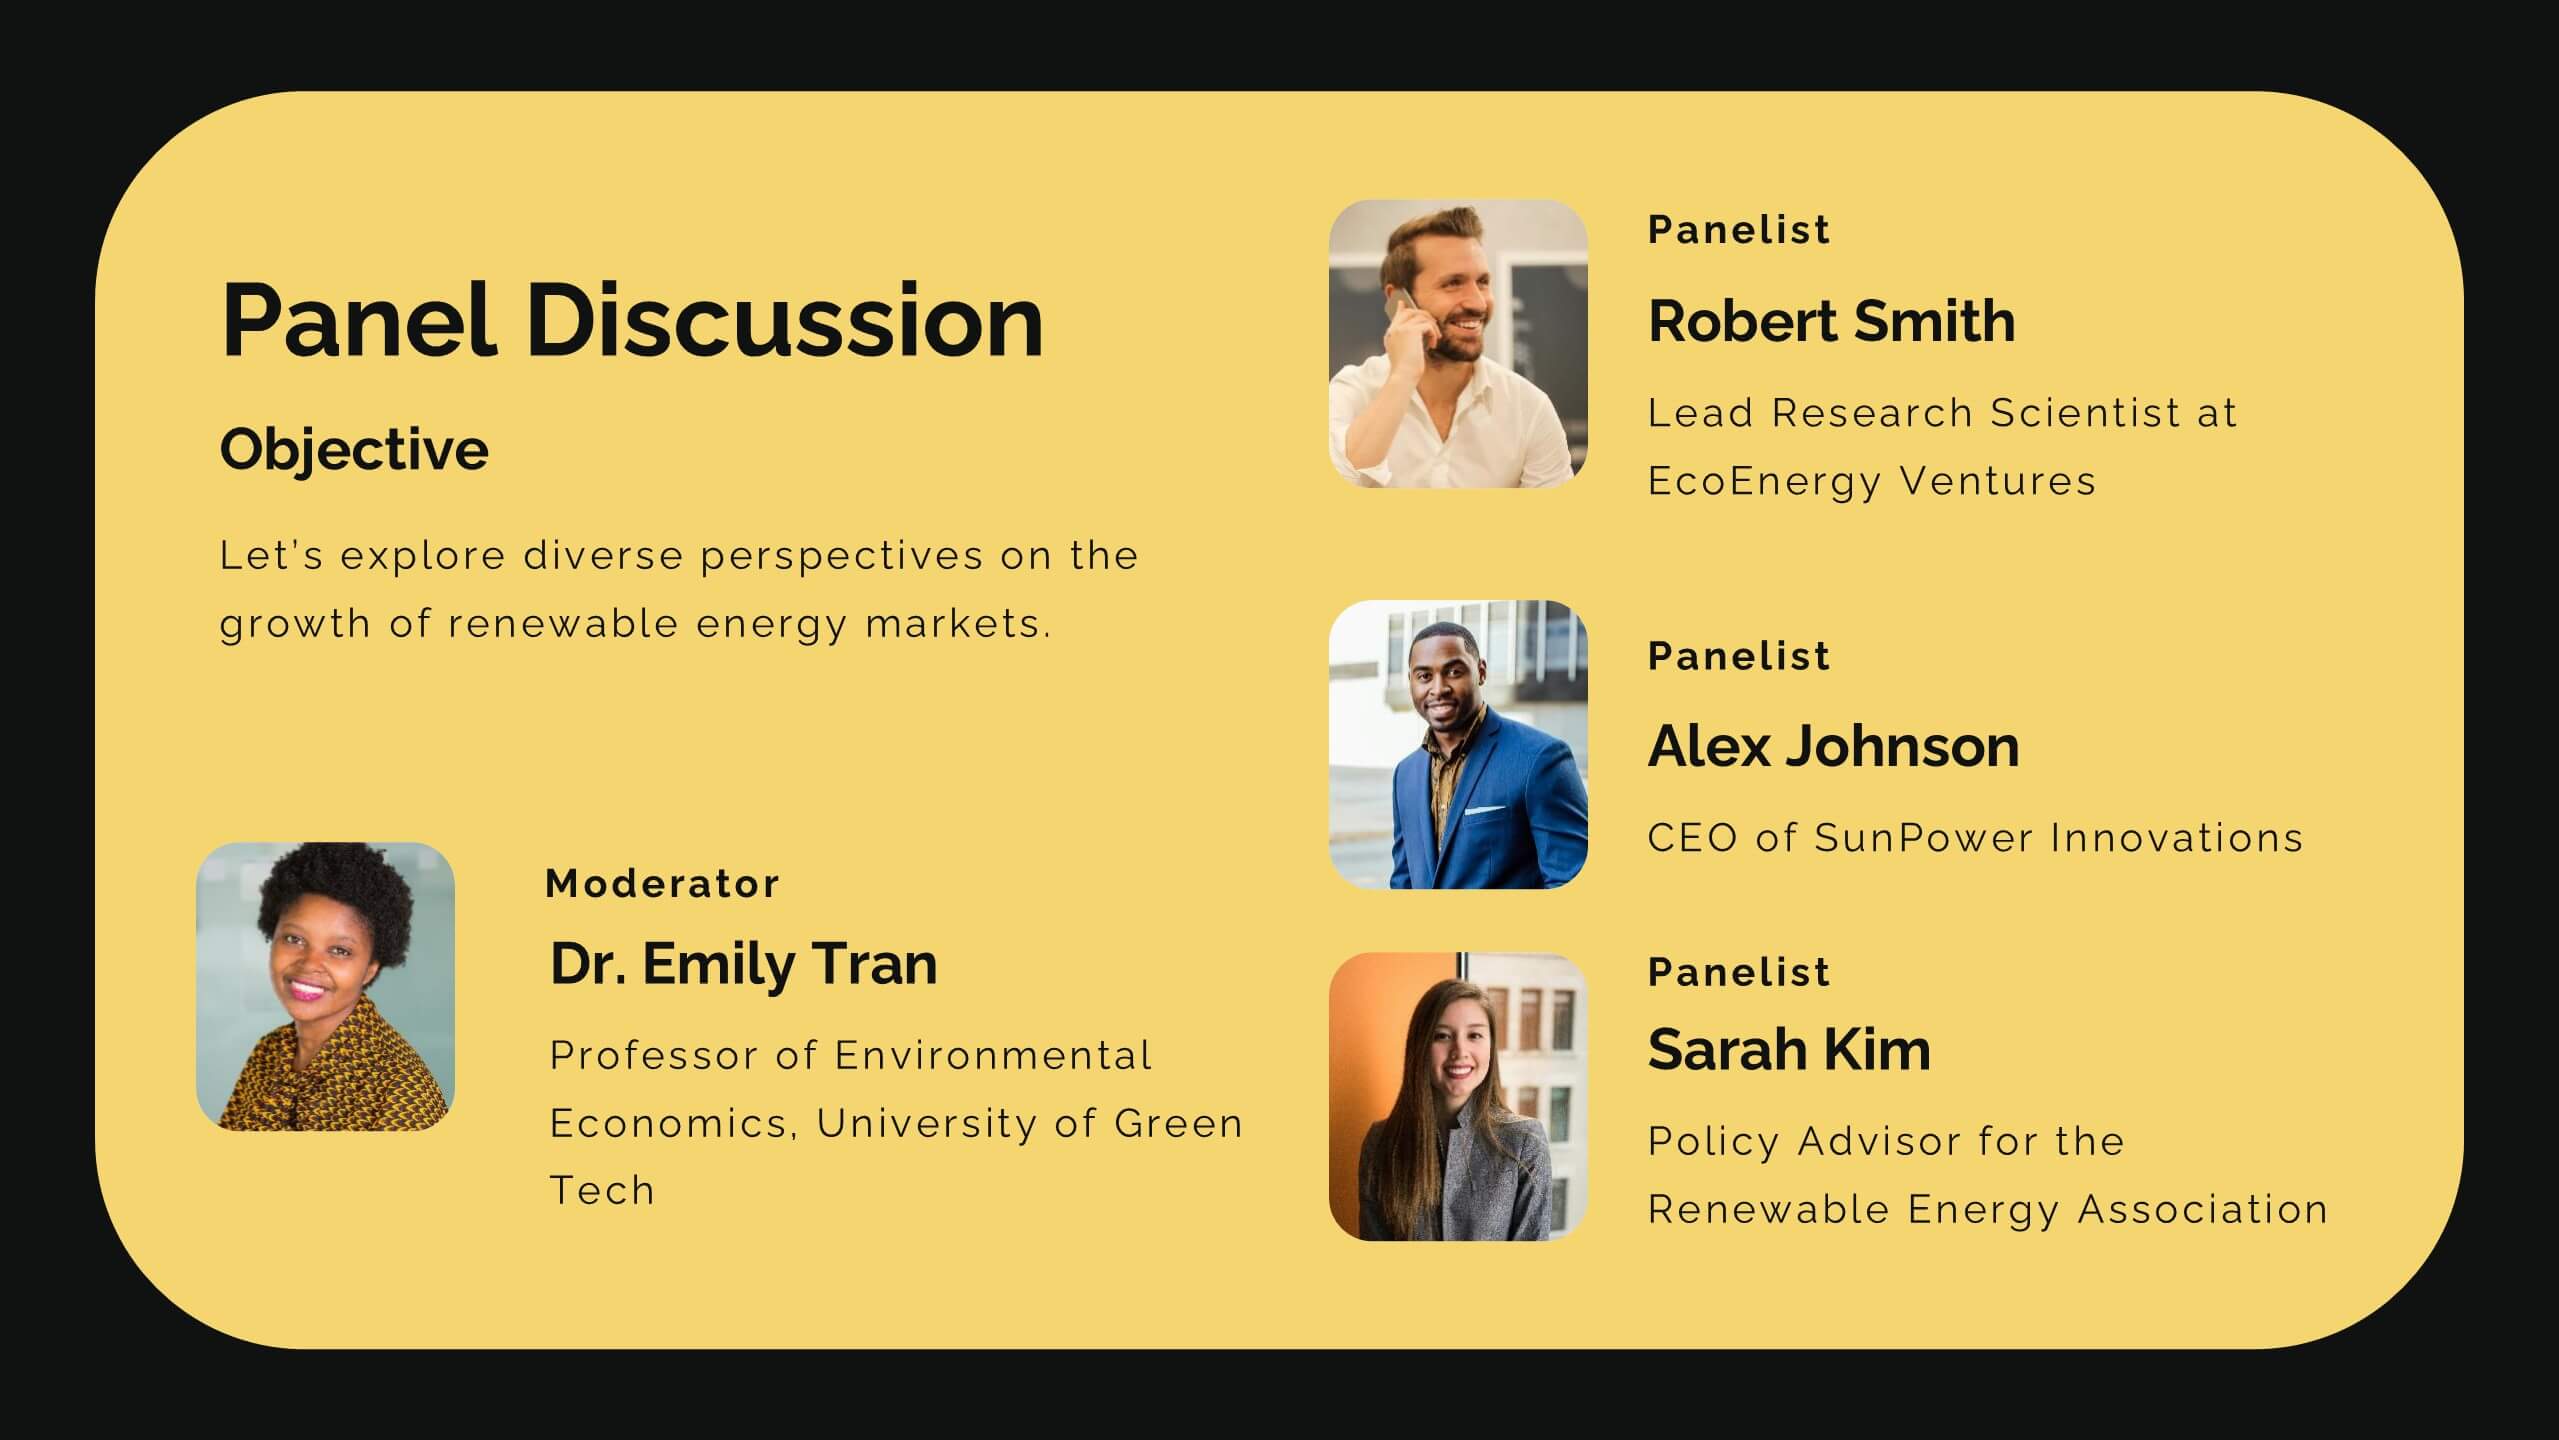
Diamond Business Development Proposal Presentation
Unlock the potential of your business proposals with this bold and engaging presentation template! Perfect for business development pitches, conferences, and workshops, it includes sections for speaker introductions, panel discussions, and session breakdowns. With its clean and professional design, this template ensures clarity and impact. Fully customizable and compatible with PowerPoint, Keynote, and Google Slides.


5 slides
Experience-Based Smile Scorecard Presentation
Measure sentiment with ease using this Experience-Based Smile Scorecard slide. Designed with a vertical battery-style layout, each tier represents a distinct emotional level—from dissatisfied to happy. Ideal for visualizing user experiences, customer feedback, or service quality. Fully editable and compatible with PowerPoint, Canva, and Google Slides.