


Features
- 5 Unique slides
- Fully editable and easy to edit in Microsoft Powerpoint, Keynote and Google Slides
- 16:9 widescreen layout
- Clean and professional designs
- Export to JPG, PDF or send by email


Do you have any questions?
Recommend


5 slides
Tiered Strategy Framework Pyramid Presentation
Break down your plan into clear, actionable steps with this Tiered Strategy Framework Pyramid presentation. Each arrow-shaped tier helps visualize hierarchical strategies, workflows, or growth levels. Use this layout to communicate priorities, initiatives, or milestones in a sleek and modern format. Fully editable in Canva, PowerPoint, or Google Slides.


6 slides
Strategic Business Objective Mapping Presentation
Clearly define your strategic focus with this Strategic Business Objective Mapping slide. Designed to display six core objectives around a central theme, it’s ideal for visualizing business goals, departmental priorities, or key initiatives. Fully customizable in PowerPoint, Canva, and Google Slides for seamless team collaboration.


8 slides
Typography Alphabet Grid Concept
Showcase your message with bold clarity using the Typography Alphabet Grid Concept Presentation. Featuring a striking letterform at the center and four customizable sections for key points, this layout is perfect for creative overviews, branding, or idea segmentation. Fully editable in PowerPoint, Keynote, and Google Slides.


6 slides
IT Operations Workflow Presentation
Visualize your IT processes with a sleek, structured flow that highlights every operational step from start to finish. Ideal for presenting systems management, network operations, or support frameworks, this presentation brings clarity to technical workflows. Fully compatible with PowerPoint, Keynote, and Google Slides for easy customization and seamless presentation delivery.


6 slides
Four Pillar of Success Presentation
Build a strong foundation for your ideas with this elegant and structured infographic layout. Perfect for presenting key principles, business strategies, or organizational goals, it balances clarity and design beautifully. Fully customizable and compatible with PowerPoint, Keynote, and Google Slides for seamless editing and professional presentations.


7 slides
Personal Roadmap Infographic
A personal roadmap infographic is a visual representation of an individual's goals, plans, achievements, and milestones over a specific period. Embark on a transformative journey through your life with our personal roadmap infographic template. This is a grand adventure, and this visually engaging template is your map to navigate it with purpose and direction. This template is a graphical and often chronological display that helps an individual outline and track their personal development, progress, and objectives. This infographic is fully customizable and compatible with Powerpoint, Keynote, and Google Slides.


5 slides
5G Use Cases and Industry Applications Presentation
Unlock the possibilities of next-generation connectivity with a clear, visual explainer designed to showcase how different industries benefit from faster, smarter networks. This presentation breaks down key applications, technology shifts, and real-world 5G impact in an easy, engaging format. Fully compatible with PowerPoint, Keynote, and Google Slides.


5 slides
Spider Chart for Mind Organization Presentation
Clarify complex ideas with the Spider Chart for Mind Organization Presentation. This layout visually maps key topics and subtopics, helping you identify patterns, priorities, or areas of focus. Ideal for planning, decision-making, and brainstorming sessions. Fully customizable in Canva, PowerPoint, Google Slides, and Keynote for seamless use.


4 slides
Gap Identification for Strategic Planning Presentation
Bridge the gap between where you are and where you want to be with this clean and practical layout. Ideal for outlining current challenges, action plans, and future goals, this presentation template helps visualize strategic progress with clarity. Fully compatible with PowerPoint, Keynote, and Google Slides.


7 slides
Customer Profile Marketing Infographic
Illuminate your marketing strategy with our finely-tuned customer profile marketing infographic. Bathed in the clarity of white, the trust of blue, the optimism of yellow, and the zest of orange, our template provides a vibrant palette to showcase diverse customer personas. Detailed with insightful infographics, expressive icons, and adaptable image placeholders, it deciphers intricate customer data into an actionable marketing narrative. Exquisitely designed for Powerpoint, Keynote, or Google Slides. A must-have tool for marketers, sales strategists, and businesses looking to tailor their approach to different customer segments. Engage effectively; let every slide refine your audience understanding.


6 slides
Ecommerce KPI Dashboards Infographic
Elevate your eCommerce reporting with our comprehensive KPI Dashboard Infographics. Tailored for seamless integration with PowerPoint, Google Slides, and Keynote, this template offers a clear and colorful representation of key performance indicators critical to online business success. From tracking sales growth to monitoring customer engagement metrics, our infographics provide an intuitive layout to display data-driven insights that drive decision-making. This template transforms complex data sets into straightforward visuals, making it easier to communicate progress with your team. Use this template to keep a pulse on your eCommerce performance and narrate the story behind the numbers.


7 slides
South America Population Infographic Presentation
A South America map infographic is a visual representation of the continent of South America, highlighting its geography, population, culture, history, and other relevant information. Use this template as a graphic representation of South America that combines text, data, and images in an informative way. This infographic can be designed in different styles and formats, including political maps, physical maps, topographic maps, population density maps, and climate maps. You can also include information about major cities, landmarks, natural resources, and cultural traditions.


4 slides
Green Initiatives & Climate Strategy Presentation
Highlight your sustainability roadmap with the Green Initiatives & Climate Strategy Presentation. Designed with a quadrant tree layout, this slide communicates four key environmental focus areas. Ideal for eco-friendly proposals, CSR updates, or climate reports. Fully customizable in PowerPoint, Keynote, and Google Slides—perfect for green strategies, goals, or impact summaries.


6 slides
Digital Marketing Consultancy Infographics
Our Digital Marketing Consultancy infographic is an essential visual tool for Powerpoint, Keynote, and Google Slides presentations, tailor-made for digital marketing consultants, strategists, and educators. This infographic is designed to visually articulate the impact and results of digital marketing strategies and campaigns. The Digital Marketing Consultancy infographic presents key marketing metrics in an easily digestible format, from social media engagement rates to website traffic and conversion statistics. It's perfect for showcasing the success of digital marketing efforts and for explaining the return on investment (ROI) to stakeholders. The visual design is crafted to be both informative and attention-grabbing, ensuring your audience fully grasps the significance of the data presented. By using this infographic in your presentations, you can effectively communicate complex digital marketing concepts and analytics to your audience. Whether you’re reporting to clients, training a team, or teaching students, this infographic will enhance your ability to convey essential marketing insights in a clear and engaging manner. Incorporate it into your presentation materials to highlight the benefits and effectiveness of strategic digital marketing initiatives.


21 slides
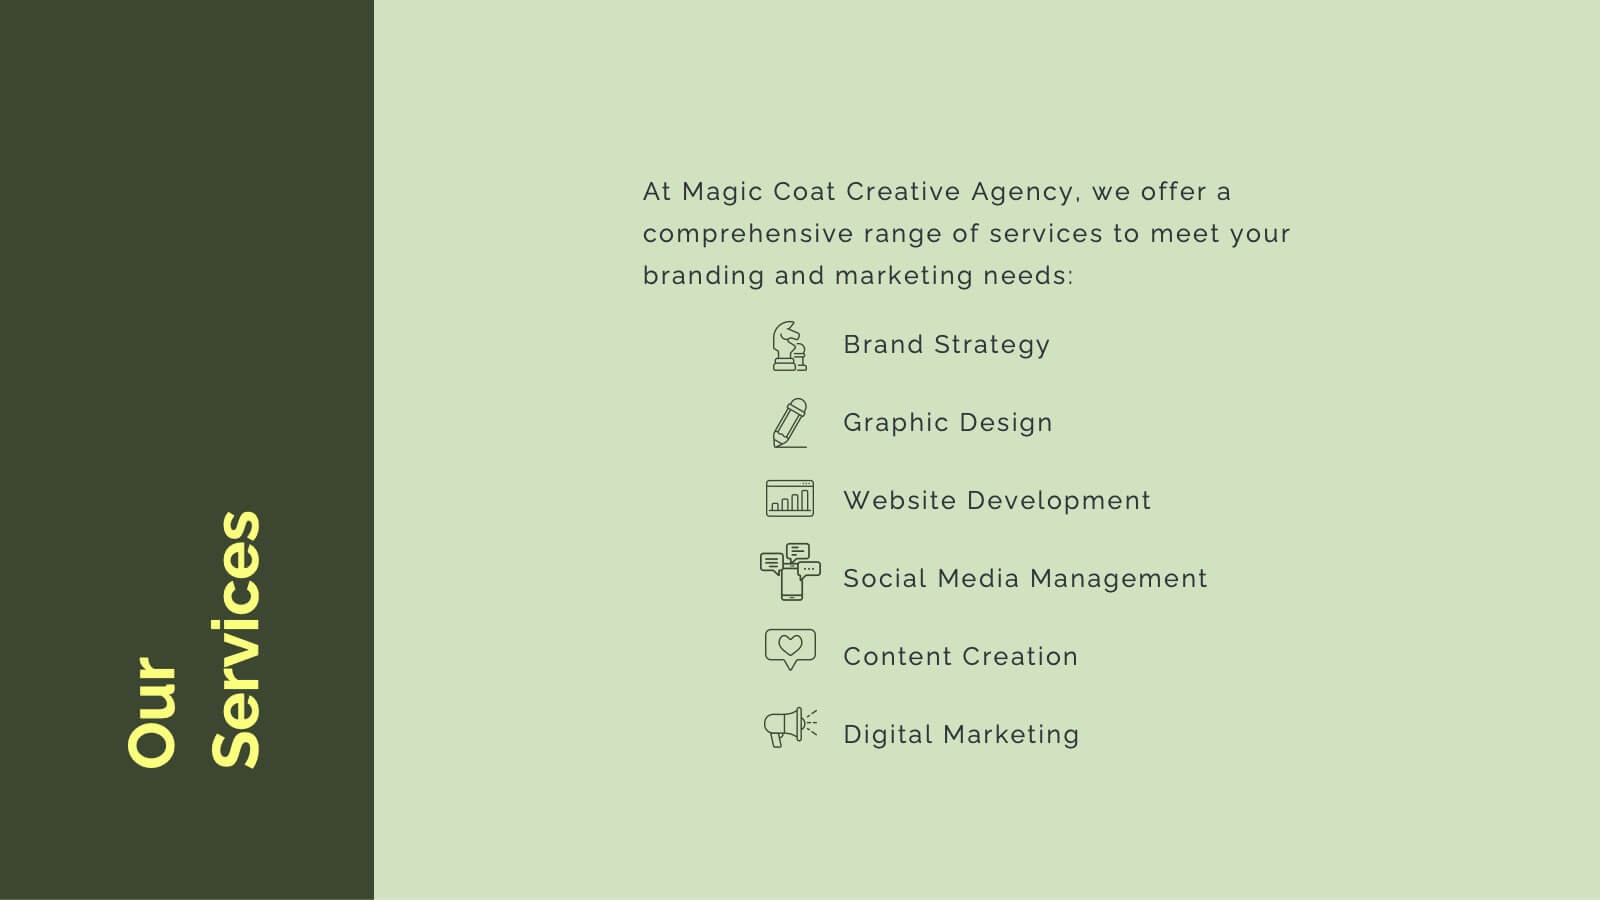
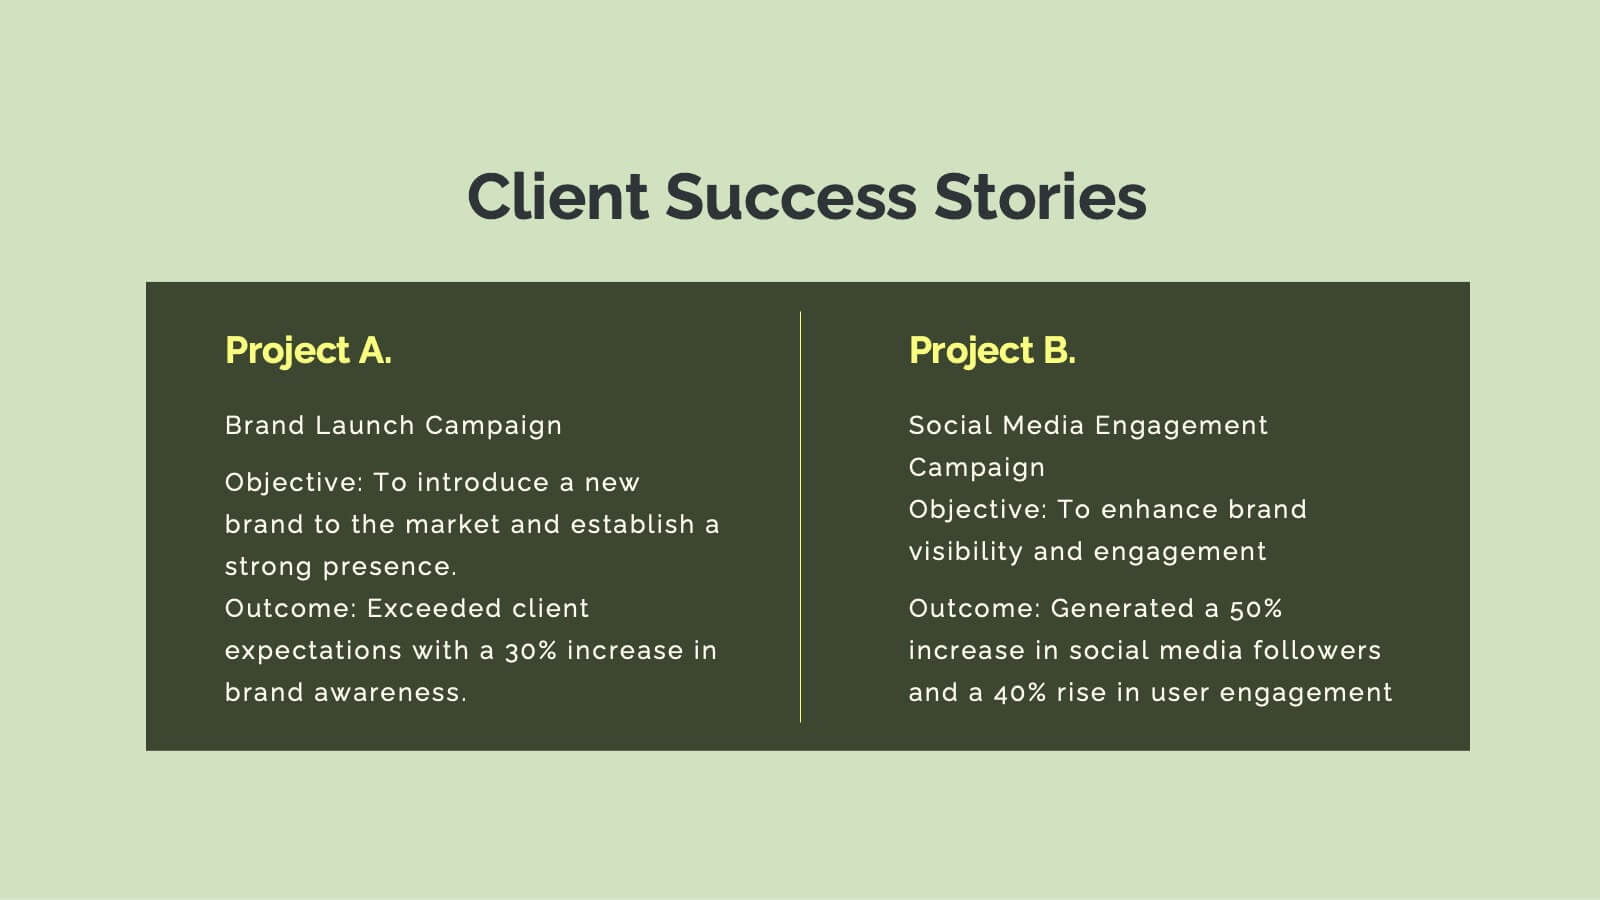
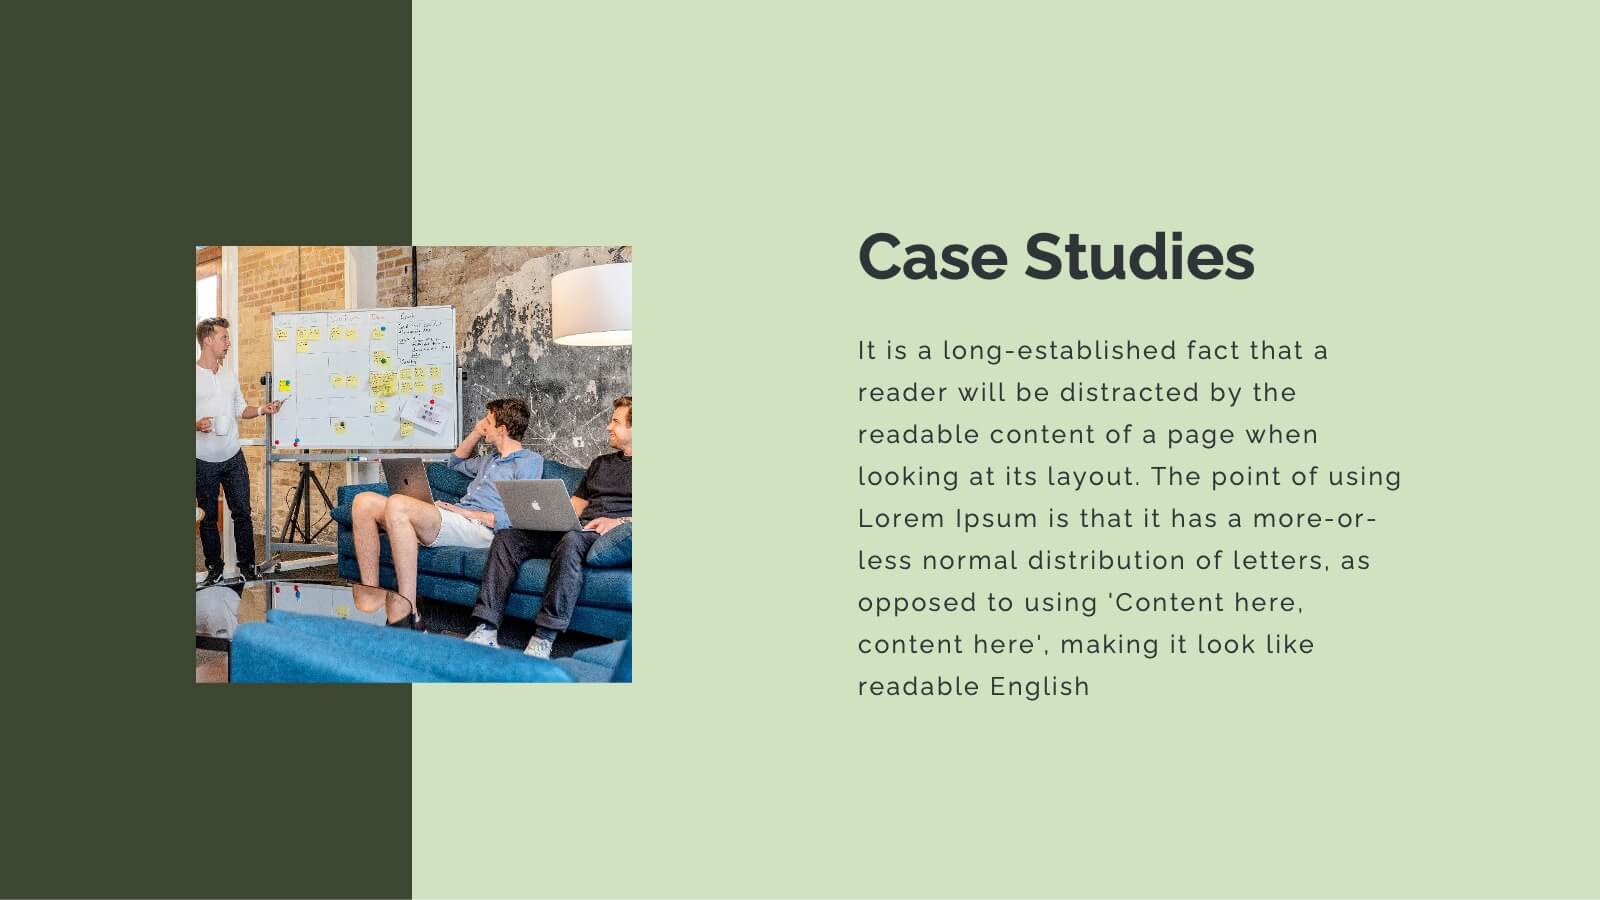
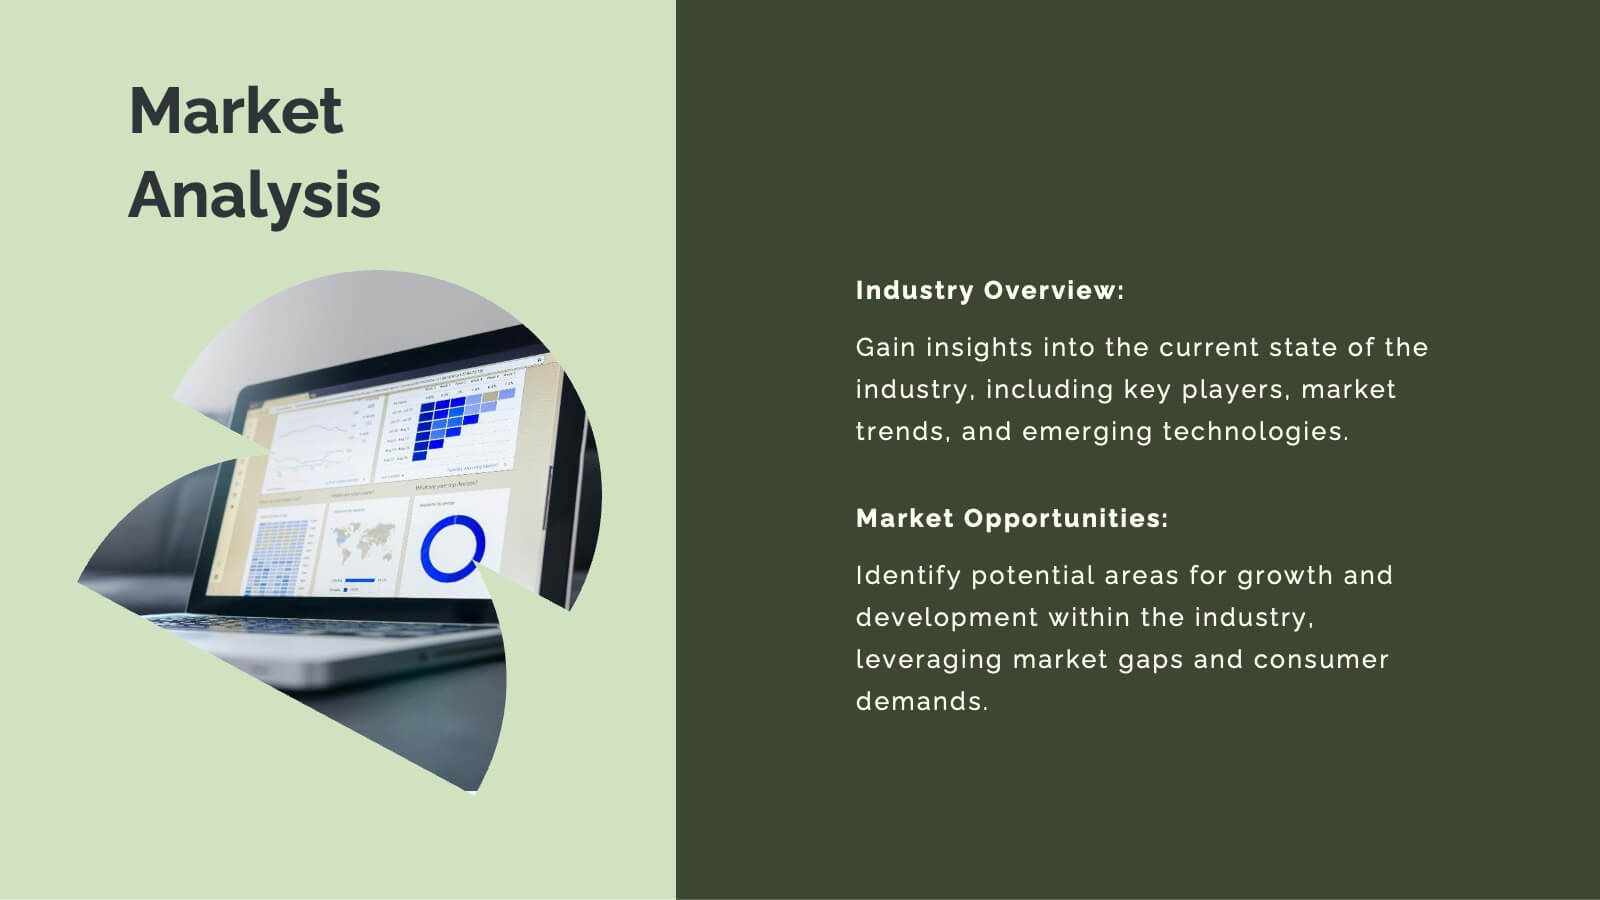
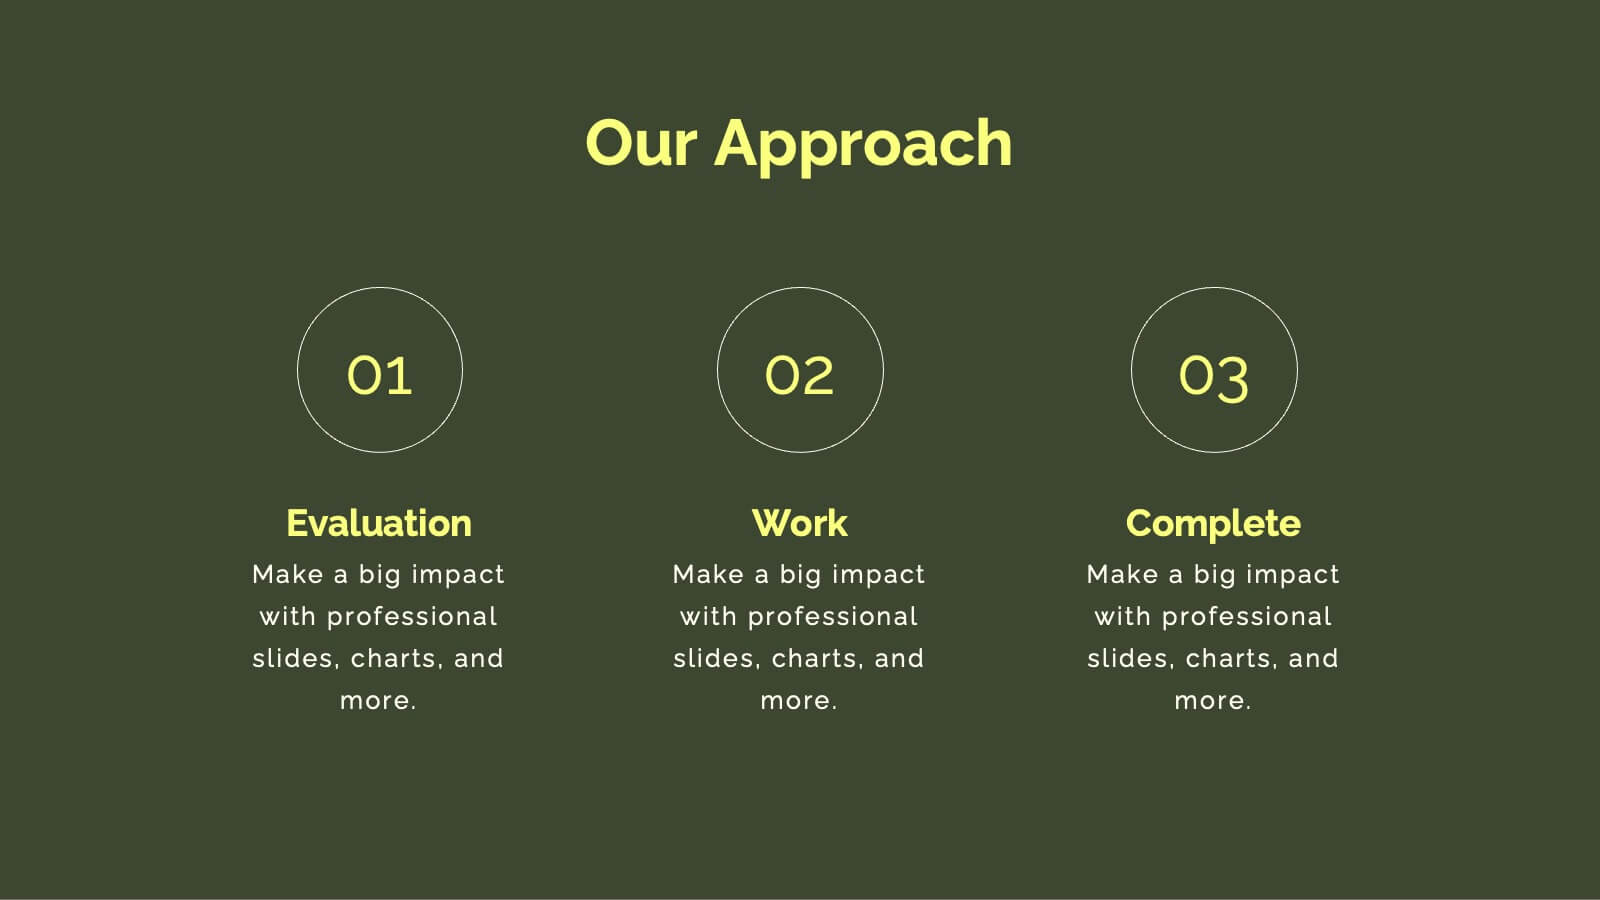
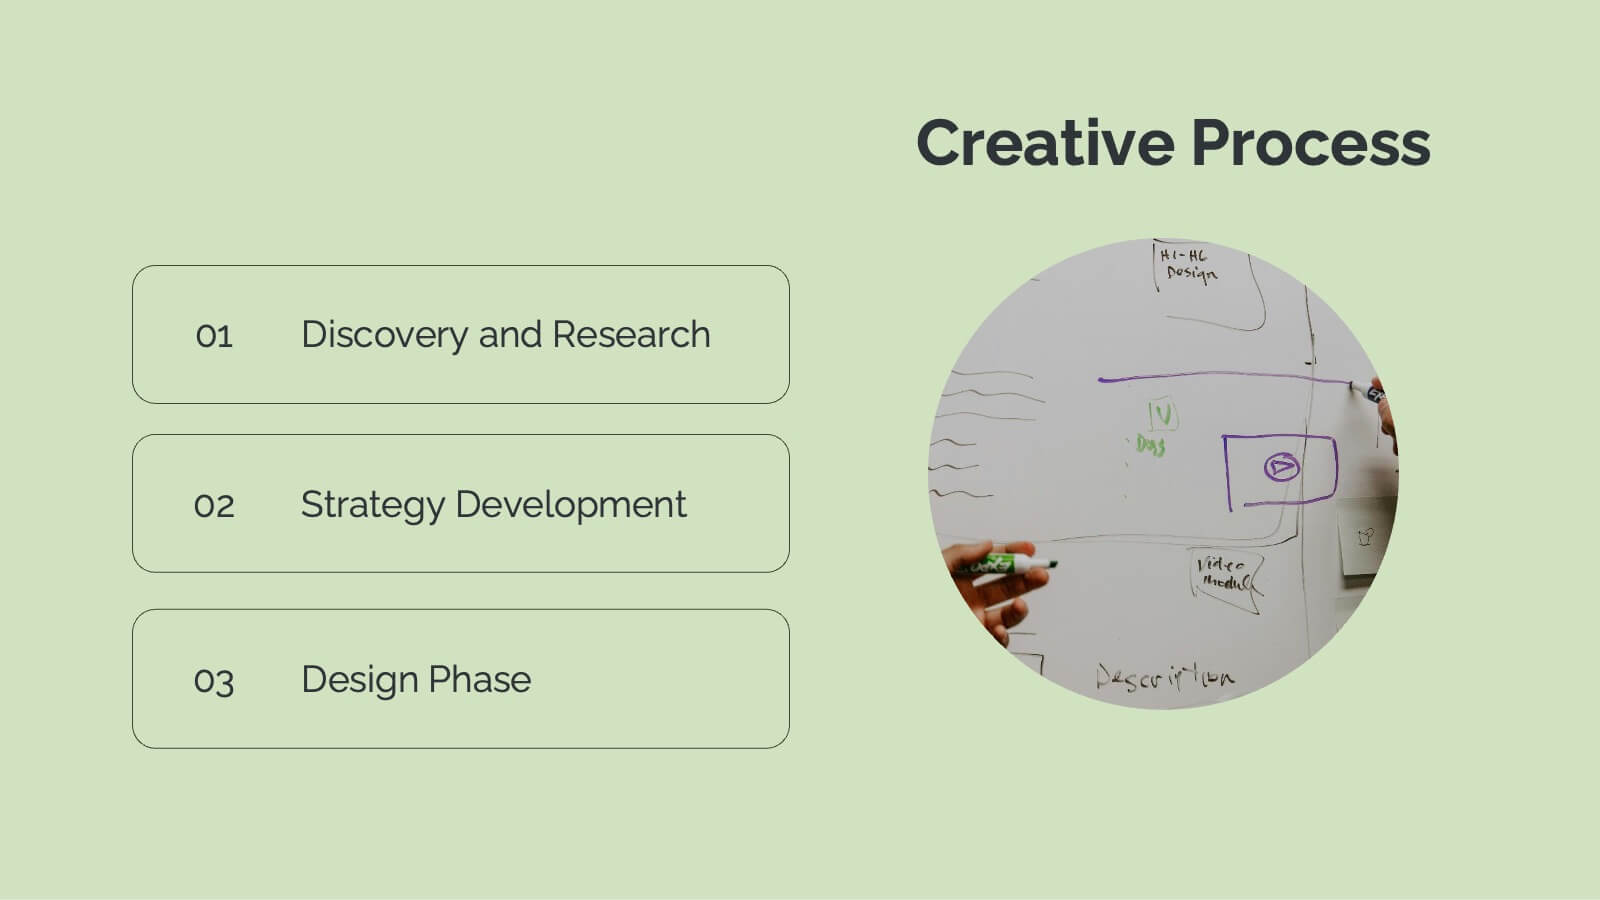
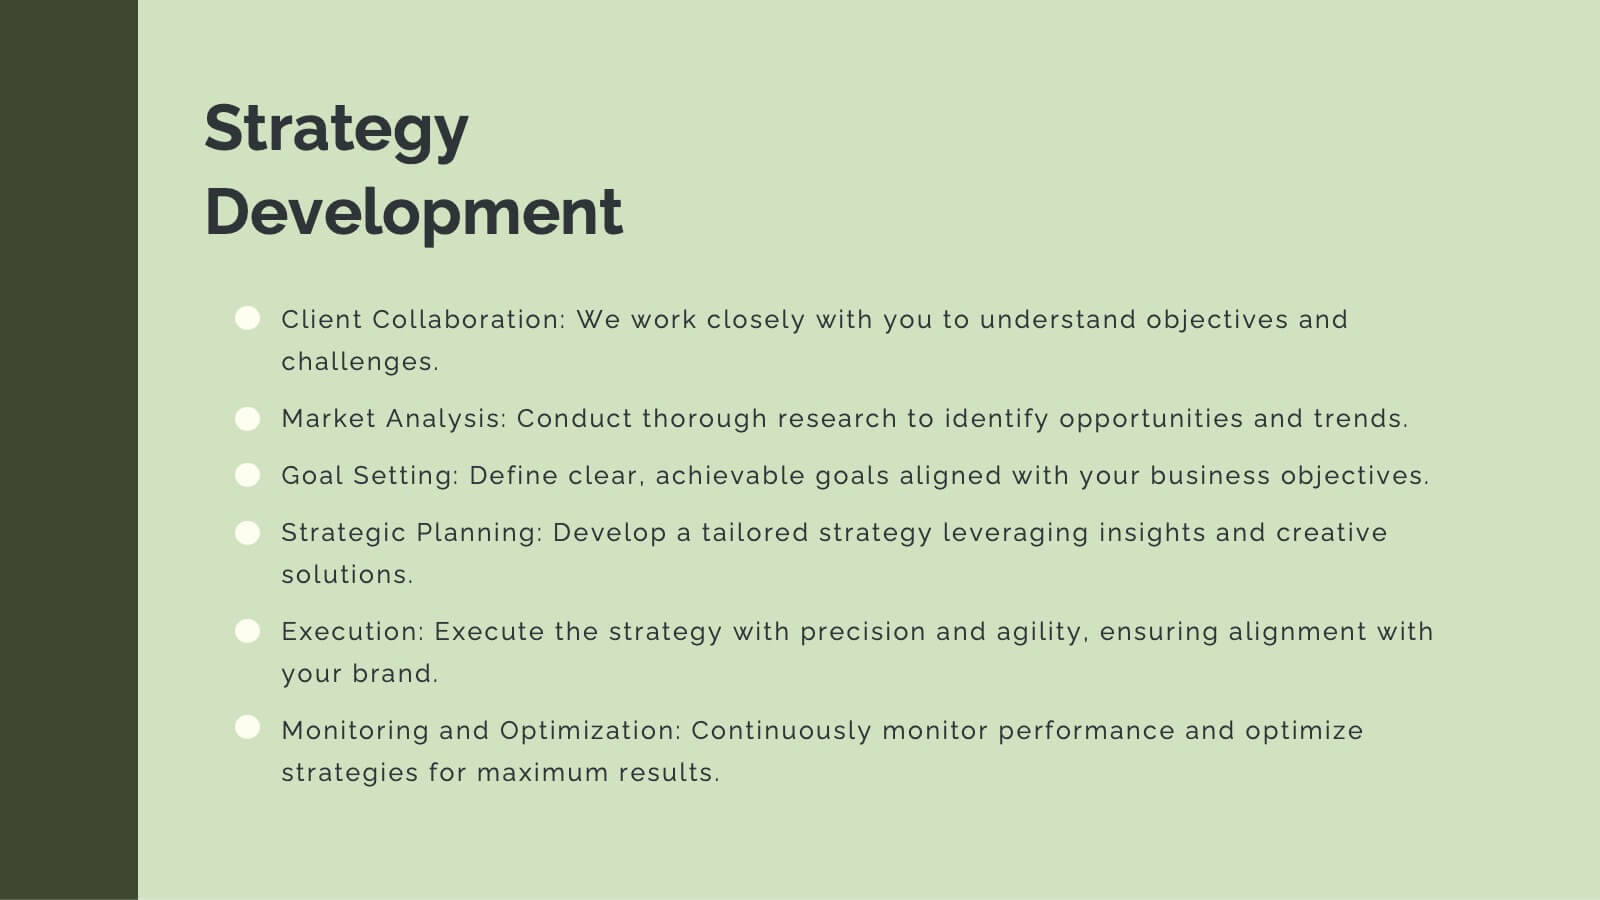
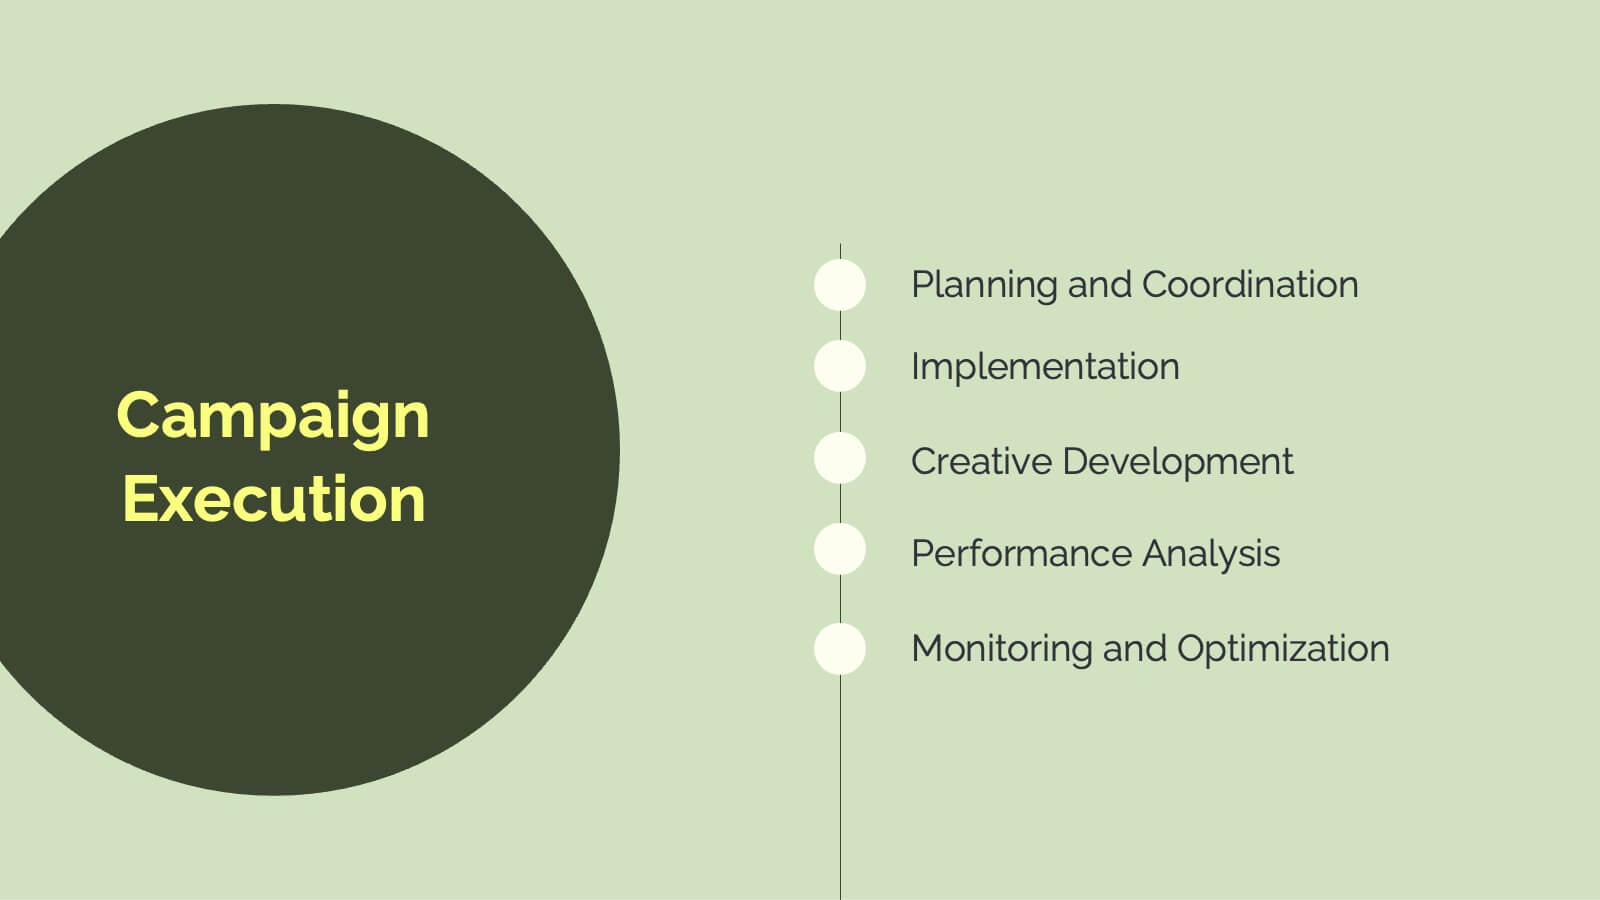
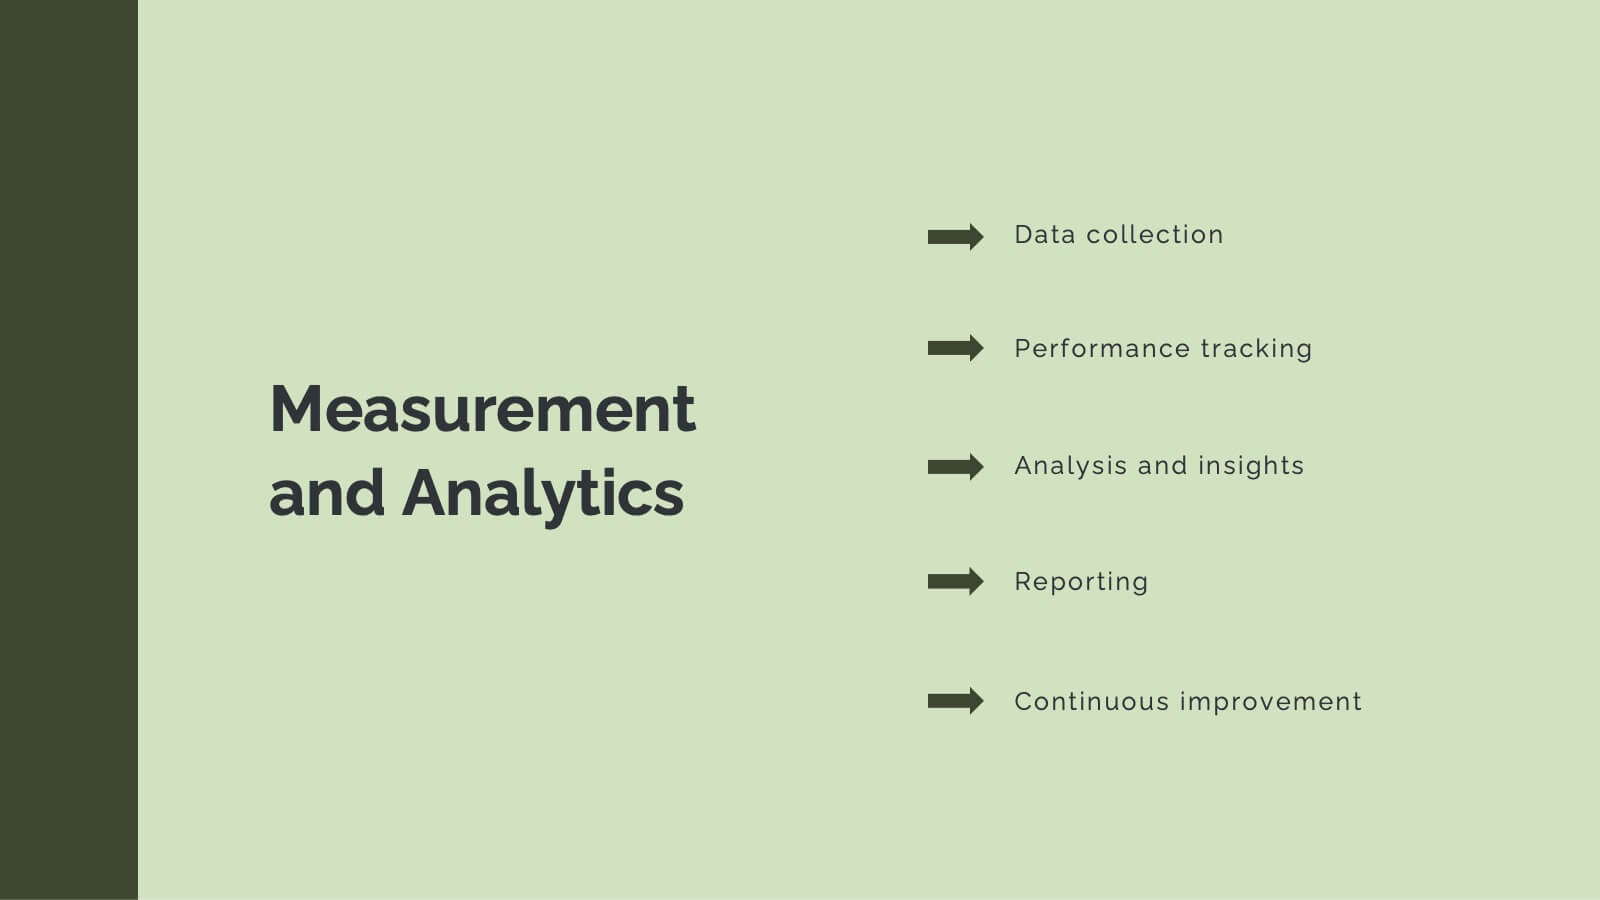
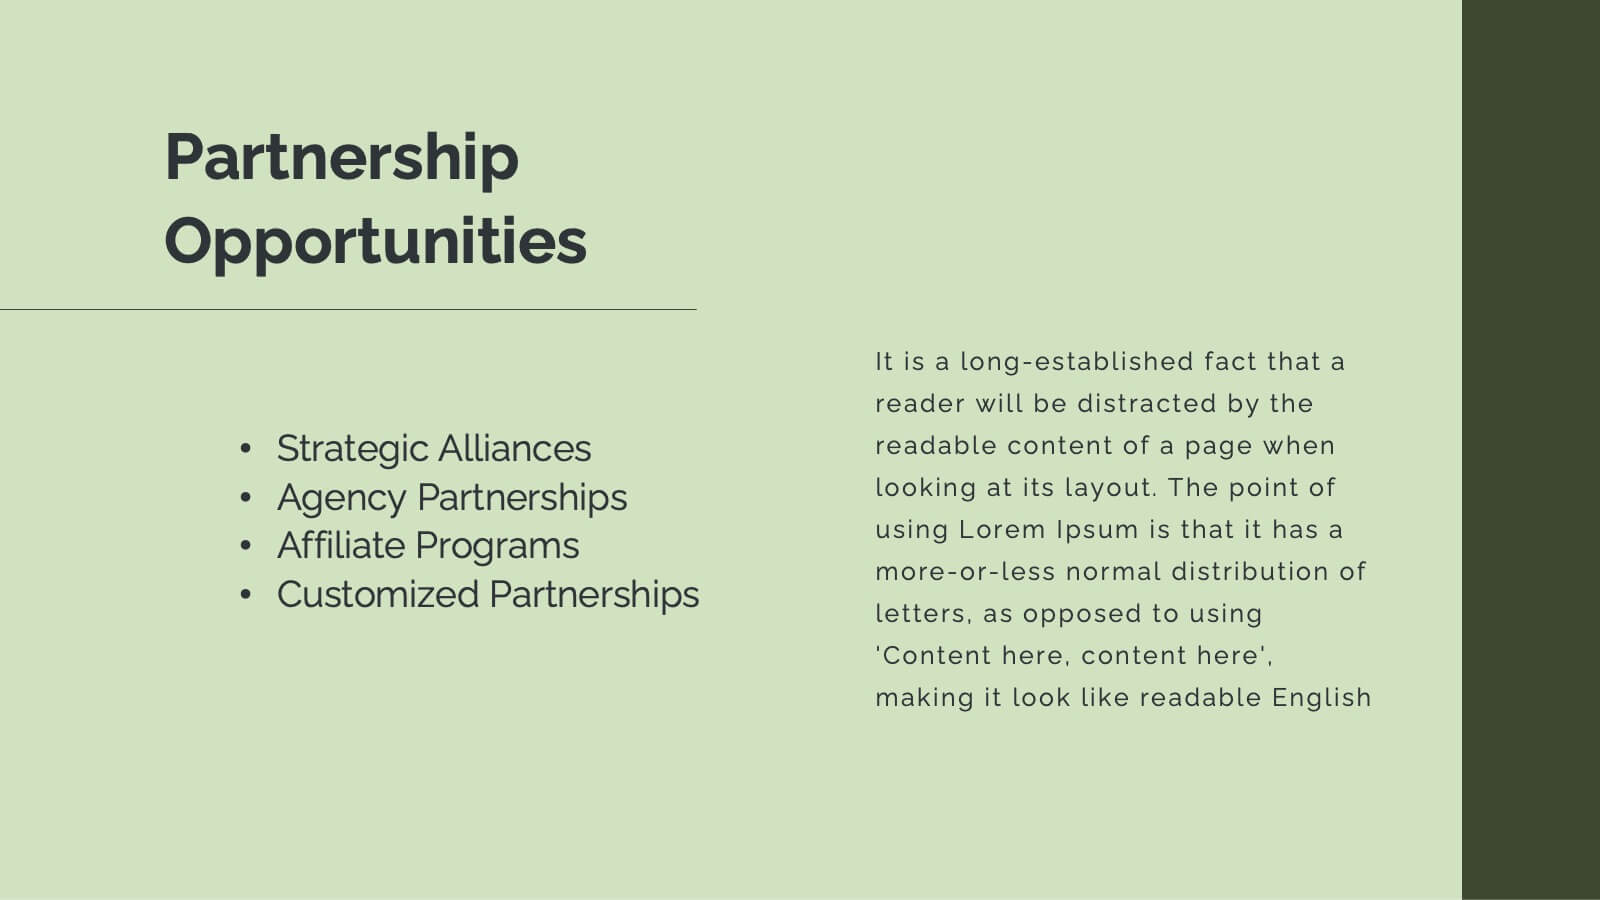
Horizon Advertising Agency Proposal Presentation
Elevate your advertising impact with this comprehensive agency proposal template. It’s meticulously designed to showcase your agency’s capabilities from strategic planning to creative execution, ensuring a persuasive presentation of services like market analysis, campaign strategies, and client success stories. Each slide is formatted to facilitate understanding and engagement, making it perfect for highlighting your team's expertise and unique approach. Compatible with major presentation platforms like PowerPoint, Google Slides, and Keynote, this template supports your efforts to secure new clients and projects seamlessly across various devices.


22 slides
Inspirae Project Status Report Presentation
This sleek and modern project status report presentation template is designed to help you effectively communicate progress, challenges, and key insights. It covers essential sections such as performance metrics, sales performance, risk assessments, and strategic initiatives, ensuring a comprehensive overview. Compatible with PowerPoint, Keynote, and Google Slides for seamless customization.


4 slides
Business Gap Analysis Framework
Visually bridge the gap between current and desired performance with this impactful Business Gap Analysis slide. Featuring a creative cliff and bridge design with editable text sections, it's ideal for strategic planning, performance improvement, and operational reviews. Fully compatible with PowerPoint, Keynote, and Google Slides.