


Features
- 2 Unique slides
- Fully editable and easy to edit in Microsoft Powerpoint, Keynote and Google Slides
- 16:9 widescreen layout
- Clean and professional designs
- Export to JPG, PDF or send by email


Do you have any questions?
Recommend


6 slides
Country Highlight Map North America Presentation
Showcase your regional focus with a clean, data-driven map that highlights key areas across the United States. Perfect for presenting business coverage, demographic data, or strategic expansion points, this layout keeps visuals sharp and organized. Fully compatible with PowerPoint, Keynote, and Google Slides for effortless customization and presentation.


5 slides
Performance Metrics and KPI Review Presentation
Visualize performance at a glance with the Performance Metrics and KPI Review presentation template. Featuring sleek gauge charts in various color schemes, this layout makes it easy to display progress, thresholds, and KPIs across categories. Customize each dial and label to reflect your own business metrics. Compatible with PowerPoint, Keynote, and Google Slides.


6 slides
Community Network Infographic
A community network is a localized, often root-driven, communication infrastructure that connects individuals, organizations, and institutions within a specific geographical area or community. This Infographic template visually represents the connections, relationships, and interactions within a community, often focusing on its members, resources, and activities. This template is a powerful way to showcase the dynamics and vitality of a community. This highlights the central theme or purpose of the community at the center of the infographic. This is fully customizable and compatible with Powerpoint, Keynote, and Google Slides.


6 slides
Team Workflow Strategy Process Diagram Presentation
Illustrate your team’s workflow from start to success with the Team Workflow Strategy Process Diagram Presentation. This slide design uses a horizontal sequence of arrow-shaped blocks, each representing a distinct step assigned to a team role or function. It’s perfect for project pipelines, task delegation, or process alignment across departments. Clear icons and editable text fields help keep communication streamlined. Compatible with PowerPoint, Keynote, and Google Slides.


26 slides
Boost Presentation Template
Our Boost Crossfit Gym Presentation is a great template for getting your target audience motivated. With it, you can create an attractive and informative presentation that contains the most relevant information about your business. This template has an appealing design that will help you convey your message in a professional and interesting way. Our template comes with a ton of customizable sections, which will help you achieve all your presentation goals. You can easily customize this template to match your brand, add some unique header slides and get your own unique style going!


7 slides
Change Management Presentation Template
Our Change Management Infographic is designed to visually present your information. This infographic presentation comes with a seven page layout, all neatly arranged into a well-organized structure, which shows the steps of a change management process. This can be used for any kind of presentation purpose, education, employees, new product launch or even for training executives, managers and supervisors. With this template the variety of elements included are to help you create your own personalized content, you can make your own presentations for any business or industry in just minutes!


12 slides
Employee Roles and Professional Profiles
Break down team structure and highlight individual strengths with this modern hub-and-spoke layout—perfect for showcasing employee roles, departments, or professional profiles. Whether you're onboarding, presenting org charts, or outlining responsibilities, this slide keeps it all clear and cohesive. Fully compatible with PowerPoint, Keynote, and Google Slides.


32 slides
Willowshade Brand Guidelines Proposal Presentation
This dynamic presentation template is tailored to define and showcase comprehensive brand guidelines. Key sections include logo design, typography, color palette, imagery, brand voice, and values, ensuring brand consistency across platforms. It also features areas for target audience analysis, market research, competitive landscape, and unique selling propositions to reinforce strategic positioning. Visual examples for website, social media, packaging, and advertising highlight real-world applications. Fully customizable and compatible with PowerPoint, Keynote, and Google Slides.


10 slides
Corporate Framework and Structure Presentation
Clearly define your corporate framework and structure with this professional infographic template. Ideal for executives, team leaders, and project managers, this slide visually organizes organizational hierarchy, roles, and key responsibilities in a clean and structured layout. Fully editable in PowerPoint, Keynote, and Google Slides, allowing seamless customization for your company's needs.


6 slides
Corporate Foundation and Pillars Presentation
Highlight your company's core principles with this visually impactful pillar-style slide. Designed to illustrate business frameworks, strategies, or guiding values, this layout helps communicate stability and growth. Fully customizable in PowerPoint, Keynote, and Google Slides for seamless brand alignment.


7 slides
Security Framework Infographic
A security framework, also known as a cybersecurity framework, is a structured set of guidelines, best practices, standards, and processes that help organizations design, implement, monitor, and manage robust security measures to protect their information systems and resources. This infographic template is a fortress of knowledge, guiding you through the pillars of a robust security infrastructure that safeguards your digital realm. Compatible with Powerpoint, Keynote, and Google Sides. Every element in this infographic embodies a facet of a comprehensive security framework.


7 slides
Lifecycle Stages in Customer Experience Presentation
Showcase the full customer journey with this Lifecycle Stages in Customer Experience presentation. Featuring a sleek infinity loop layout, this slide is ideal for visualizing cyclical engagement stages—like acquisition, onboarding, retention, and advocacy. Clean design and labeled touchpoints help convey insights clearly. Fully compatible with PowerPoint, Canva, and Google Slides.
20 slides
Beacon Content Marketing Pitch Deck Presentation
Ignite your marketing strategies with this dynamic and sleek content marketing pitch deck! Filled with modern design and comprehensive insights, this template is perfect for showcasing trends, influencer marketing, and emerging technologies. Make your brand's story stand out while captivating your audience. Fully compatible with PowerPoint, Keynote, and Google Slides!


6 slides
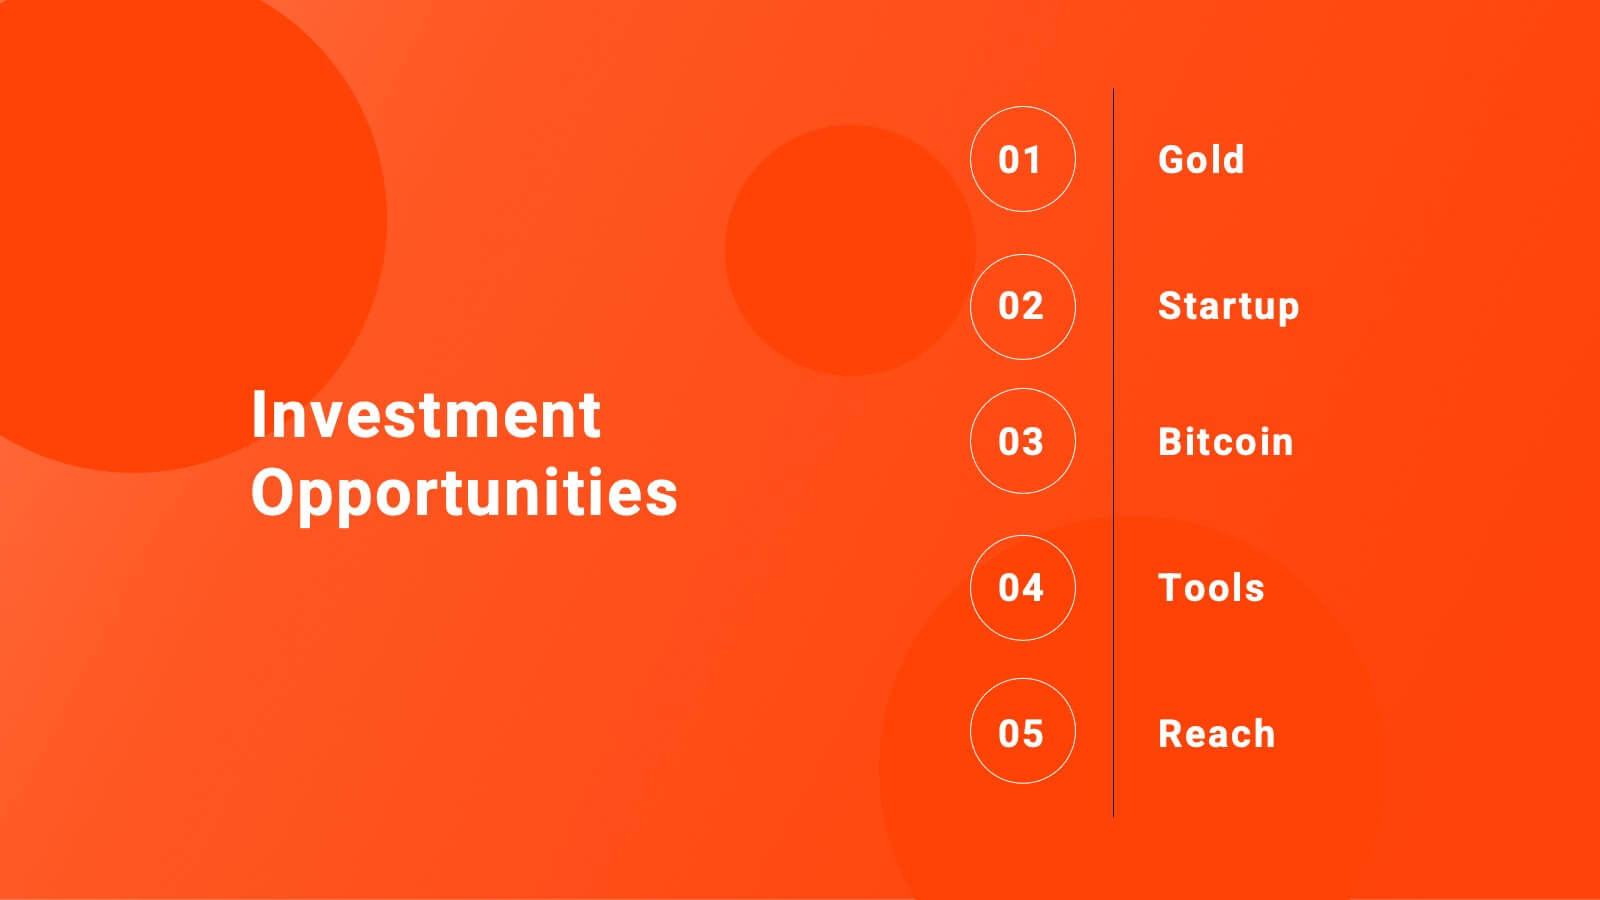
Visual Business Concept Triangle
Communicate processes, concepts, or growth stages with this dynamic triangle layout. Perfect for highlighting five key ideas or steps in a sleek, professional way. Fully customizable in PowerPoint, Keynote, and Google Slides for easy personalization.


23 slides
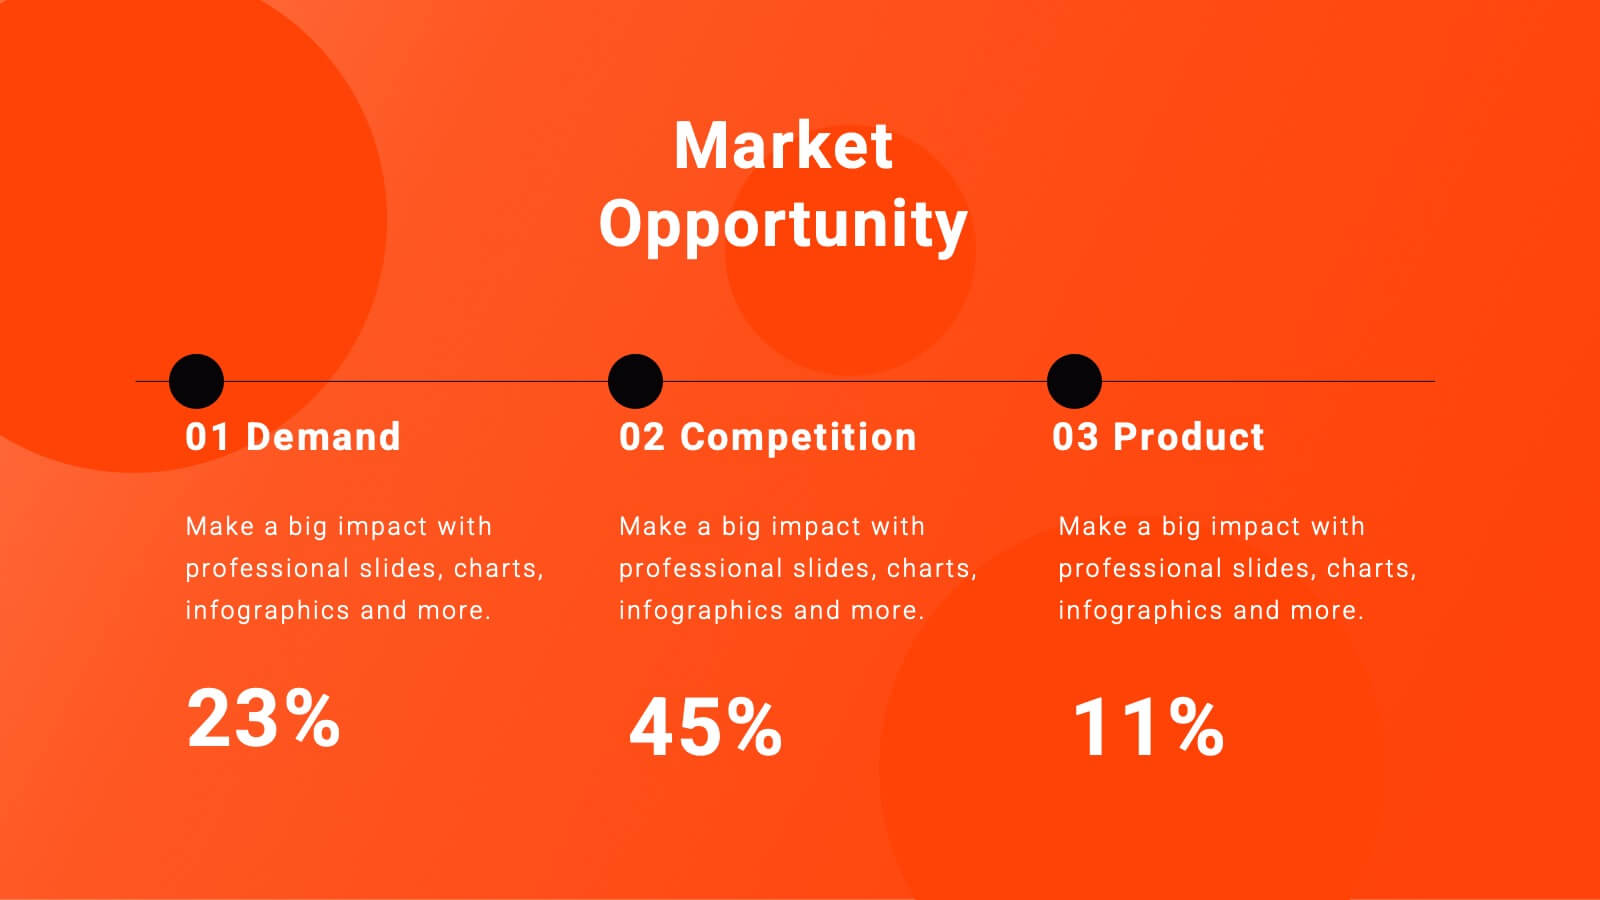
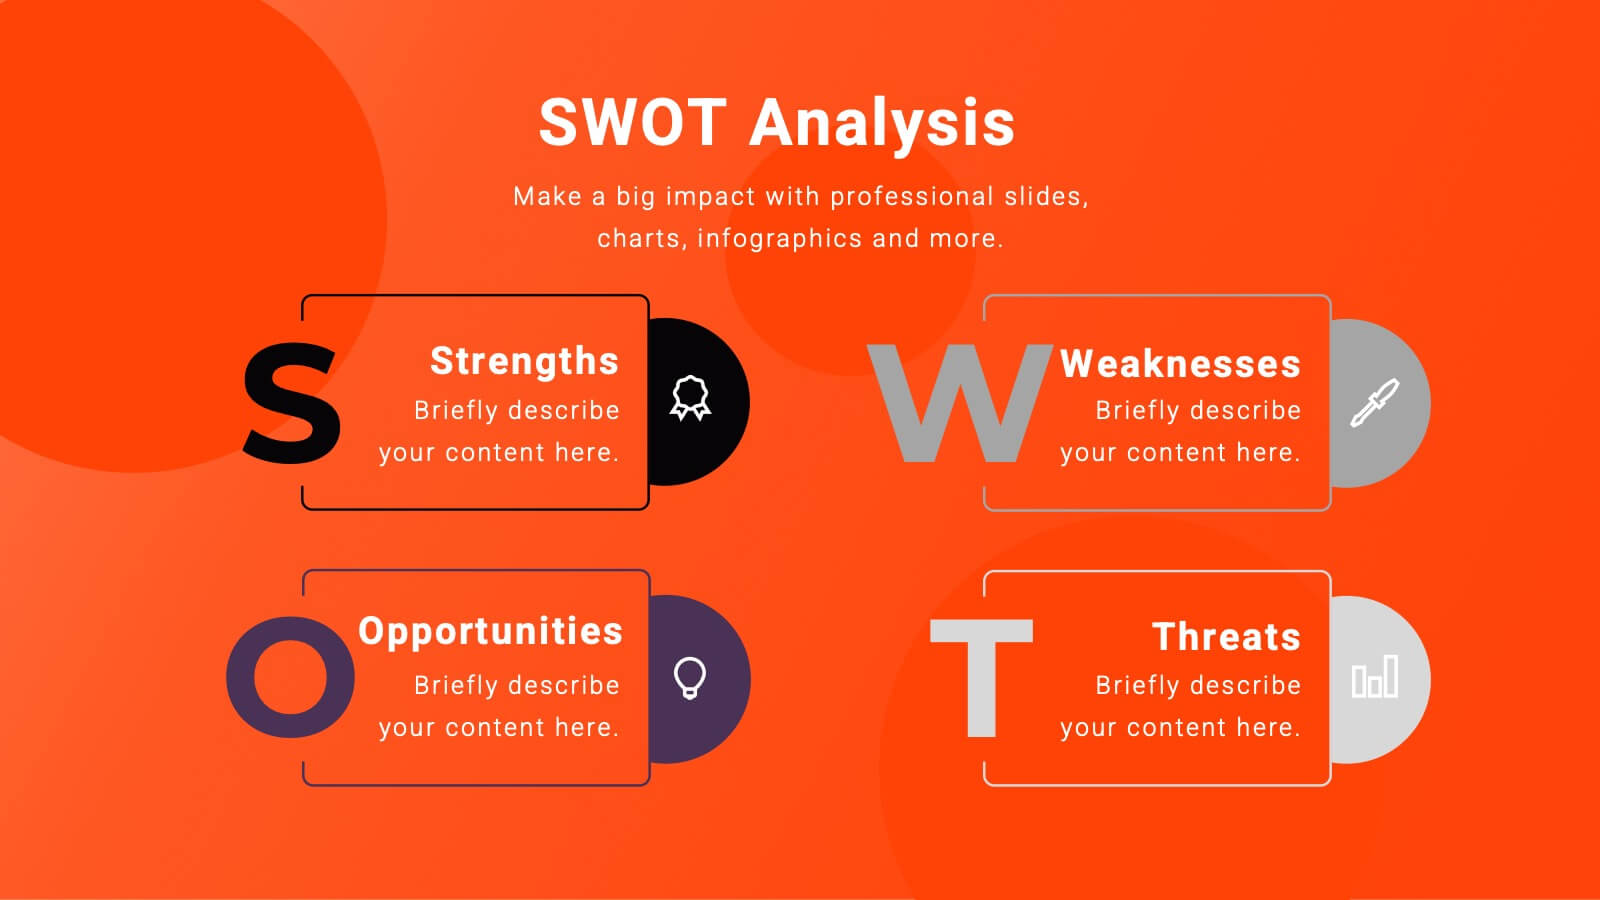
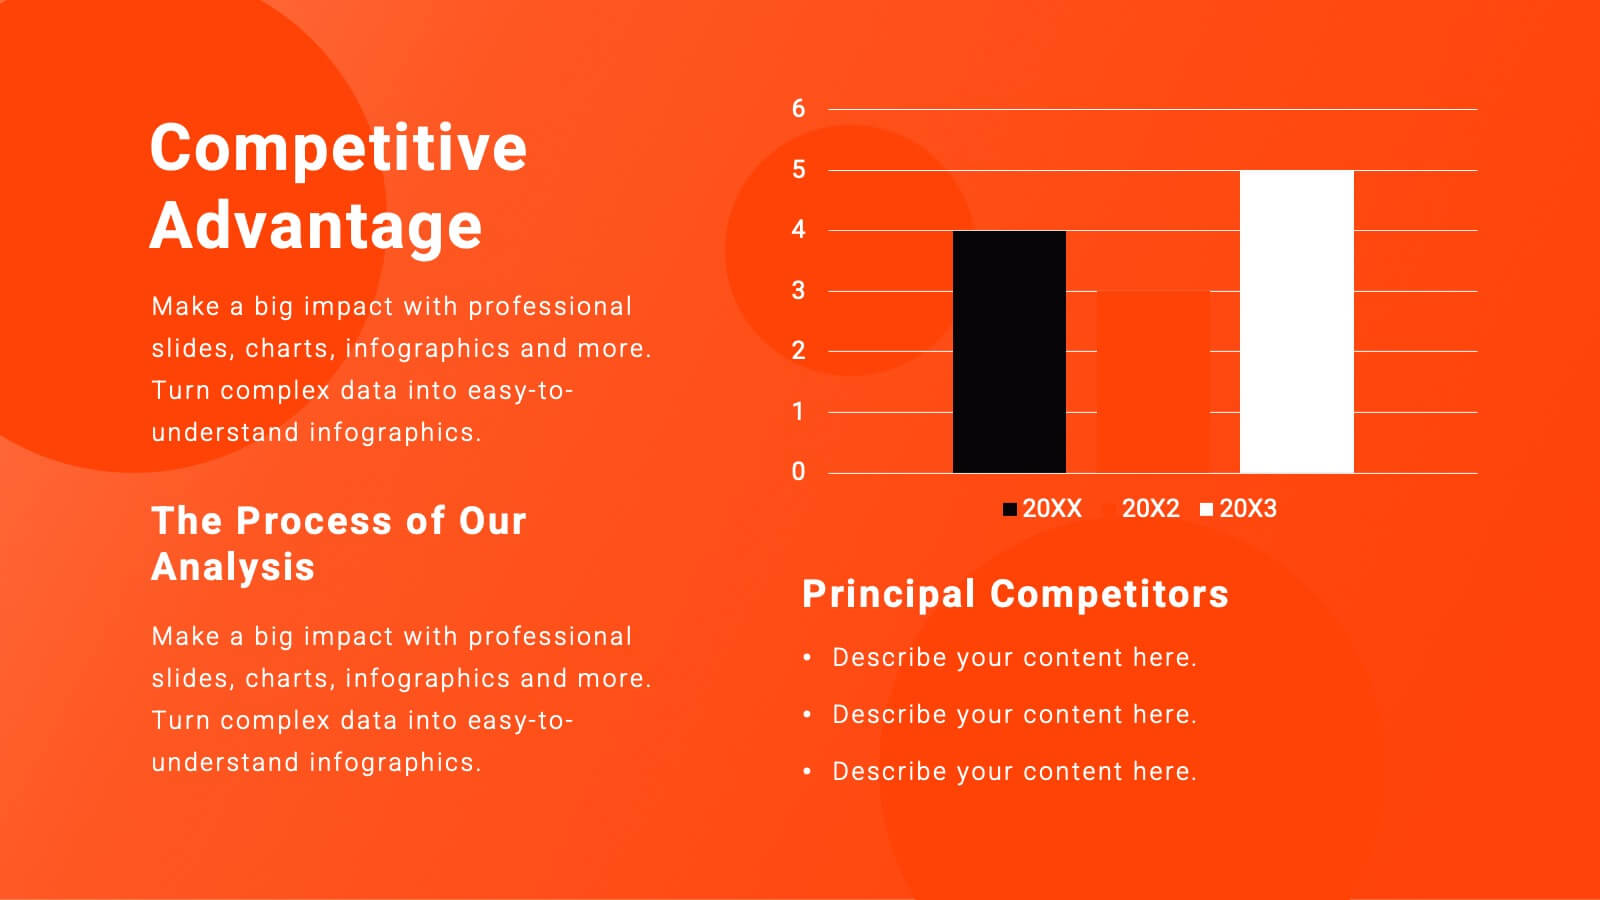
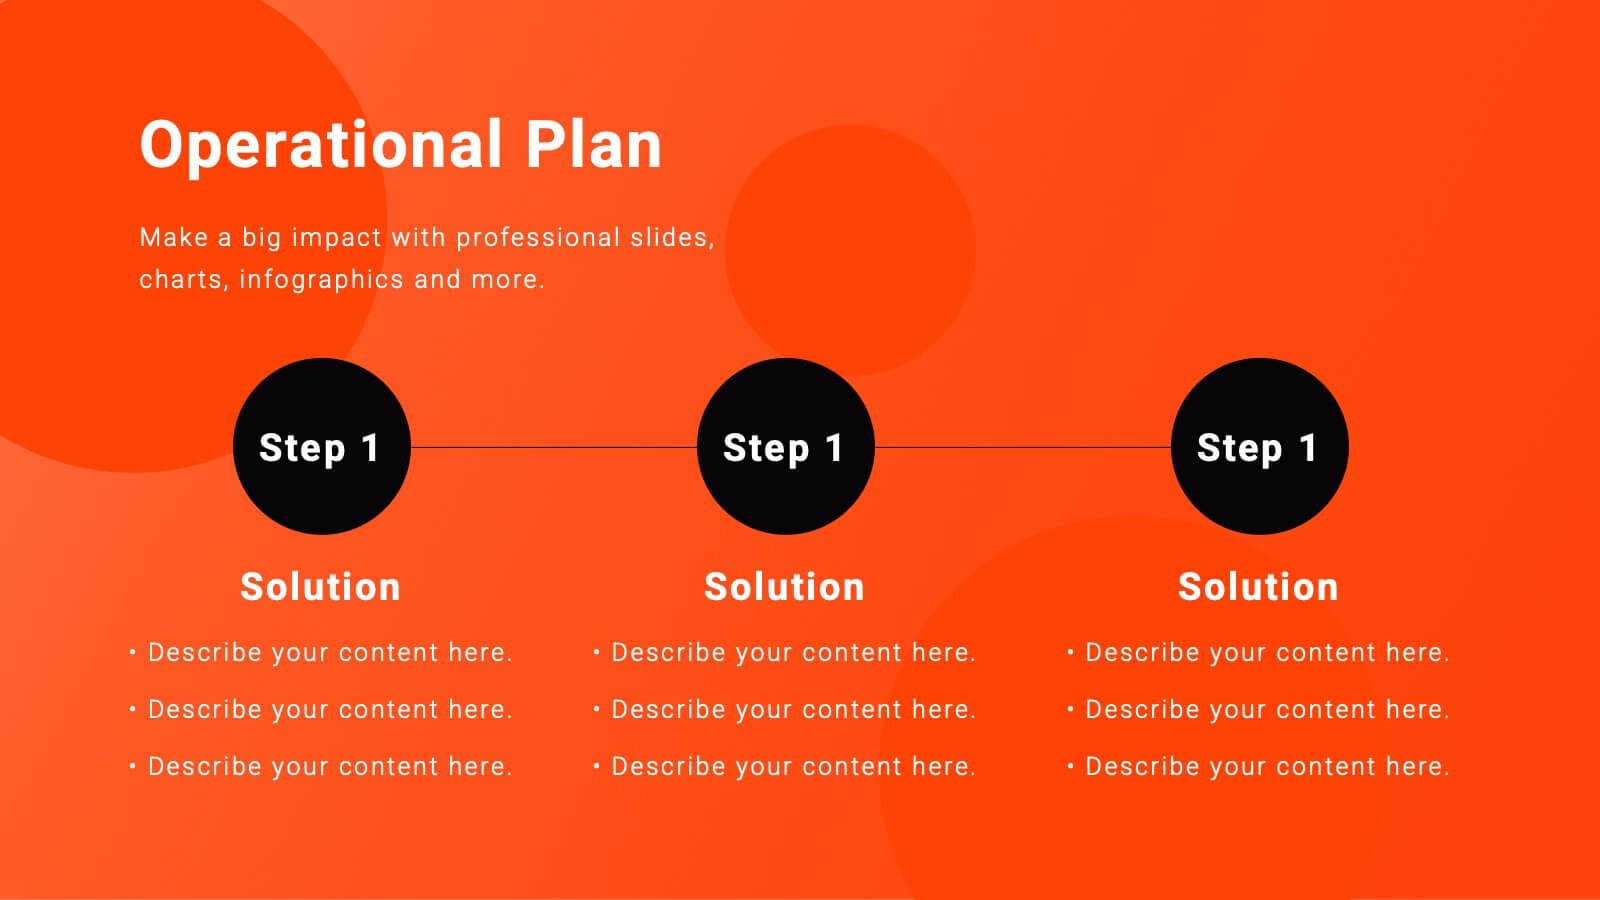
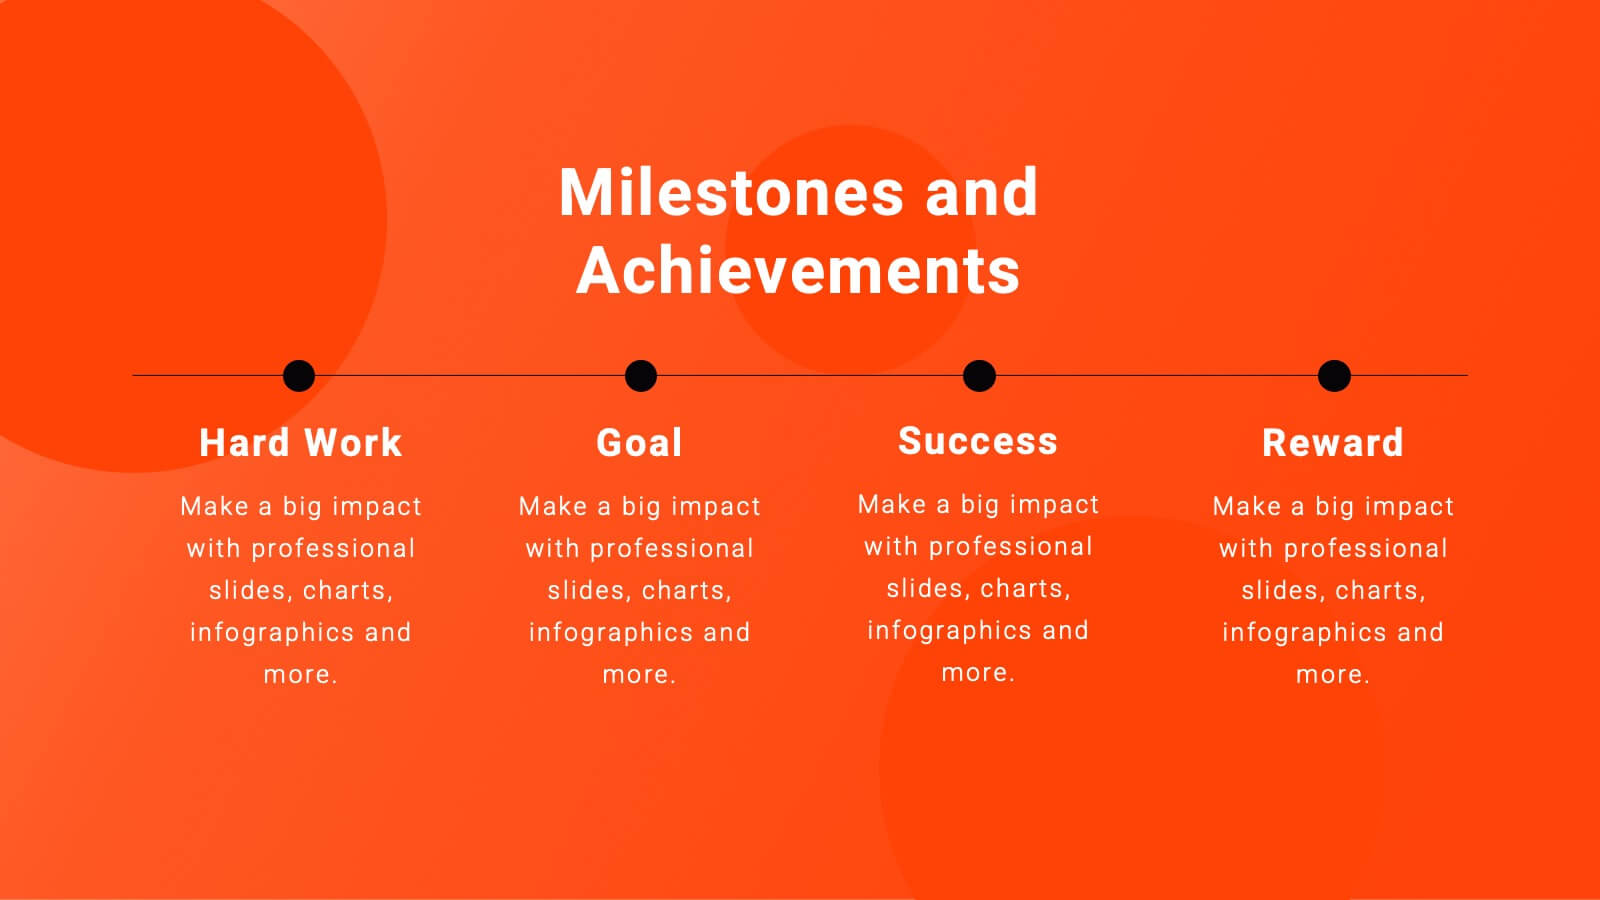
Equinox Business Operations Plan Presentation
Elevate your business operations with this dynamic plan template! Perfect for detailing company background, market opportunities, and strategic objectives. Ideal for business leaders and managers aiming to streamline operations and drive growth. Compatible with PowerPoint, Keynote, and Google Slides, this template ensures your business plan is clear, professional, and impactful. Drive success today!


5 slides
Responsibility Assignment Using RACI Model Presentation
Visualize role clarity with the Responsibility Assignment Using RACI Model Presentation. This template helps define team responsibilities across four key roles—Responsible, Accountable, Consulted, and Informed—in a simple and clean radial layout. Ideal for aligning teams, assigning tasks, and preventing confusion. Fully customizable in PowerPoint, Canva, and Google Slides.


21 slides
Tourmaline Project Proposal Presentation
This sleek design proposal template covers all essential sections like project summary, objectives, goals, and deliverables. With a modern and professional layout, it's perfect for presenting solutions and methodologies. Compatible with PowerPoint, Keynote, and Google Slides, it’s designed to impress clients and stakeholders with clear, structured information.