


Features
- 4 Unique slides
- Fully editable and easy to edit in Microsoft Powerpoint, Keynote and Google Slides
- 16:9 widescreen layout
- Clean and professional designs
- Export to JPG, PDF or send by email


Do you have any questions?
Recommend


7 slides
Clean Bullet Point List Presentation
Make every idea stand out with this clean, minimal layout built to organize information clearly and stylishly. Perfect for listing strategies, processes, or project highlights, it helps you communicate with confidence and precision. Fully customizable and compatible with PowerPoint, Keynote, and Google Slides for a seamless presentation experience.


7 slides
Daily Puzzle Infographics
Engage and entertain your audience with our daily puzzle infographic. This template is a dynamic and interactive way to present puzzles diagrams to captivate your audience. This template is designed to add an element of fun and engagement to your presentations. The design immediately grabs attention and sparks curiosity. Compatible with Powerpoint, Keynote, and Google Slides. The well-organized layout enables smooth navigation through the infographic. This is perfect for educators, game designers, content creators, or anyone seeking to add an interactive and entertaining element to their presentations.


4 slides
Layered Strategy Circles Presentation
Bring your strategy to life with a sleek circular layout that visually connects goals, actions, and outcomes in a unified flow. Perfect for showcasing layered processes or business frameworks, this design keeps complex ideas simple. Fully editable and compatible with PowerPoint, Keynote, and Google Slides for smooth customization.


8 slides
Attention-Interest-Desire-Action Presentation
Enhance your marketing presentations with this Attention-Interest-Desire-Action (AIDA) Model Presentation template. Designed with a modern, structured pyramid layout, this template clearly illustrates the four key stages of consumer decision-making. Ideal for marketers, sales teams, and business strategists, it’s fully customizable and compatible with PowerPoint, Keynote, and Google Slides.


5 slides
Modern Home Layout Slides Presentation
Give your design ideas a modern edge with this clean, architectural presentation. Perfect for showcasing home layouts, interior concepts, or real estate projects, it combines structure and creativity to keep viewers engaged. Fully customizable and compatible with PowerPoint, Keynote, and Google Slides for effortless editing and professional delivery.


7 slides
SWOT Table Infographic
A SWOT table is a strategic planning tool that helps organizations identify and analyze their internal strengths and weaknesses, as well as external opportunities and threats. This infographic template is a strategic planning tool used by businesses to identify internal and external factors that can impact their performance and competitiveness. This template consists of four quadrants, each representing one of the four components: strengths, weaknesses, opportunities, and threats. The table is organized in a grid format with rows and columns. This template is completely customizable and compatible with Powerpoint, Keynote, and Google Slides.


6 slides
Big Data Technology Infographic
Big Data technology refers to the tools, techniques, and frameworks used to capture, store, process, analyze, and visualize large and complex datasets that are beyond the capabilities of traditional data processing systems. This infographic template is perfect for organizations that deal with massive volumes of data from various sources, including social media, sensors, machines, and more. This template enables businesses to gain valuable insights, make informed decisions, and create new opportunities. This infographic can be used for various industries, including e-commerce, healthcare, finance, manufacturing, and more.


26 slides
Agile Project Management Presentation
Elevate your project management approach with our Agile Project Management presentation template. Compatible with PowerPoint, Keynote, and Google Slides, it's designed to adapt to any presentation environment effortlessly. Ideal for project managers, team leaders, and agile enthusiasts, this template is engineered to illustrate the flexibility and efficiency of agile methodologies in project execution. Our Agile Project Management template is a powerful tool for demonstrating the benefits of agile processes, including increased adaptability, improved stakeholder engagement, and enhanced product quality. With a series of well-organized slides, it guides you through the agile journey, from project inception to completion. The template offers a diverse range of slides that cover all facets of agile project management, including sprint planning, daily stand-ups, and retrospectives. This template is not just visually appealing but also rich in content, providing ample space to detail out roles, responsibilities, and timelines. It ensures that your team and stakeholders are aligned with the project goals, making complex information accessible and understandable. Unlock the potential of your projects with this SEO-optimized template, and become the go-to source for agile project management strategies.


23 slides
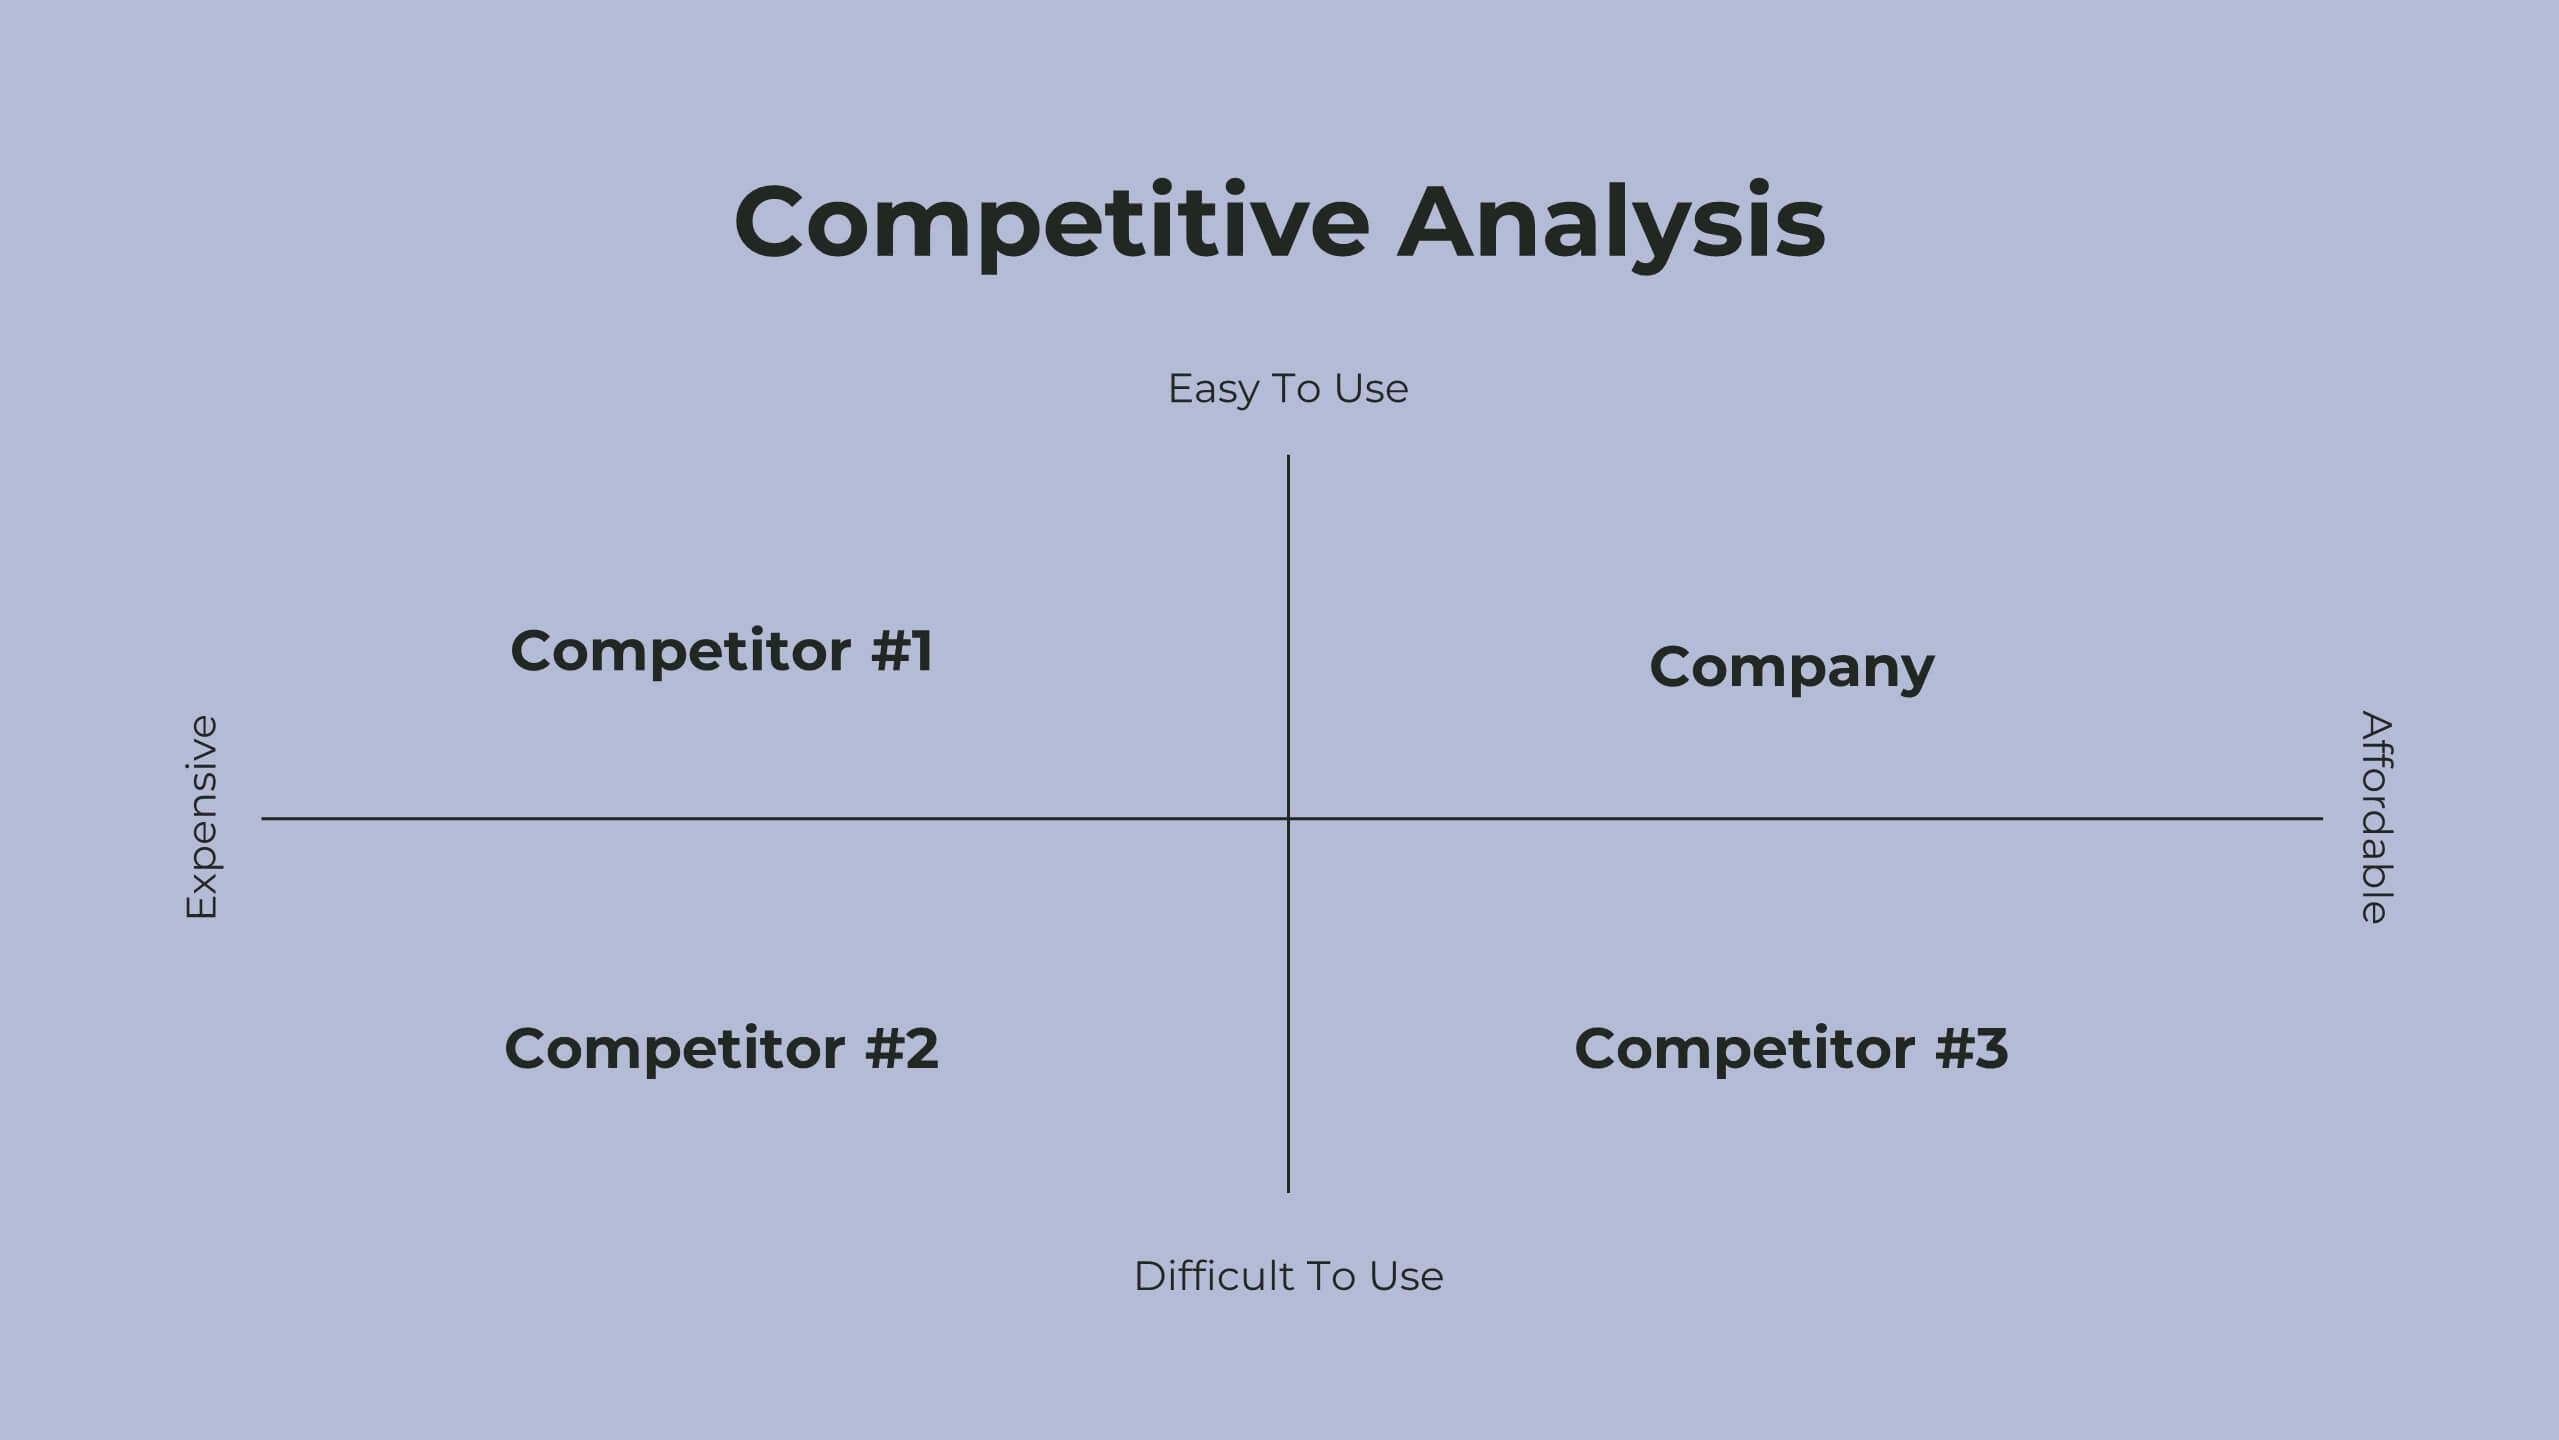
Tranquil Corporate Strategy Proposal Presentation
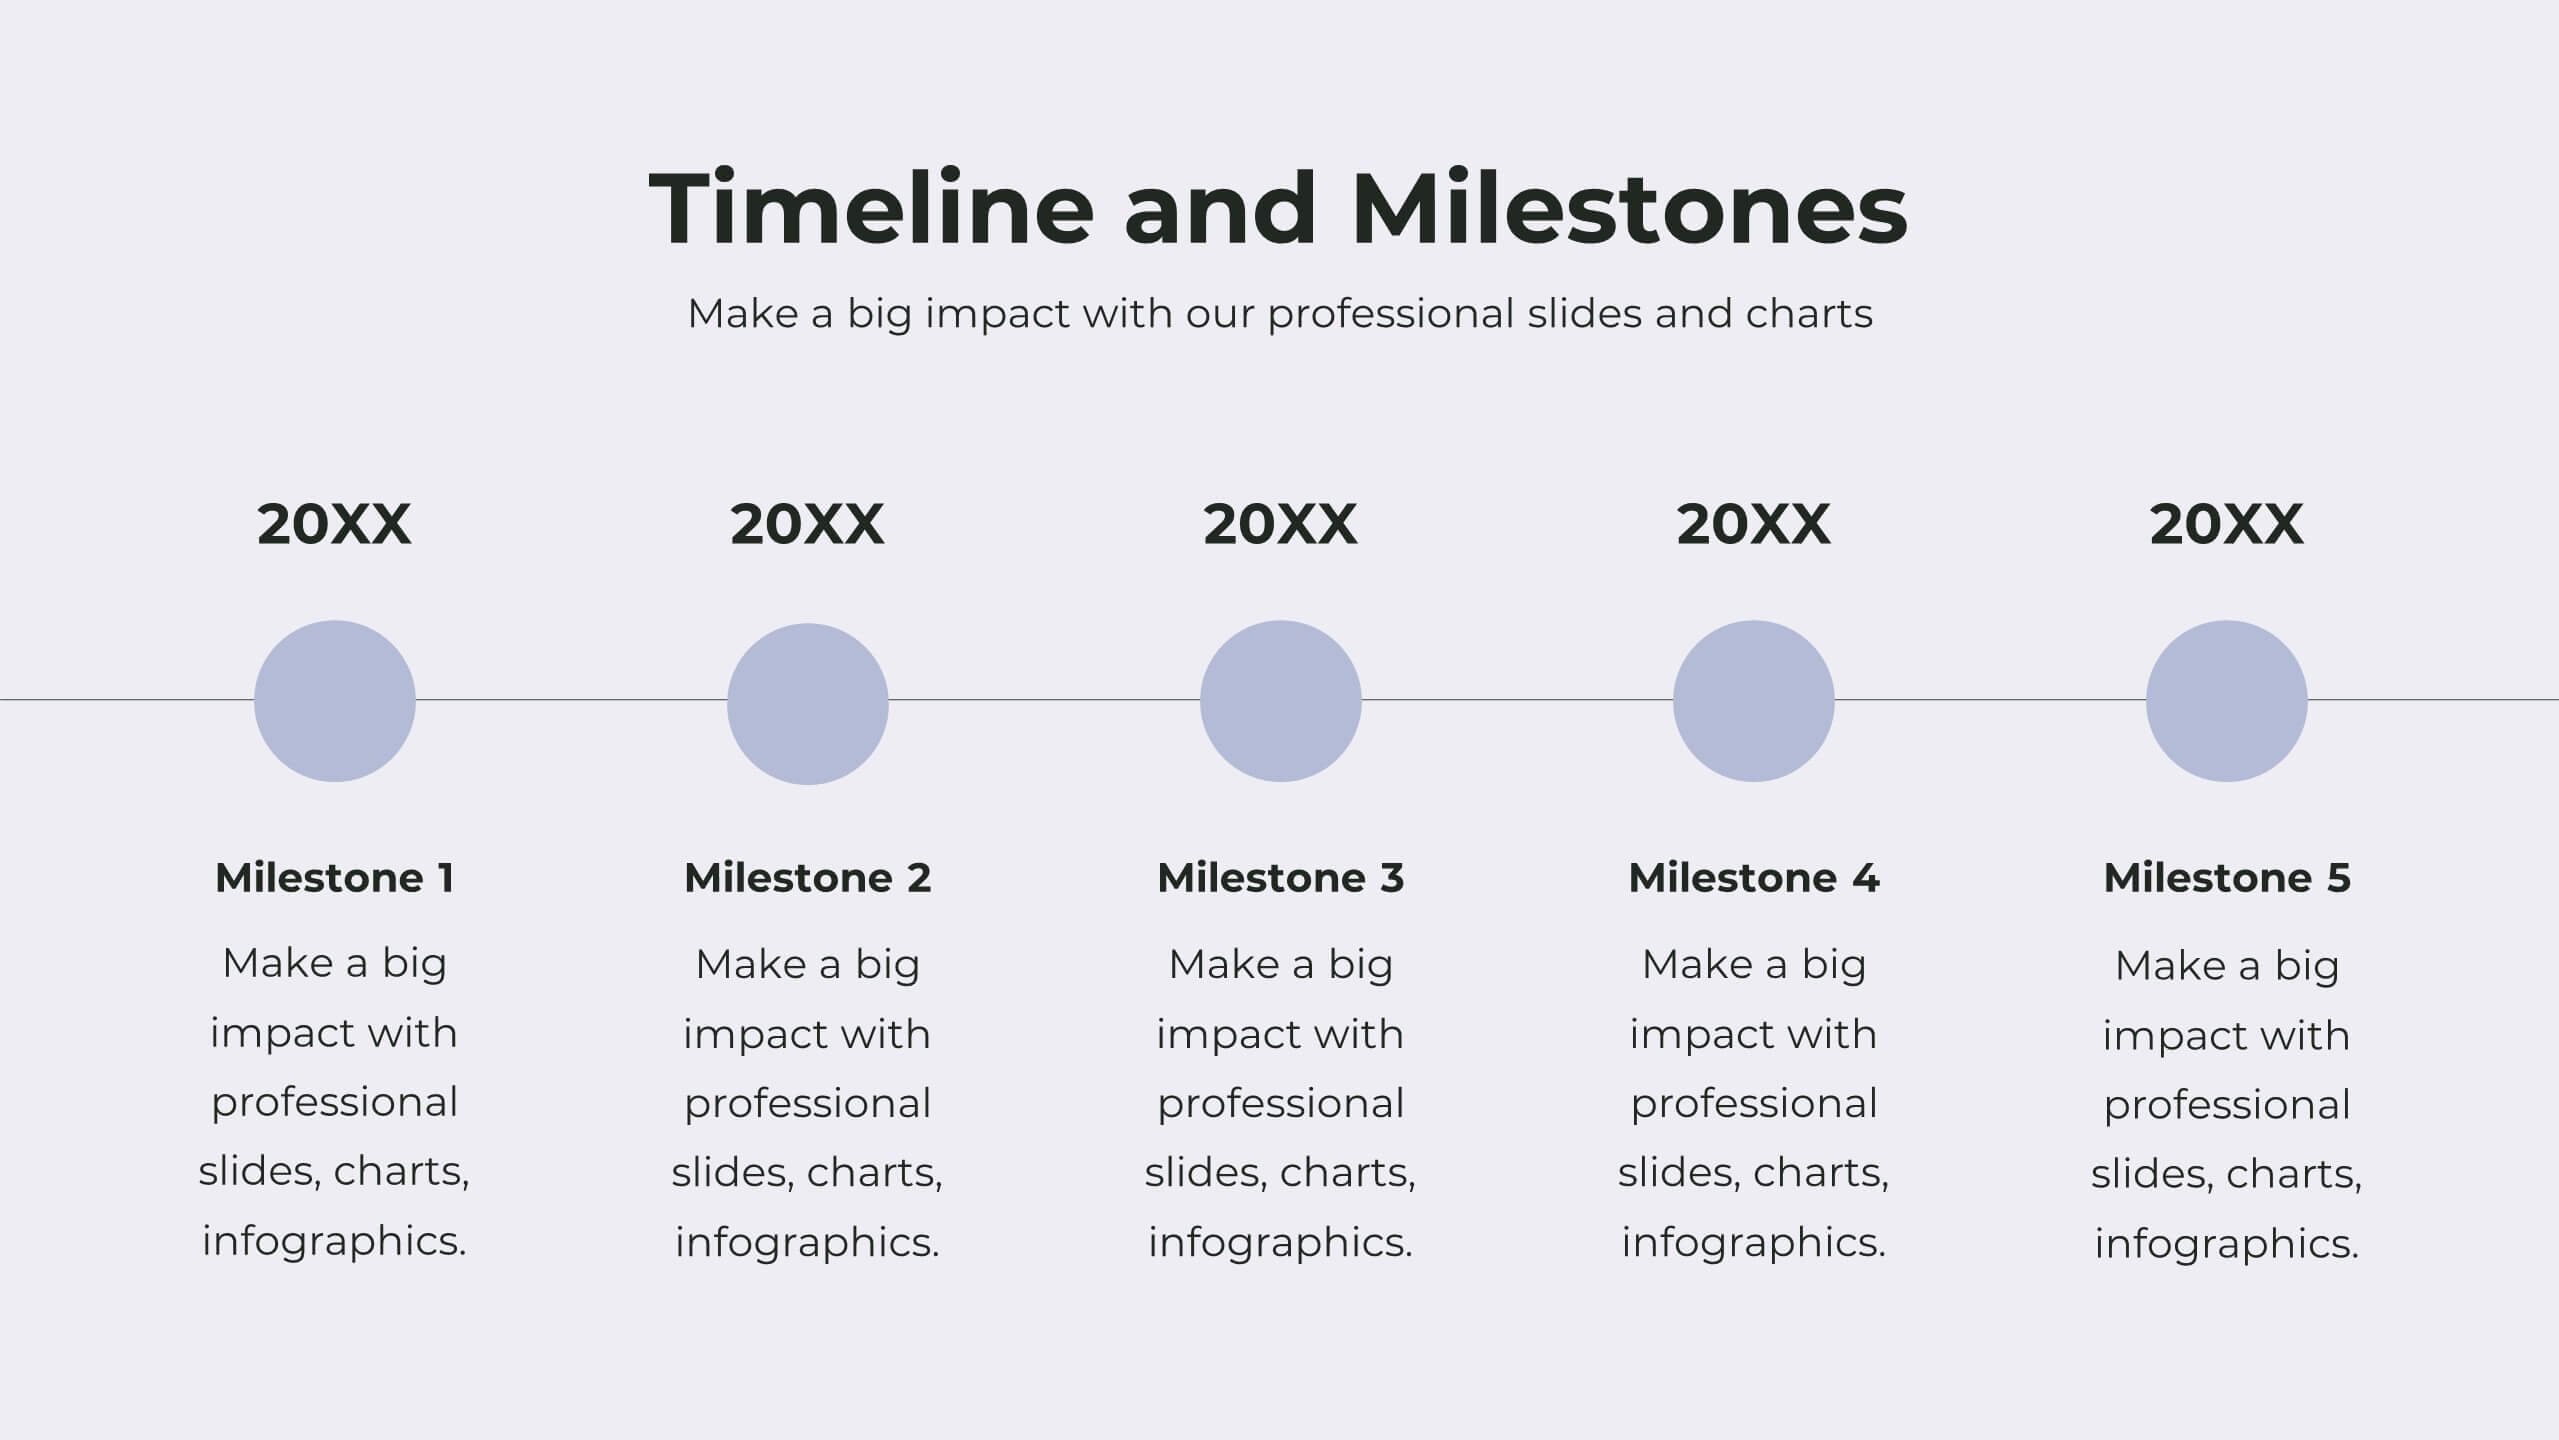
Drive your business forward with this elegant corporate strategy proposal template! Ideal for outlining strategic objectives, competitive analysis, and growth opportunities, it includes slides for SWOT analysis, resource allocation, and performance metrics. Impress stakeholders with clear visuals and structured content. Compatible with PowerPoint, Keynote, and Google Slides for seamless presentations on any platform.


7 slides
Asia Map Overview Infographic
Dive into the vast and varied landscape of Asia with our collection of infographic slides designed to provide an insightful overview of the continent. These templates are ideal for educators, business professionals, and researchers looking to present data on Asia’s geography, demographics, economic status, and more. Each slide is meticulously crafted to display information clearly and attractively, using maps, charts, and icons to represent statistical data and trends across Asia. The different shades and colors used in the maps distinguish between countries, regions, or data points, making it easy for audiences to grasp complex information at a glance. These templates are fully customizable, enabling you to highlight specific areas or data according to your presentation needs. Whether discussing population growth, economic development, or environmental concerns, these slides are an excellent resource for conveying detailed information in a visually engaging format.


7 slides
Environmental Specialist Infographic
An Environmental Specialist, is a professional who focuses on environmental issues and challenges, aiming to develop solutions and strategies to address them. This engaging infographic template is designed to shed light on the critical role of environmental specialists, presenting data, facts, and strategies to inspire and educate on the path towards a sustainable and eco-friendly world. Fully customizable and compatible with Powerpoint, Keynote, and Google Slides. This infographic is your guide to understanding and appreciating the invaluable work of environmental specialists.


4 slides
Types of Insurance Policies Comparison Presentation
Highlight key differences between insurance policies using this shield-themed comparison slide. With space for six categories and clear icon-label pairs, it’s perfect for showcasing coverage types or plan tiers. Fully editable in PowerPoint, Keynote, and Google Slides—ideal for agents, brokers, or internal training on policy features.


6 slides
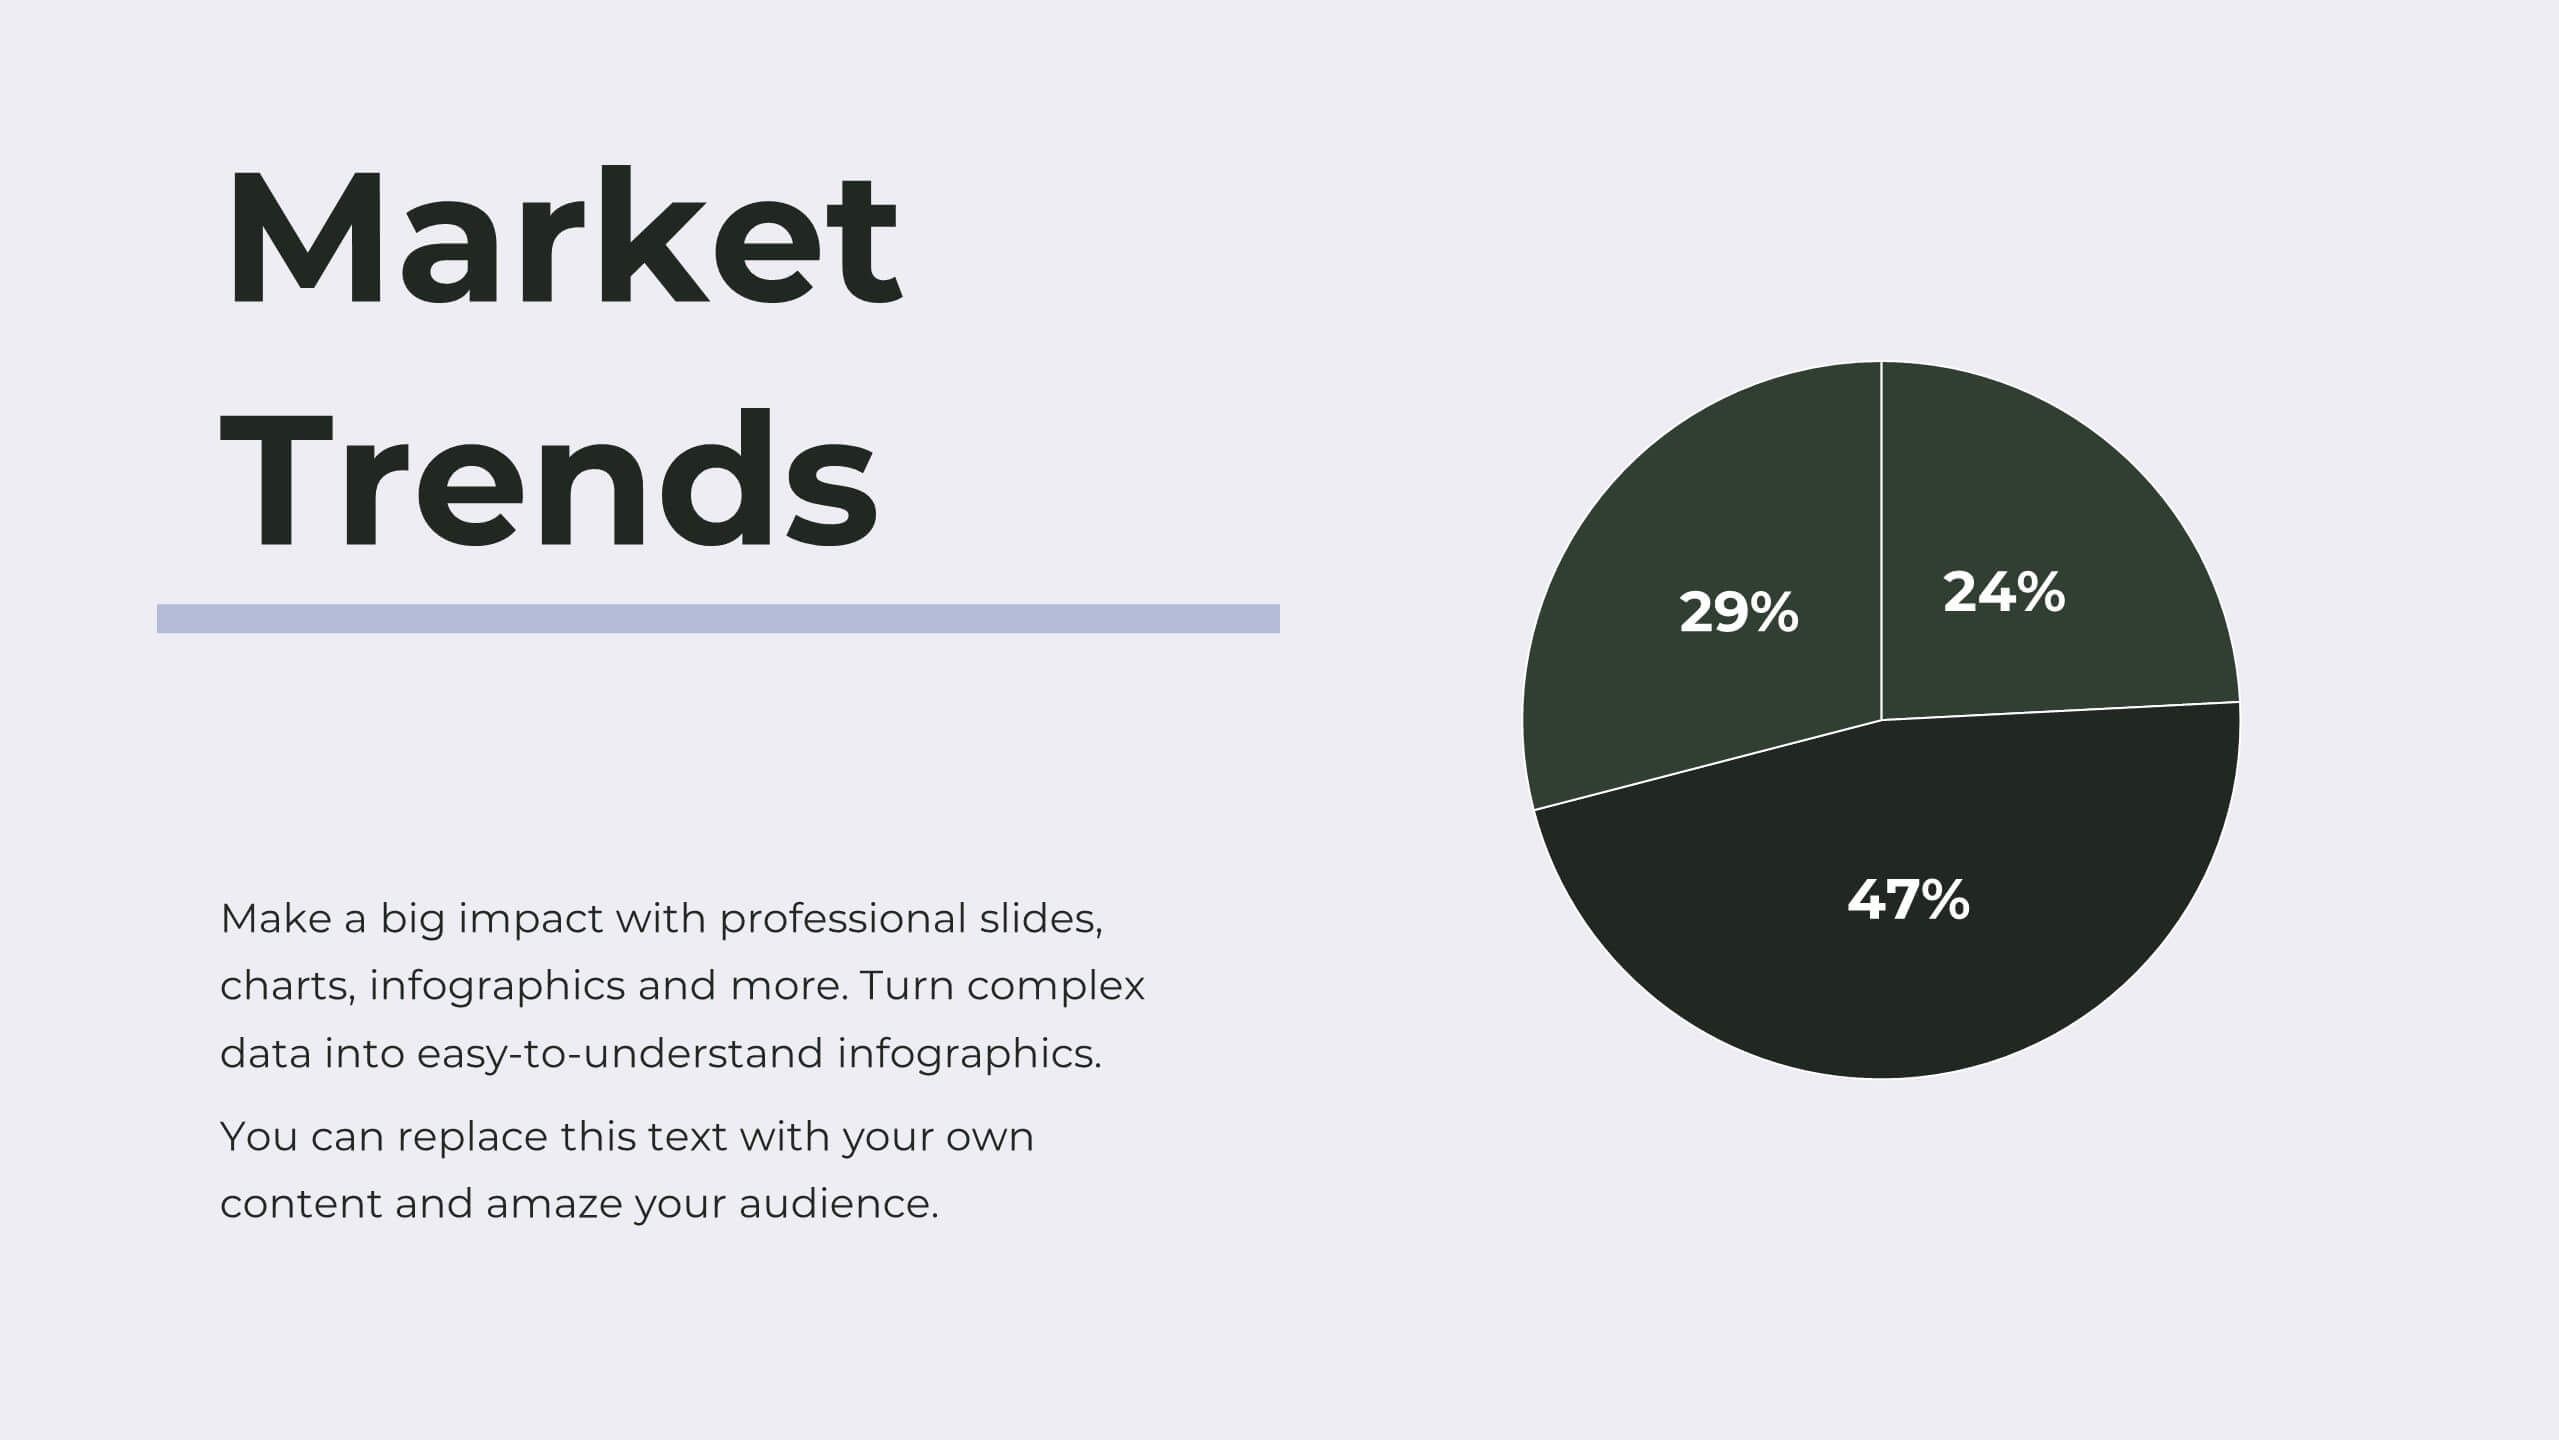
Real Estate and Building Development Presentation
Present key insights into the real estate market with the Real Estate and Building Development template. Designed for property investors and urban planners, this visual framework highlights financial trends, project phases, and market analysis. Fully customizable and compatible with PowerPoint, Keynote, and Google Slides for seamless presentation delivery.


5 slides
Cyber Security Statistics Infographics
Cybersecurity refers to the practice of protecting computer systems, networks, and digital information from unauthorized access, data breaches, theft, or damage. These infographic templates are designed to help educate and raise awareness about the importance of protecting digital assets and staying vigilant against cyber threats. They allow you to effectively communicate the significance of cybersecurity through cyber icons and compelling statistics. This is useful for organizations, educational institutions, and individuals who want to promote awareness and encourage proactive measures to protect against cyber threats.


6 slides
Green Innovation and Eco Impact Presentation
Present your sustainability initiatives with this circular eco infographic. Ideal for showcasing six stages of environmental impact, green innovation, or lifecycle analysis. Features clean, modern icons and color-coded segments. Fully editable in PowerPoint, Keynote, and Google Slides—perfect for corporate ESG updates, eco campaigns, or environmental project planning.


7 slides
South America Countries Map Infographic
This South America Countries Map infographic template is designed for detailed presentations on the geographical and statistical information of South American countries. Compatible with PowerPoint, Google Slides, and Keynote, the template set includes maps with data points indicating various statistics such as population percentages, and demographic information. Visual aids like pie charts, bar graphs, and icon representations help to depict data in an easily understandable manner. The color-coding and labels are clear, making it easy to differentiate between countries and regions. This template is ideal for educators, analysts, and business professionals needing to present country-specific data across South America.


7 slides
Simple Table of Content Slide Presentation
A clean, structured layout makes it easy to guide your audience through key sections with clarity and flow. This simple table of content slide helps you introduce topics, outline ideas, and set expectations in a polished, professional way. Fully compatible with PowerPoint, Keynote, and Google Slides.