


Features
- 5 Unique slides
- Fully editable and easy to edit in Microsoft Powerpoint, Keynote and Google Slides
- 16:9 widescreen layout
- Clean and professional designs
- Export to JPG, PDF or send by email


Do you have any questions?
Recommend
22 slides
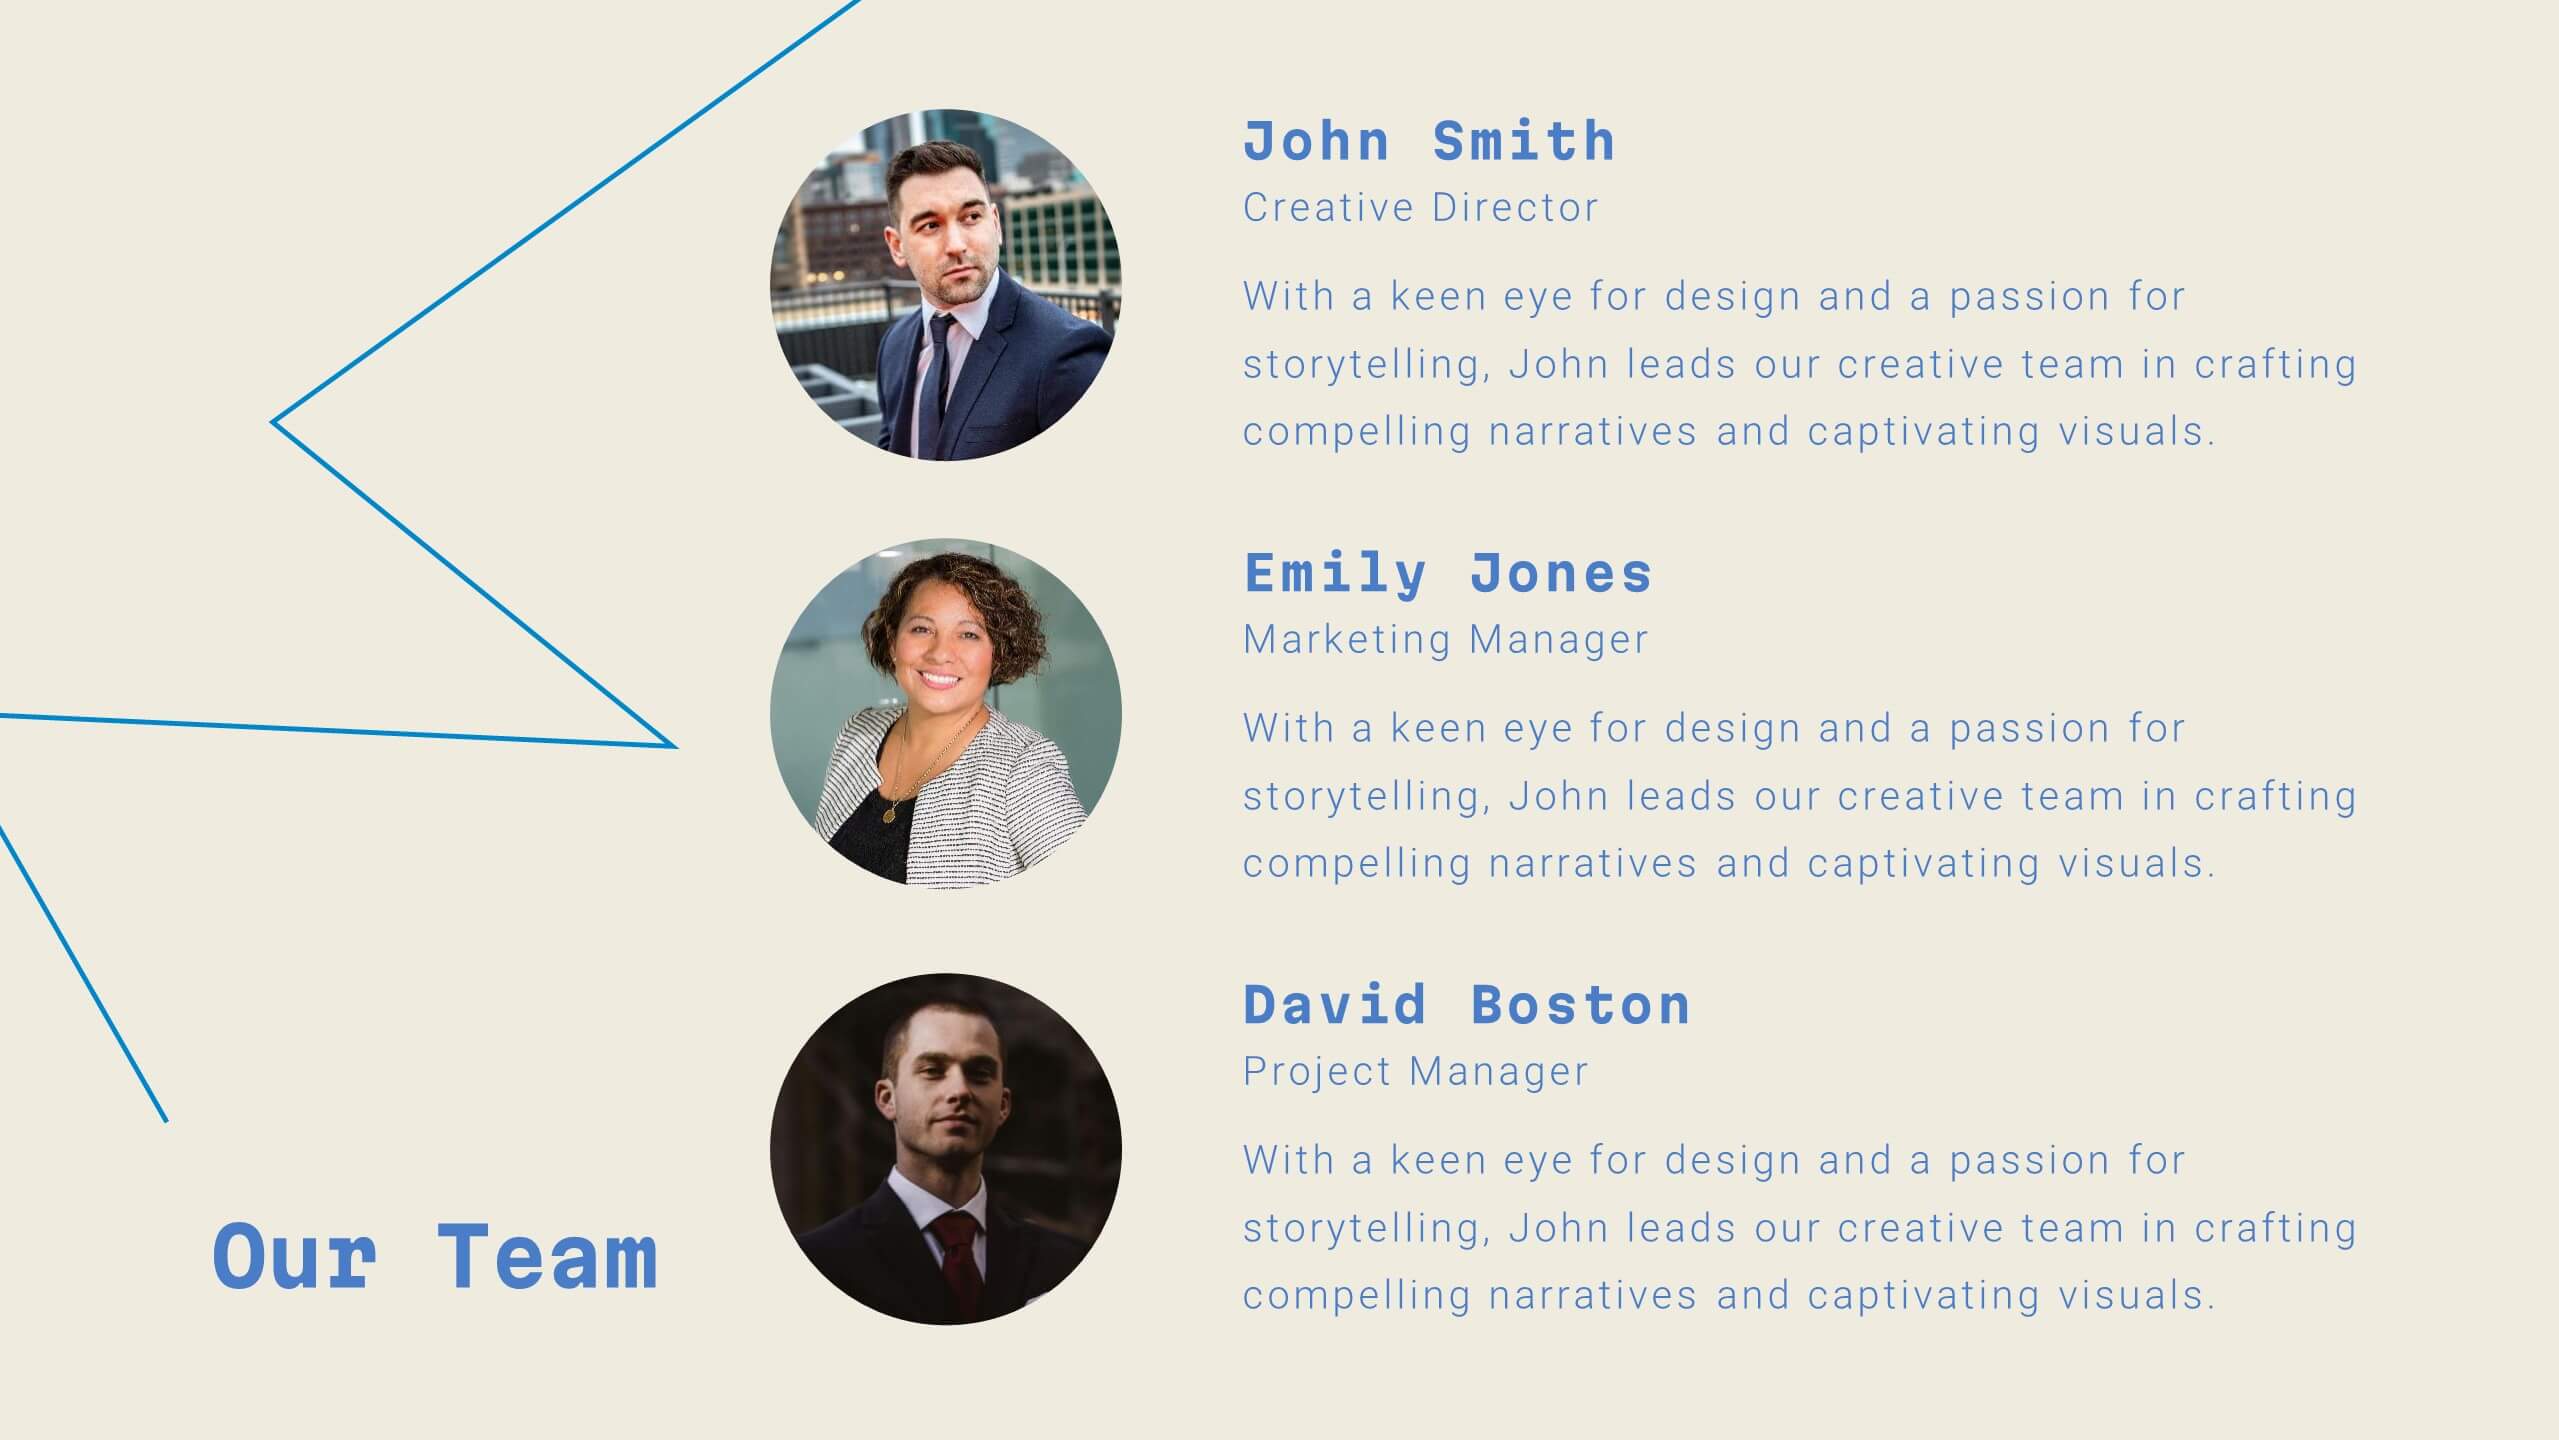
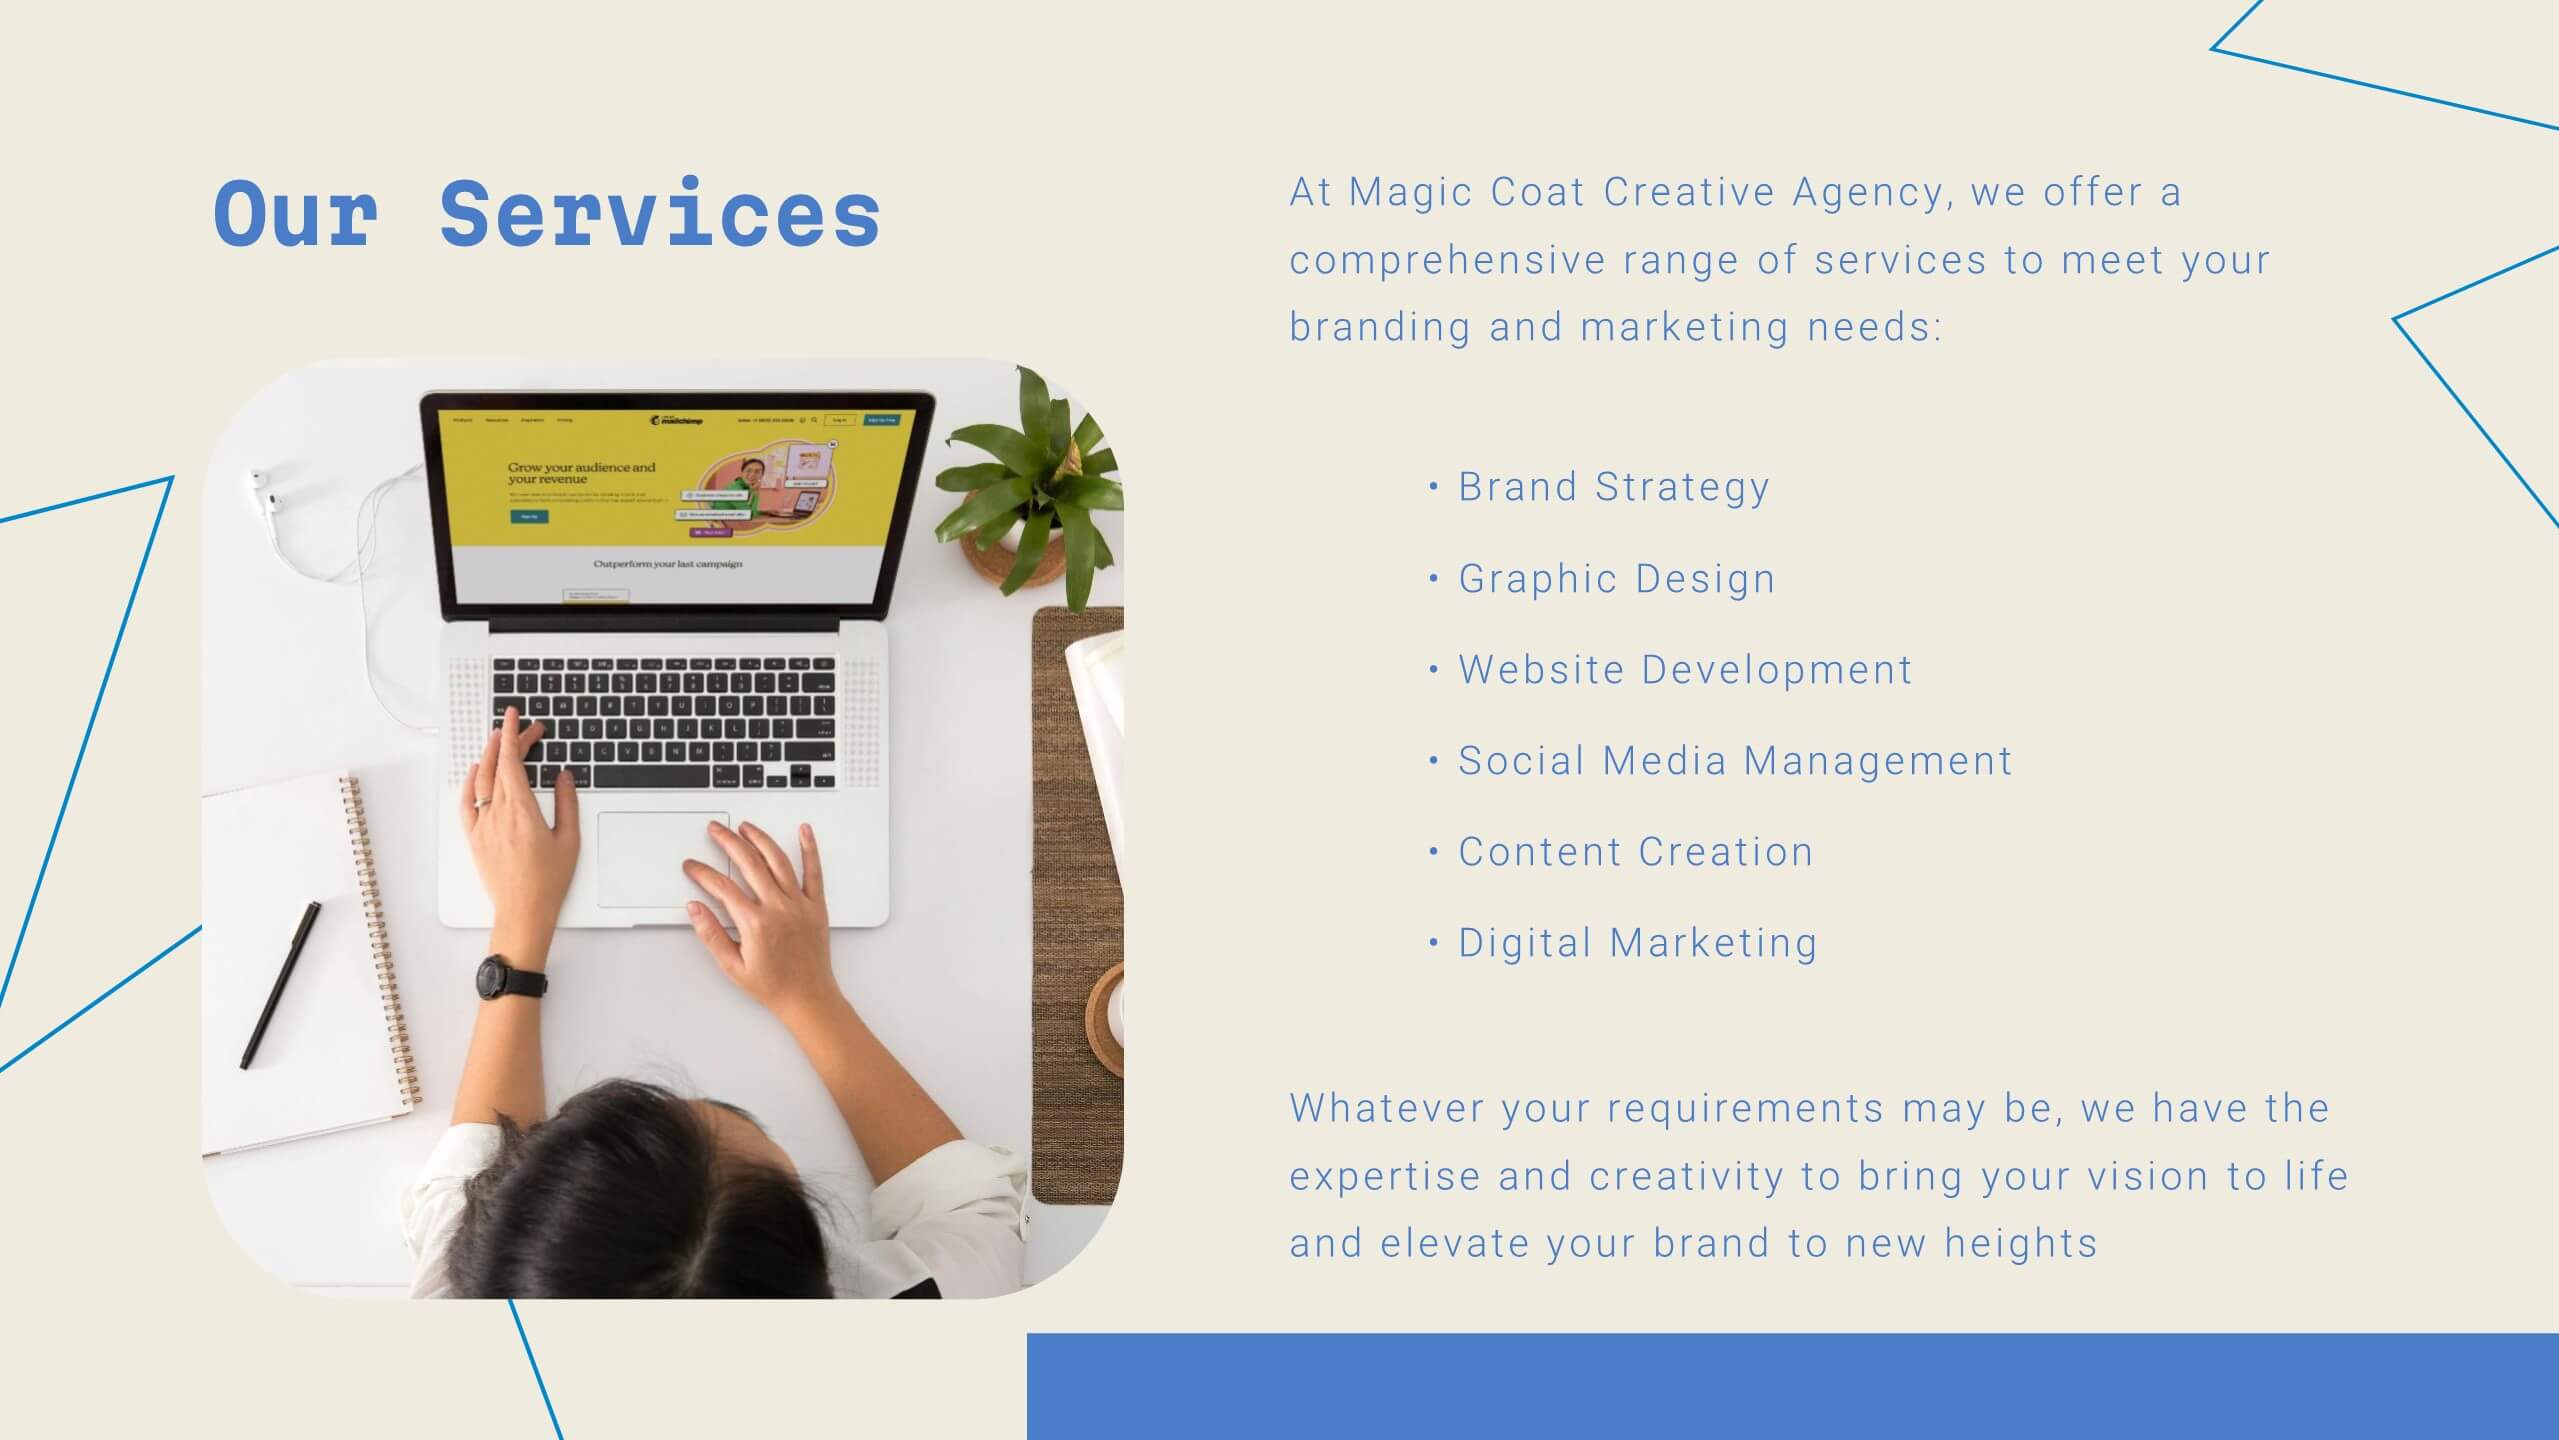
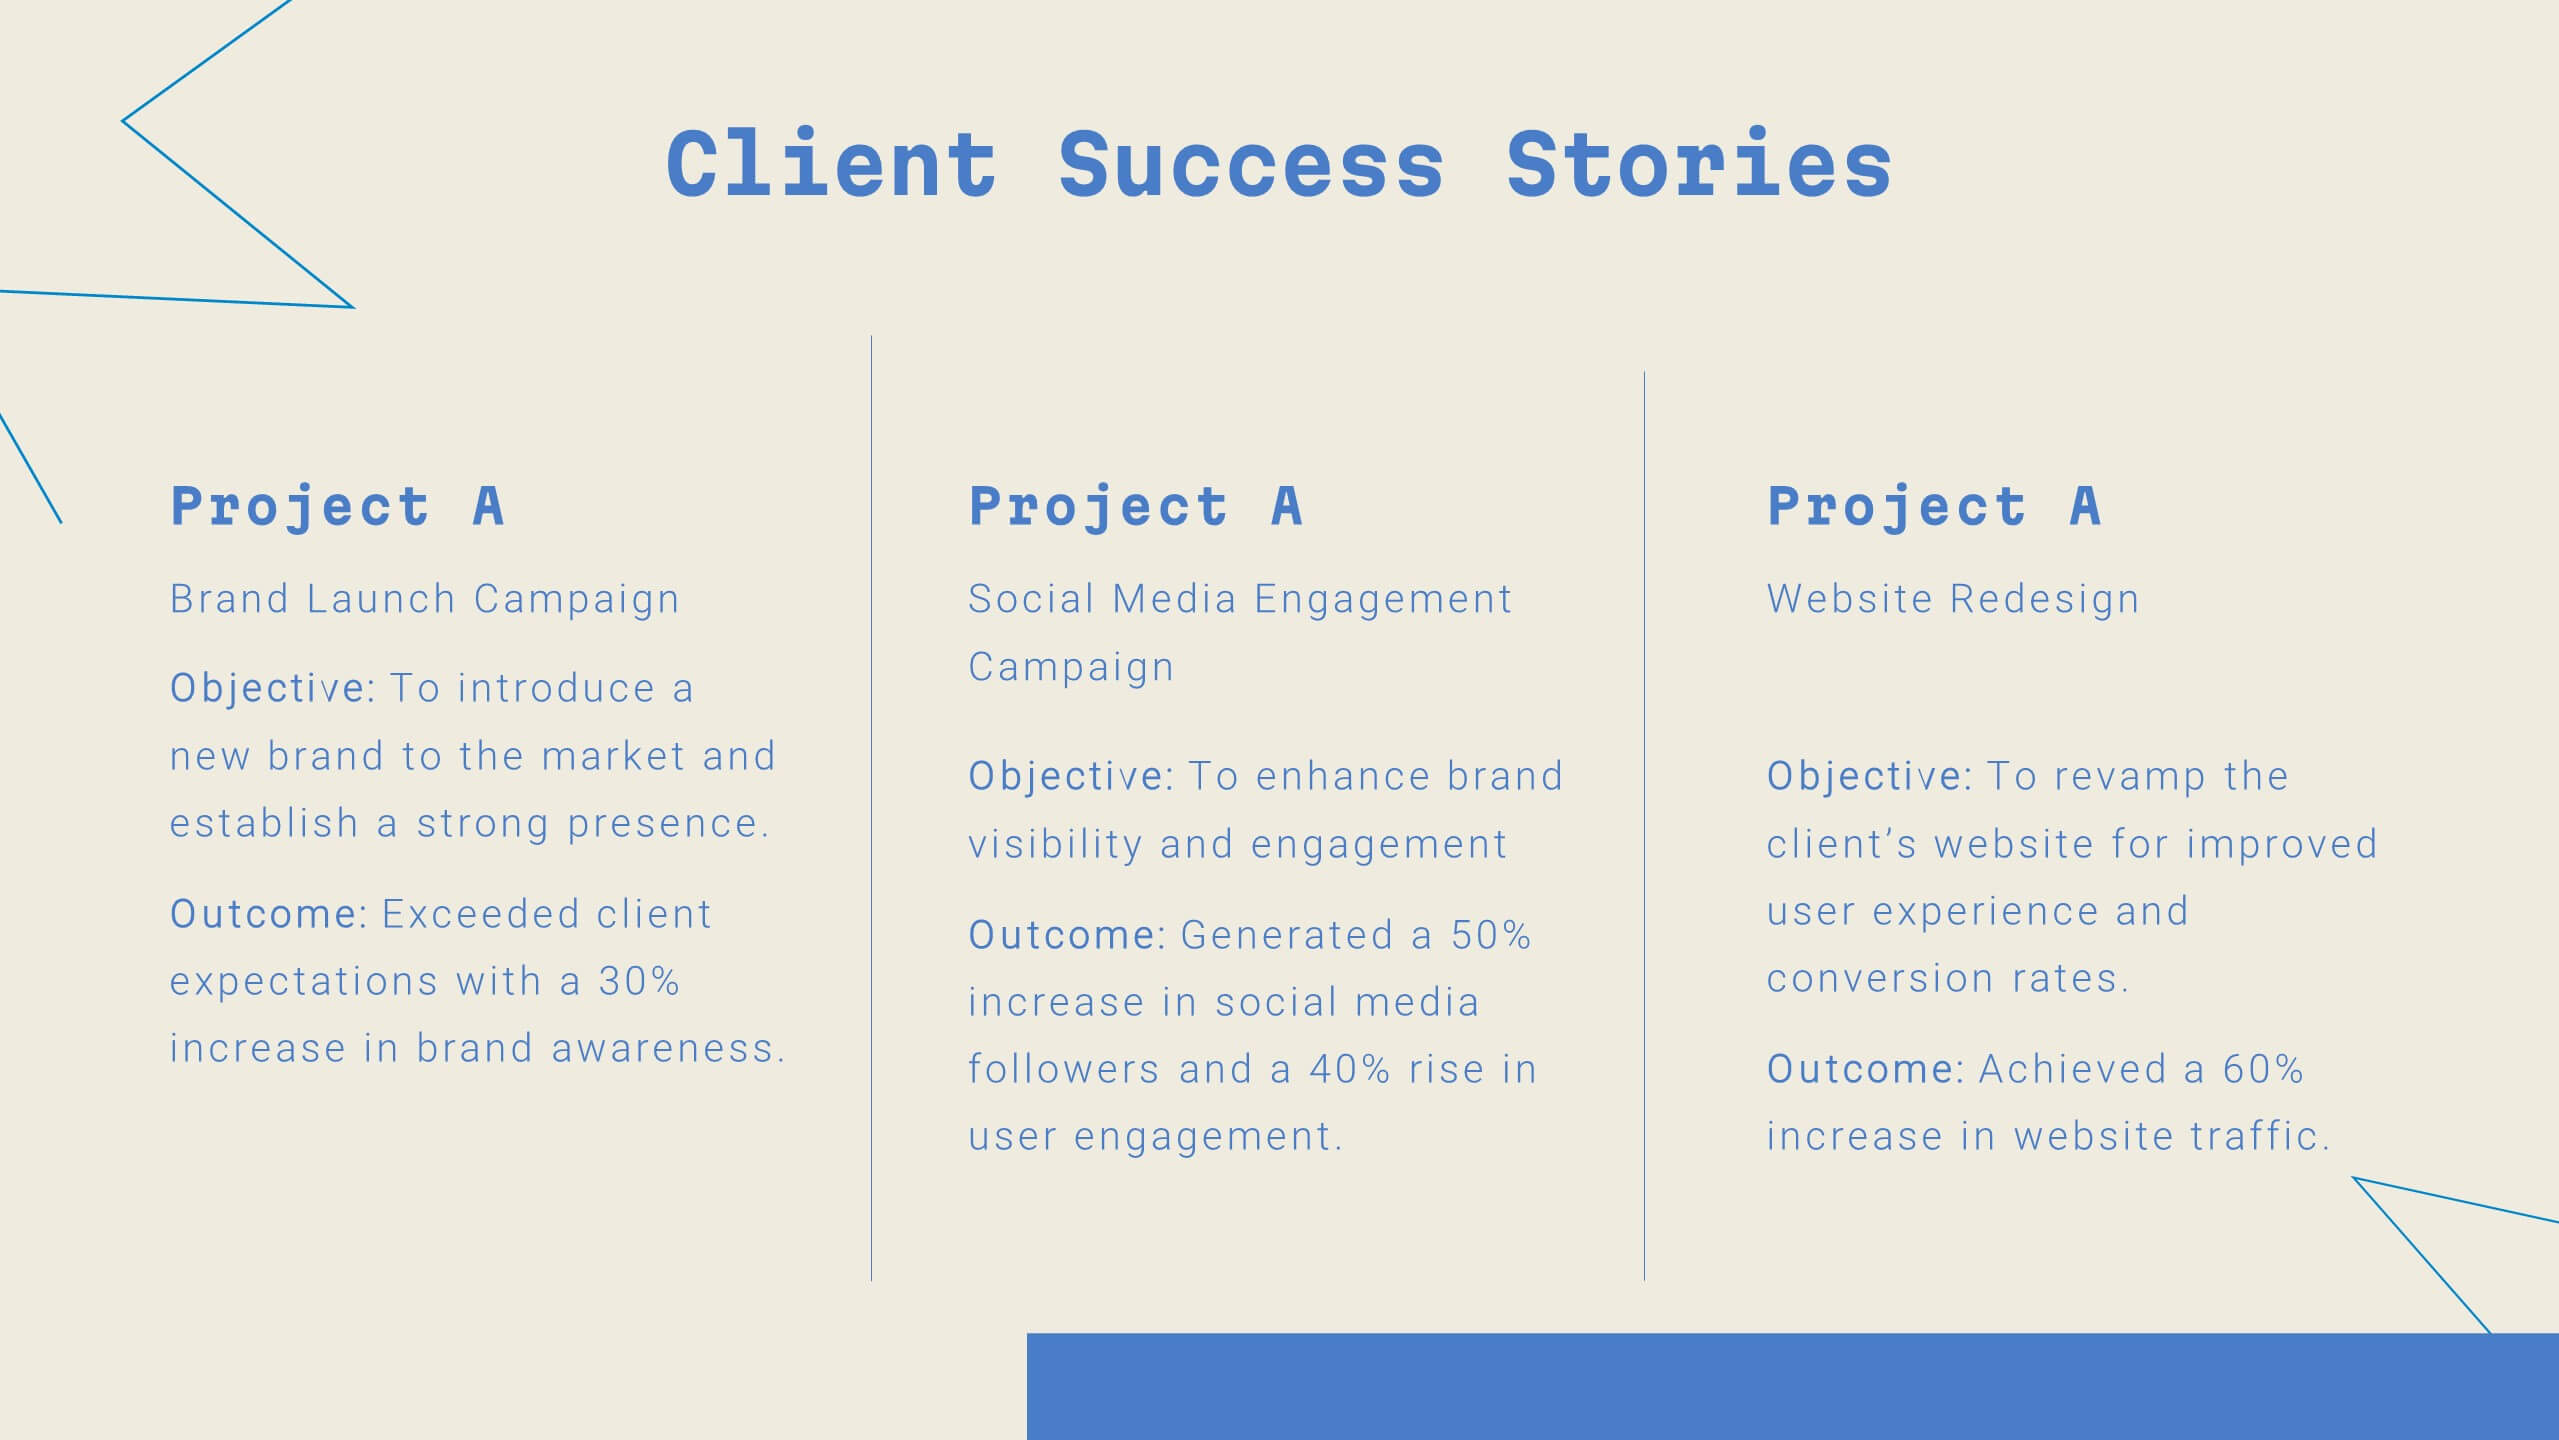
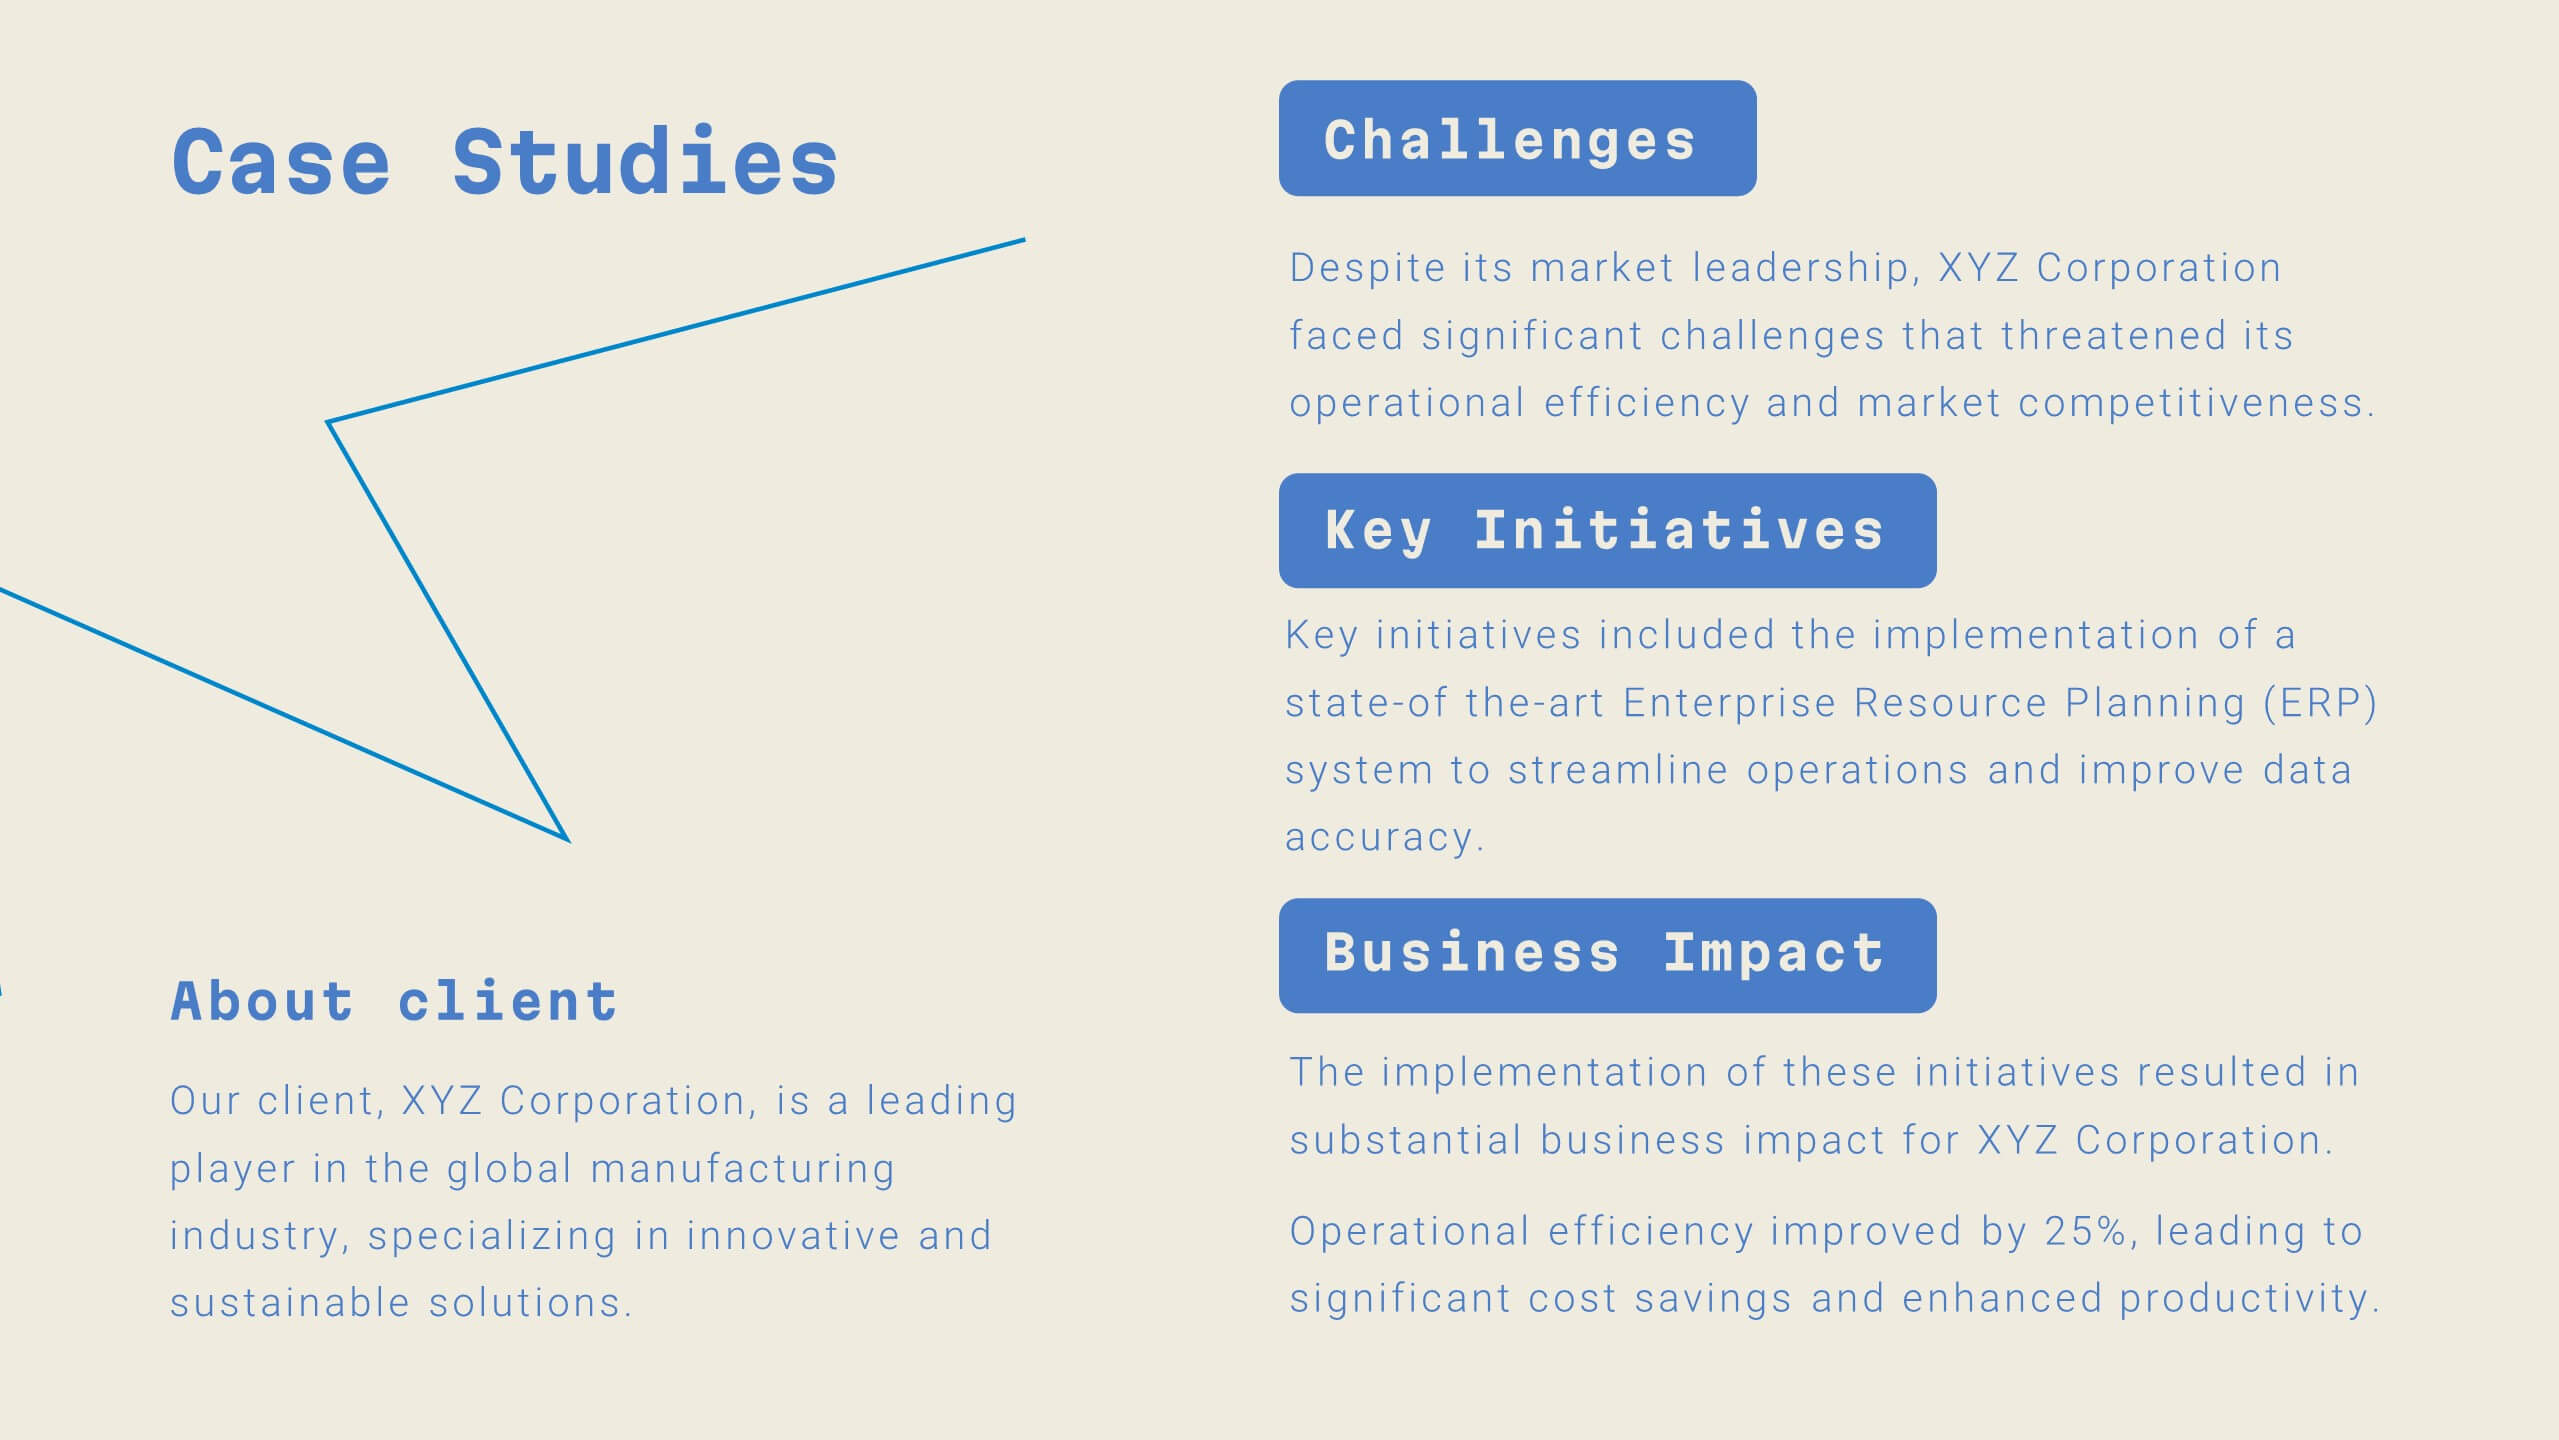
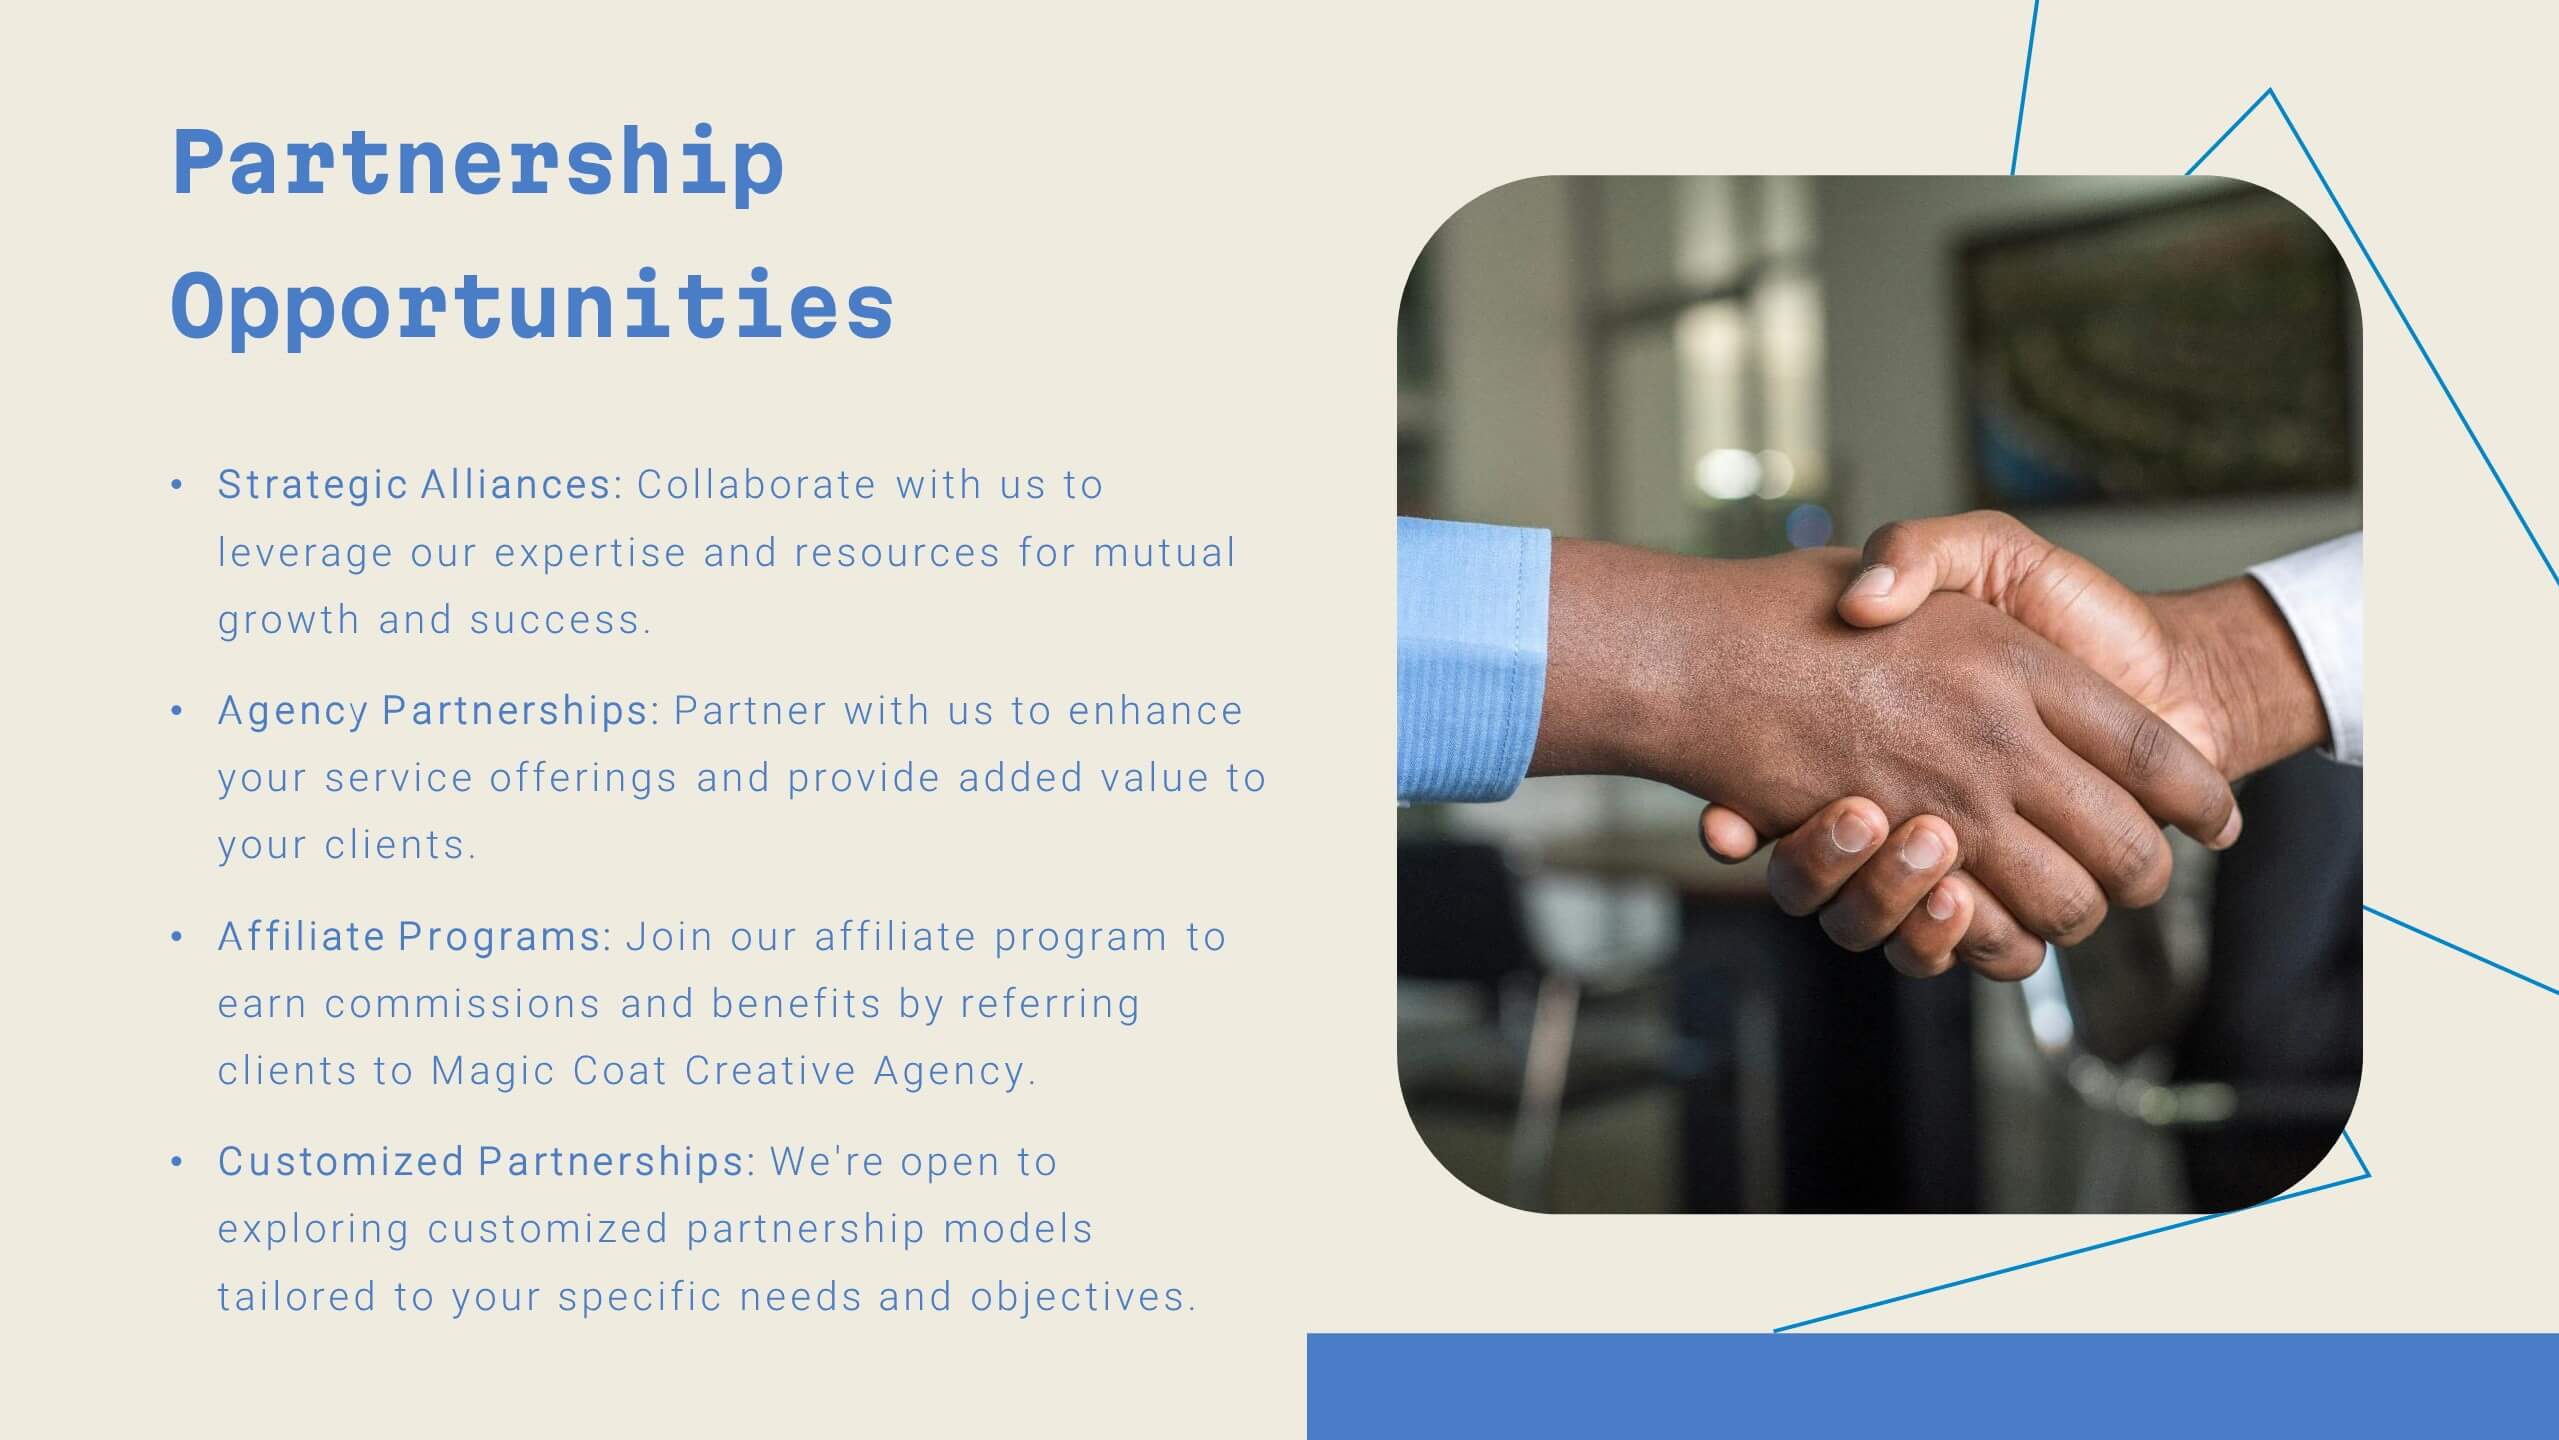
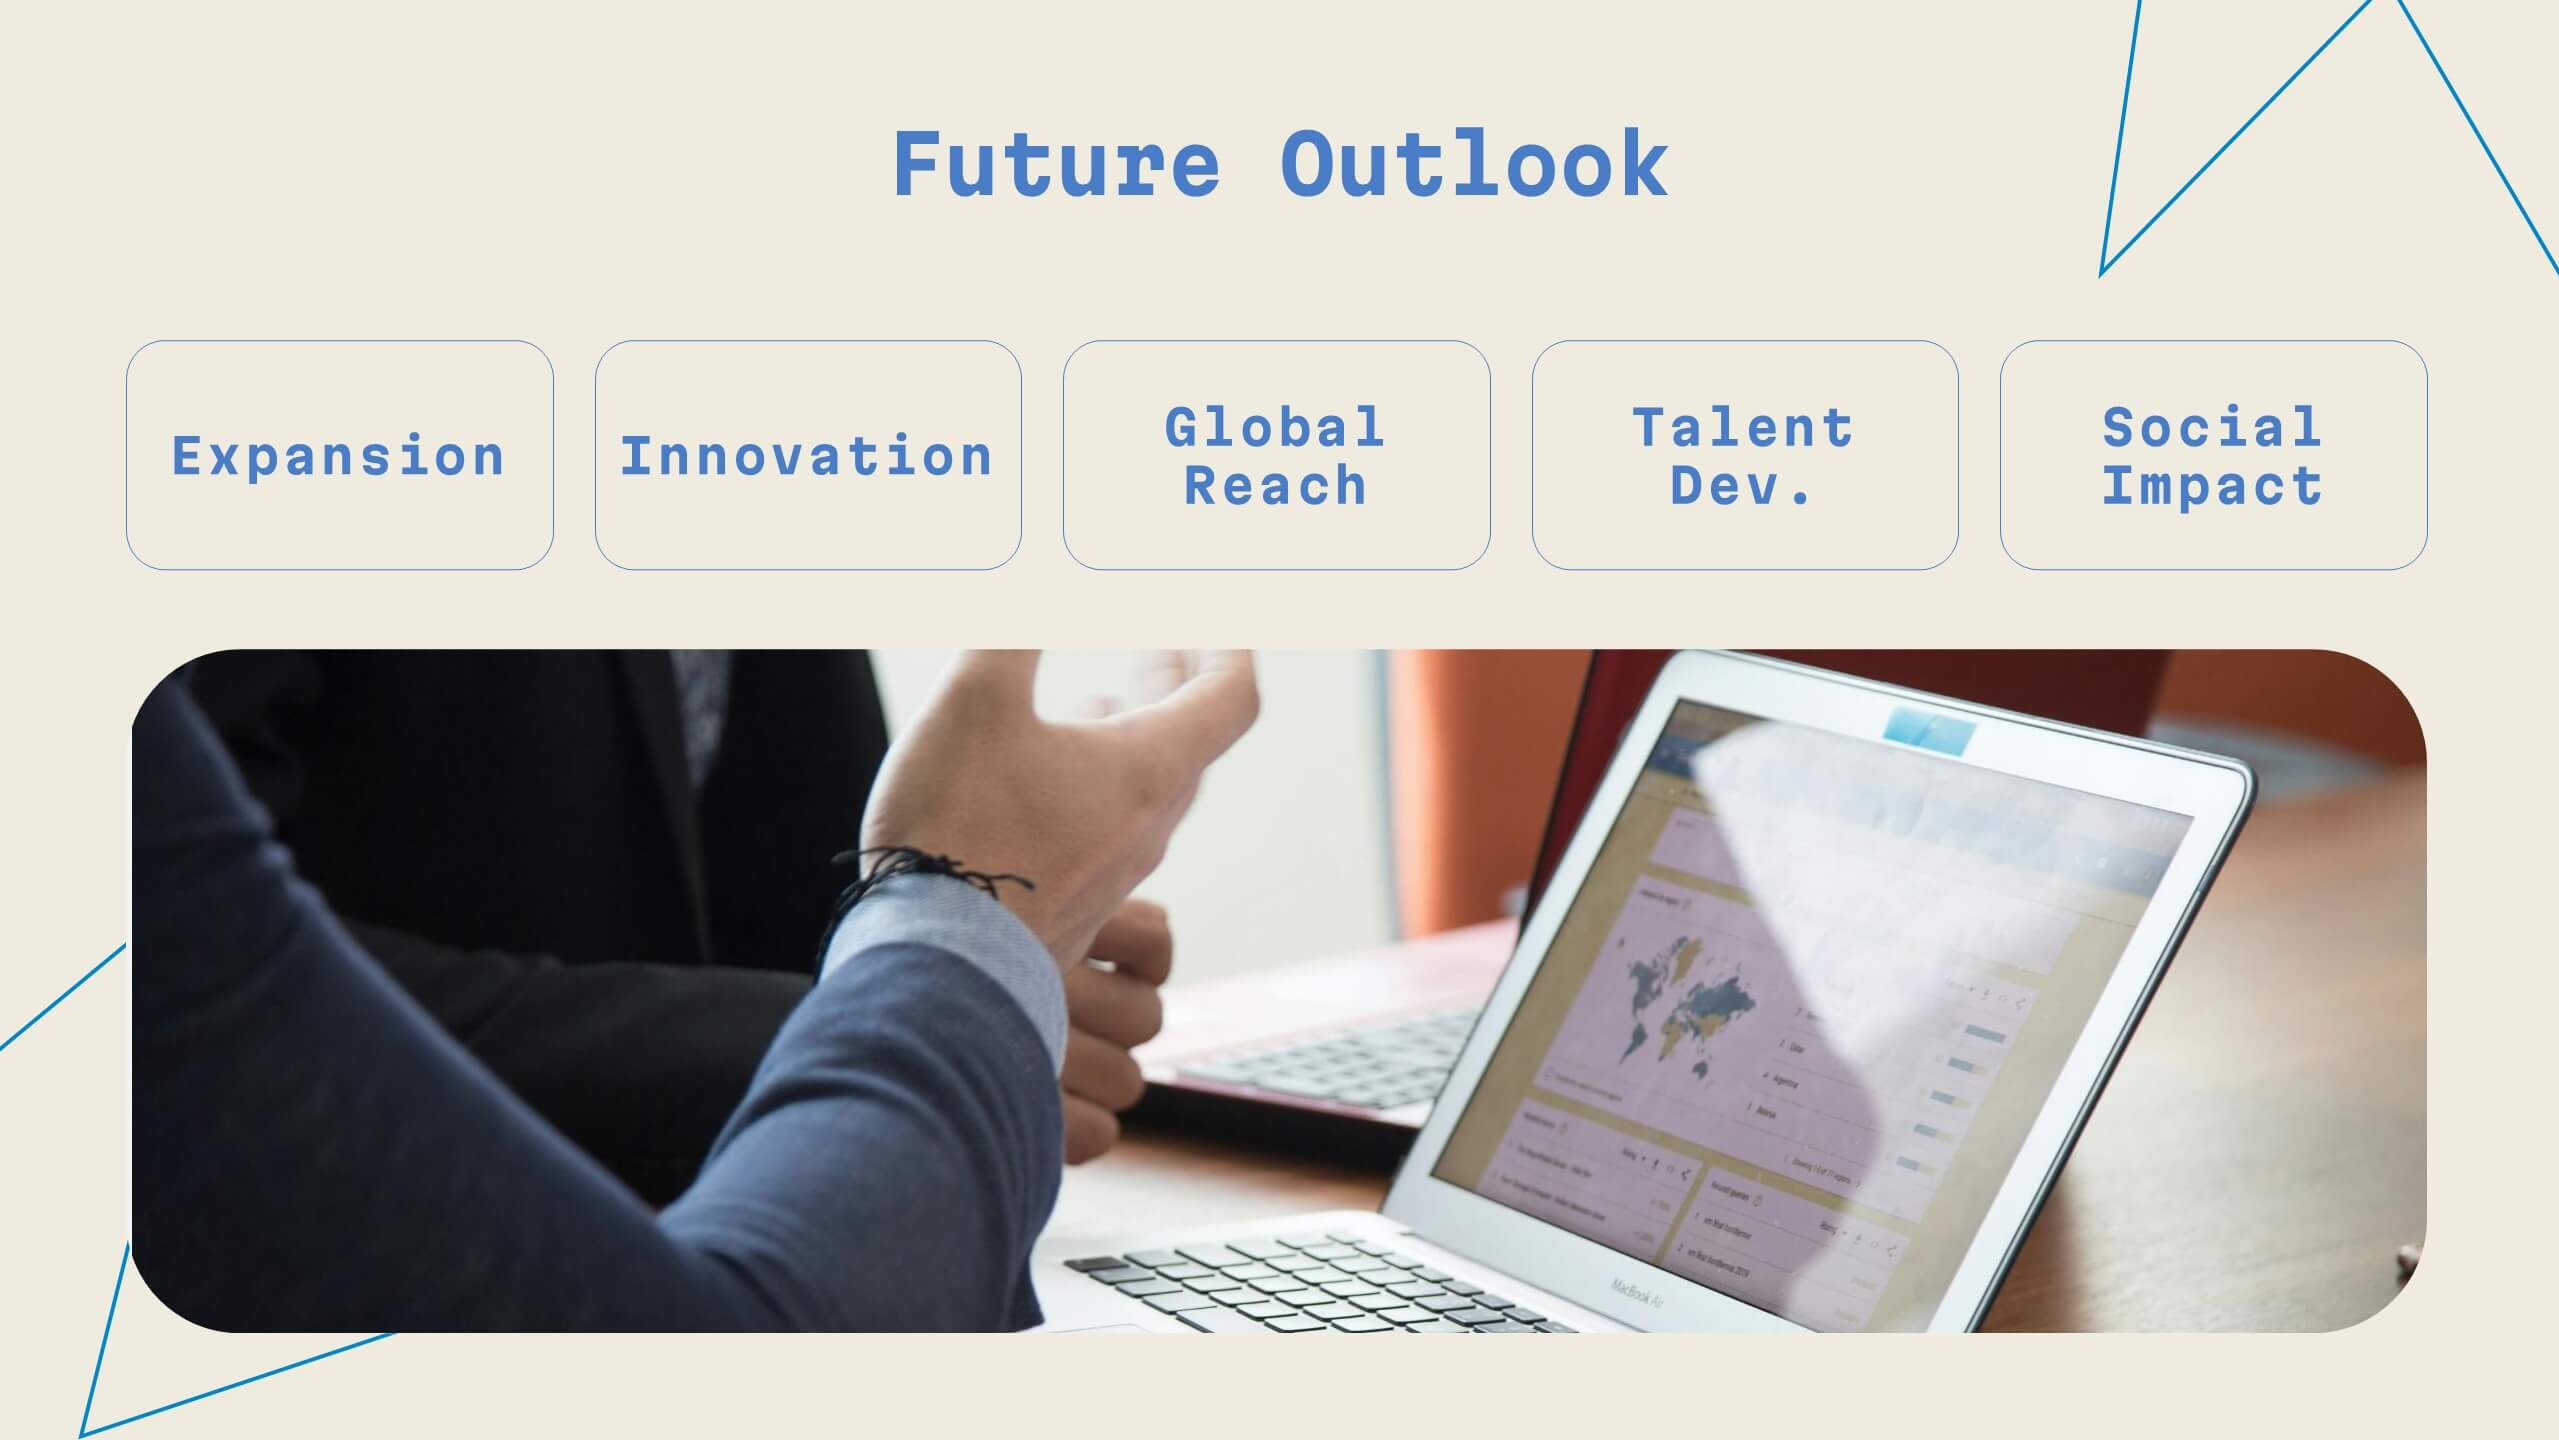
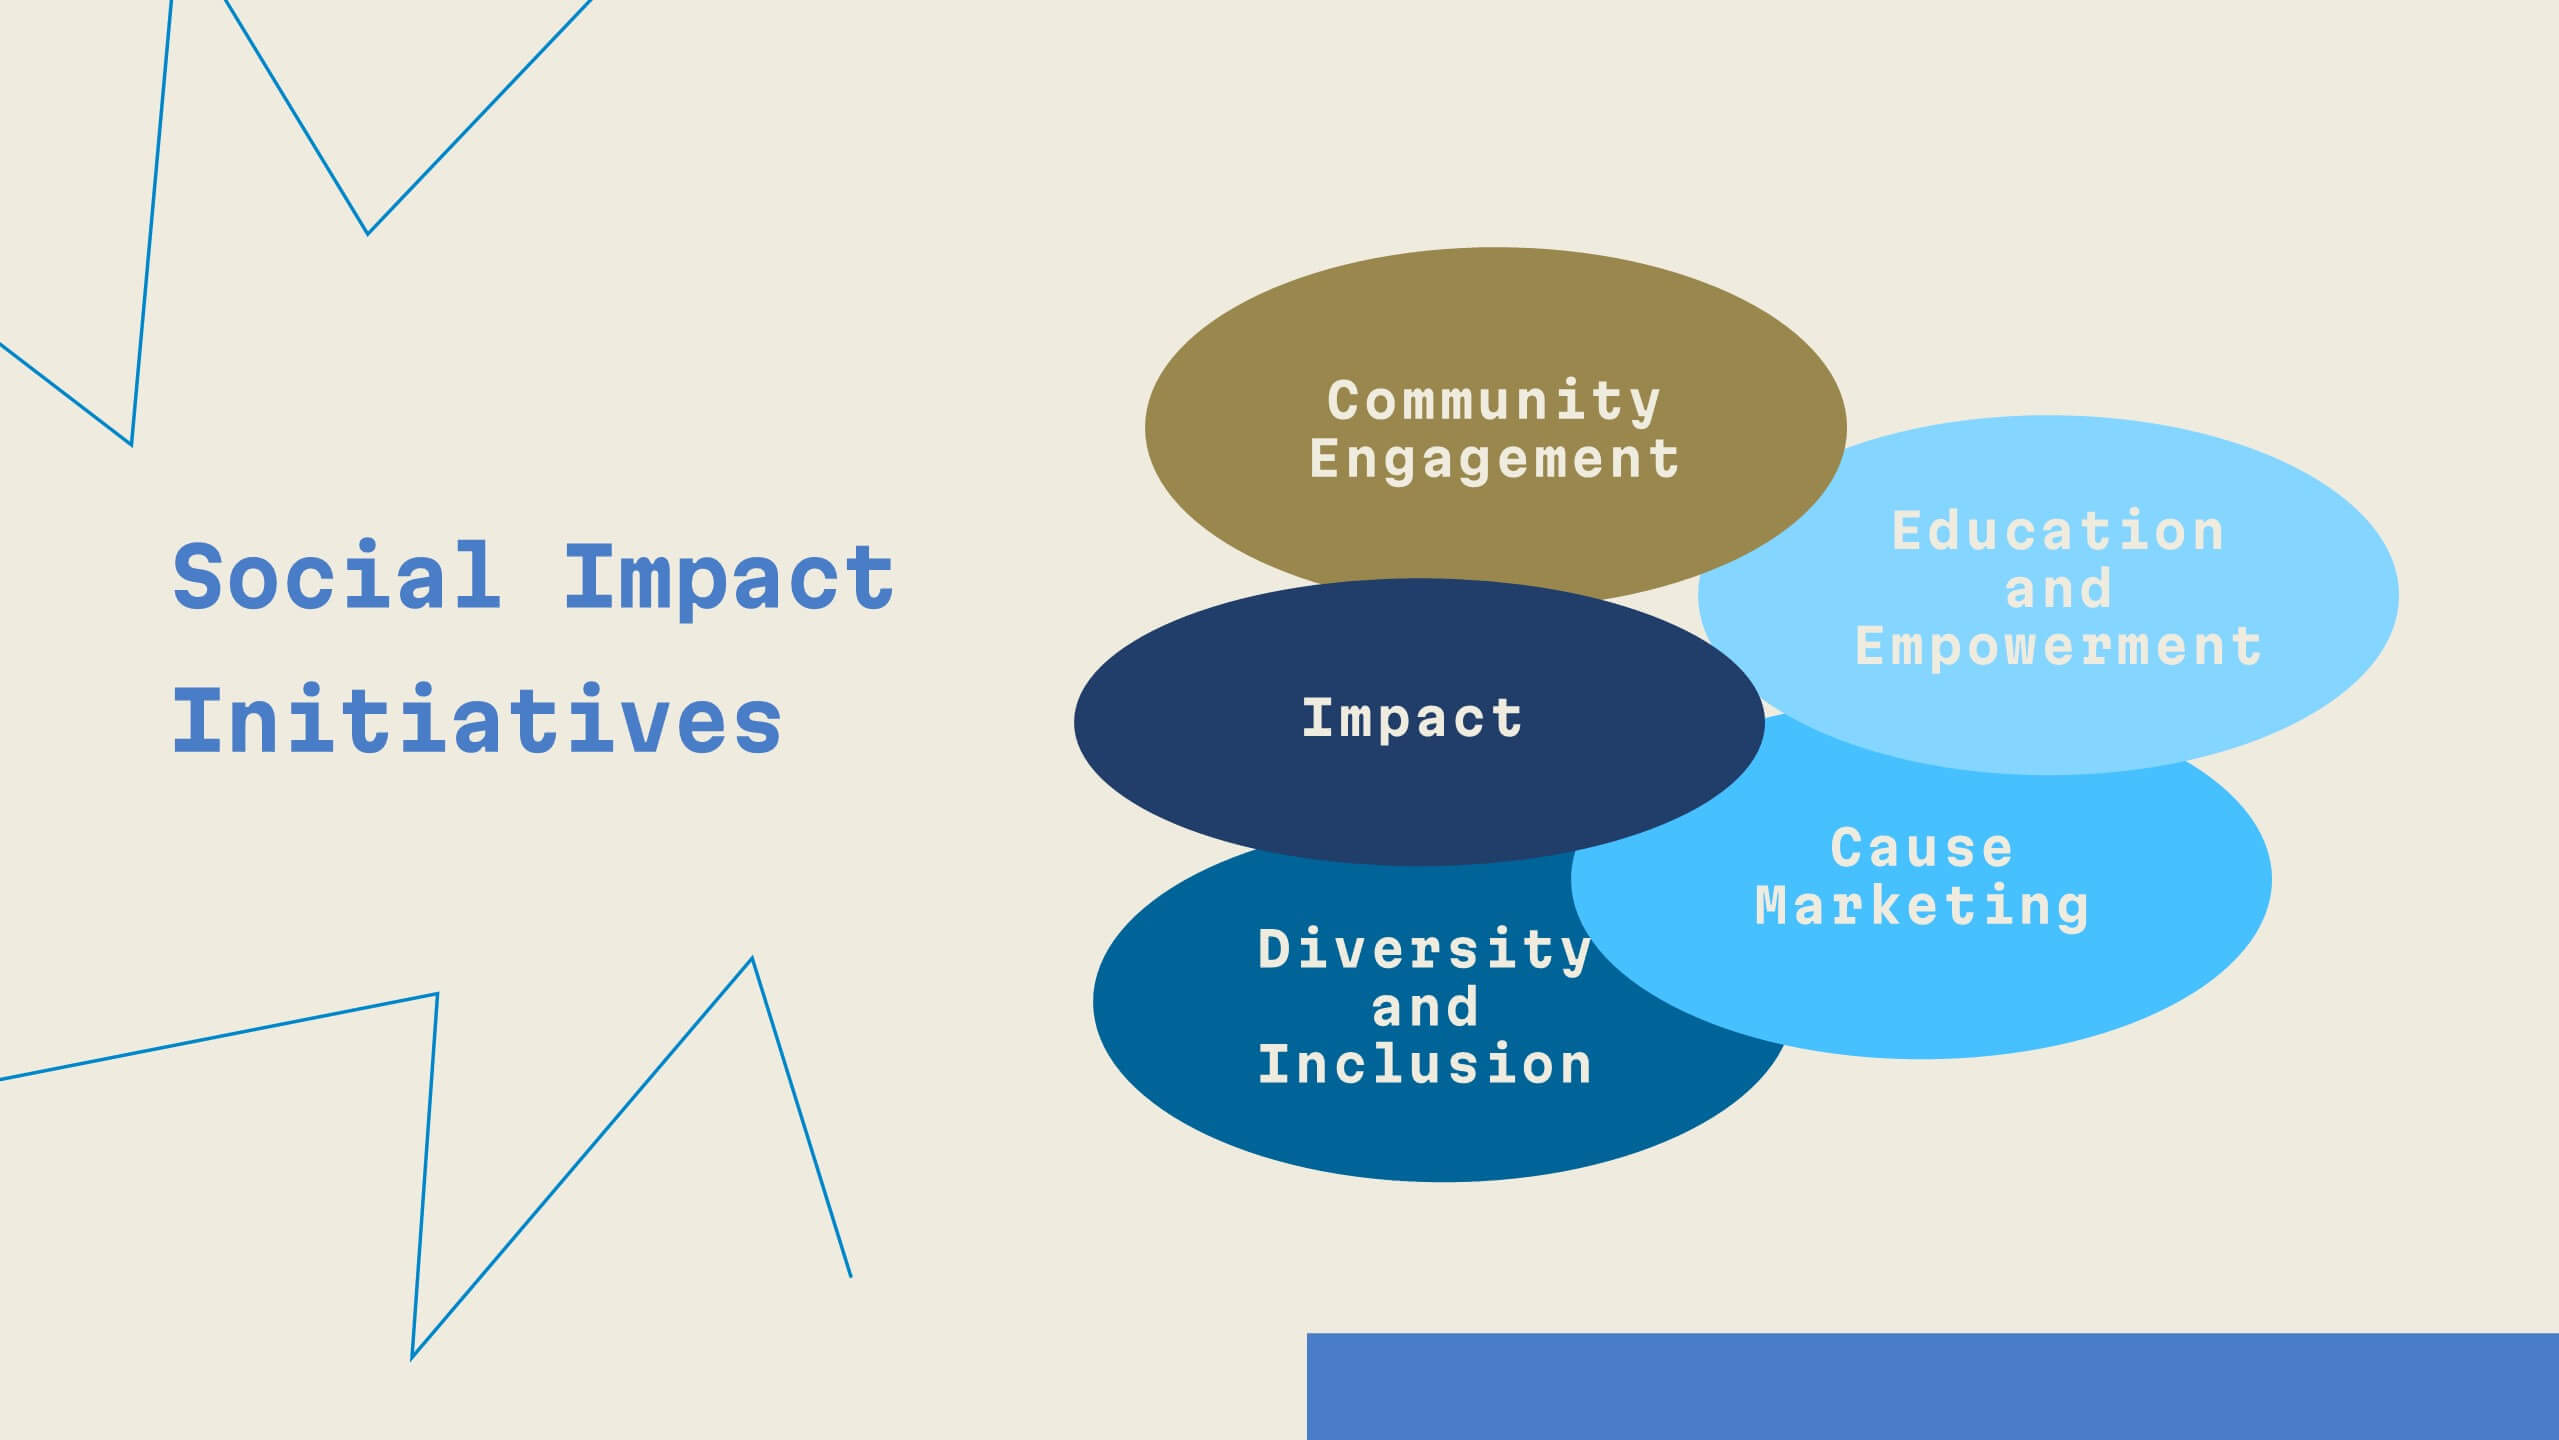
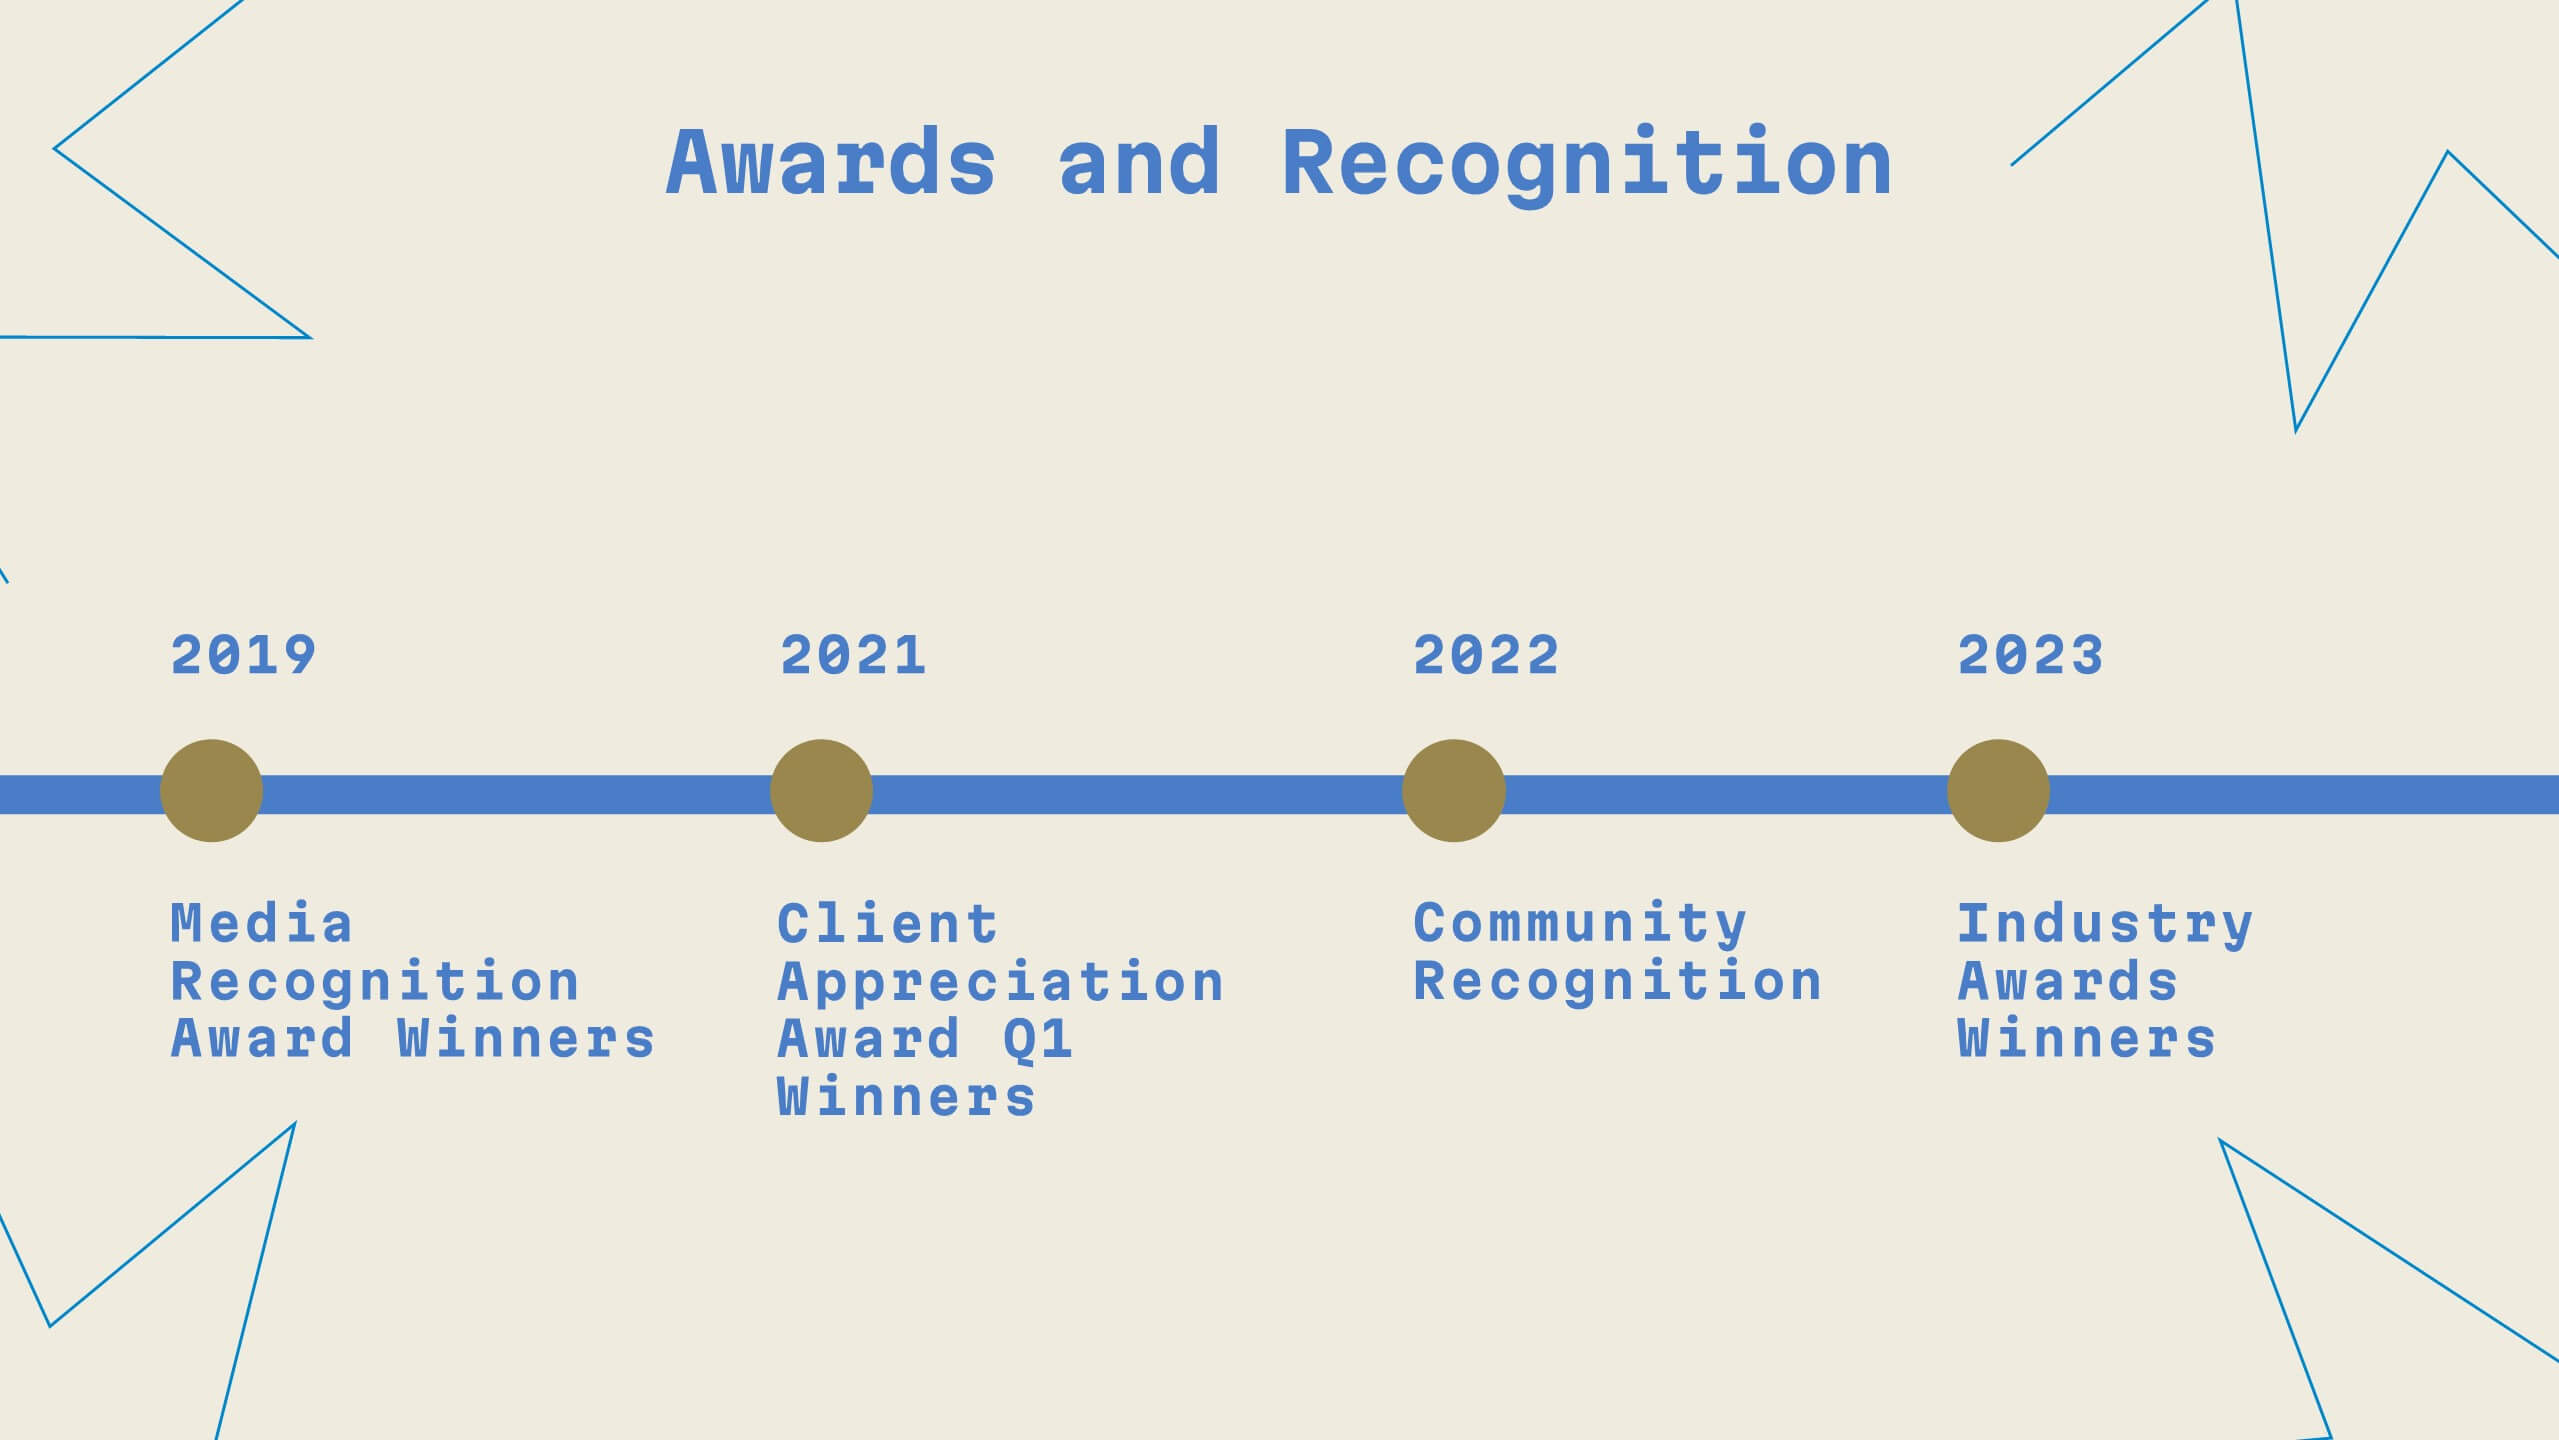
Unity Digital Agency Strategy Plan Presentation
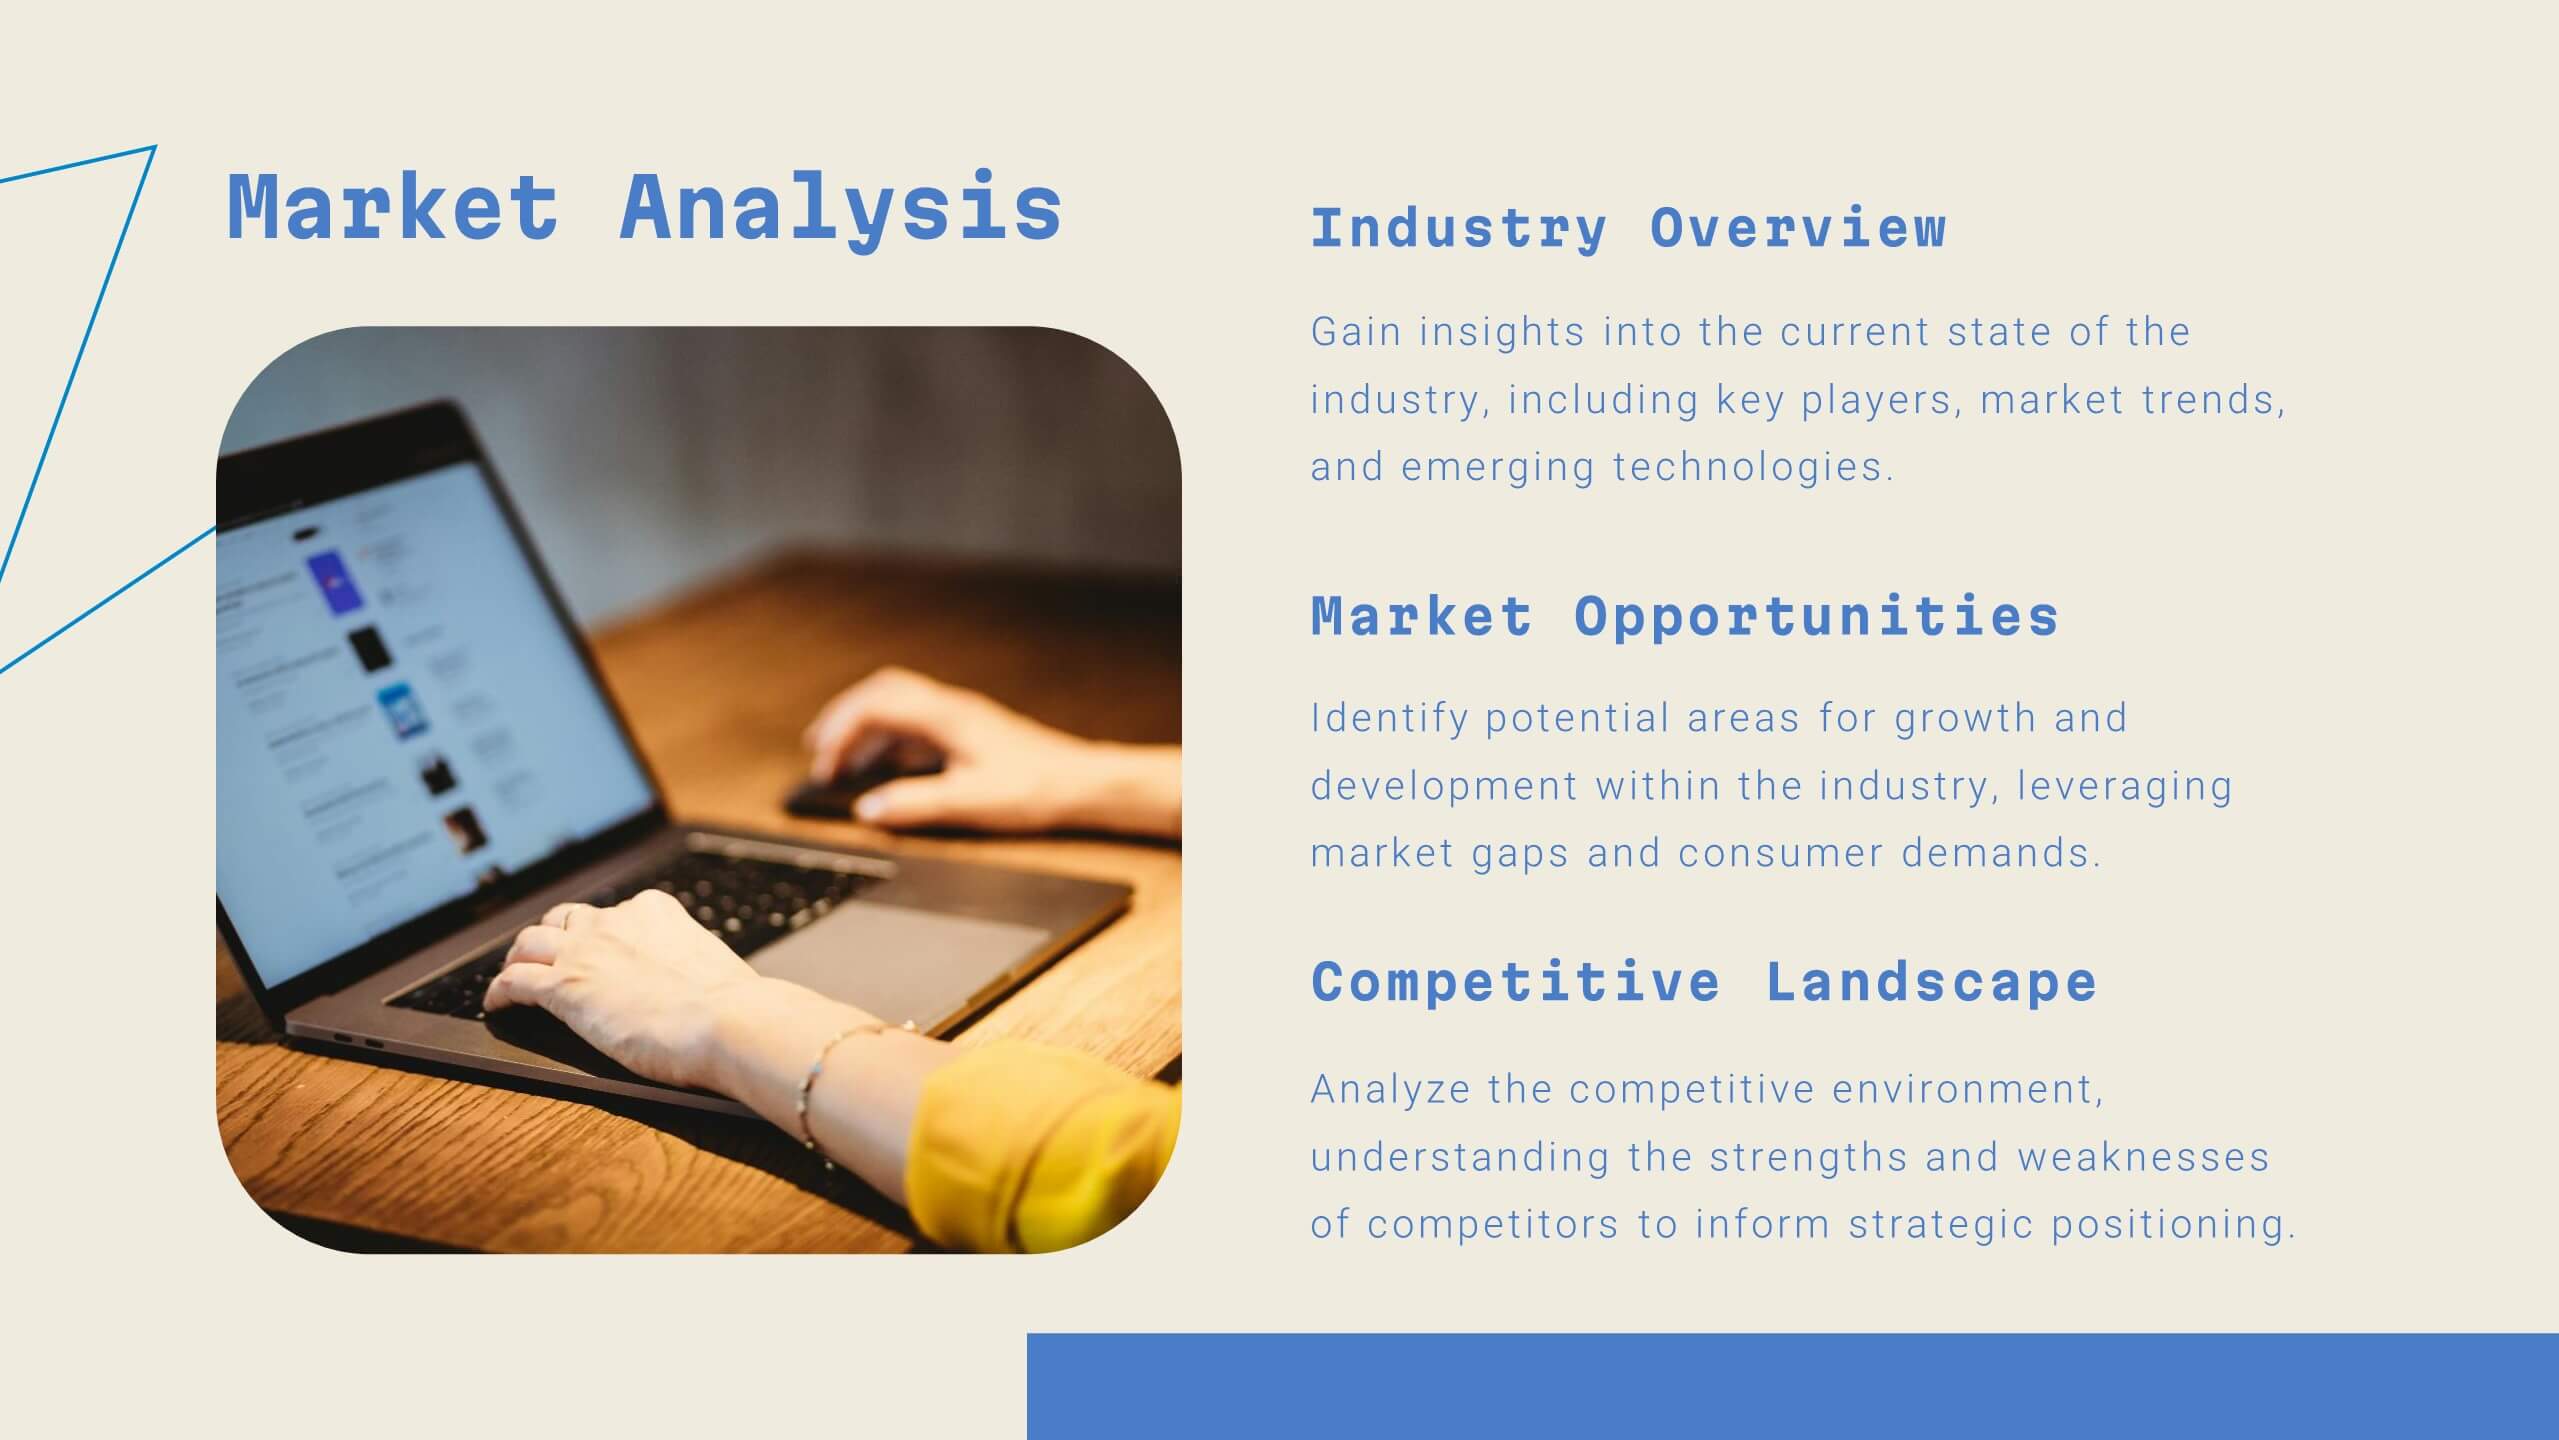
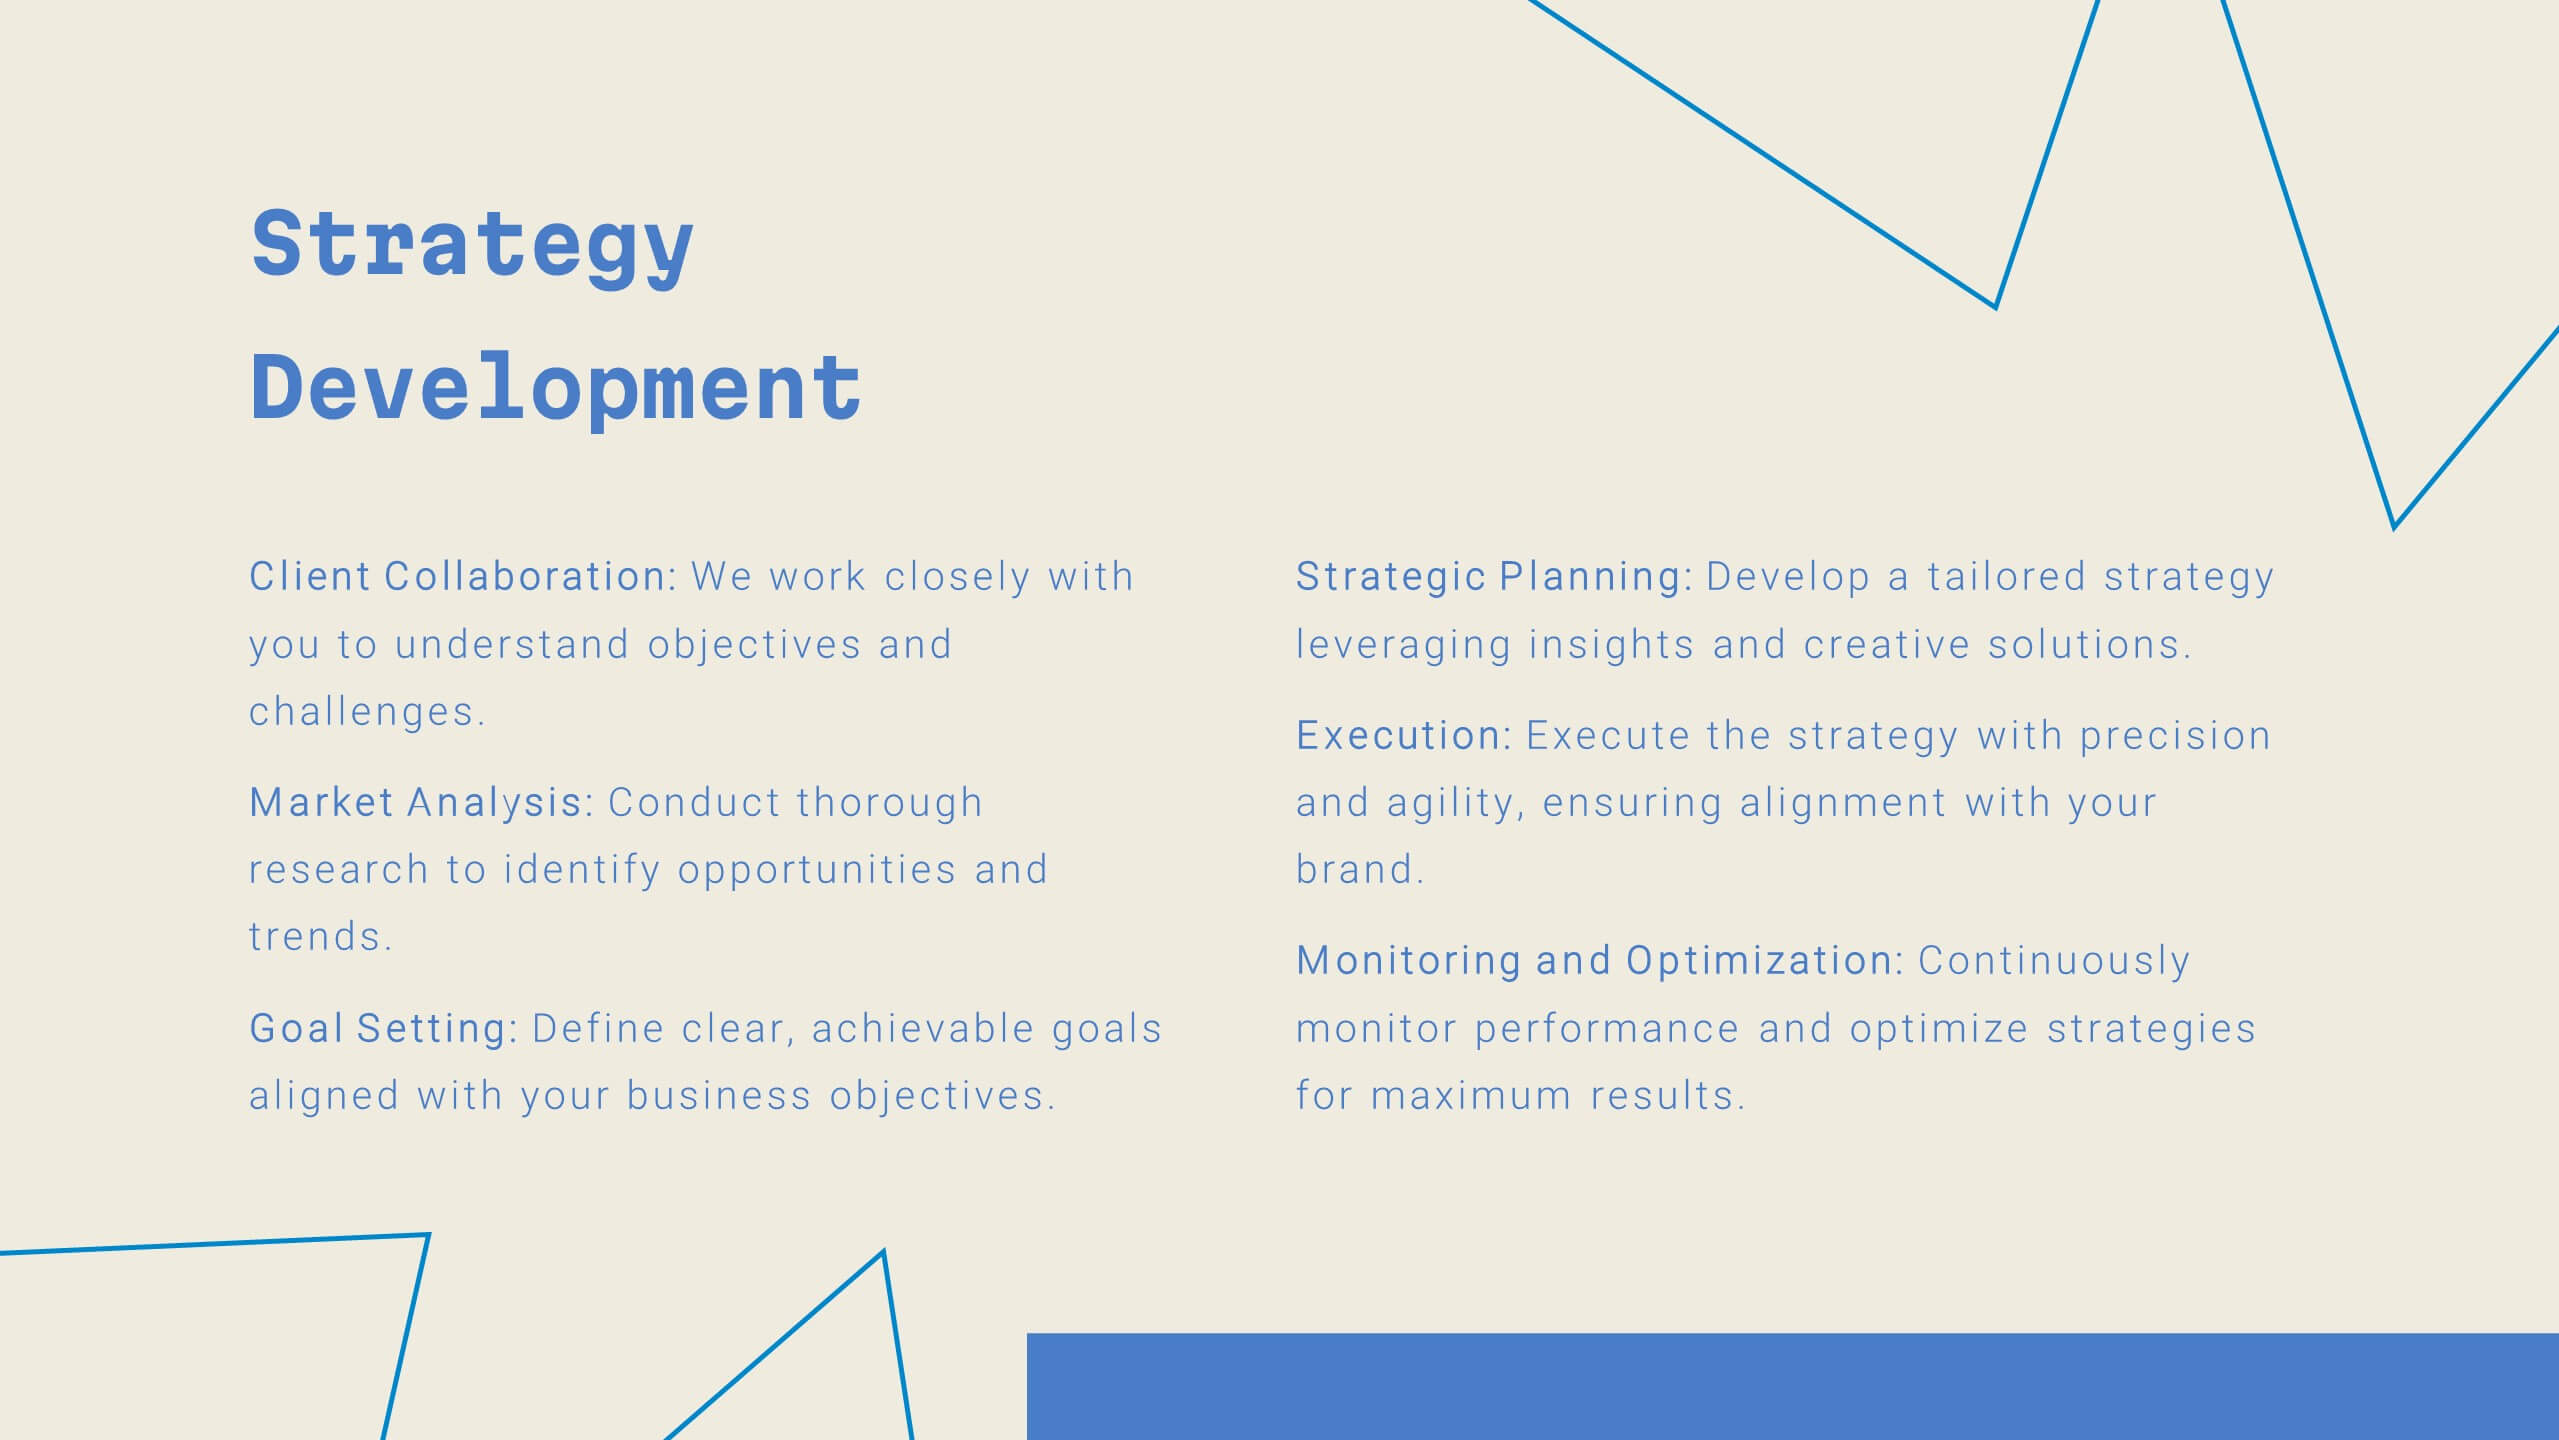
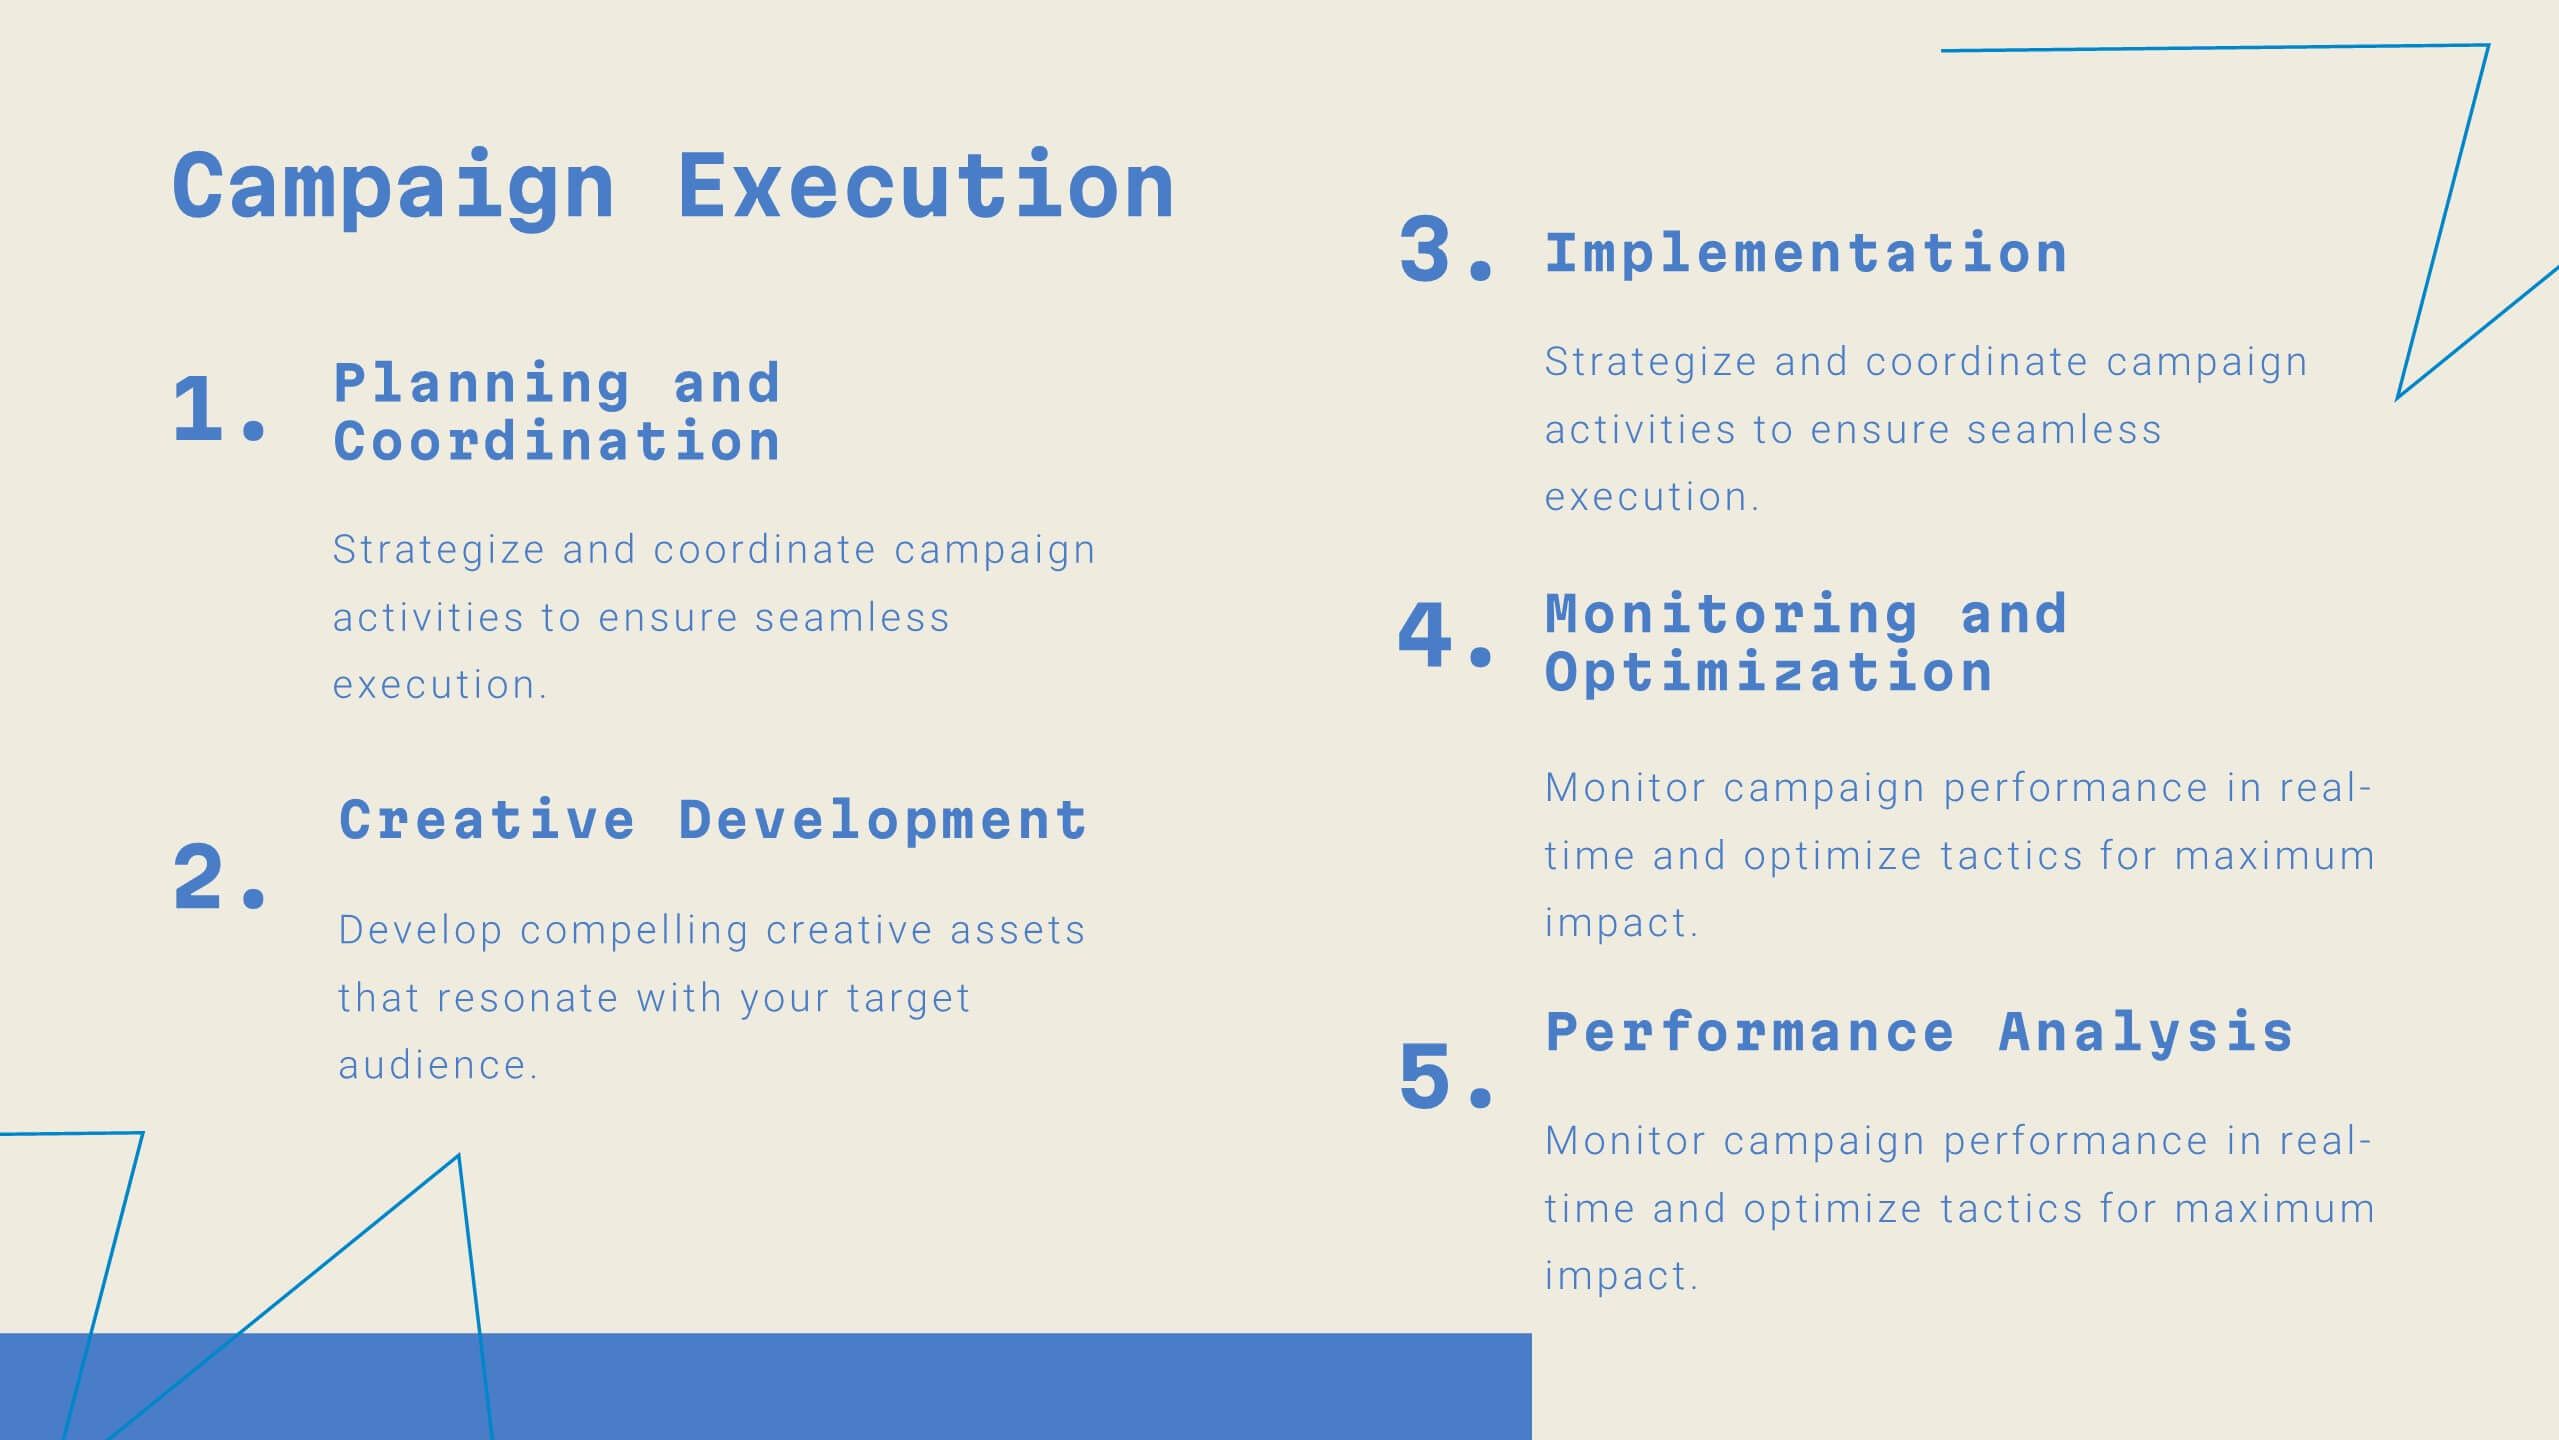
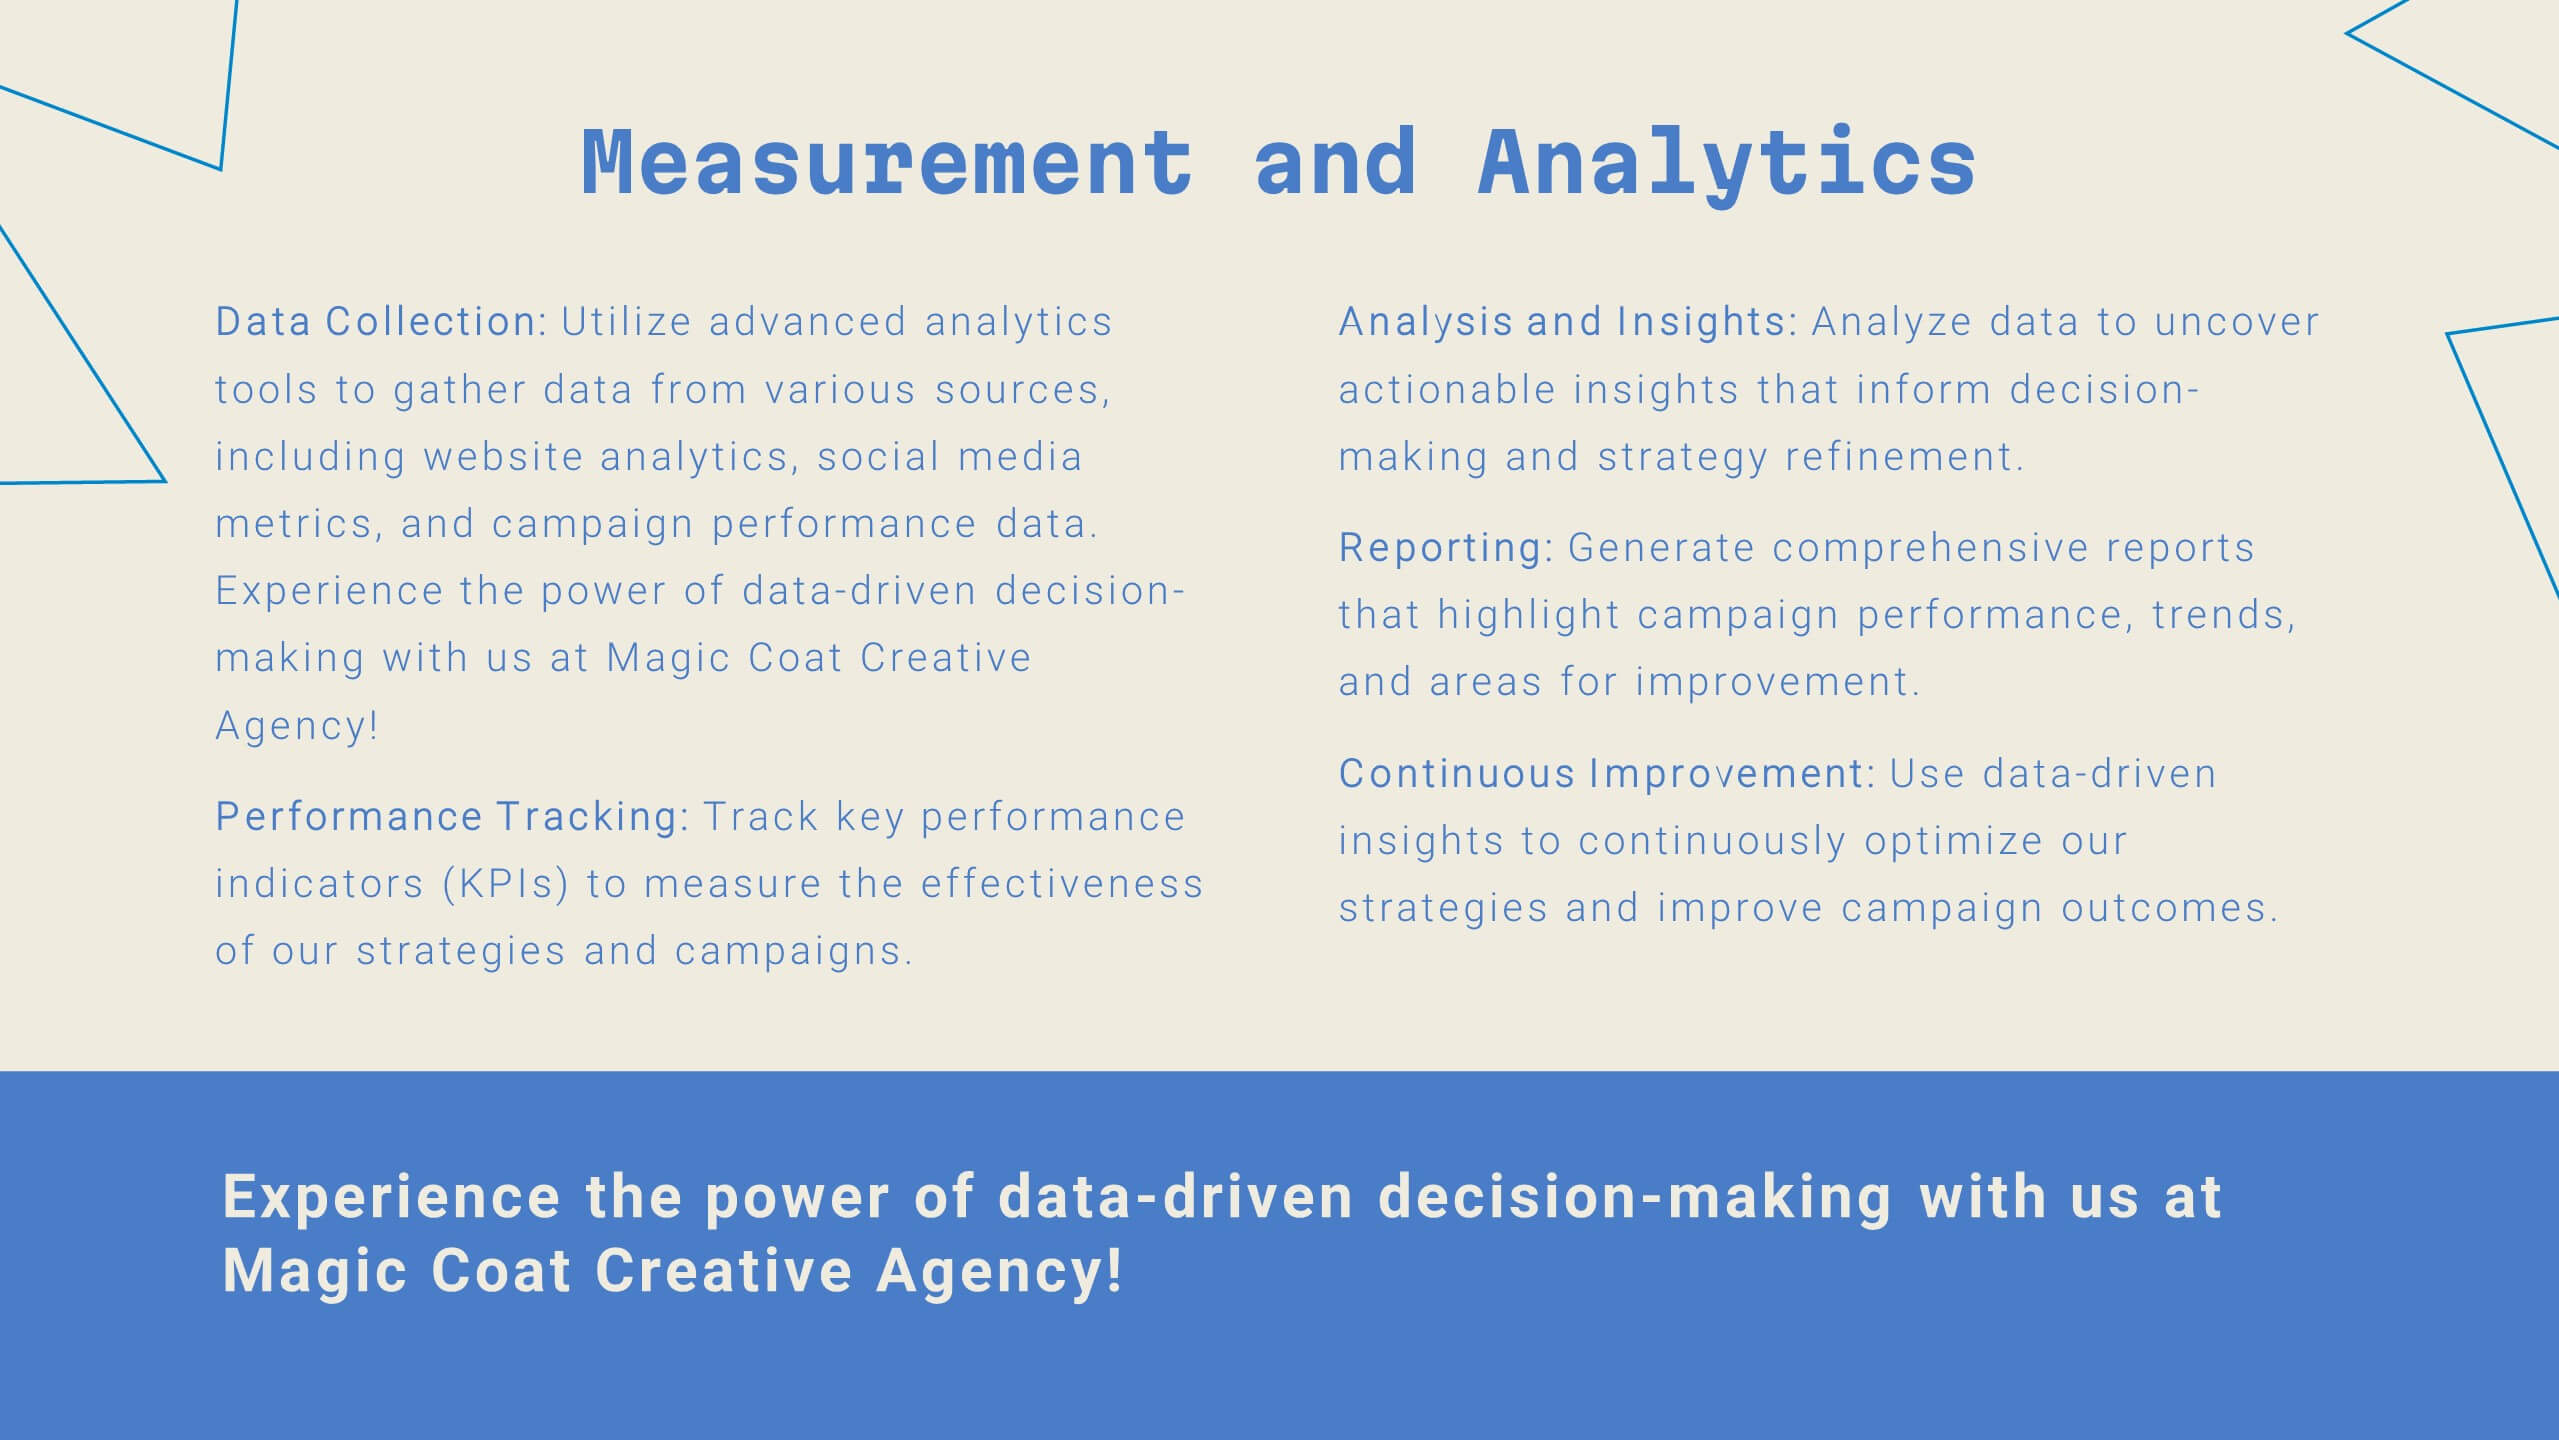
Step into the future of digital marketing with this sleek template! From case studies to strategy development, it offers a comprehensive guide for creating impactful presentations. Highlight client success stories, industry trends, and creative processes with ease. Perfect for showcasing your agency's expertise. Compatible with PowerPoint, Keynote, and Google Slides.


7 slides
Asia Map Geography Infographic
Explore the diverse landscapes and key data of Asia with our collection of Asia Map Infographics. These templates are expertly designed to illustrate various geographical and demographic insights across the continent, making them ideal for educational purposes, business presentations, or travel-related projects. Each infographic is crafted with a clean, clear layout that highlights different countries, regions, and significant data points such as population density, economic indicators, or cultural statistics. The use of color coding and spatial markers ensures that information is easily understandable and visually appealing. Fully customizable, these templates allow you to adjust the data points, colors, and text to suit specific presentation needs or to focus on particular areas of interest. Whether you're a teacher, a business analyst, or a traveler preparing a presentation, these slides offer a valuable resource for conveying complex geographical data in a straightforward and engaging manner.


7 slides
Simple Schedule Infographic
Effortlessly structure your time with our simple schedule infographic. Rendered in a clean white canvas, enhanced with dependable blue tones and anchored with timeless black, our template is the epitome of clarity and organization. Equipped with streamlined infographics, universal icons, and adaptable image placeholders, it facilitates easy time management and daily planning. Seamlessly tailored for Powerpoint, Keynote, or Google Slides. A fundamental tool for project managers, event planners, educators, or any professional aiming to efficiently allocate their time. Plan with ease; let every slide bring order to your daily chaos.


4 slides
Operational Flow Mapping and Control Presentation
Streamline complex processes with the Operational Flow Mapping and Control Presentation. This template uses a clear, hierarchical layout to visualize workflows, decision points, and operational branches. Ideal for SOPs, business systems, or process improvement plans. Fully editable in Canva, PowerPoint, and Google Slides to fit any project or team need.


6 slides
Oceania Language Map Infographic
Oceania encompasses the entirety of the Pacific Ocean and its islands. Embark on an enlightening journey through the linguistic tapestry of Oceania with our captivating Oceania Language Map Infographic. This template is your guide to understanding the rich array of languages spoken across this diverse and cultural region. Compatible with Powerpoint, Keynote, and Google Slides. This allows you to incorporate a vibrant and culturally symbolic color palette reflecting the diversity of Oceania. Utilize icons representing different languages for a visually appealing representation.


8 slides
Scrum Agile Framework Presentation
Visualize your iterative workflows and deliverables with this Scrum Agile Framework Presentation. Designed for Agile teams, this layout simplifies the depiction of Scrum principles—product backlogs, sprints, and reviews—into one cohesive graphic. Ideal for planning meetings, sprint reviews, or stakeholder updates. Fully editable in PowerPoint, Keynote, and Google Slides.


6 slides
Risk Management Strategies Infographic
Risk management is the process of identifying, assessing, prioritizing, and mitigating risks in order to minimize their impact on an organization's objectives and projects. This infographic template is designed to convey important information about identifying, assessing, and mitigating risks in various contexts. The icons and symbols are added to represent different stages of risk management, such as identification, assessment, mitigation, and monitoring. This Infographic can effectively communicate the importance of risk management and provide insights into the strategies used to mitigate potential risks in various contexts.


6 slides
End-to-End Business Process Visualization Presentation
Present every stage of your operations clearly with the End-to-End Business Process Visualization Presentation. This structured layout is perfect for mapping out linear workflows across departments, from initiation to final delivery. Easily customizable and compatible with PowerPoint, Canva, and Google Slides for seamless editing.


7 slides
Interpersonal Communication Infographic
Interpersonal communication is the process by which people exchange information, feelings, and meaning through verbal and non-verbal messages in various contexts. This vibrant infographic template is a visual exploration of the art of effective communication, revealing the key to building strong relationships both personally and professionally. Compatible with Powerpoint, Keynote, and Google Slides. Immerse yourself in the world of communication, where understanding and connection are paramount. This template will help you explore how technology has transformed communication, showcasing its advantages in the modern world.


5 slides
Country Data Mapping in South America Presentation
Present data with impact using the Country Data Mapping in South America Presentation. This clean, professional slide highlights key statistics across up to five countries using labeled connectors, icons, and a gradient-based map. Ideal for showcasing regional growth, KPIs, or operational breakdowns across South America. Fully editable and compatible with PowerPoint, Keynote, Google Slides, and Canva.


5 slides
Celebrating Major Milestones Presentation
Highlight achievements and key moments with this medal-themed milestone template. Ideal for progress tracking, awards, or timeline presentations. Showcase up to four major events using a clean, structured layout. Fully editable in PowerPoint, Keynote, and Google Slides—perfect for business reviews, team celebrations, or personal growth milestones.


6 slides
State-by-State Business Distribution Map Presentation
Visualize regional performance with this State-by-State Business Distribution Map template. Ideal for showcasing business coverage, sales territories, or demographic trends across the U.S. Each state is color-coded for clarity, with editable text and icons. Fully compatible with PowerPoint, Keynote, and Google Slides—perfect for executives, marketers, or analysts.


6 slides
Gantt Charts Analysis Infographic
Streamline your project planning with our Gantt Chart Analysis Infographic, designed for seamless integration with Powerpoint, Google Slides, and Keynote. The Gantt chart layout allows you to display activities against a time scale, making it easy to identify key phases, task durations, and overlapping activities. Each bar represents a task, with colors and lengths that can be customized to reflect different stages or priorities. Perfect for detailing project timelines, and workflow coordination, this template is a visual aid that enhances clarity and fosters collaborative project management. With this Gantt Chart infographic, you can ensure your project stays on track.


5 slides
Creative Bubble Map Infographic Presentation
Bring your ideas to life with dynamic visuals that make connections clear and storytelling effortless. This modern infographic presentation is perfect for showcasing relationships, categories, or data insights in a bold and engaging way. Fully editable and compatible with PowerPoint, Keynote, and Google Slides for seamless customization.


8 slides
3D Infographic Design Presentation
Make your data pop—literally—with a stacked design that brings depth and clarity to your message. This 3D infographic template helps break down layered concepts, step-by-step processes, or hierarchical data in a visually striking way. It’s fully customizable and compatible with PowerPoint, Keynote, and Google Slides for easy presentation building.


5 slides
User Experience Survey Findings Presentation
Present key insights from your user research in a clean and impactful way with this survey findings slide. Designed to highlight percentages and categories clearly, it helps your audience quickly understand what users value most. Ideal for UX reports and product feedback reviews. Fully compatible with PowerPoint, Keynote, and Google Slides.


8 slides
Executive Summary Business
Present key insights clearly with this modern Executive Summary slide. Designed for impact, it highlights core data points alongside four strategic pillars—perfect for quarterly updates, board meetings, or business reviews. Fully editable in PowerPoint, Keynote, and Google Slides. Clean layout, customizable icons, and sleek visuals ensure a professional finish.