


Features
- 6 Unique slides
- Fully editable and easy to edit in Microsoft Powerpoint, Keynote and Google Slides
- 16:9 widescreen layout
- Clean and professional designs
- Export to JPG, PDF or send by email


Do you have any questions?
Recommend


5 slides
Iceberg Model Infographics
Introducing our Iceberg Model Infographic, this is a visual representation of the Iceberg Model which is a metaphor for understanding a problem or issue. It is based on the idea that just like an iceberg, only a small portion of the problem or issue is visible on the surface, while the majority of it lies beneath. In this vertical infographic use the top visible part of the iceberg to represent the things that are easily observed, and the larger hidden part of the iceberg can be the underlying causes or factors that are not easily visible. This is designed to help people understand the complexity of a problem and encourage them to look beyond the surface level.


5 slides
Healthcare Facts Infographics
Healthcare facts help promote health literacy, empower individuals to make informed decisions, and contribute to improved healthcare outcomes for individuals and communities. These infographic templates are designed to present key healthcare facts and statistics in a clear and concise manner. These are perfect for creating educational materials, presenting research findings, or raising awareness about healthcare issues, this template will help you effectively communicate important information. Compatible with Powerpoint, Keynote, and Google Slides you can ensures that your healthcare infographics are visually compelling and impactful.


26 slides
Katlina Presentation Template
Everyone wants to be on top of their SEO game. This Katlina presentation template provides a way for you to teach your audience about the importance of Search Engine Optimization. Start creating your own slides with this template. With fun graphics that will also make the information more interesting and easy to understand charts and timelines.This presentation will help your audience see how they can increase their sites visibility in search results. It can also be use for your presentations at work or in class due to it's customizability. Get started today makeing an impact in your industry.


6 slides
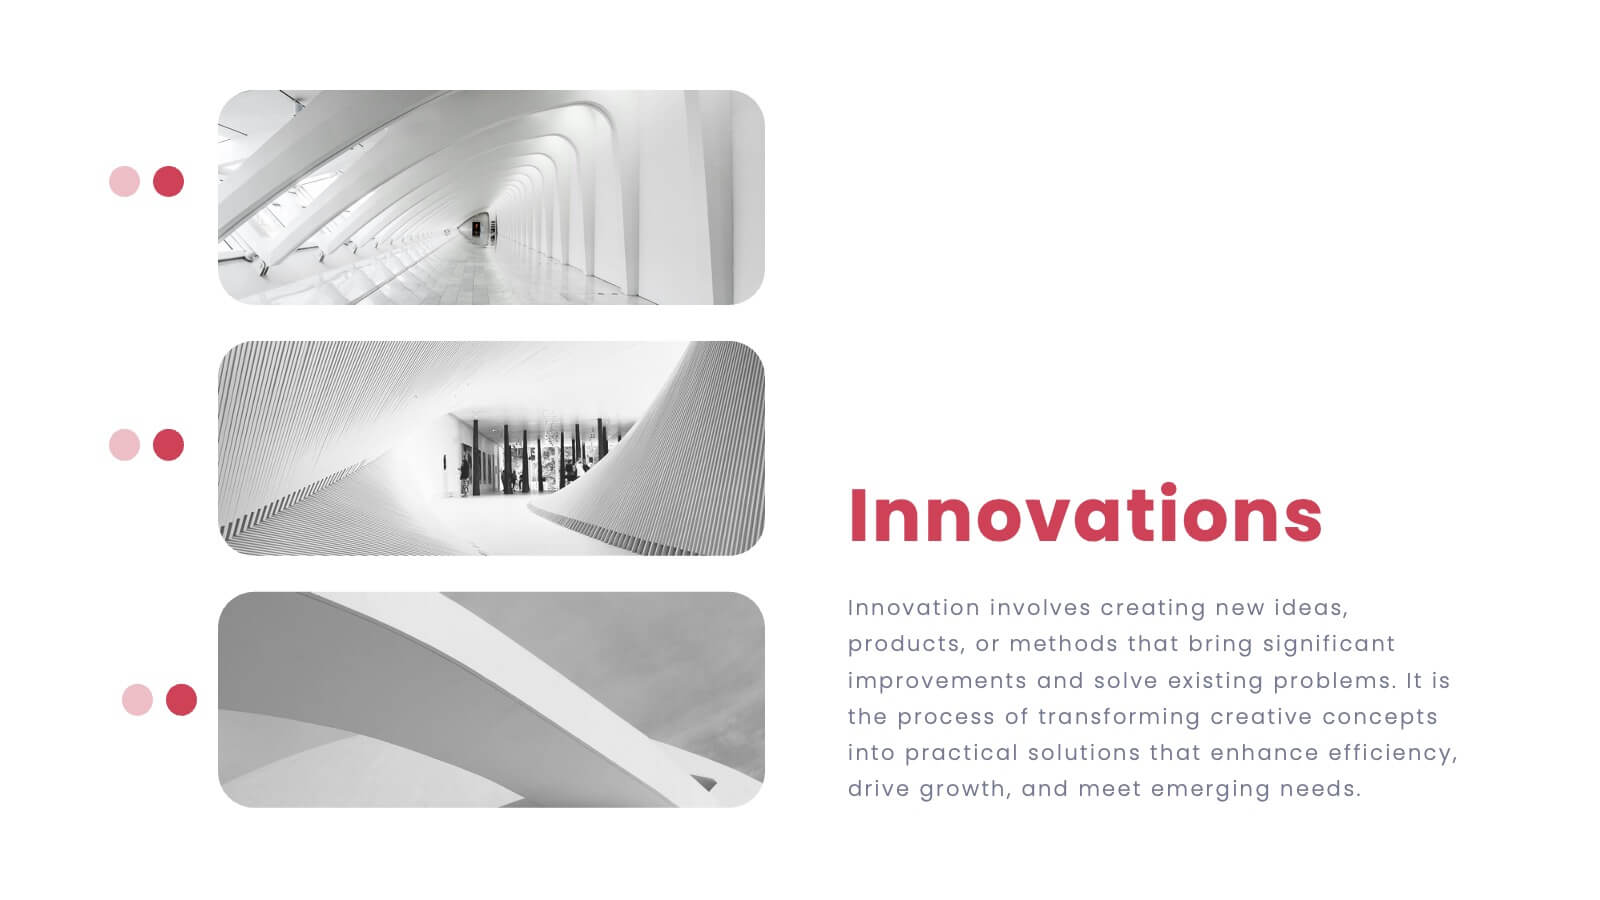
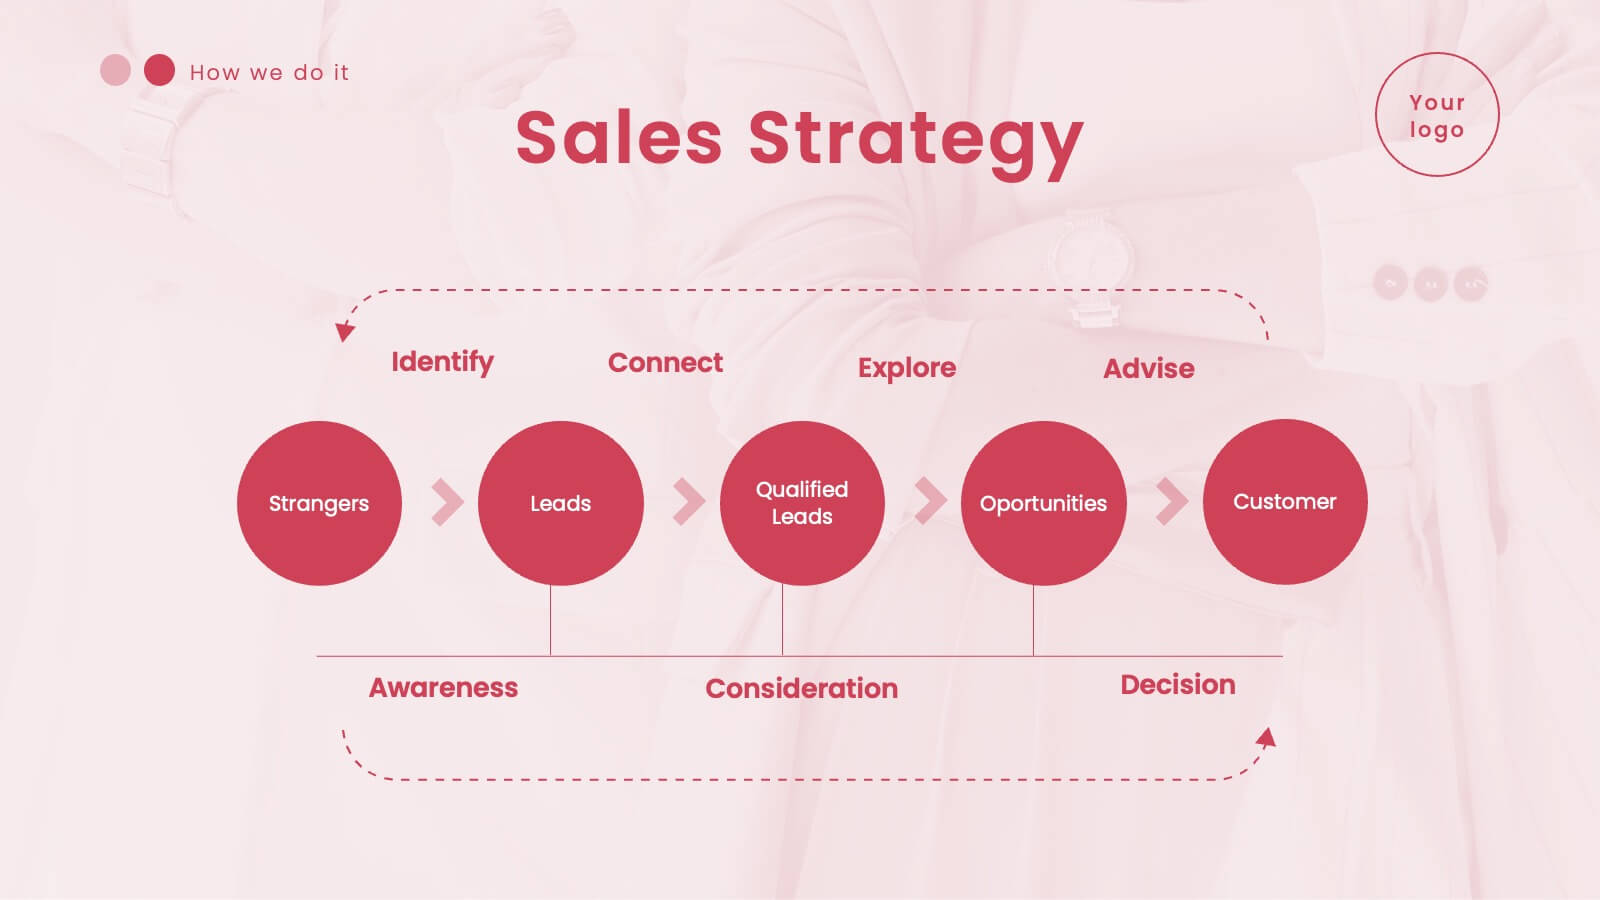
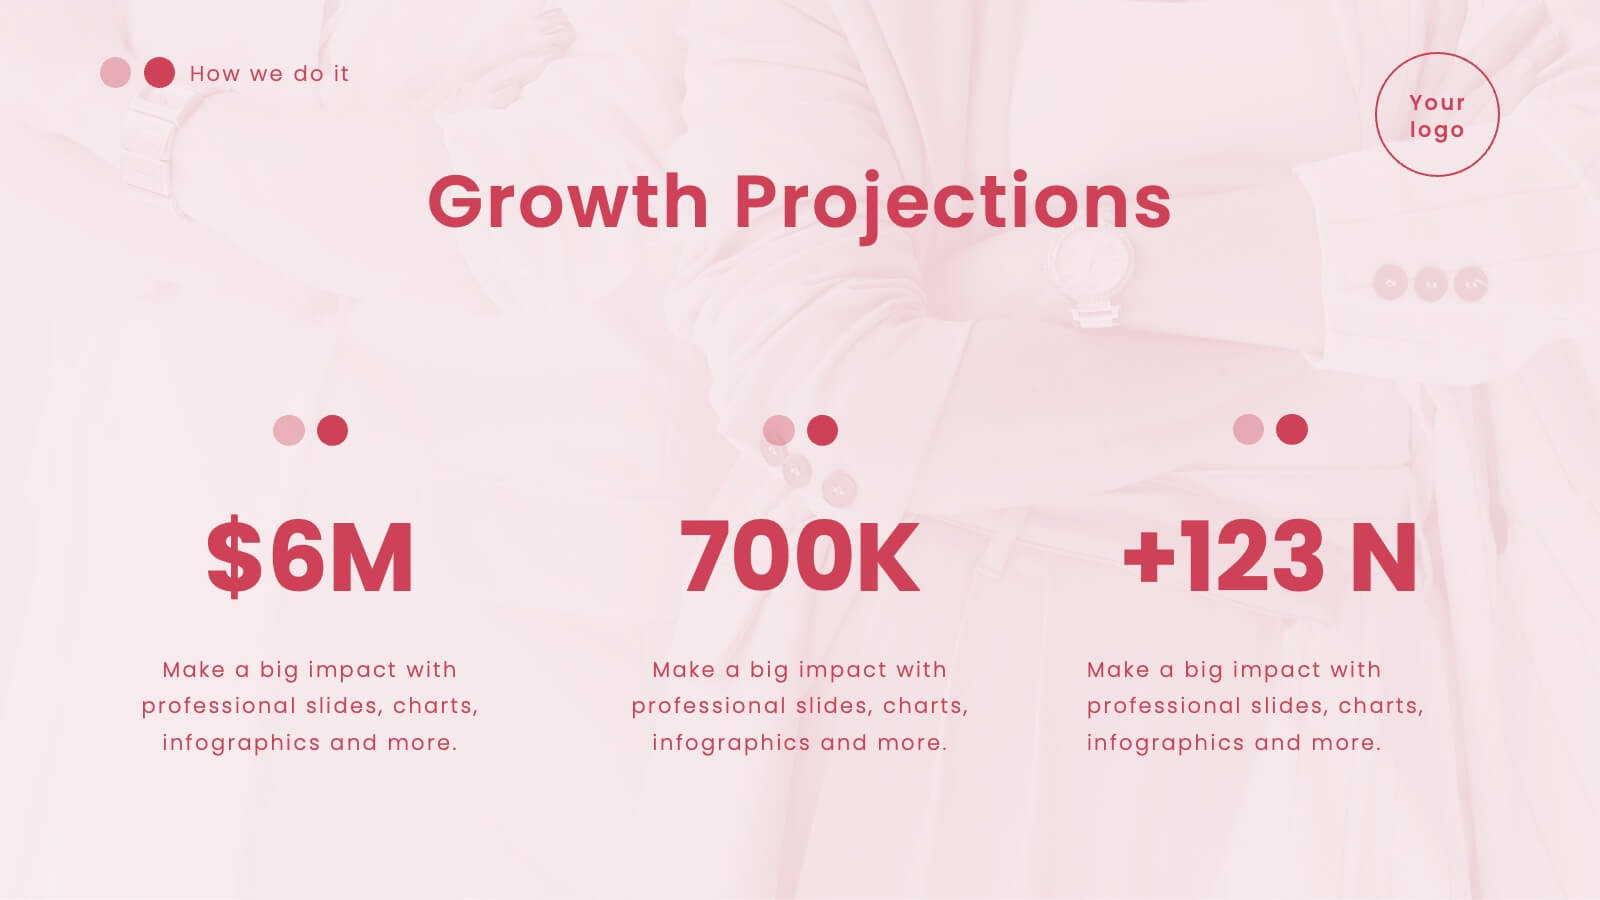
Creative Interior Design Portfolio Showcase Presentation
Showcase your creativity with the Creative Design Portfolio Showcase presentation. This template is perfect for graphic designers, architects, and creative professionals looking to display their work in a visually compelling format. Featuring modern layouts, high-quality image placeholders, and structured text sections, it allows for easy customization to highlight key insights. Fully compatible with PowerPoint, Keynote, and Google Slides.


8 slides
Benefits Table Template
Optimize your presentation of complex options with our "Benefits Table Template." Designed to clearly distinguish between different plans, this template enables you to showcase Plan A, Plan B, and Plan C with ease. Each column is distinctively colored and detailed to ensure your audience can grasp the variances in benefits at a glance. Ideal for comparing packages, costs, or strategic choices in a corporate setting, this template helps clarify decision-making processes. Compatible with PowerPoint, Keynote, and Google Slides, it is an invaluable tool for business analysts, sales teams, and marketers aiming to communicate effectively with their stakeholders.


24 slides
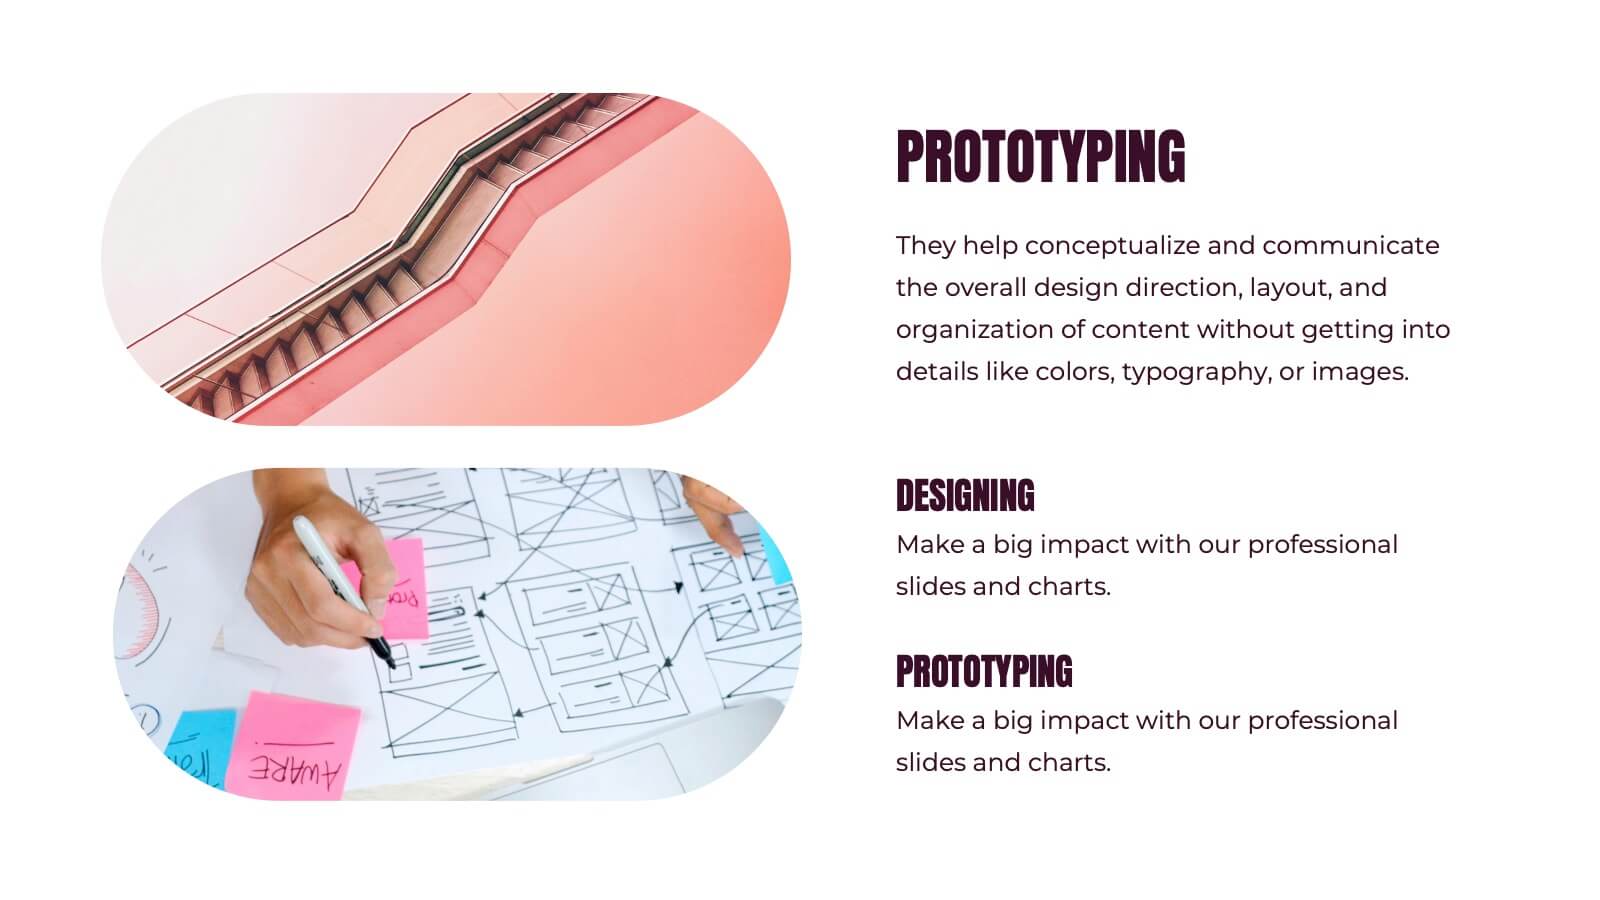
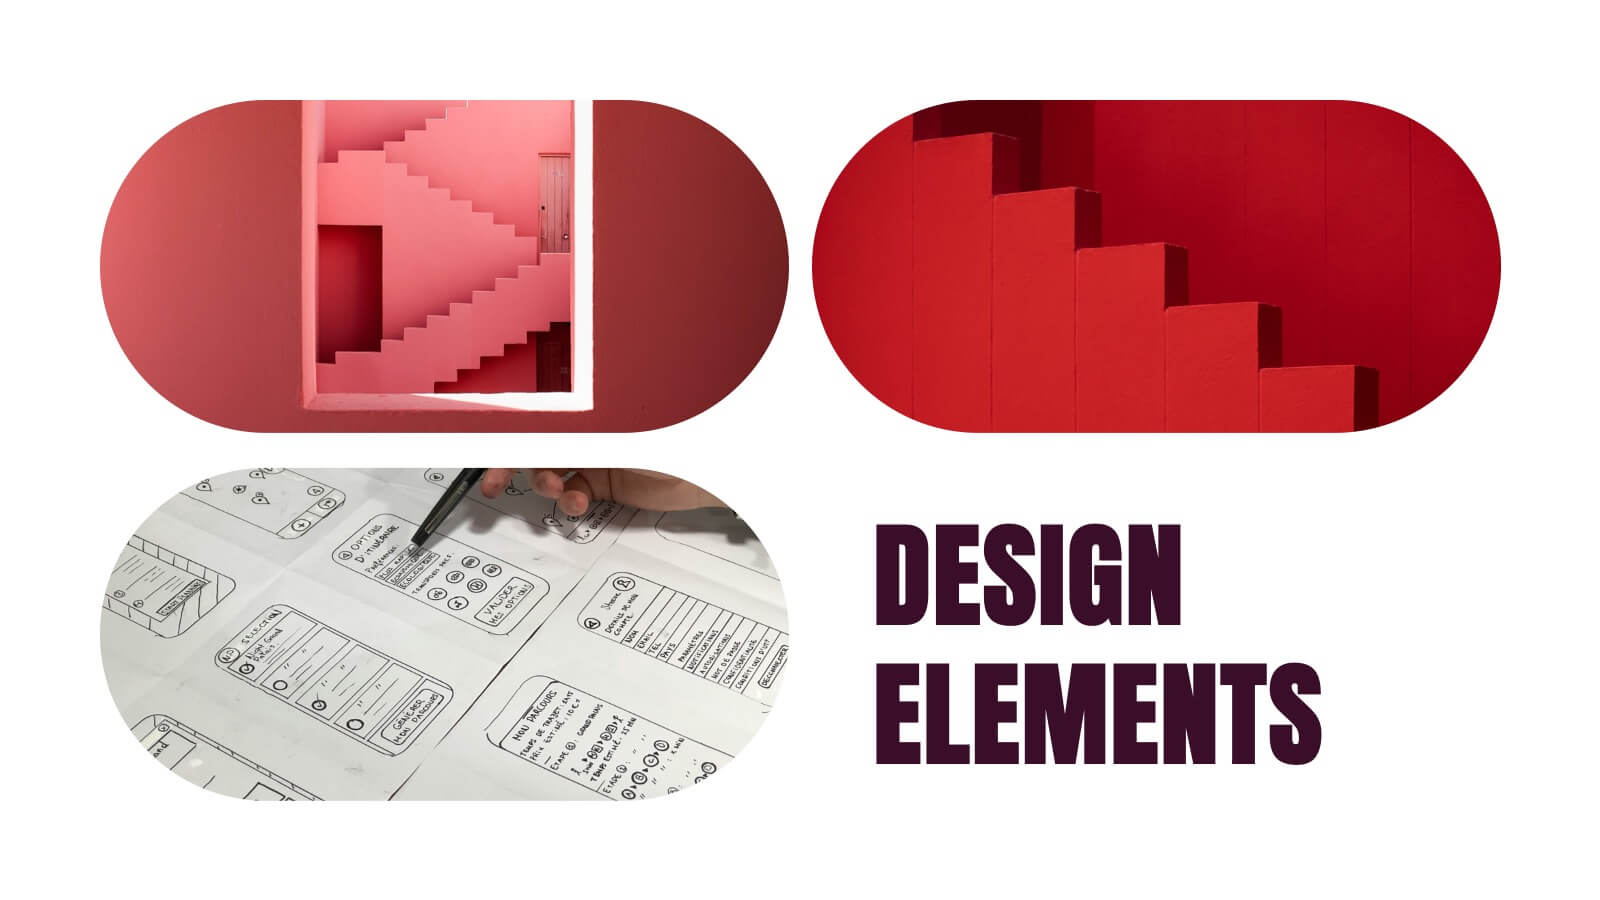
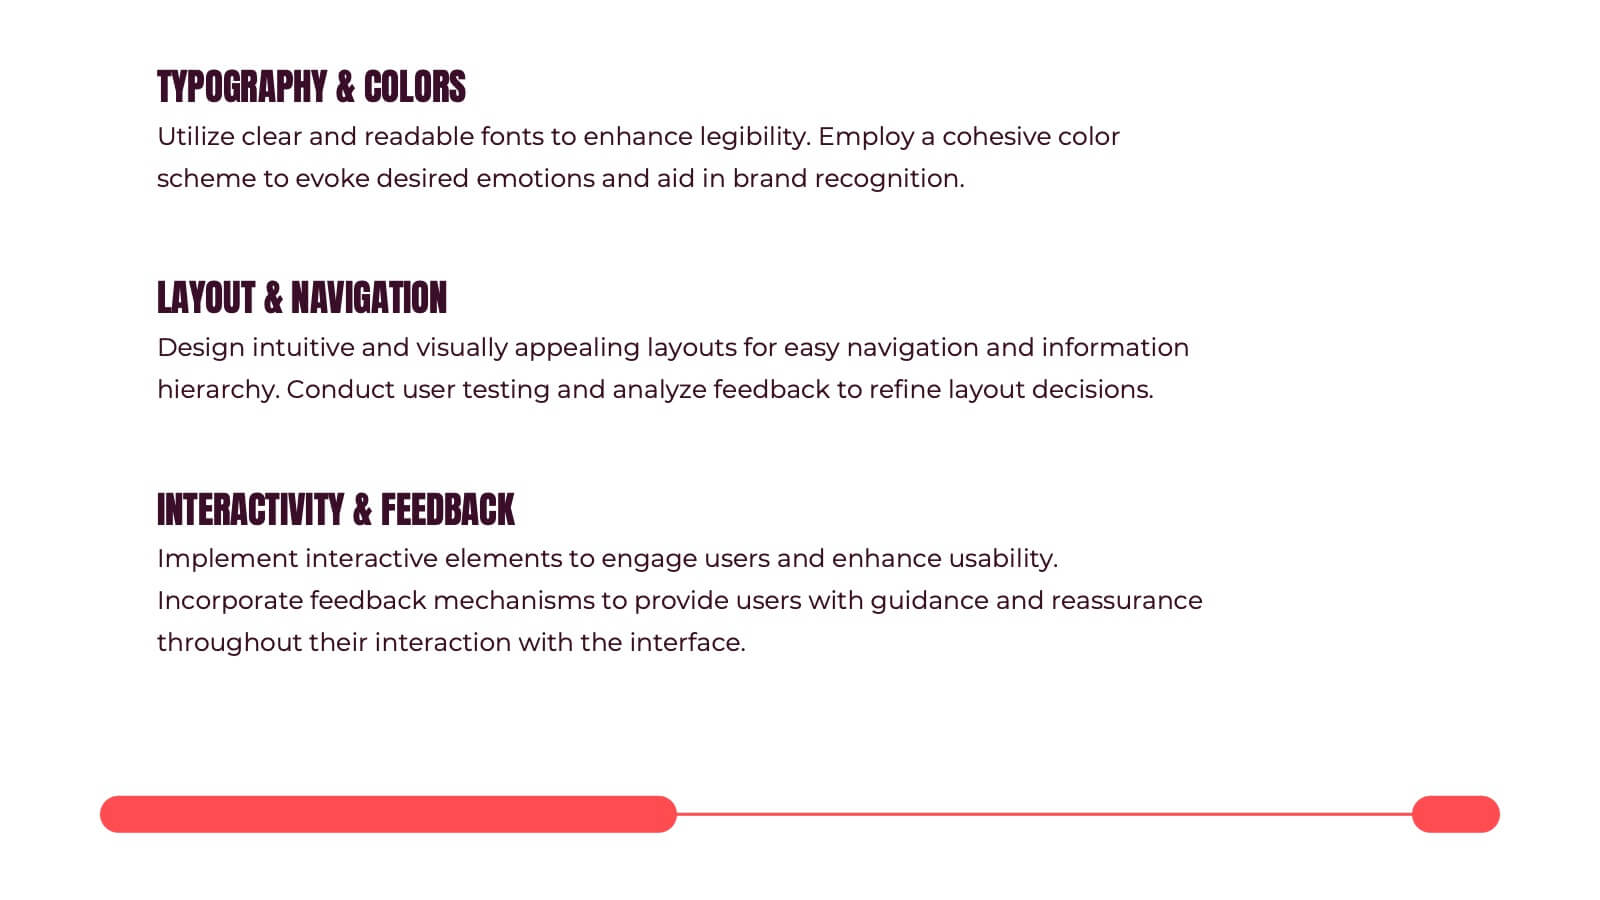
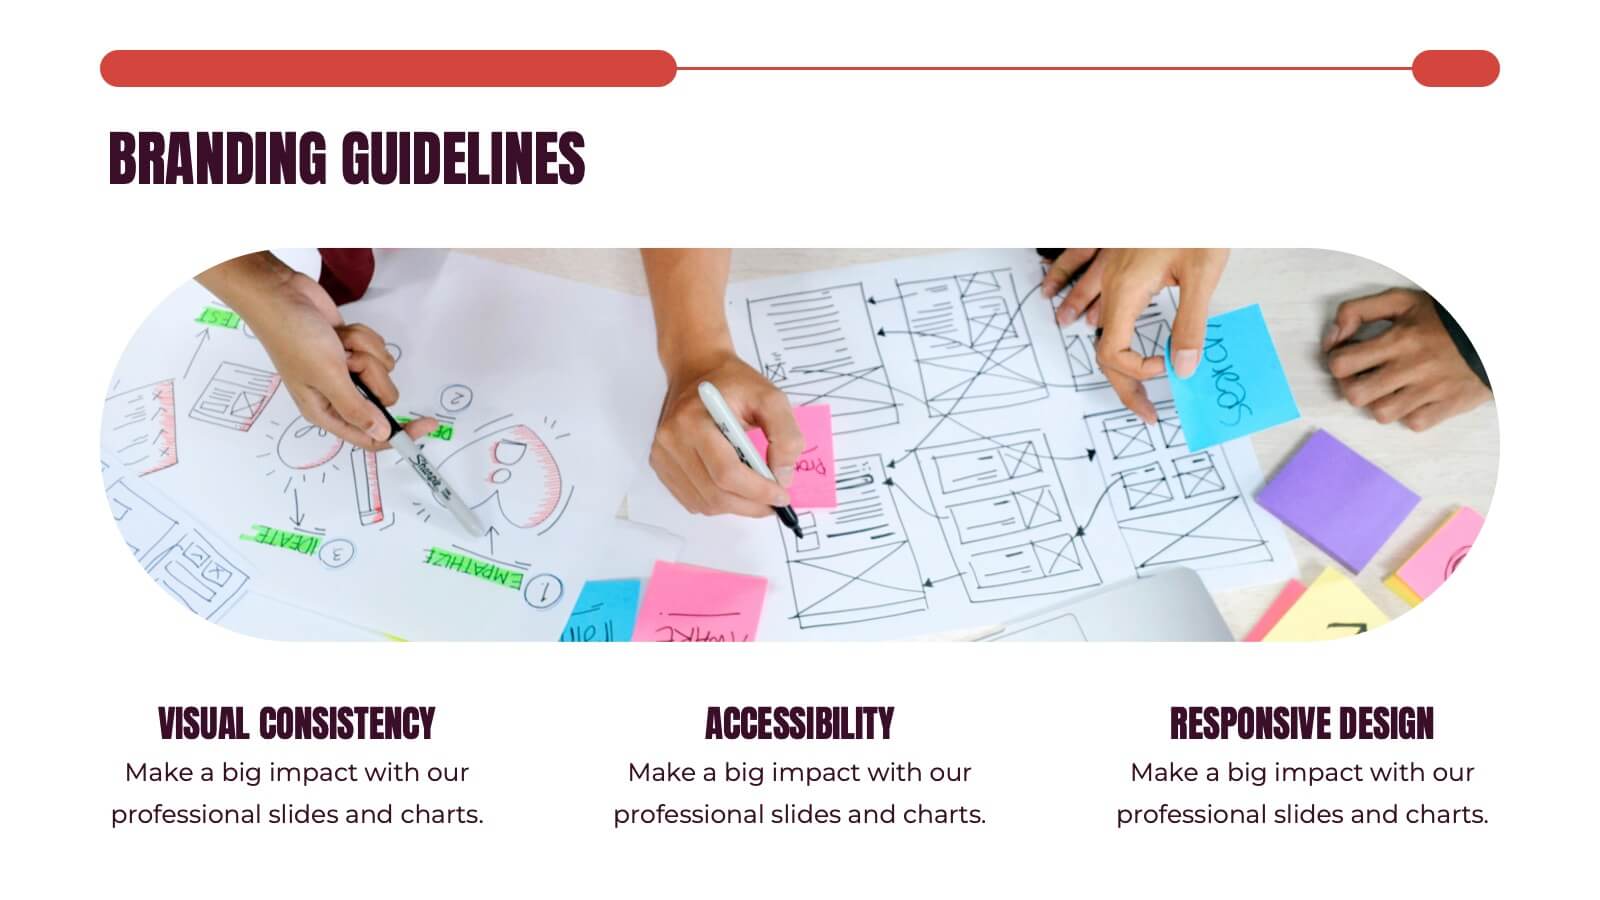
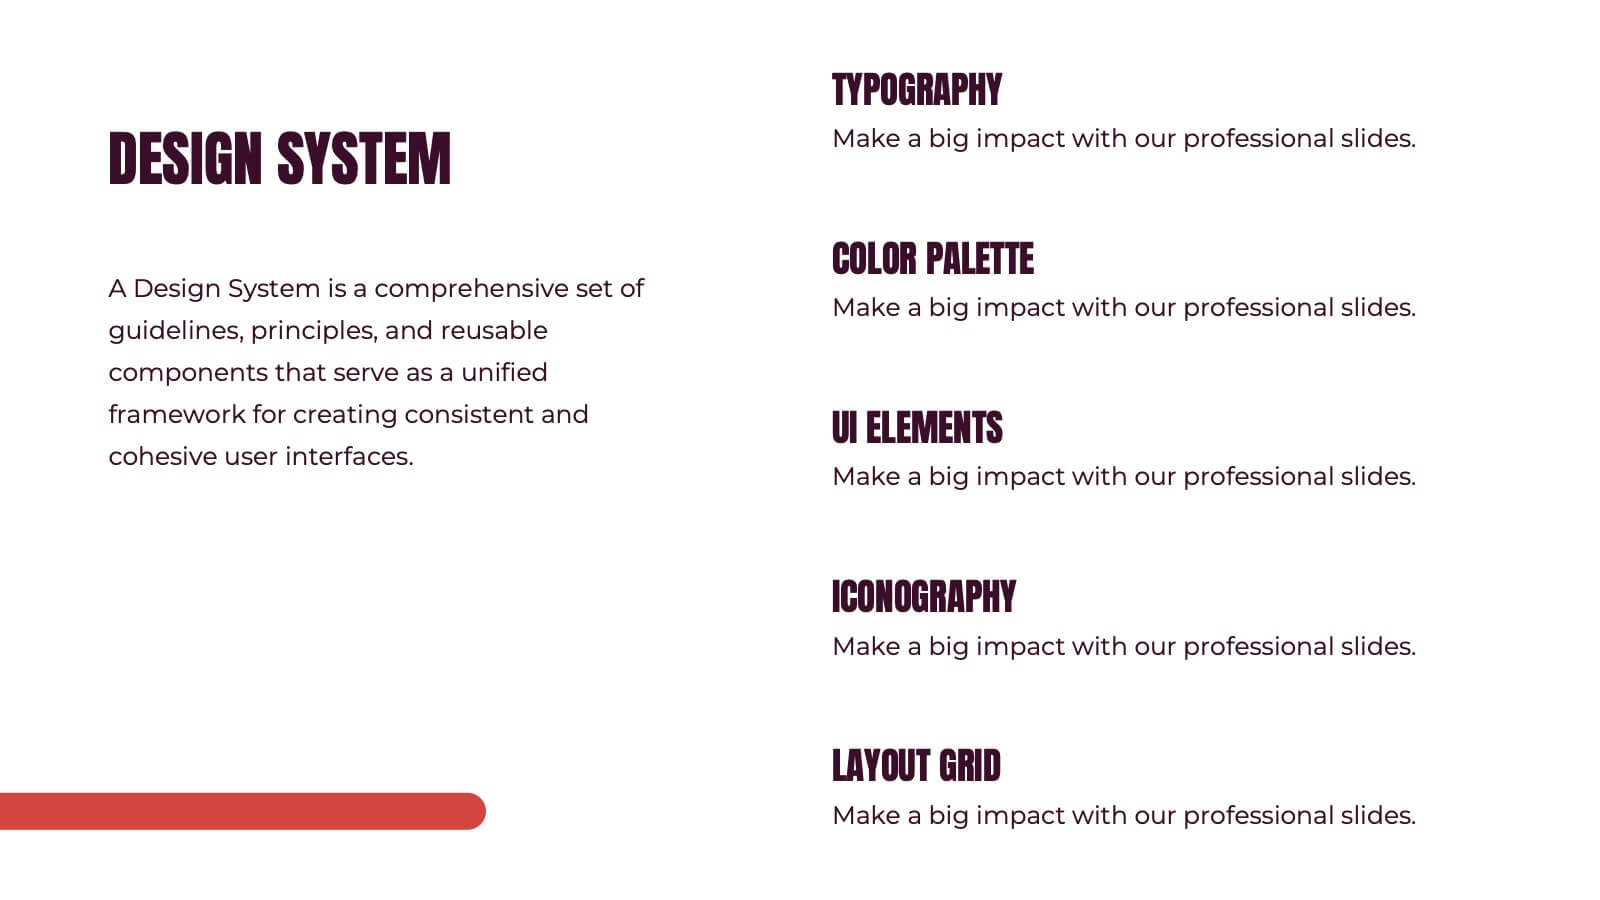
Kismet UX Design Presentation
Dive into the world of design with this stunning presentation template! Perfect for explaining user experience concepts, this template covers everything from wireframes to prototyping. It's designed to captivate your audience with visually engaging slides and clear, concise information. Compatible with PowerPoint, Keynote, and Google Slides for effortless use across platforms.


6 slides
Social Challenges Infographics
Address social challenges effectively with our Social Challenge infographic template. This template is fully compatible with popular presentation software like PowerPoint, Keynote, and Google Slides, allowing you to easily customize it to illustrate and communicate various social challenges and their solutions. The Social Challenge infographic template offers a visually engaging platform to outline the nature of social issues, their impact on communities, and strategies for addressing them. Whether you're an advocate, nonprofit organization, community leader, or simply interested in making a positive impact, this template provides a user-friendly canvas to create informative presentations and educational materials. Raise awareness and promote solutions with this SEO-optimized Social Challenge infographic template, thoughtfully designed for clarity and ease of use. Customize it to showcase specific social challenges, statistics, success stories, and calls to action, ensuring that your audience gains a comprehensive understanding of the issue at hand. Start crafting your personalized infographic today to contribute to positive change in society.


5 slides
Supply Chain Industry Infographics
The supply chain industry refers to the network of organizations, resources, activities, and technologies involved in the production, distribution, and delivery of goods and services from the point of origin to the point of consumption. These vertical infographics encompasses all the stages and processes involved in the movement of products, including procurement, manufacturing, logistics, and customer service. These are designed to help your audience understand the intricacies of supply chain management and its role in business operations. Compatible with Powerpoint, Keynote, and Google Slides.


21 slides
Cascade Marketing Proposal Template Presentation
Ignite your creativity with our dazzling Cascade Marketing Proposal Template Presentation! This captivating design brings your ideas to life, ensuring your presentation stands out. The sleek, dark theme is punctuated by electric blue accents, adding a modern, professional touch. Each slide is meticulously crafted, offering a perfect blend of visuals and content that keeps your audience engaged from start to finish. From the Company Overview to Growth Projections, every aspect of your pitch is highlighted with style and clarity. The template is fully customizable, allowing you to tailor it to your brand's identity effortlessly. Whether you're pitching to investors or presenting internally, this template has everything you need to make a lasting impression. Compatible with PowerPoint, Keynote, and Google Slides, it’s versatile and easy to use. Get ready to electrify your next presentation and leave your audience in awe!

20 slides
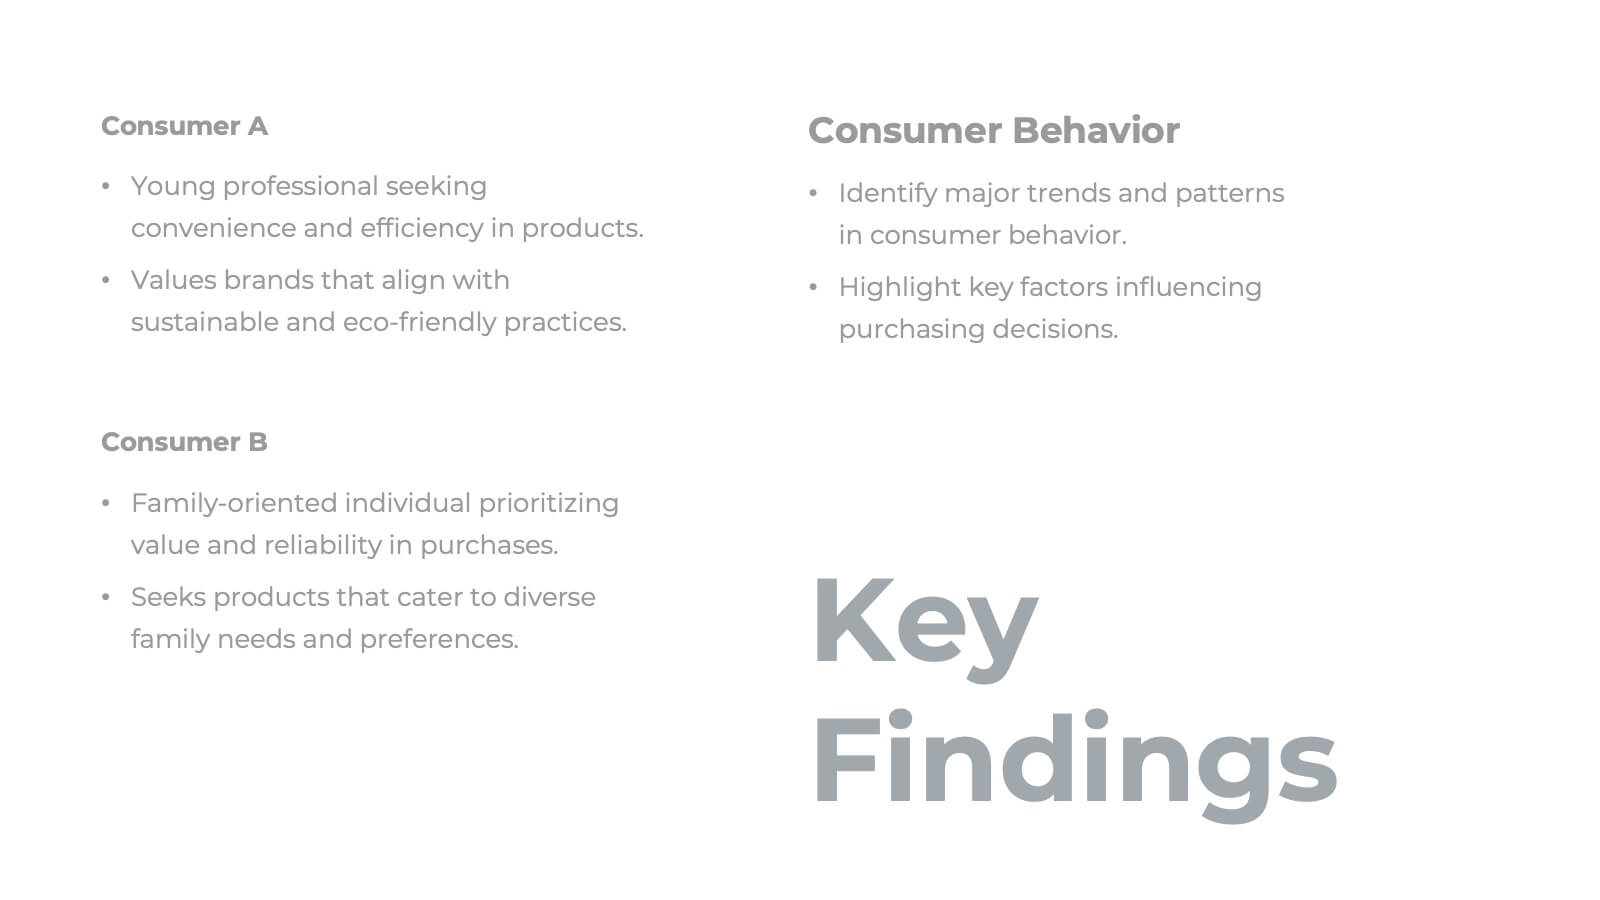
Malachite Research Proposal Presentation
Present your research findings with clarity and professionalism using this structured research presentation template! Covering all essential elements, from research objectives and methodology to key findings and implications, this template ensures your work is communicated effectively. It's perfect for academic, corporate, or scientific presentations. Compatible with PowerPoint, Keynote, and Google Slides, it's versatile and ready for your next project.

22 slides
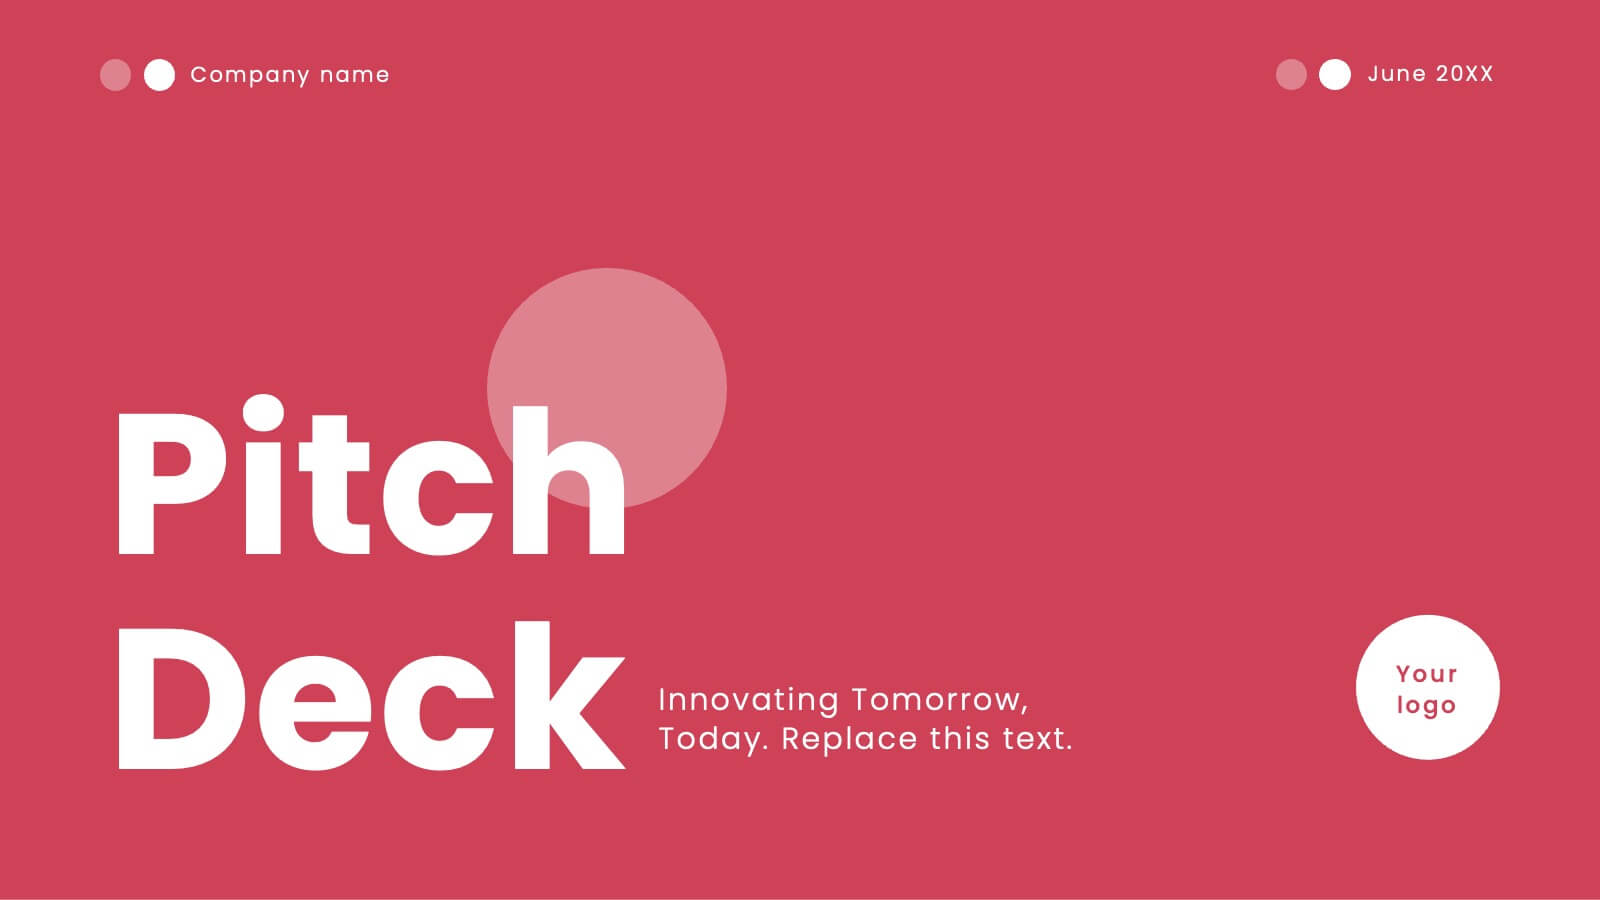
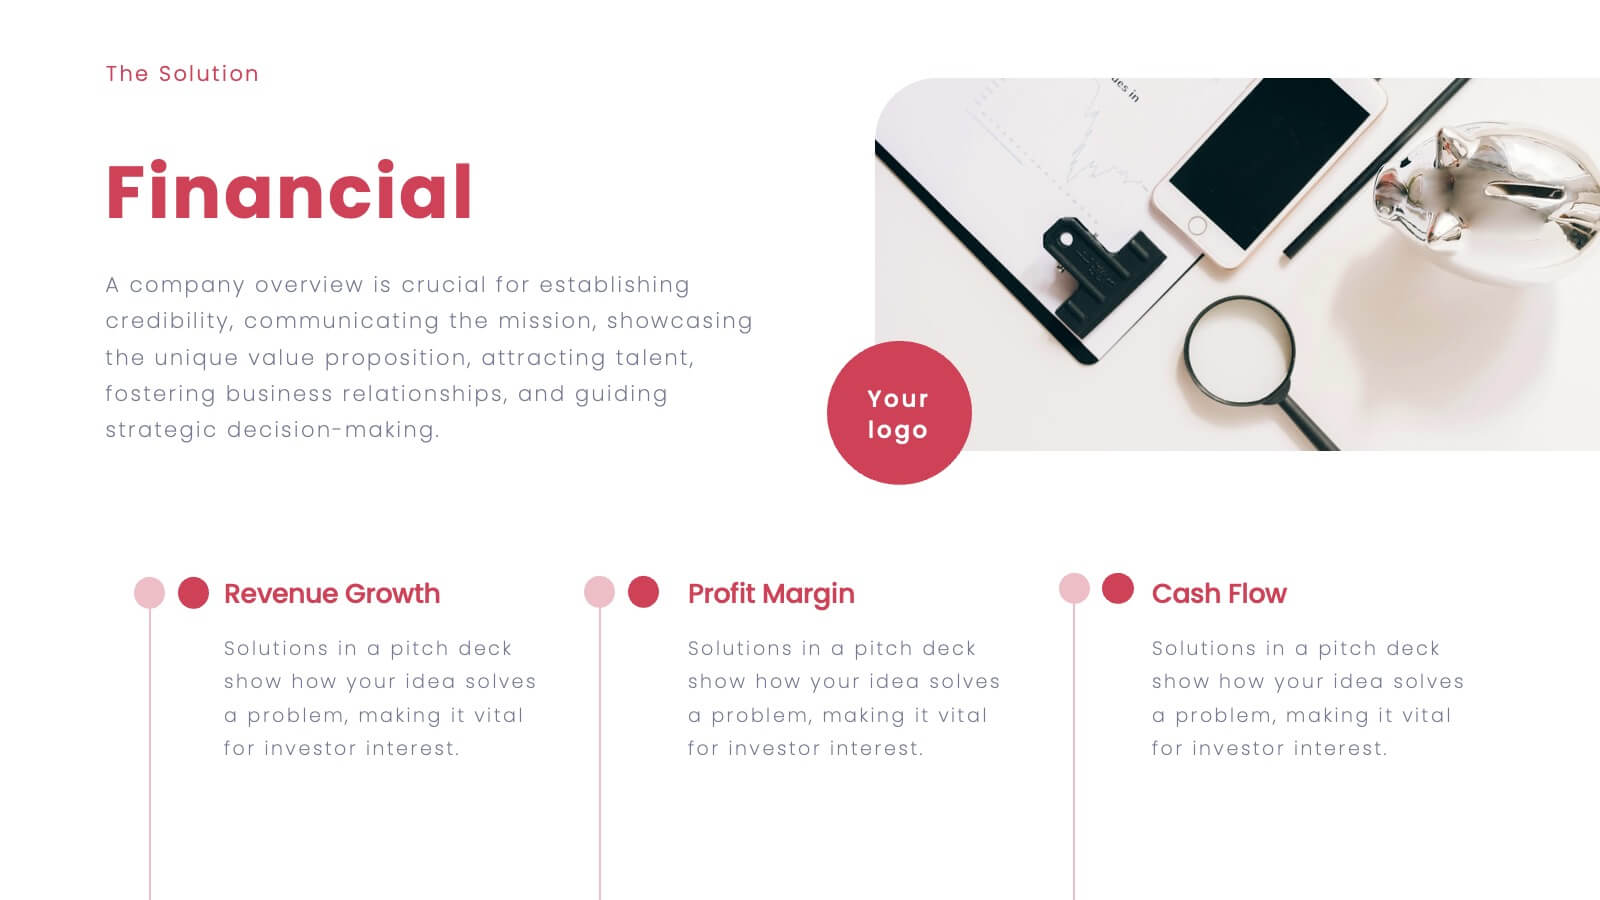
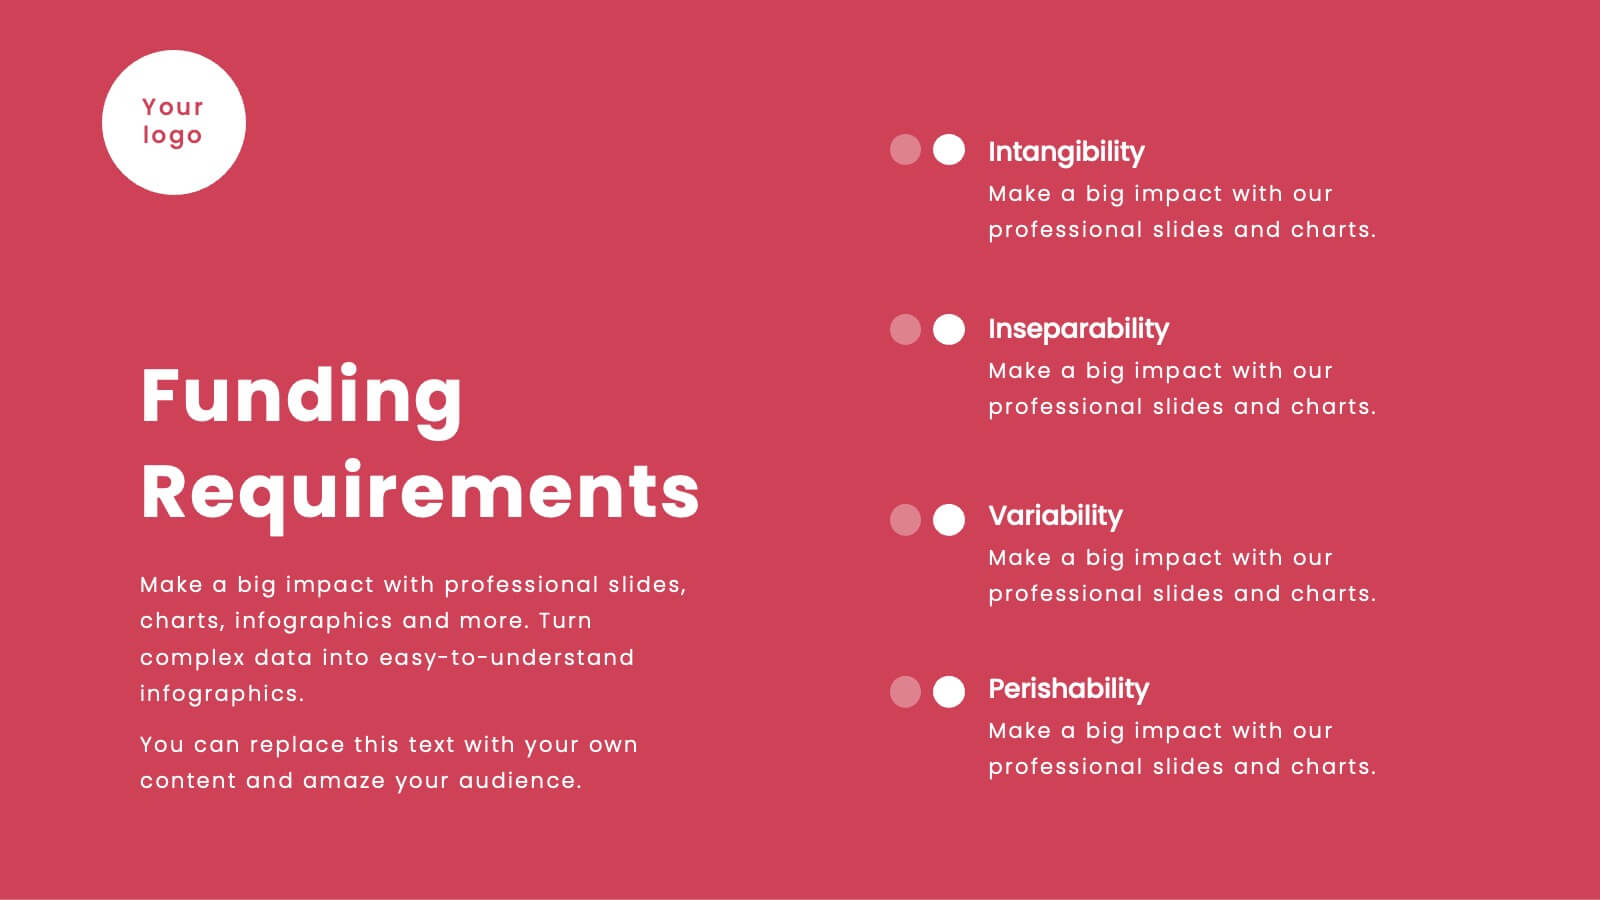
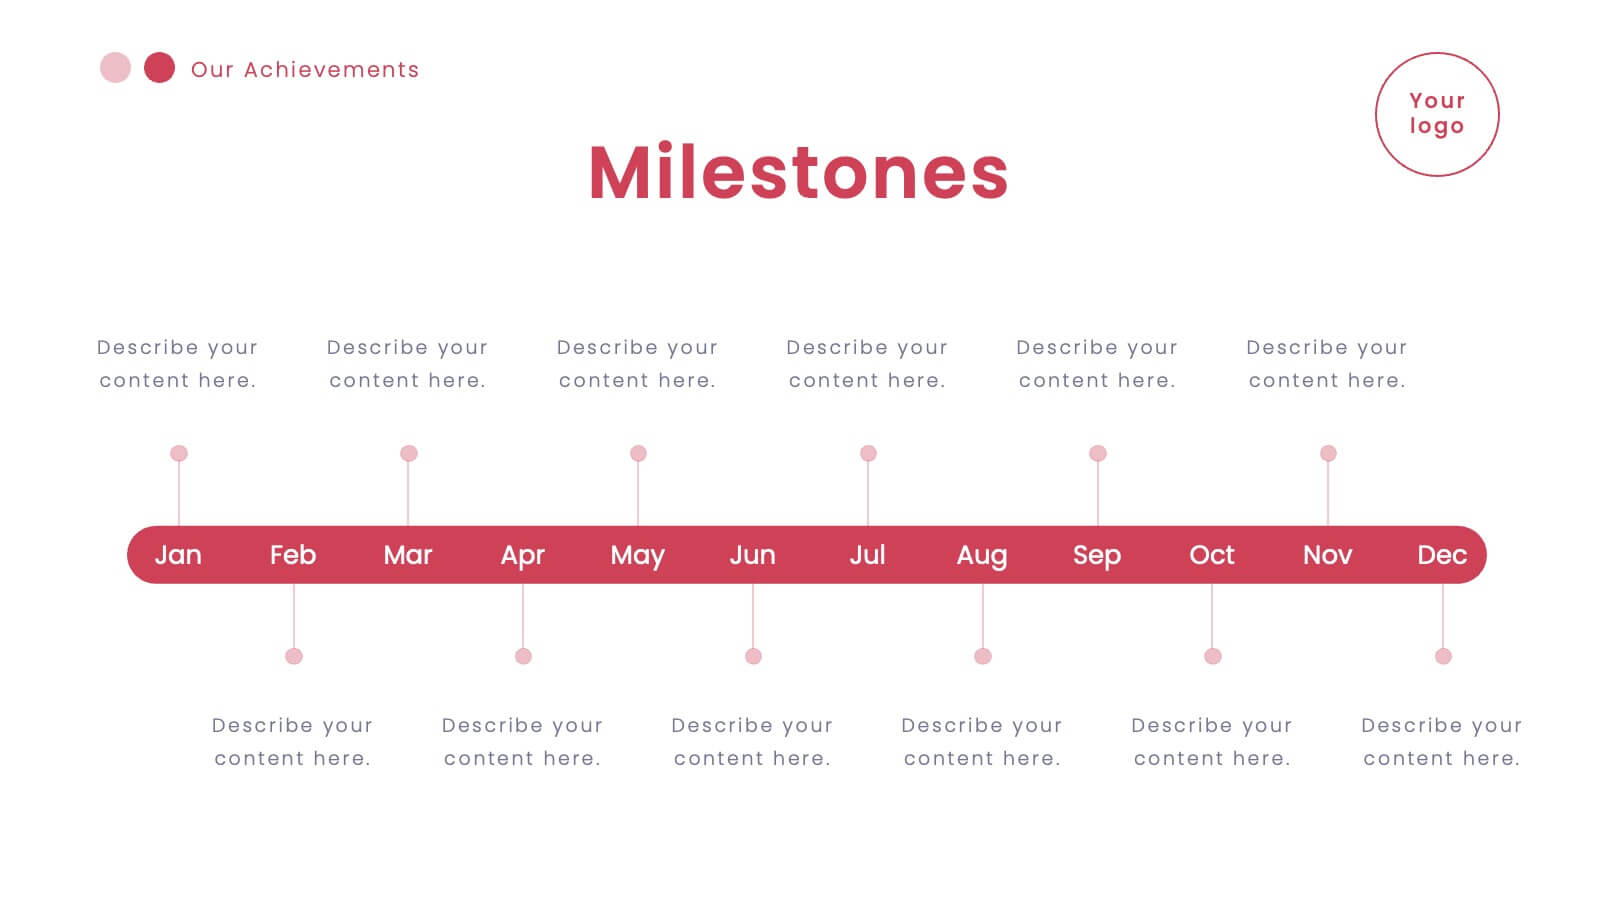
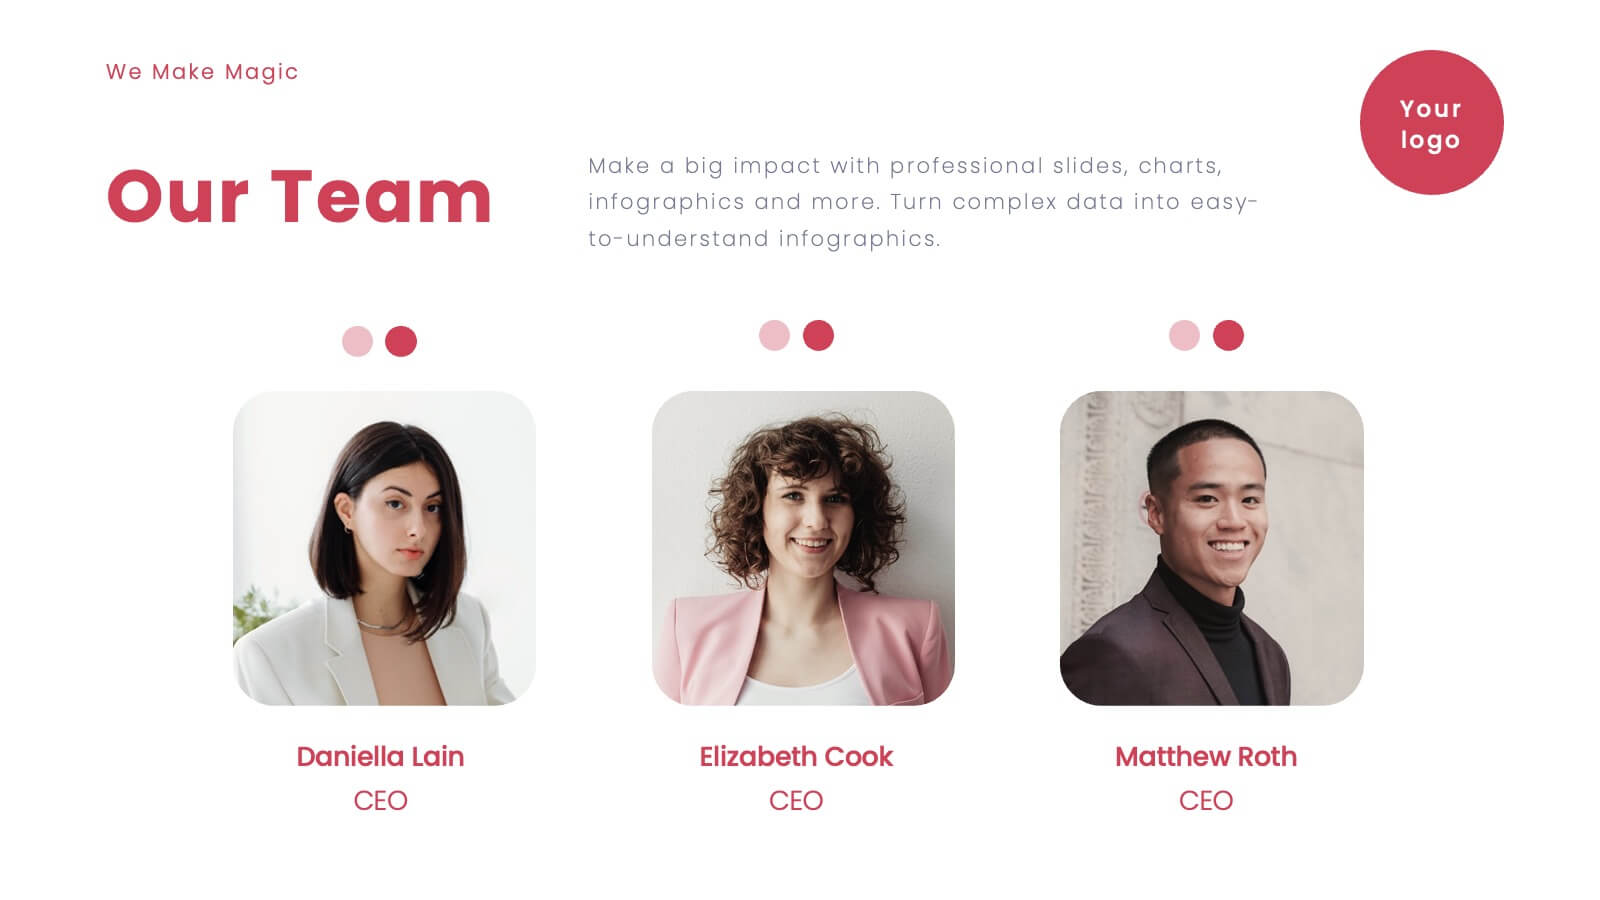
Vortex Startup Pitch Deck Presentation
Launch your ideas into action with this vibrant red pitch deck template, designed to captivate and inform potential investors. It covers everything from company overview to financials and market strategy, ensuring your vision is communicated effectively. Compatible with PowerPoint, Google Slides, and Keynote, this template is perfect for startups seeking to impress and engage.


21 slides
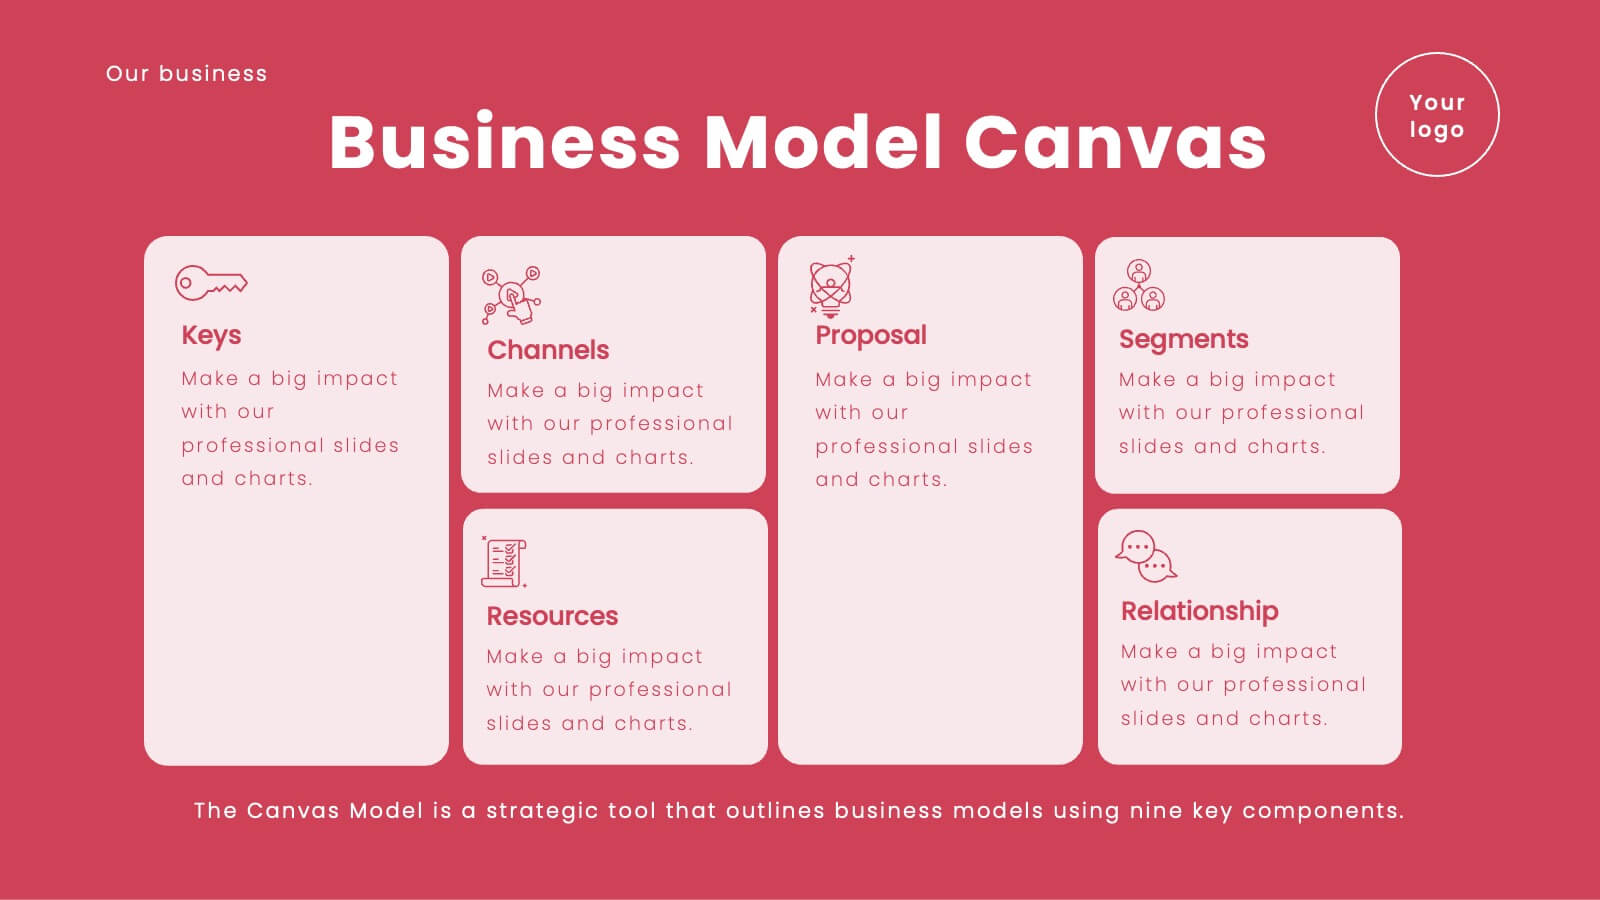
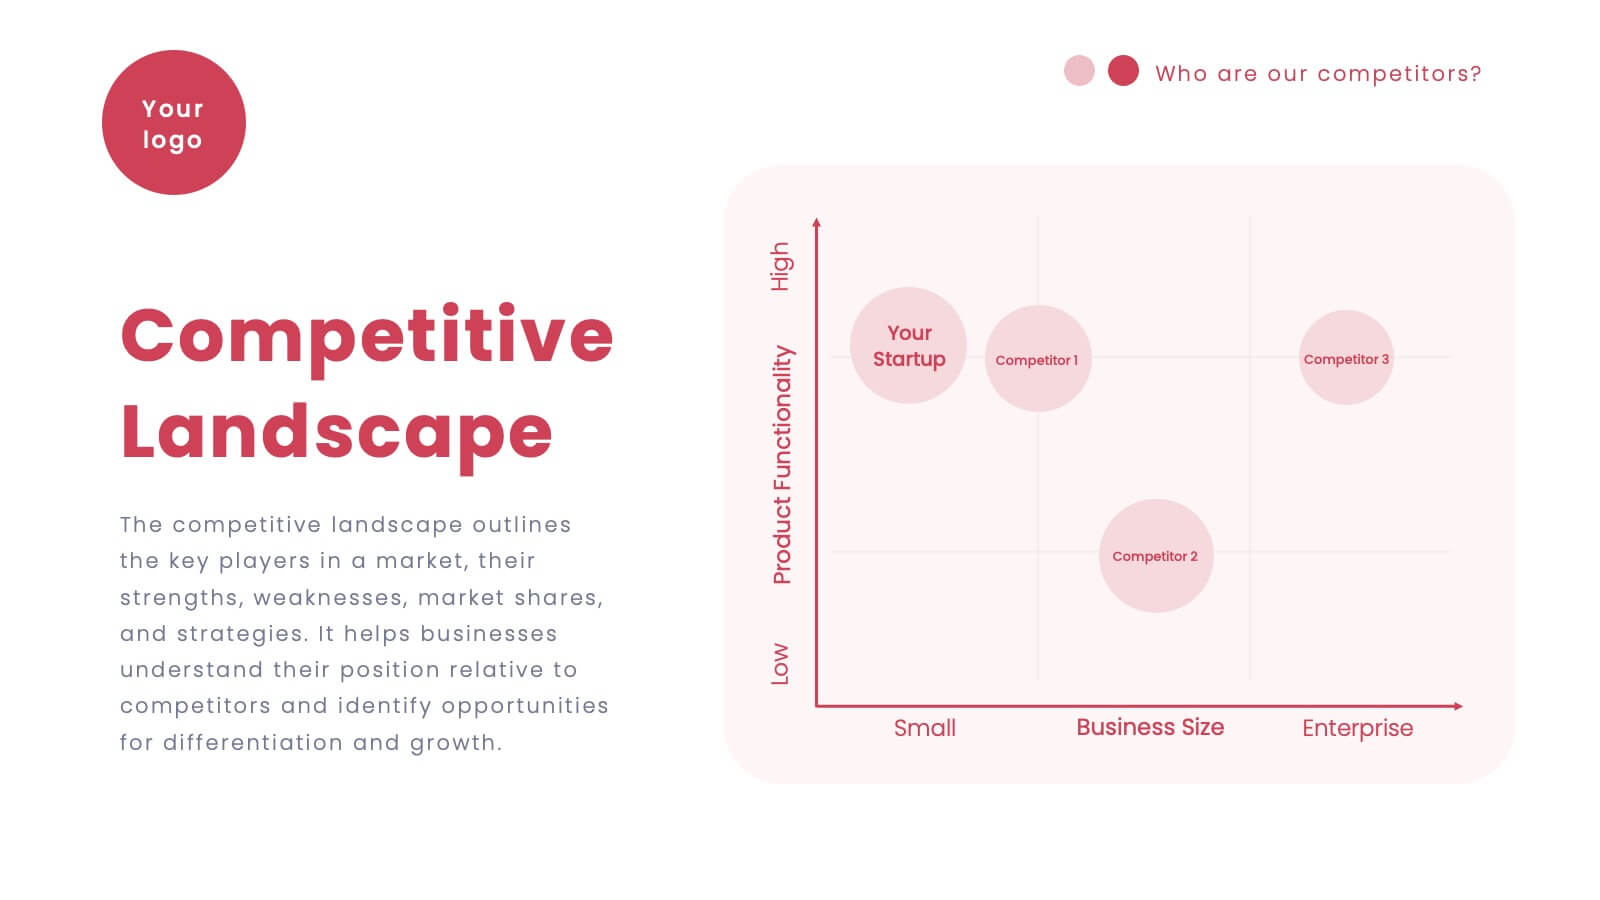
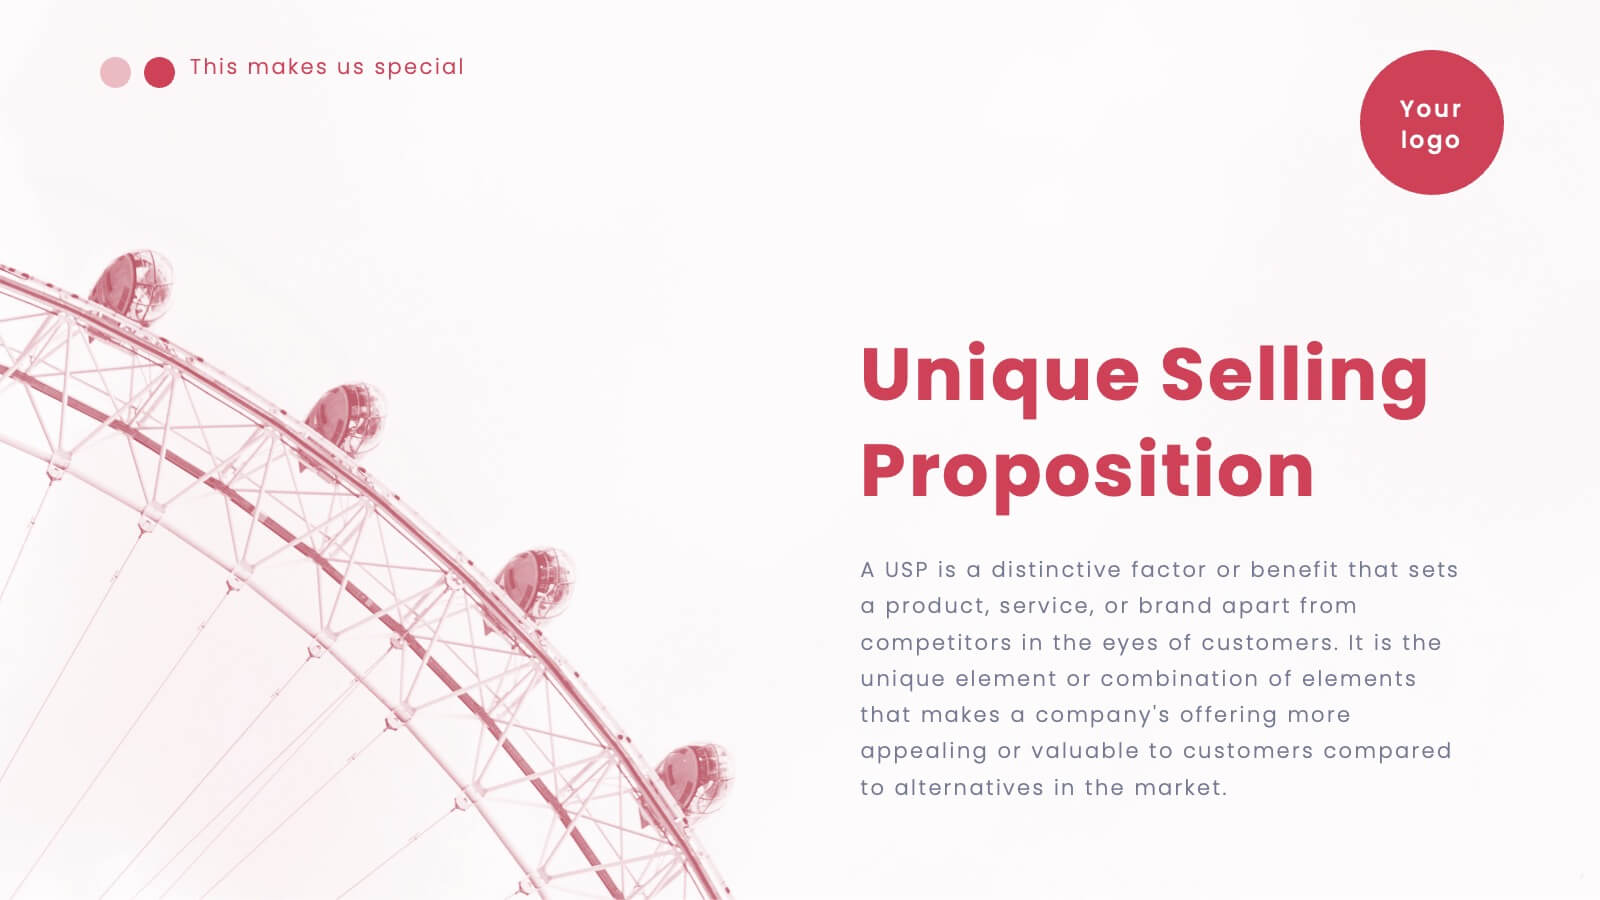
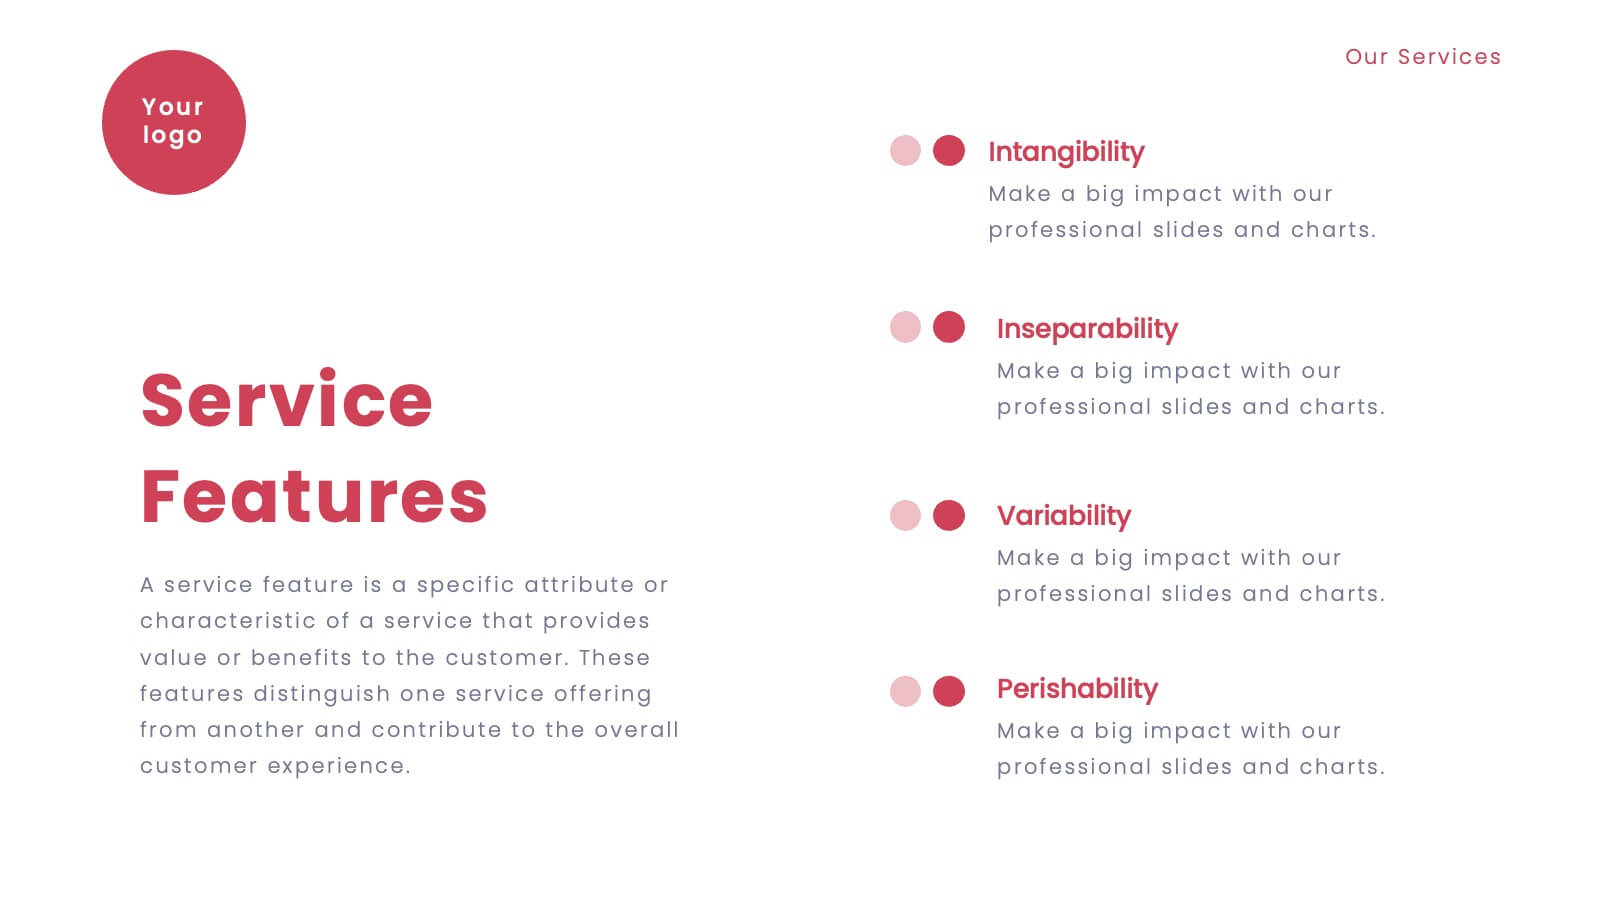
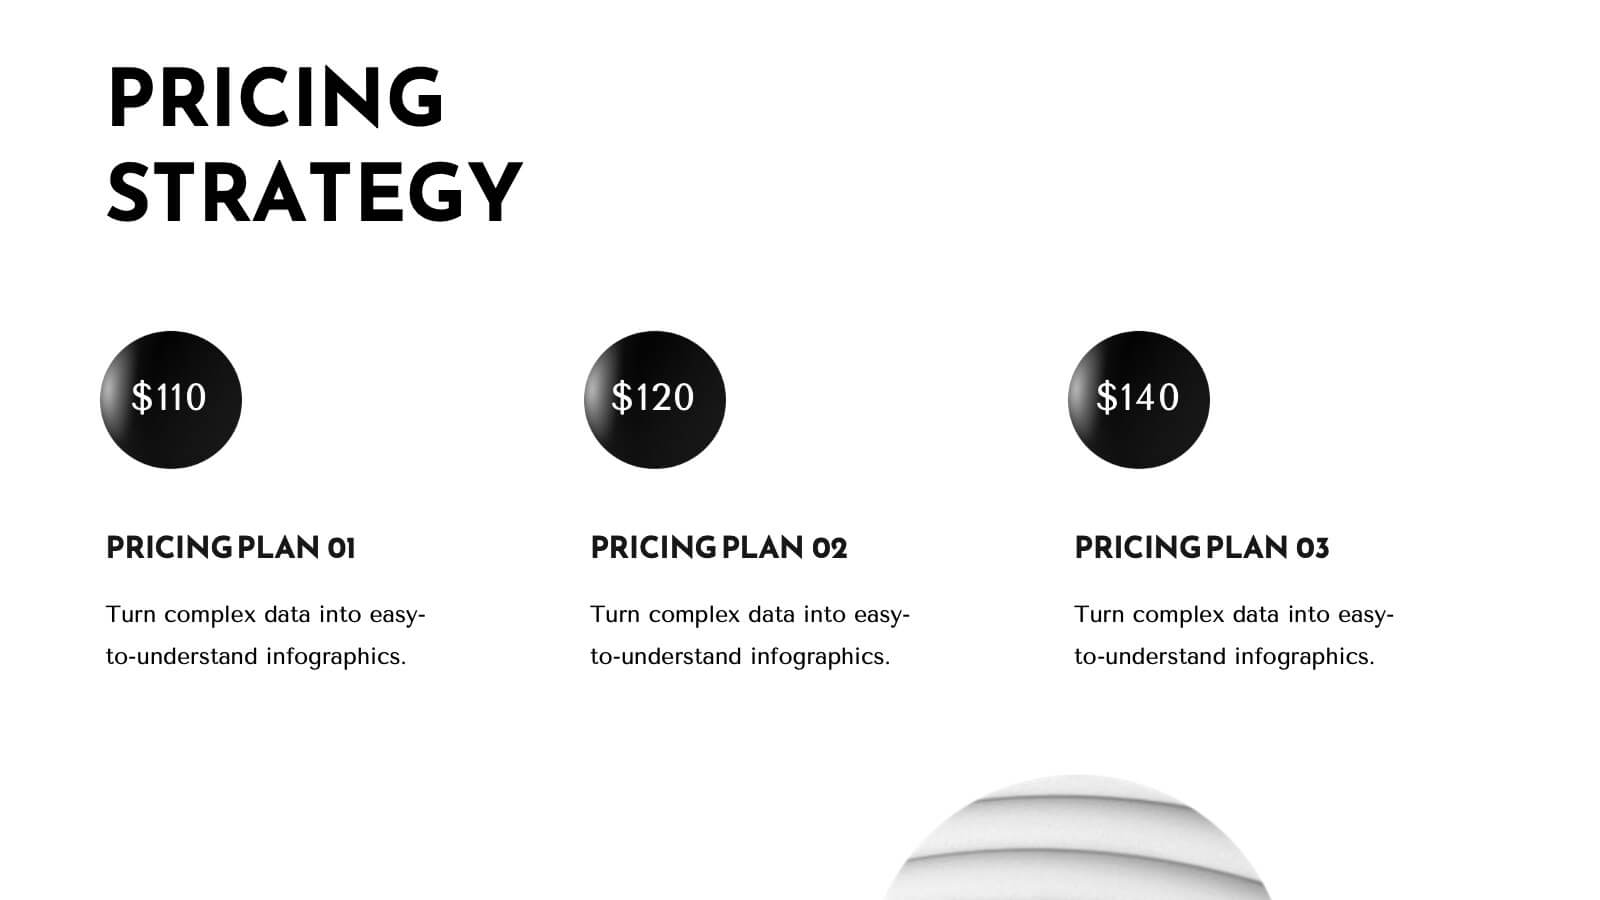
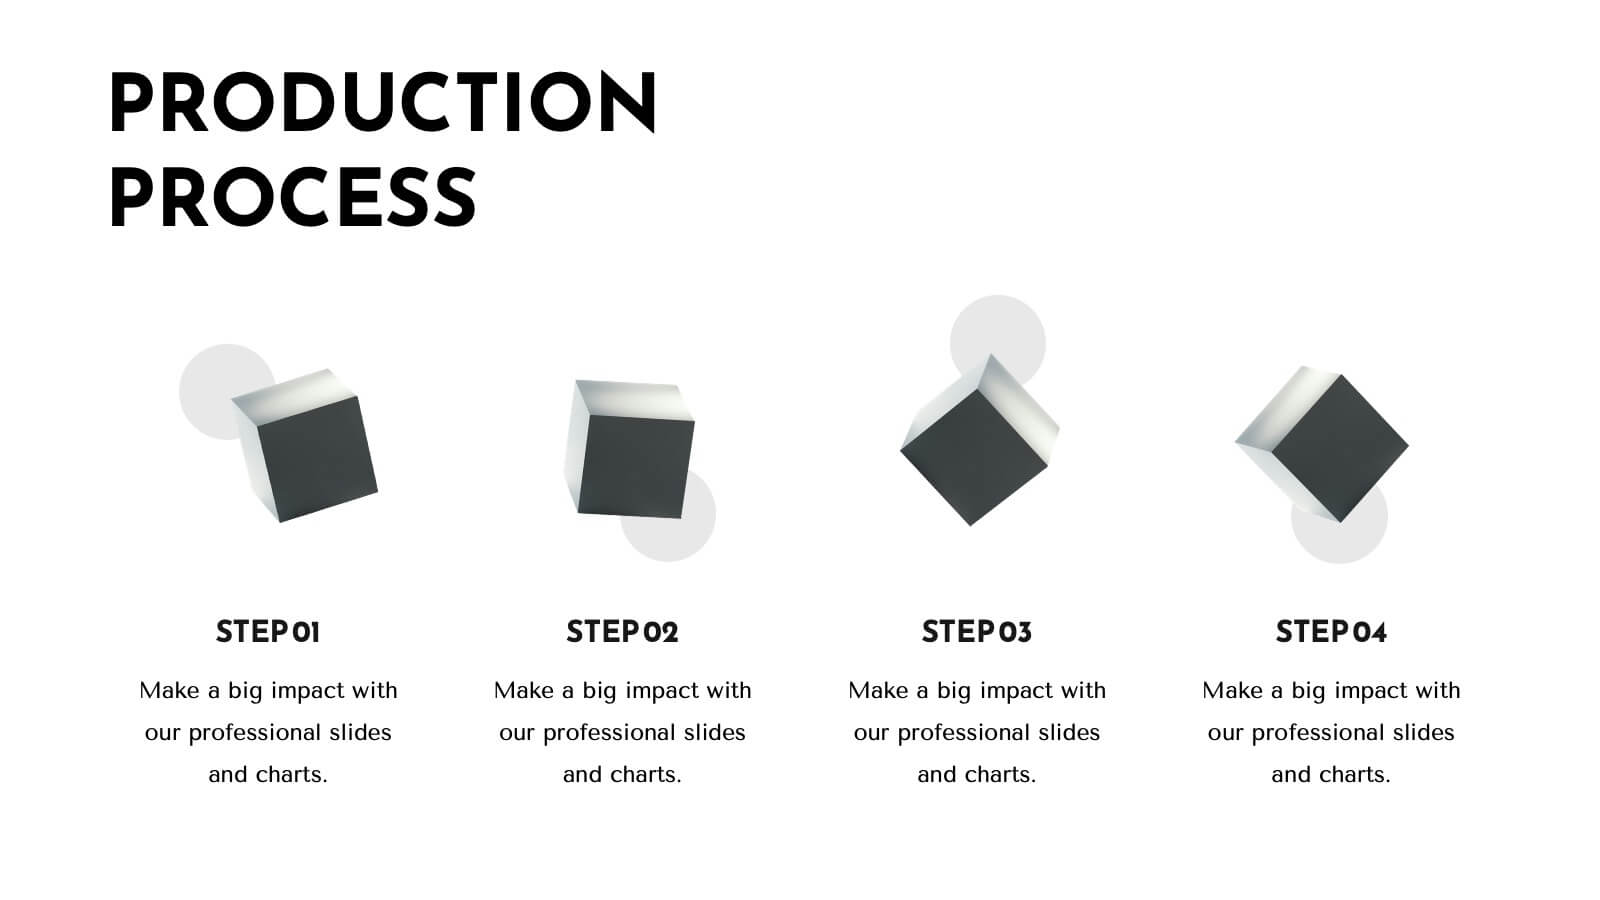
Trident Product Development Plan Presentation
Present your product development strategy with this sleek, professional template! Highlight company overview, product features, and unique selling proposition. Ideal for showcasing market analysis, pricing strategy, and production process. Perfect for developers and project managers. Compatible with PowerPoint, Keynote, and Google Slides.


7 slides
International Finance Infographic
International finance is a branch of economics and financial studies that deals with monetary interactions that occur between two or more countries. Dive into the intricate world of finance with our visually captivating international finance infographic. This template is your passport to understanding the complexities and opportunities in the global financial landscape. With this template you will be able to analyze the dynamics of exchange rates, foreign investment, and how these factors influence global economics. This infographic is crafted to provide a holistic view of the world of finance.


7 slides
Developmental Milestone Infographic
Developmental milestones are specific skills or abilities achieved by individuals within a certain age range that indicate their growth and progress in various domains of development, including physical, cognitive, social, and emotional. This infographic template is designed to showcase the key developmental milestones children typically reach at various ages, guiding parents and caregivers in understanding and celebrating these significant achievements. Compatible with Powerpoint, Keynote, and Google Slides. Encourage celebrating each milestone achieved, emphasizing the positive impact on development and motivation.


4 slides
ABC Learning Slide Deck Presentation
Kickstart your ideas with a playful, rocket-shaped layout that turns simple ABC steps into a clear, engaging story. This presentation helps break down processes, lessons, or concepts in a way that feels intuitive and dynamic. Fully customizable and compatible with PowerPoint, Keynote, and Google Slides.


7 slides
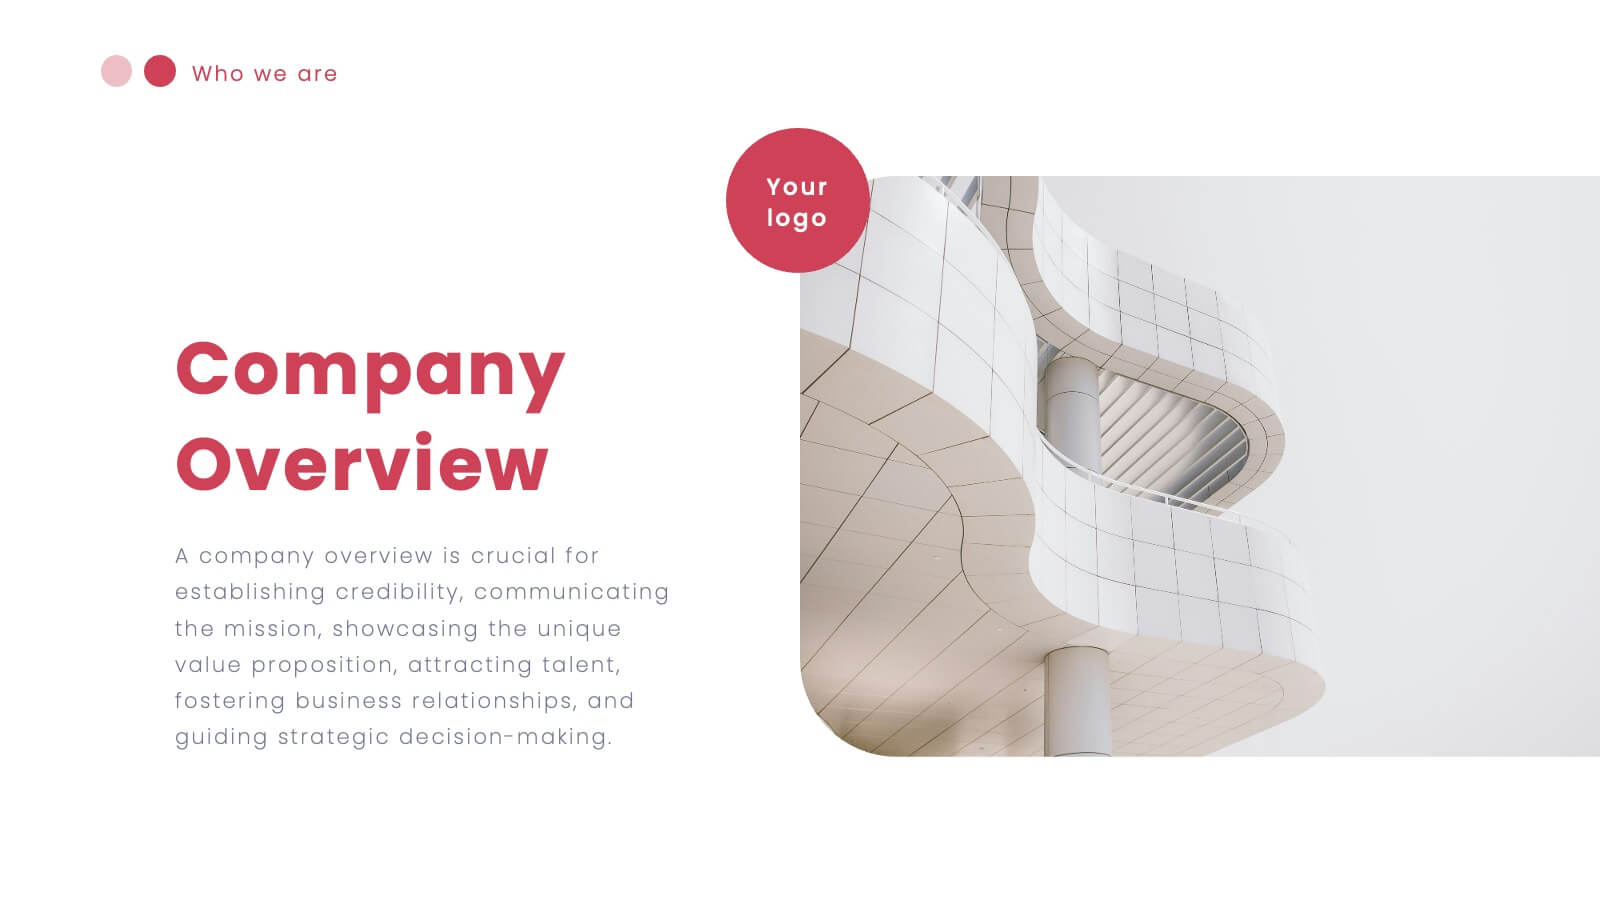
Company Vision and Future Direction
Bring your company’s future into focus with this sleek, icon-led layout designed to showcase strategic goals, values, and long-term vision. Perfect for leadership presentations, investor updates, or team briefings, this slide turns abstract direction into a clear path forward. Fully compatible with PowerPoint, Keynote, and Google Slides.


7 slides
Buyer Persona Guide Infographic
Elevate your marketing strategy with our Buyer Persona Guide Infographic Template, designed to distill complex customer data into stunning, easy-to-understand visual profiles. This template is a canvas for creativity, allowing marketers to paint detailed portraits of their ideal customers using a mix of vibrant colors, engaging layouts, and succinct text. Craft each persona with care, detailing demographics, preferences, behaviors, and needs, all laid out in an aesthetically pleasing format that makes data pop off the page. Whether you're presenting to stakeholders, guiding your content strategy, or training your sales team, these visuals serve as your roadmap to deeper customer connections. Fully customizable to reflect your brand's unique voice and style, this template adapts seamlessly to your needs, ensuring that every insight into your audience is not just informative but also visually captivating. It's an essential tool for anyone looking to enhance their understanding of their market and refine their approach to meet customer demands.