


Features
- 4 Unique slides
- Fully editable and easy to edit in Microsoft Powerpoint, Keynote and Google Slides
- 16:9 widescreen layout
- Clean and professional designs
- Export to JPG, PDF or send by email


Do you have any questions?
Recommend


8 slides
Cost Analysis and Budgeting Presentation
Easily assess financial performance with the Cost Analysis and Budgeting Presentation template. This visually engaging slide helps break down cost structures, budget allocation, and financial comparisons in a clear and professional manner. Ideal for financial analysts, business strategists, and project managers presenting financial data. Fully editable in PowerPoint, Keynote, and Google Slides for effortless customization.


6 slides
Porter's Five Forces Market Analysis Presentation
Gain a competitive edge with this Porter's Five Forces market analysis template! Designed to help businesses assess industry dynamics, this structured layout highlights competitive rivalry, supplier power, buyer influence, new market entries, and substitute threats. Perfect for strategists and analysts. Fully customizable and compatible with PowerPoint, Keynote, and Google Slides.


5 slides
Clear Strategy in Five Stages Presentation
Outline your strategic roadmap with this five-step cube staircase layout. Perfect for planning, growth tracking, or project milestones, each stage is color-coded with icons and numbered steps for clarity. Easy to edit in PowerPoint, Keynote, and Google Slides—ideal for business planning, strategy sessions, or performance reviews.


6 slides
Real Estate Investment Portfolio Presentation
Bring your presentation to life with a clean, engaging layout that makes complex property portfolios easy to understand. This slide helps you break down key investments, showcase performance, and highlight essential insights with clarity and flow. Perfect for real estate reports or pitch decks, and fully compatible with PowerPoint, Keynote, and Google Slides.
22 slides
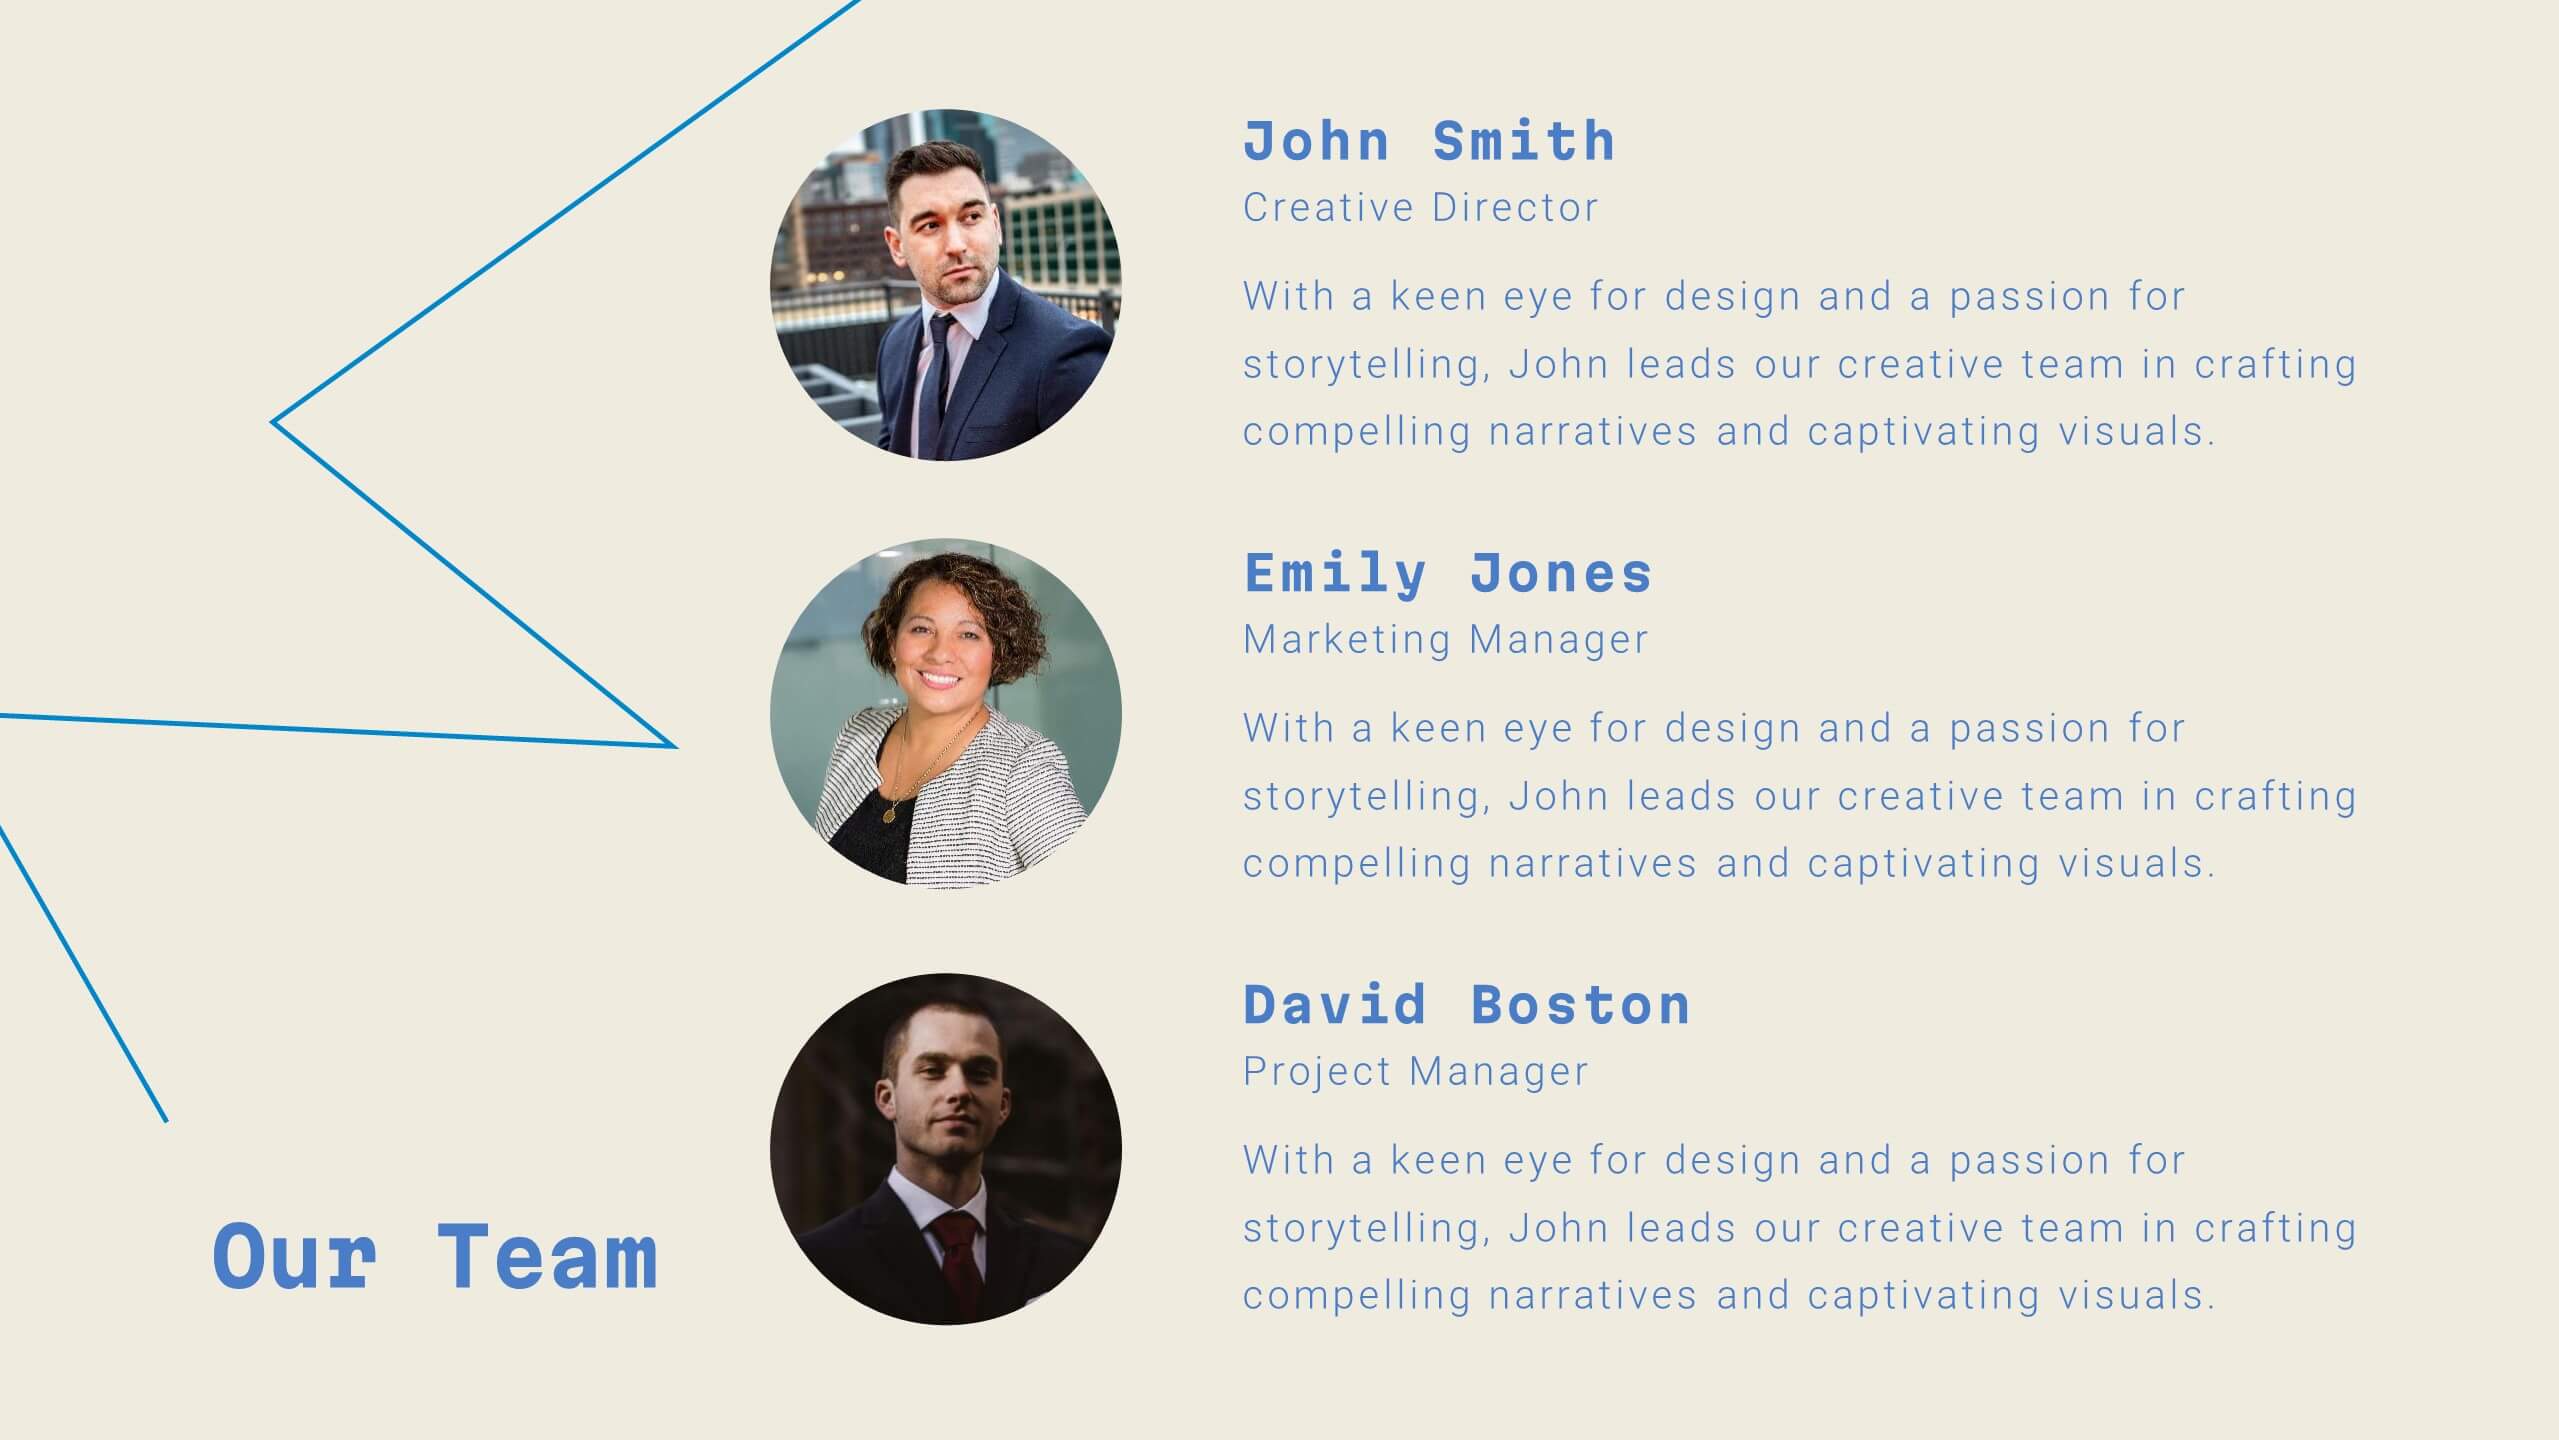
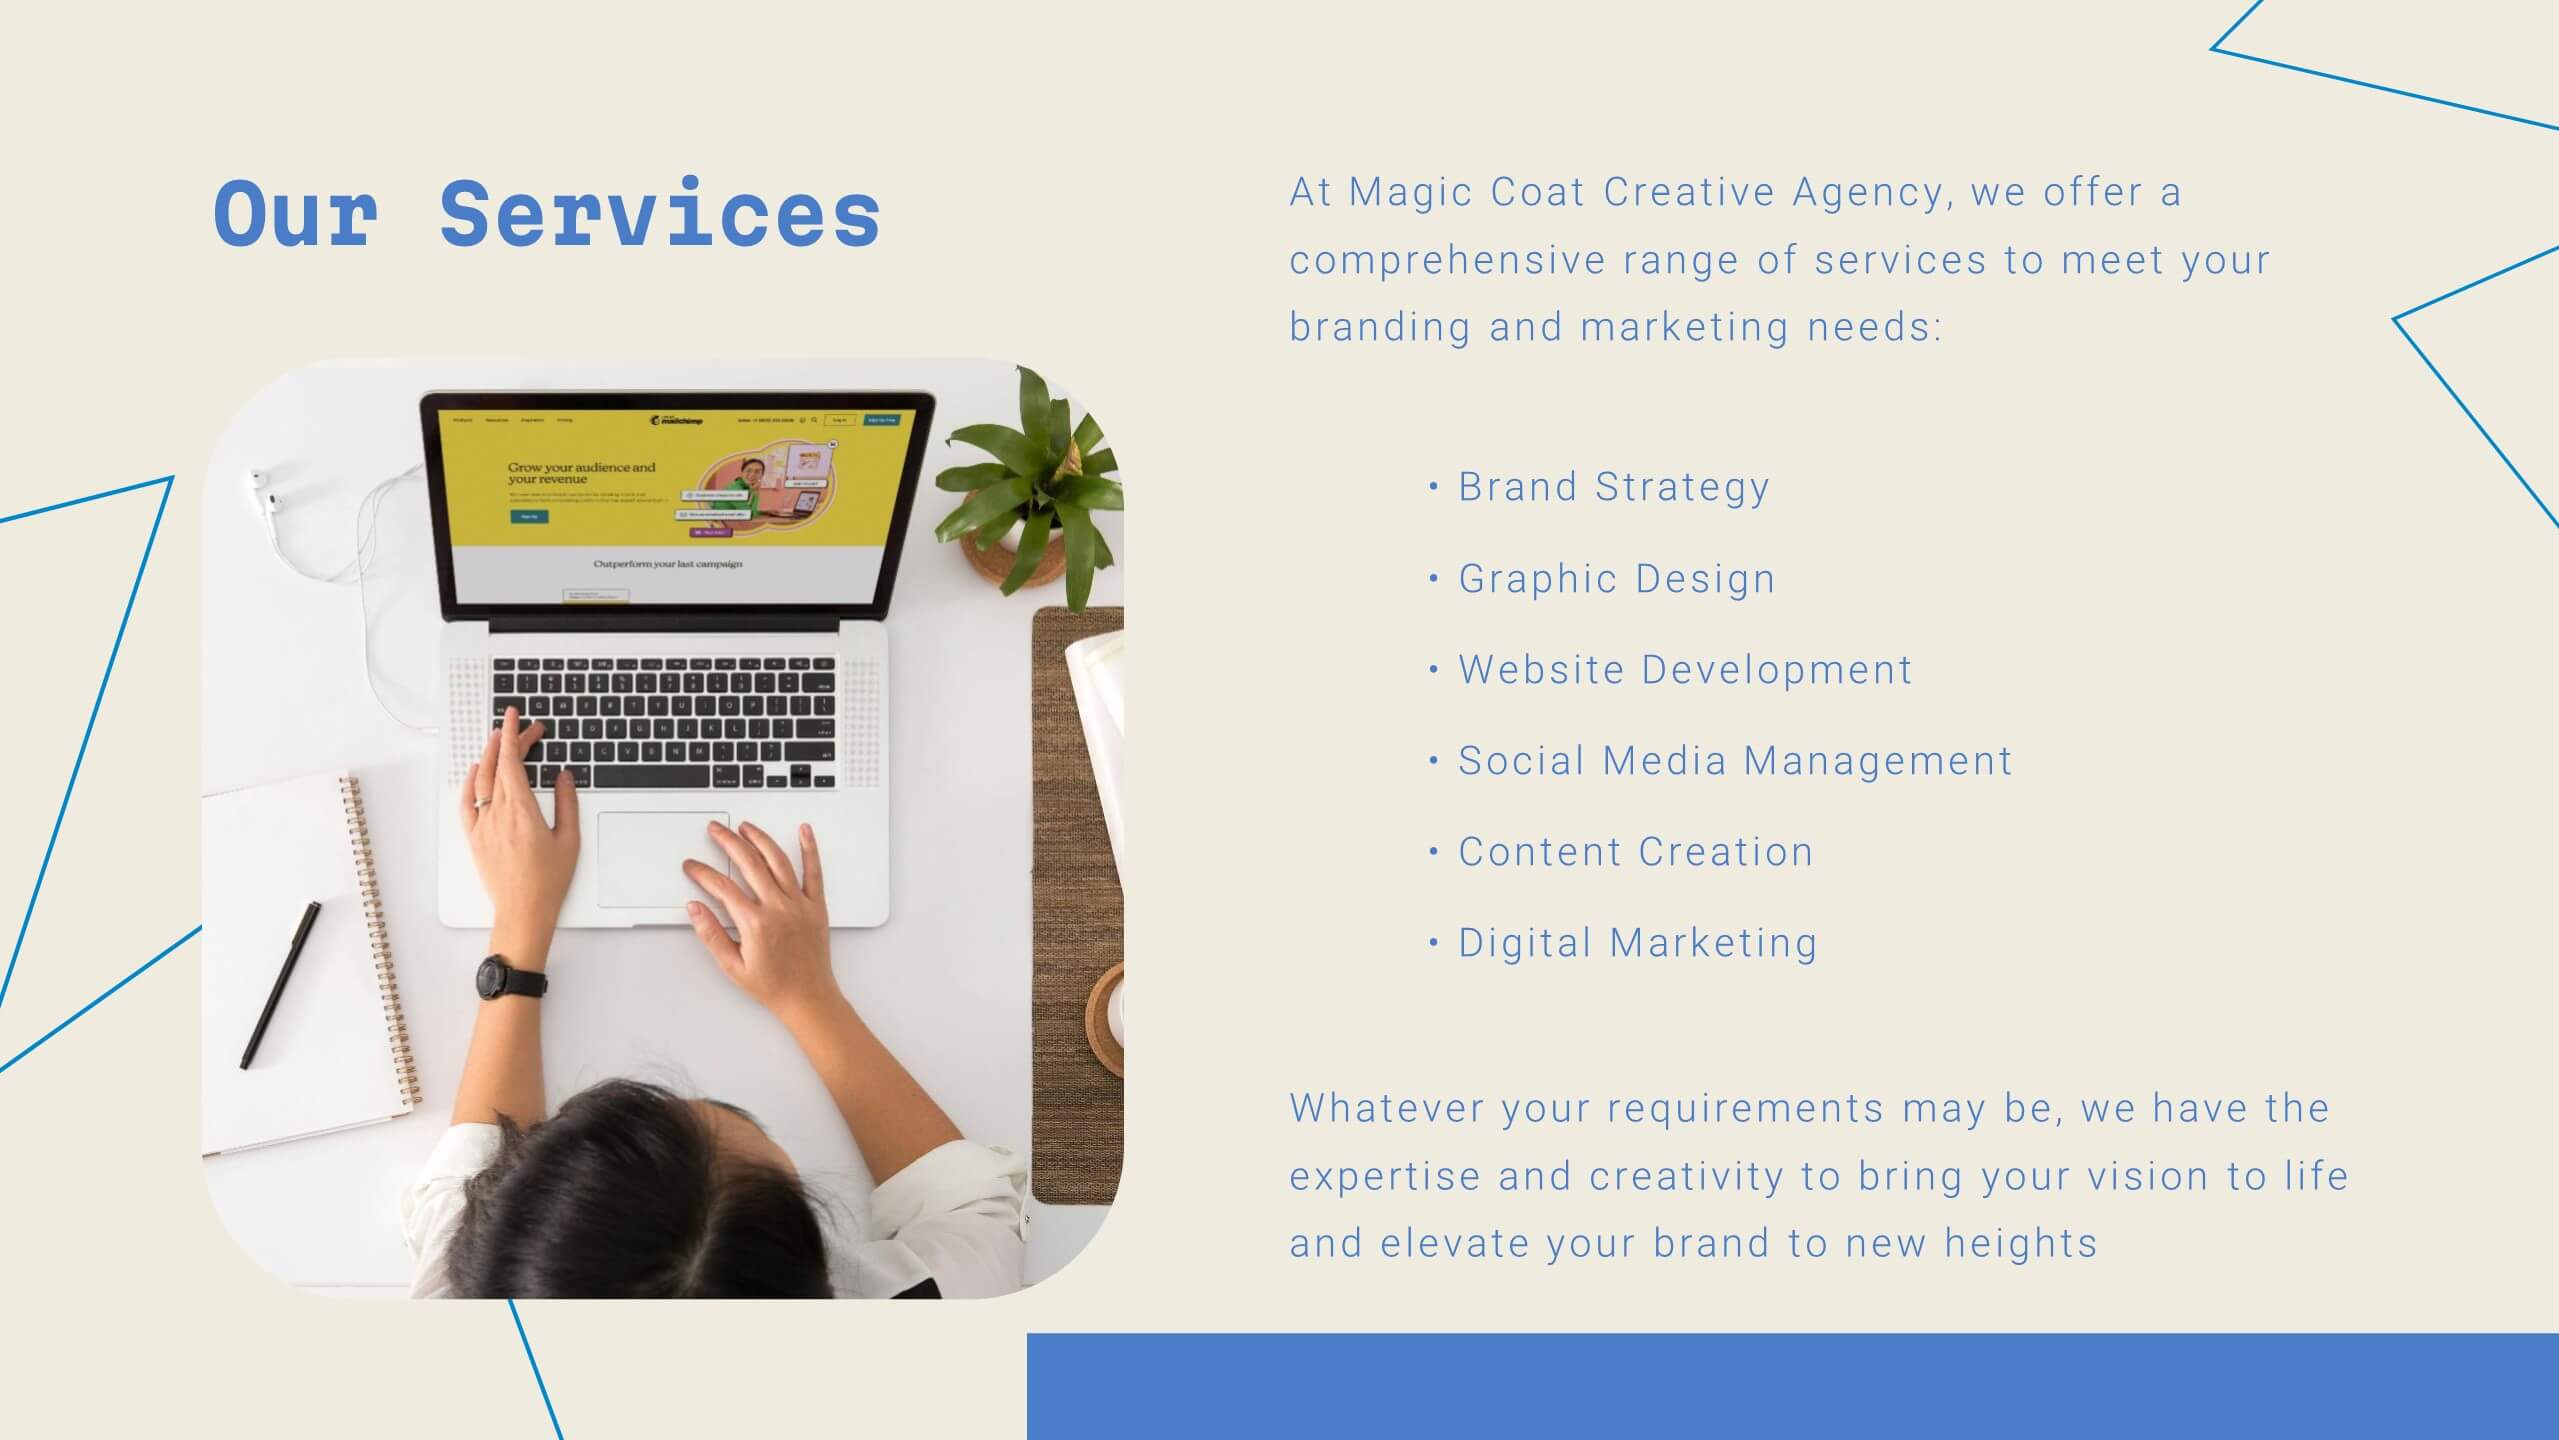
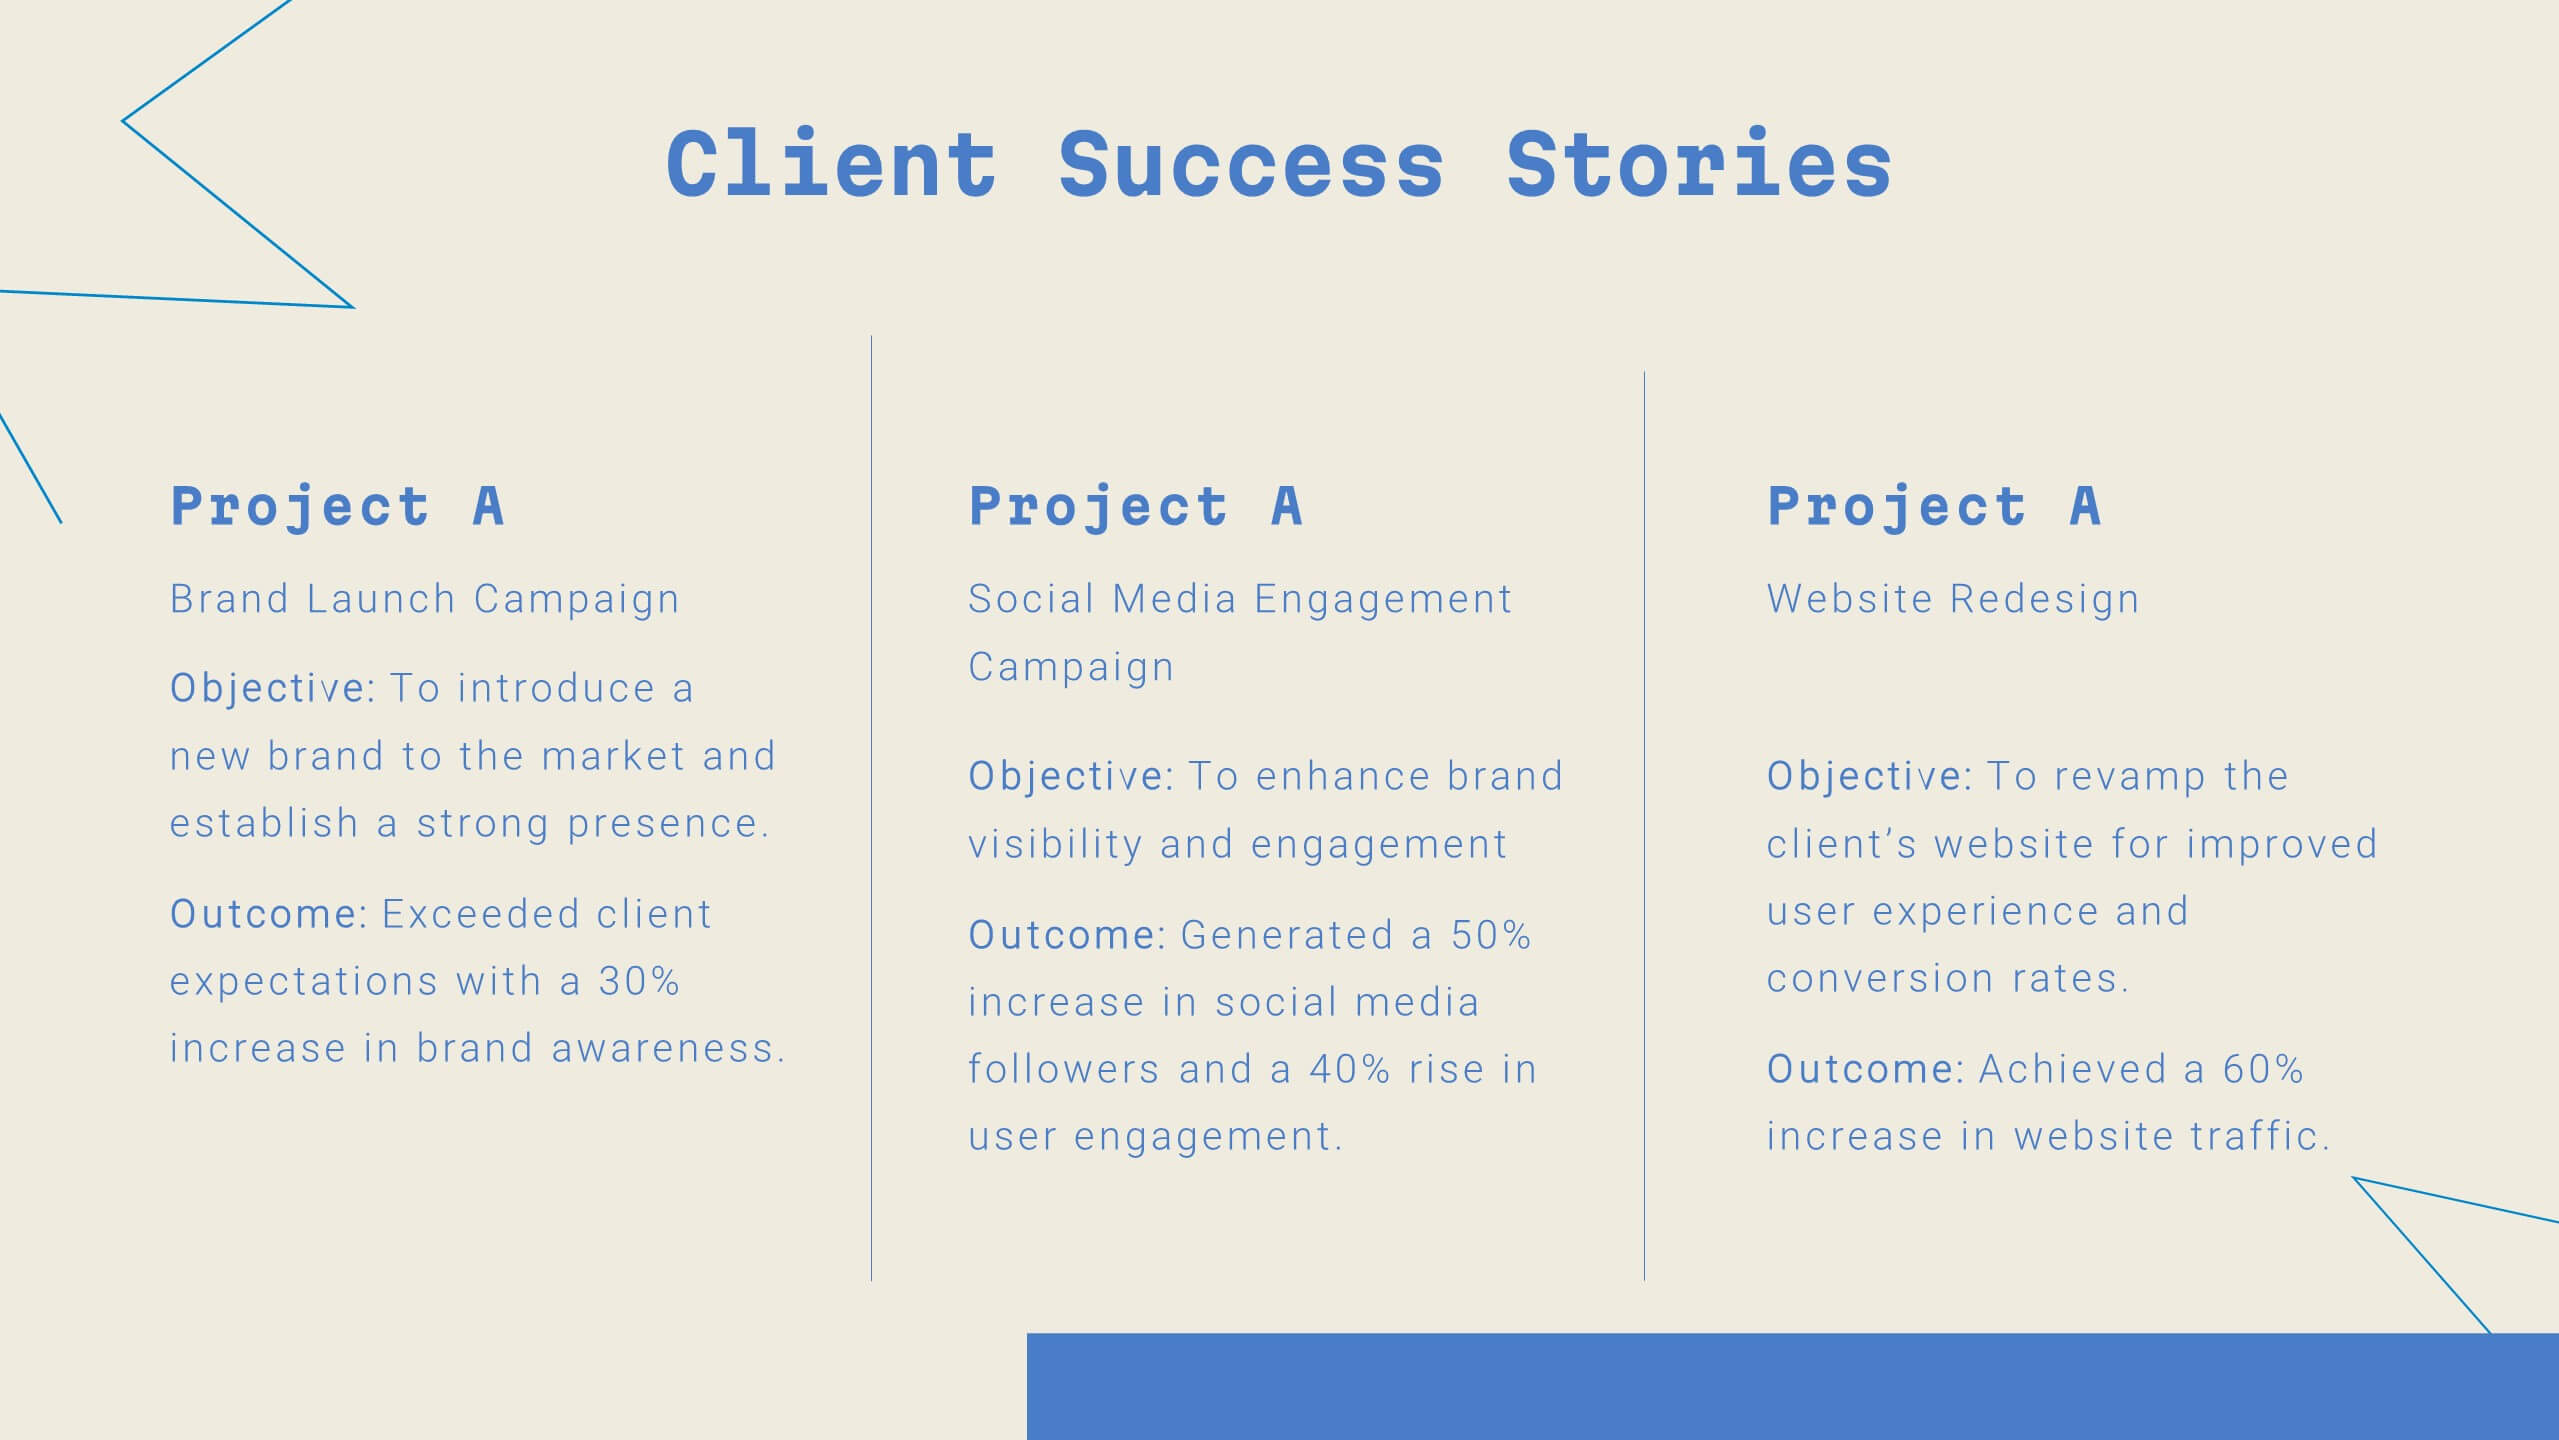
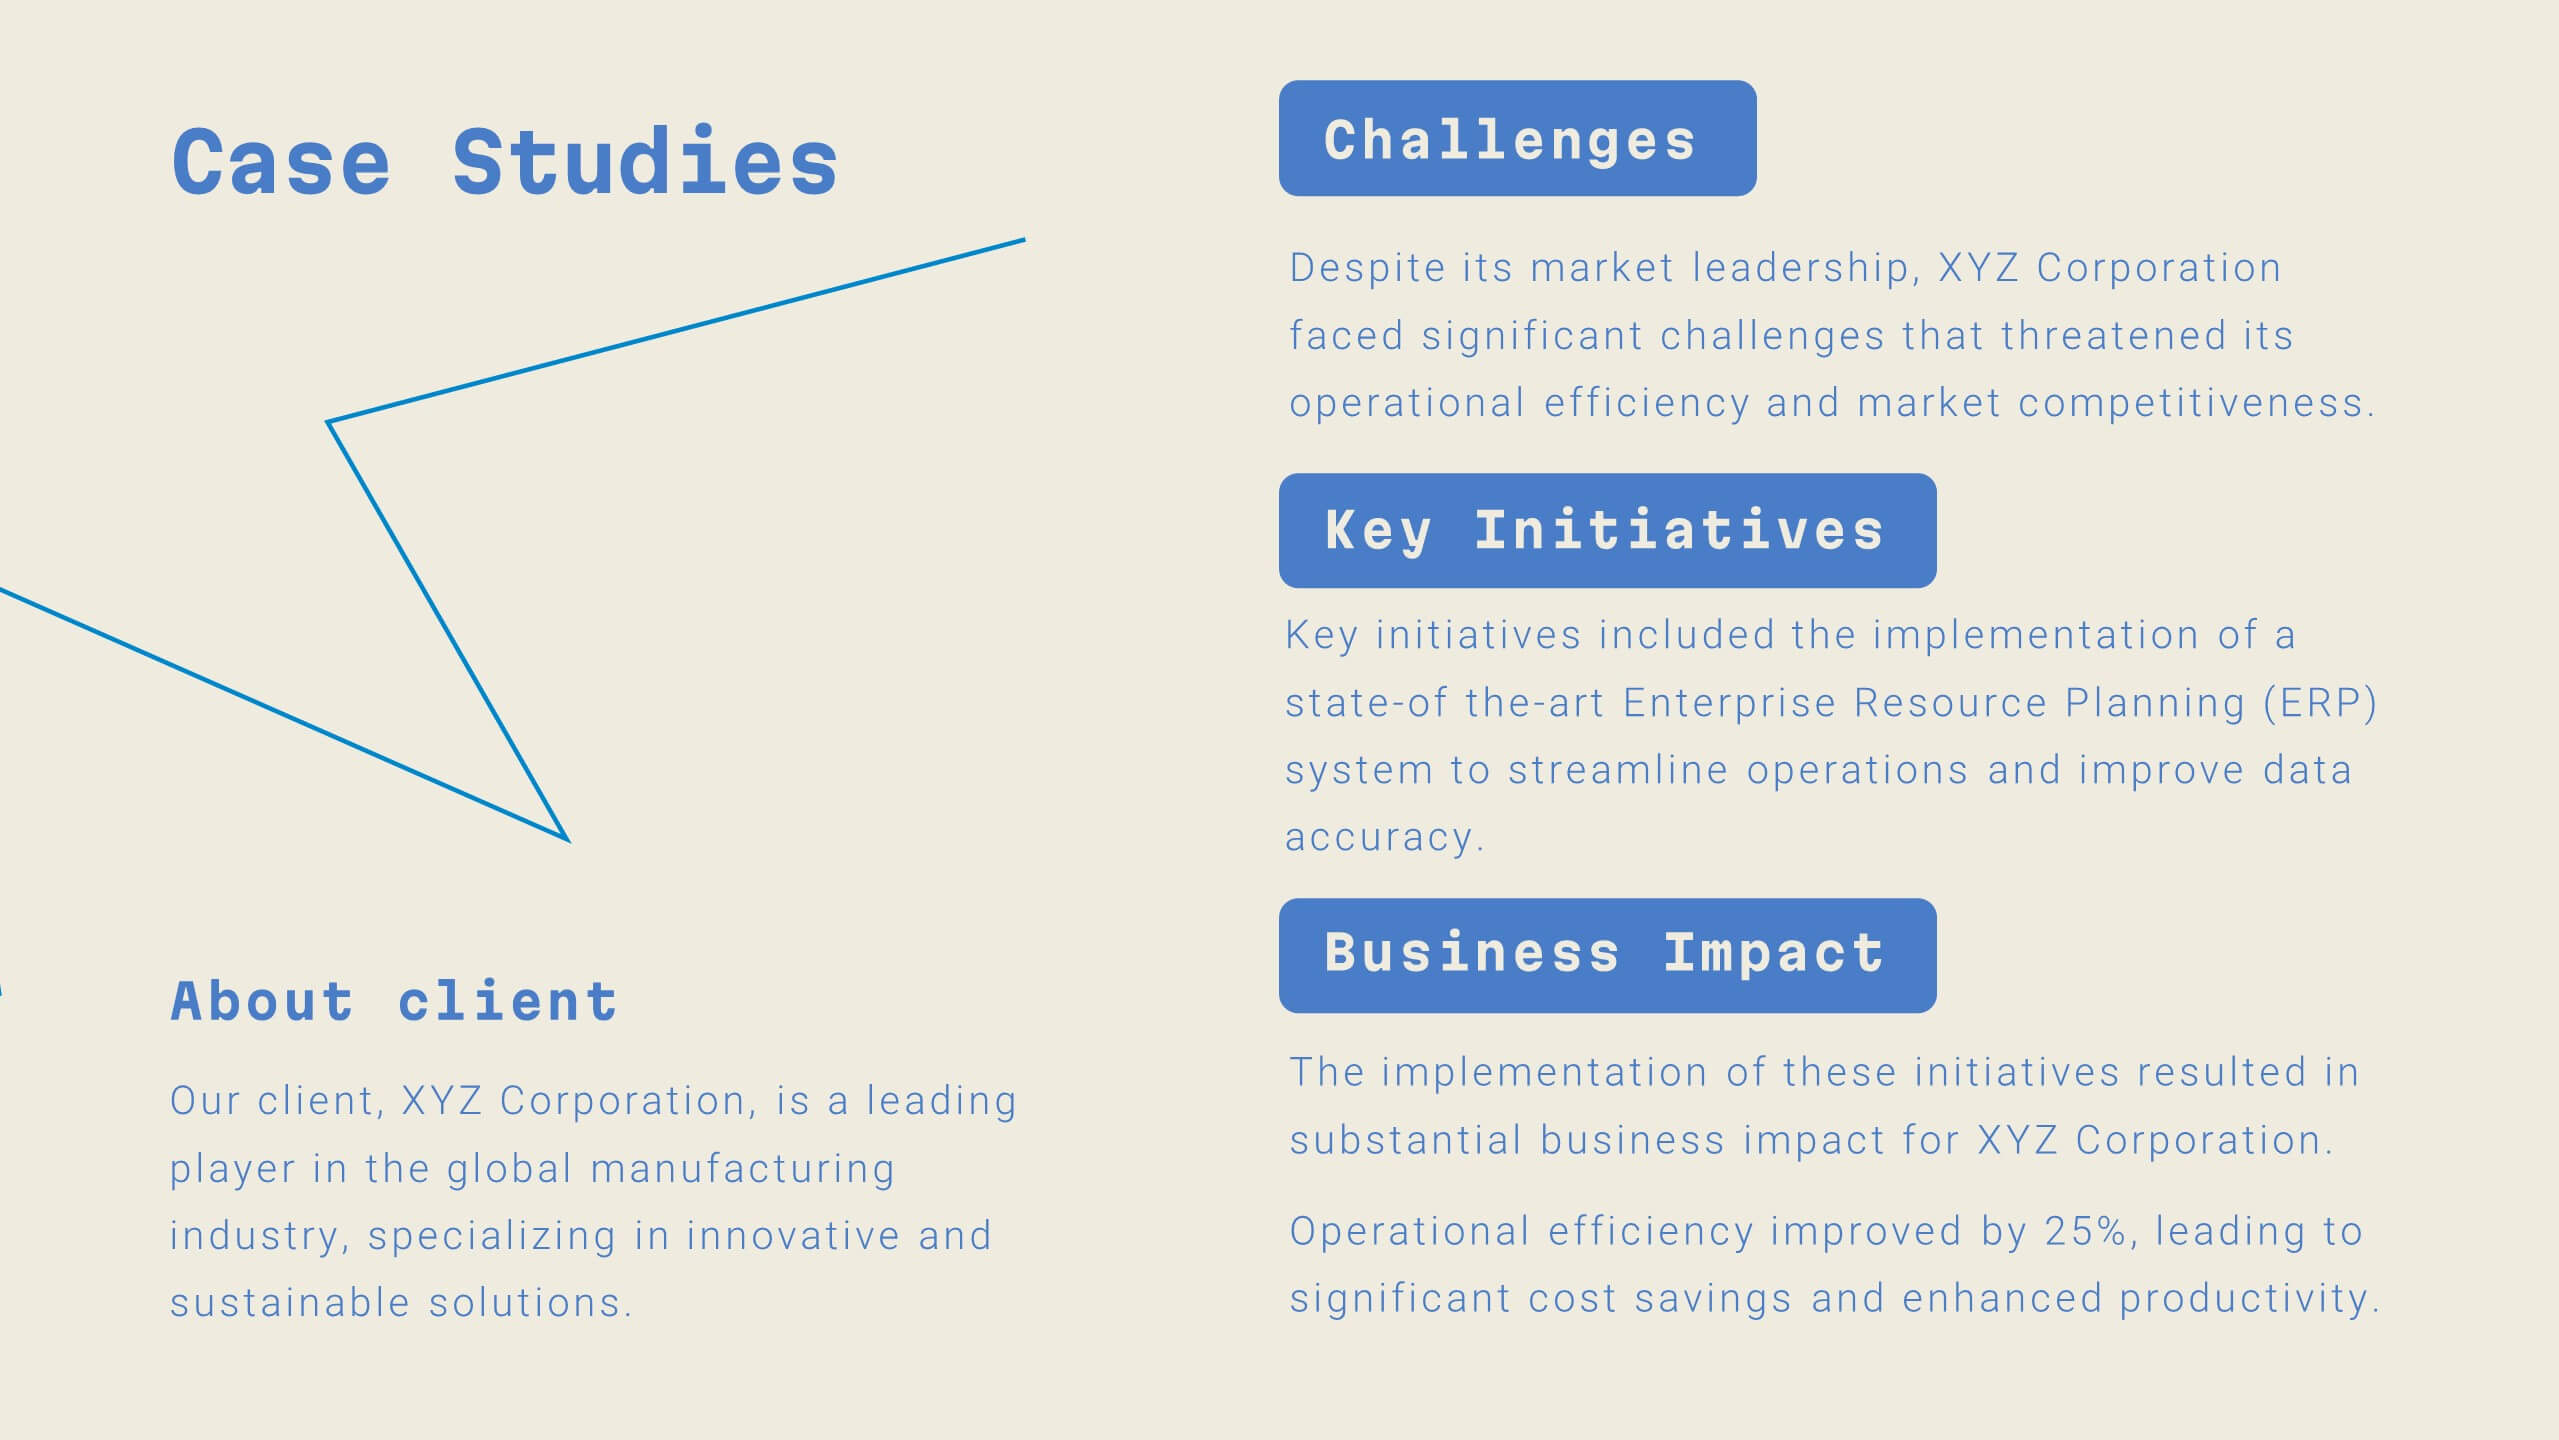
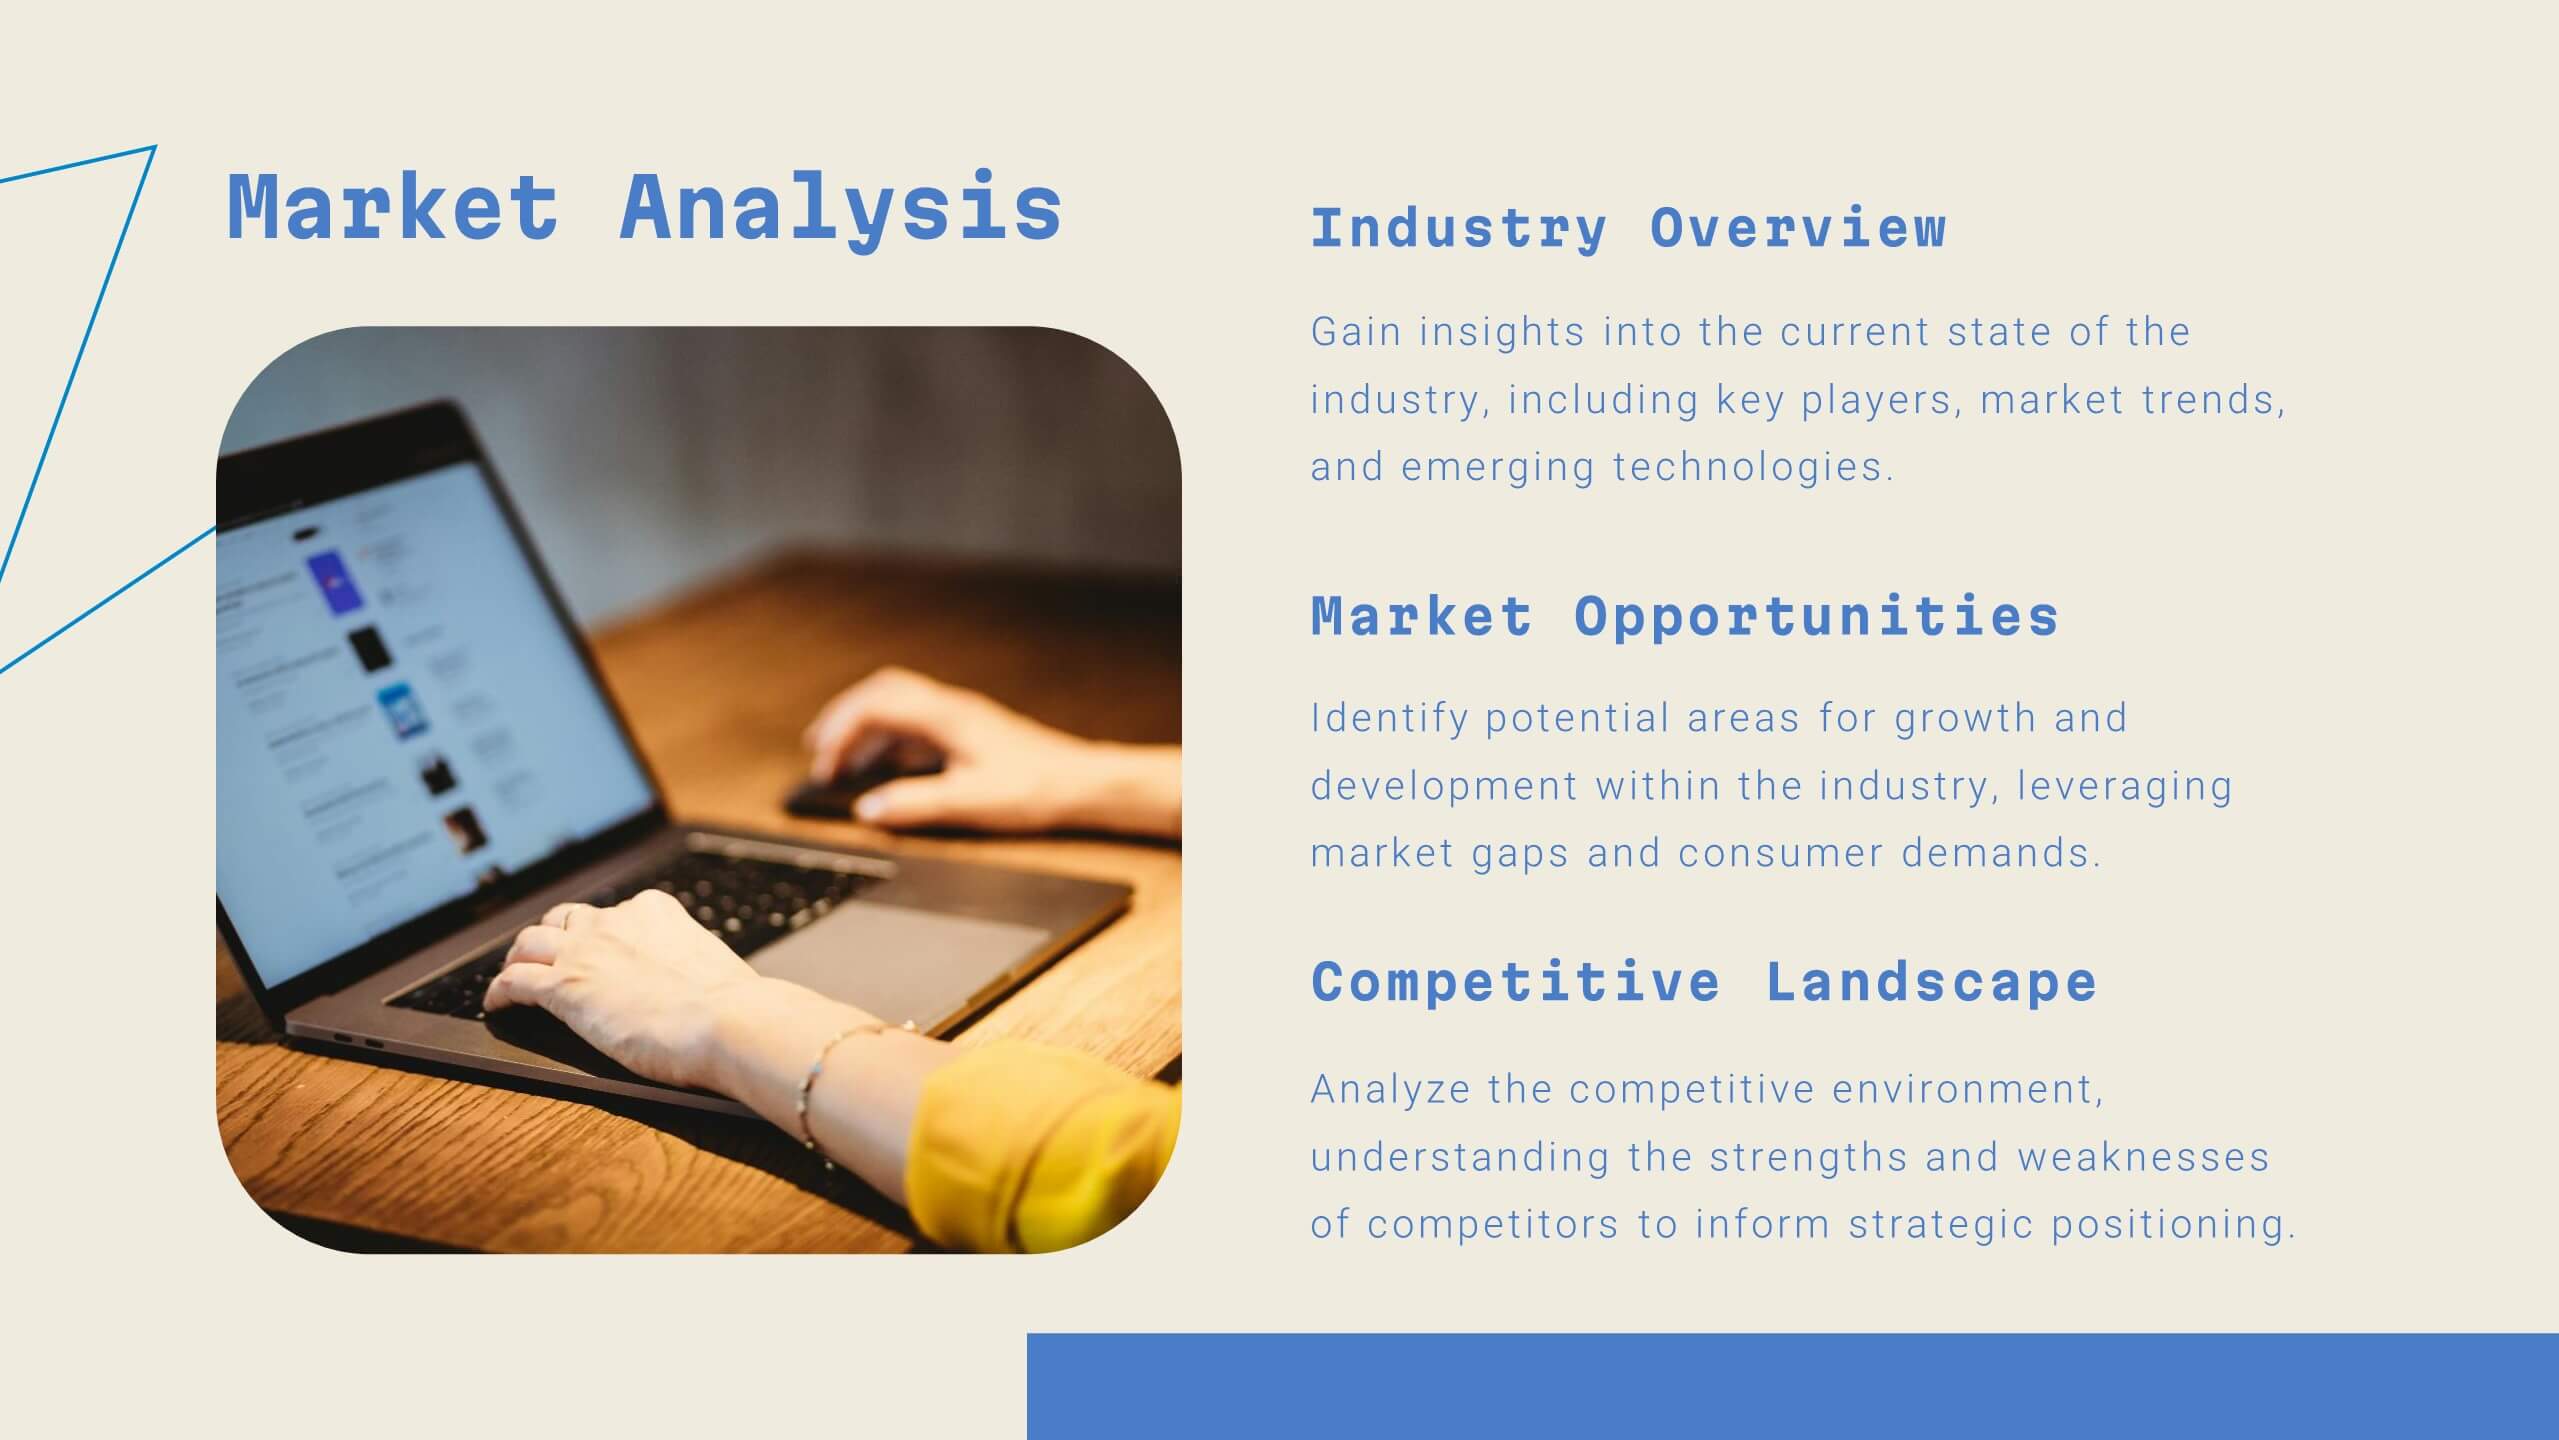
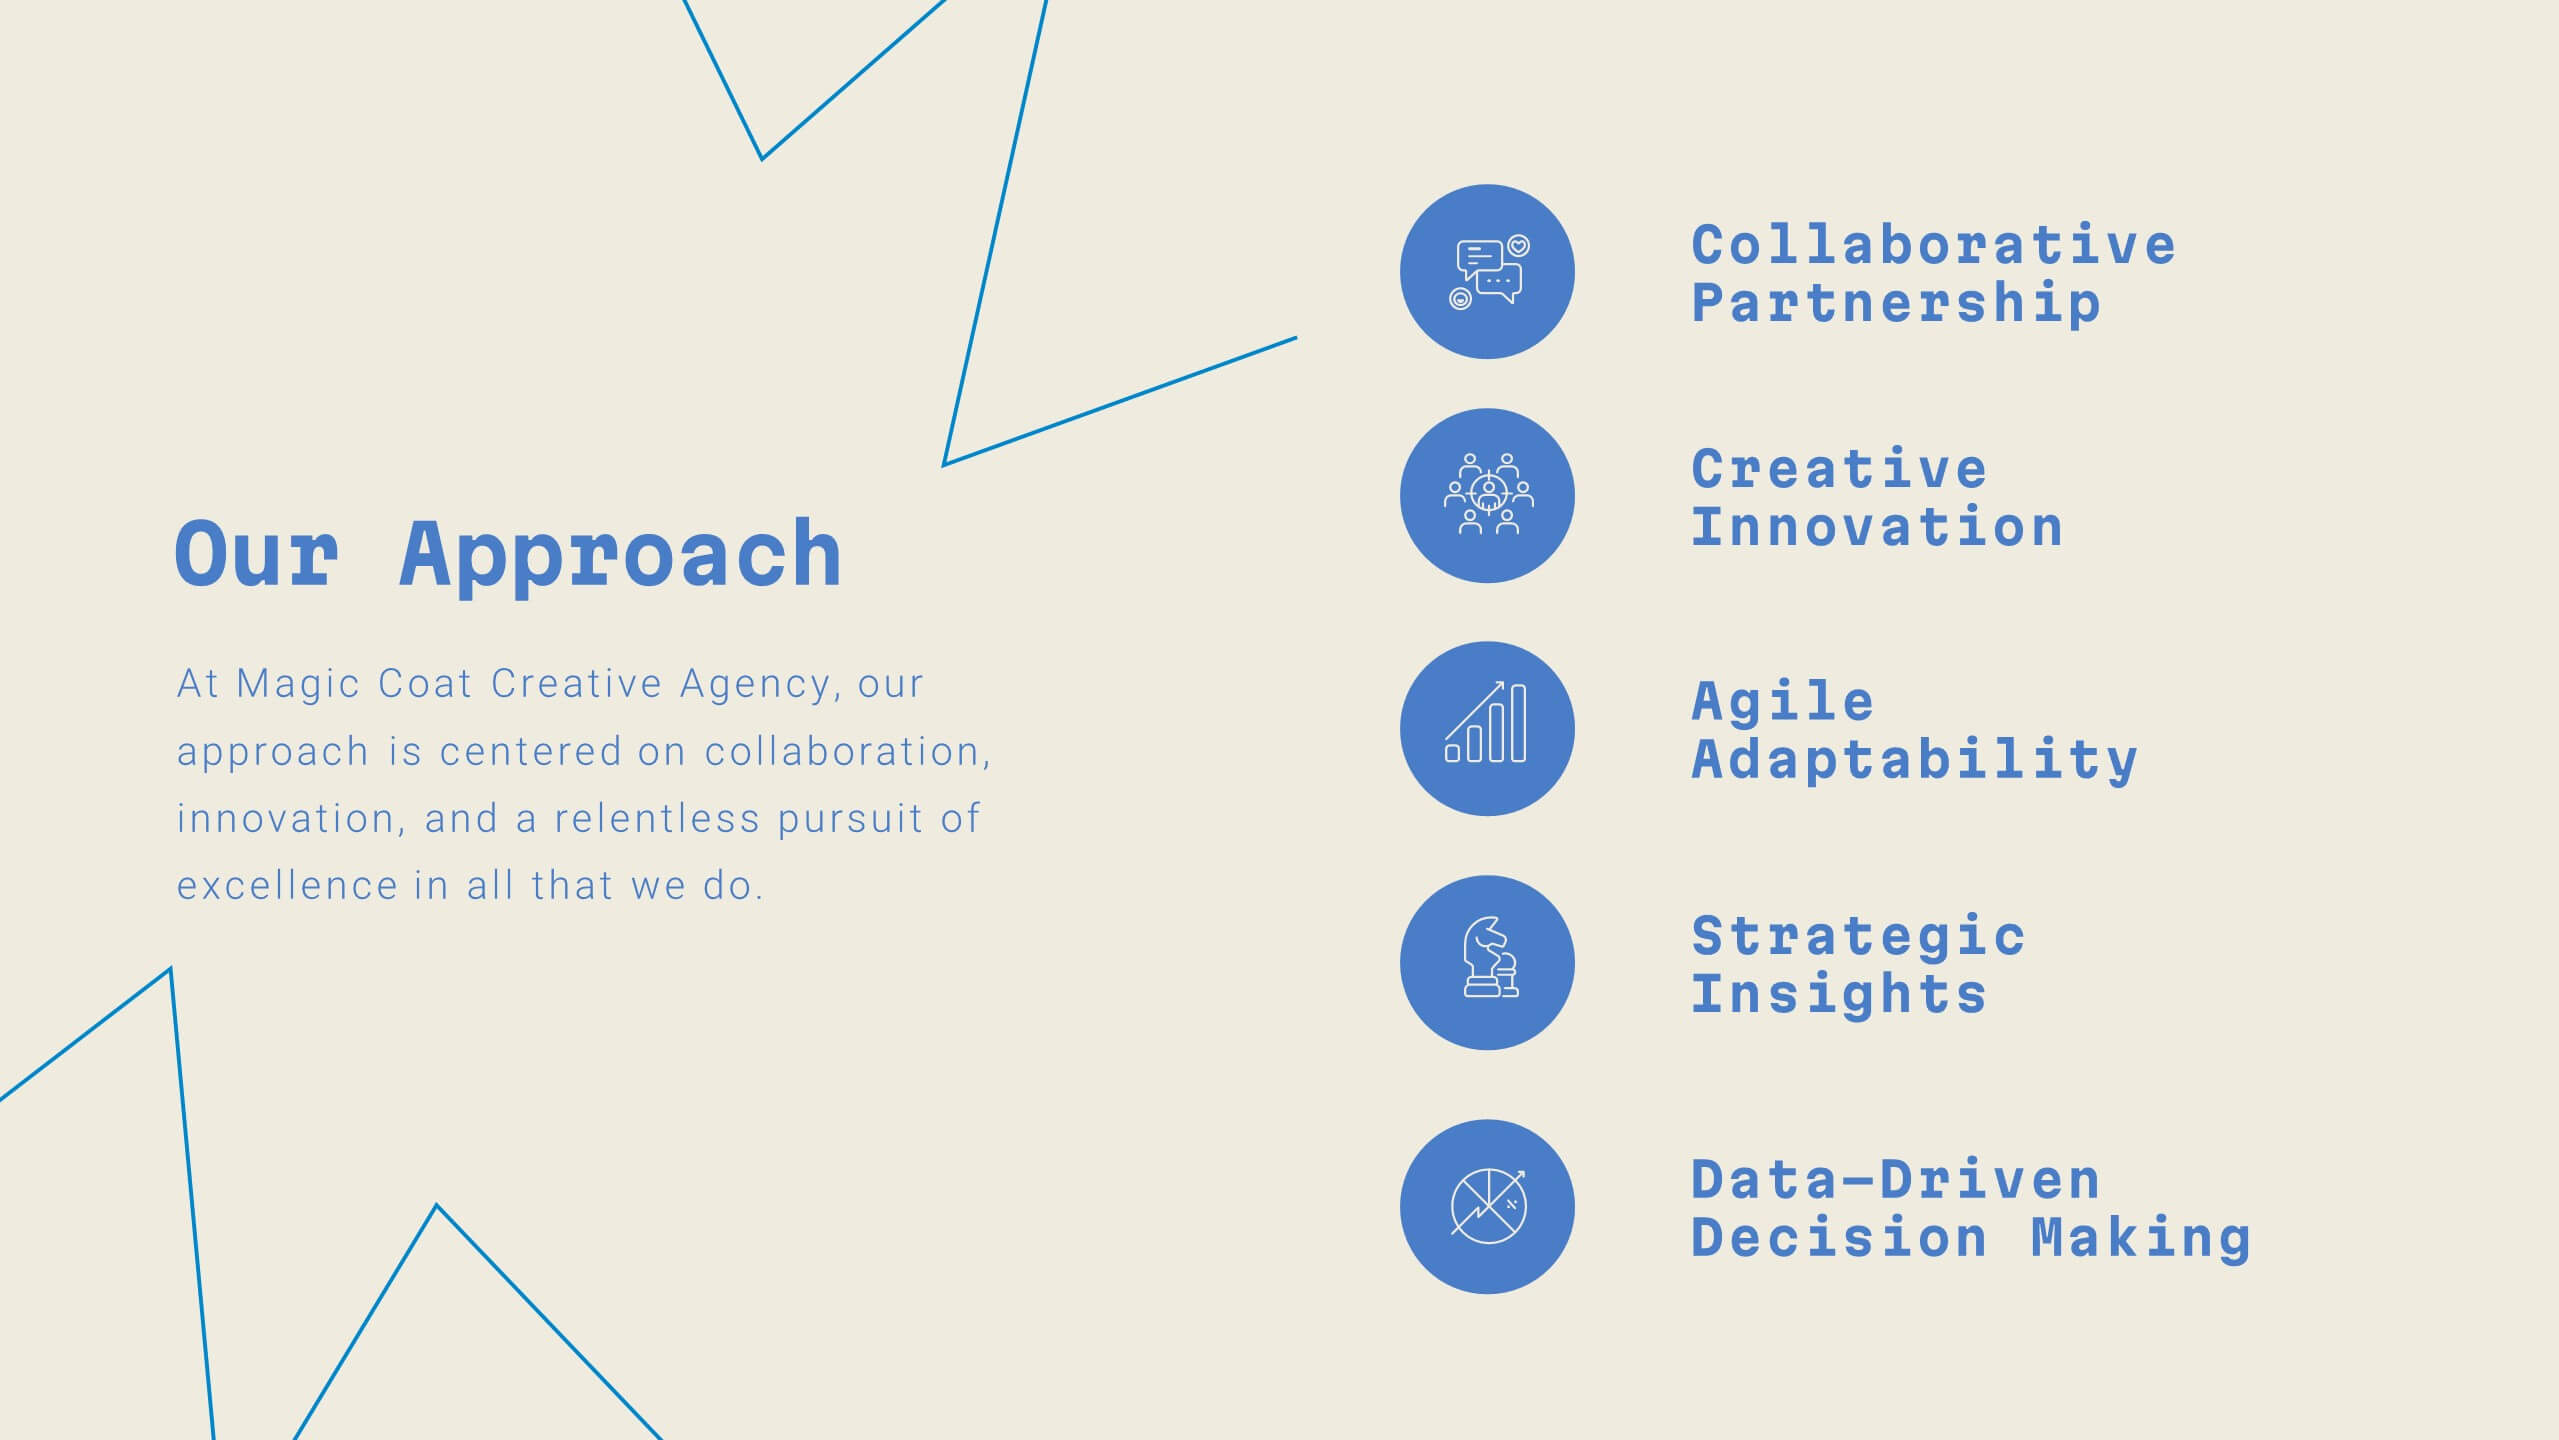
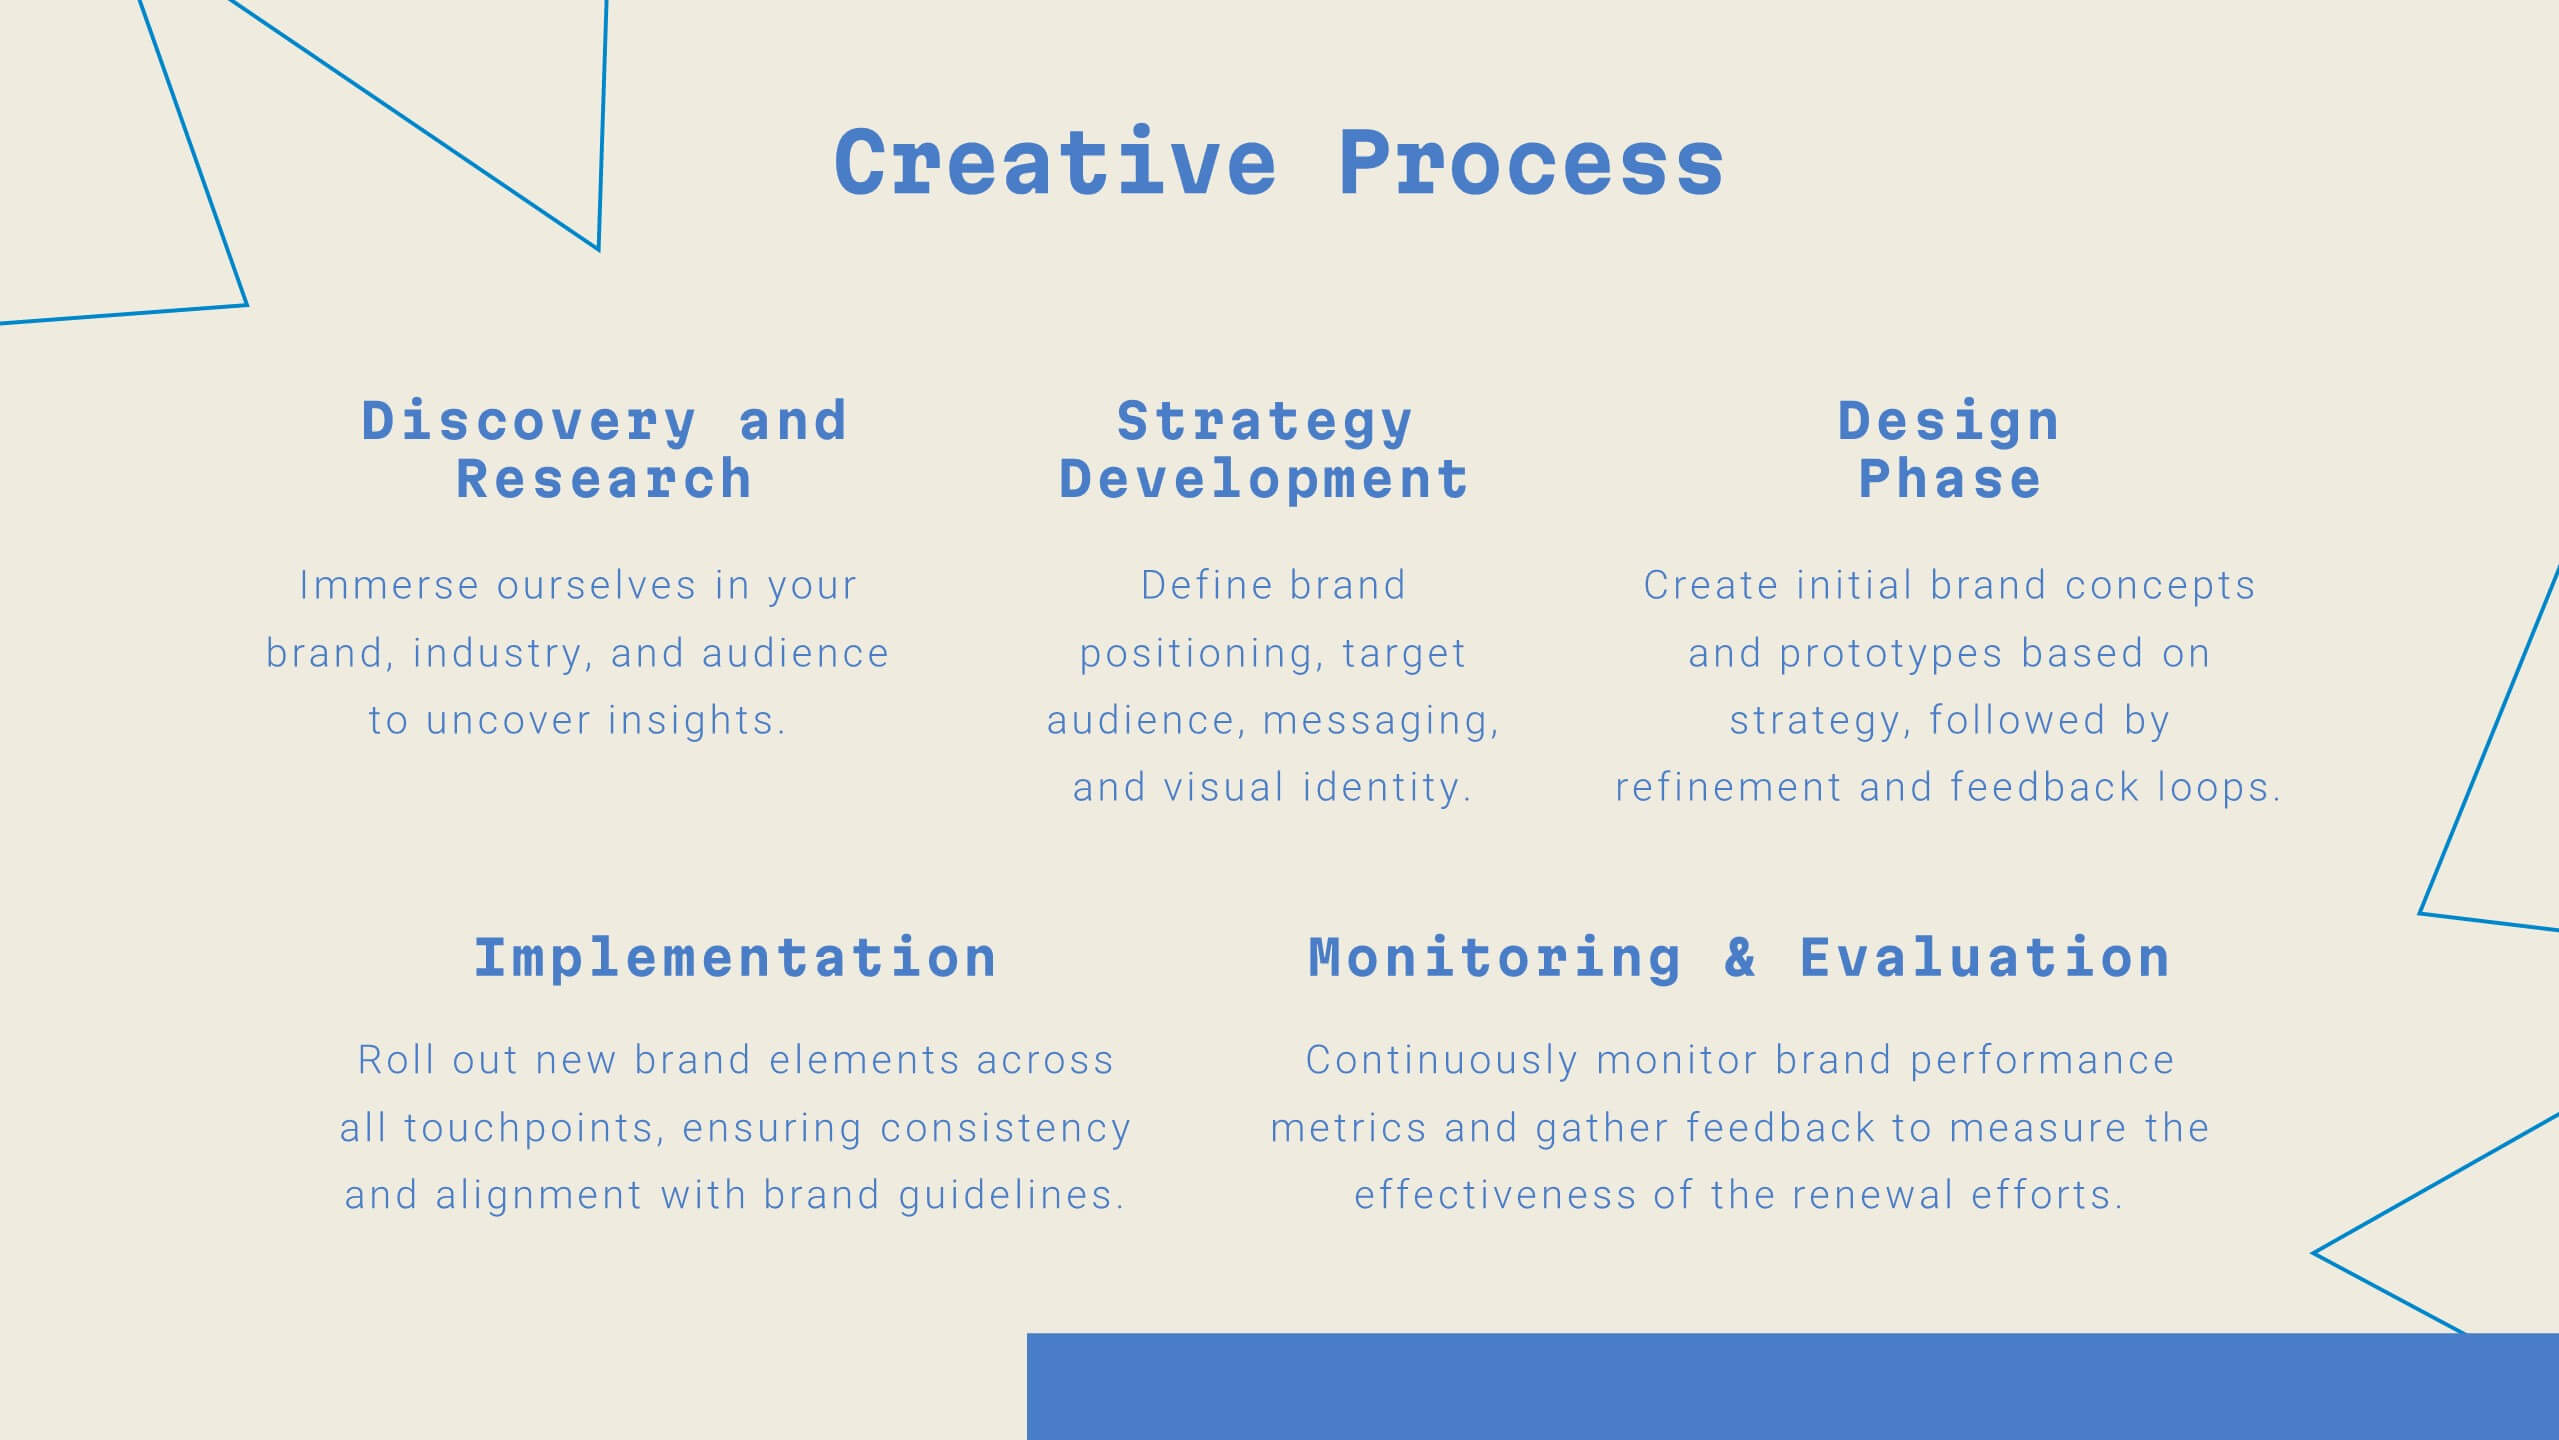
Unity Digital Agency Strategy Plan Presentation
Step into the future of digital marketing with this sleek template! From case studies to strategy development, it offers a comprehensive guide for creating impactful presentations. Highlight client success stories, industry trends, and creative processes with ease. Perfect for showcasing your agency's expertise. Compatible with PowerPoint, Keynote, and Google Slides.


22 slides
Calcifis Qualitative Research Findings Presentation
Present your research insights with clarity and impact using this modern and engaging presentation template. Cover key areas such as research objectives, methodology, data analysis, key findings, limitations, and recommendations. The visually appealing design helps you communicate complex qualitative data effectively, making it ideal for academic, business, and market research presentations. Fully customizable and compatible with PowerPoint, Keynote, and Google Slides.


26 slides
Summer Sale Presentation
Soak up the bright, sunny vibes of a presentation template that’s perfectly tailor-made for the lively summer season. Its radiant design, infused with the essence of summer sales and tropical aesthetics, is a perfect match for retail campaigns, travel promotions, or any topic that aims to bring the sizzle of summer into a room. Bright colors, playful graphics, and beach-inspired backgrounds set the stage for vibrant storytelling, whether you're introducing a seasonal team, showcasing hot vacation spots, or highlighting the latest summer fashion. The template not only captures the casual, cheerful spirit of the season but also ensures that your content makes a splash with clear, concise data displays and infographics. It’s a breeze to use across various platforms like PowerPoint, Keynote, and Google Slides, ensuring your summer message is as refreshing as a cool ocean wave.


7 slides
North America Political Map Infographic
This North America Political Map infographic template provides a visual representation of various data points across the continent. It is compatible with PowerPoint, Google Slides, and Keynote, making it versatile for different presentation platforms. The template includes different styles of maps and charts, such as population statistics, demographic data, and economic indicators. Color-coded for easy interpretation, it allows presenters to highlight specific regions and data with clarity. The design is clean and professional, with icons and graph elements that enhance the presentation of geographical and statistical information.


5 slides
Hydrology and Water Cycle Presentation
Showcase the complete water cycle with this vibrant Hydrology and Water Cycle infographic. Highlight key stages like precipitation, collection, evaporation, and condensation using clear visuals and numbered sections. Fully customizable for science, sustainability, or educational presentations. Compatible with PowerPoint, Keynote, and Google Slides for easy editing.


7 slides
Healthcare Strategy Plan Presentation
Bring your strategy to life with a clean, modern slide that turns complex healthcare planning into a clear, visual roadmap. This presentation outlines key initiatives, supports data-driven decision-making, and keeps stakeholders aligned with an easy-to-follow layout. Fully compatible with PowerPoint, Keynote, and Google Slides for seamless professional use across any workflow.


8 slides
Environmental and Social Sustainability
Showcase your sustainability efforts with this layered pyramid slide, perfect for visualizing tiered environmental or social responsibility strategies. Ideal for ESG reporting, sustainability workshops, or stakeholder presentations. Fully customizable in PowerPoint, Keynote, and Google Slides to match your brand and message.


7 slides
Master Six Sigma Infographic Presentation
Six Sigma is a methodology used by organizations to improve their business processes and eliminate defects. Use this template to explore the key concepts of Six Sigma and how it can be applied in different industries. This templates include helpful illustrations, charts and tips which allow you to present information in a clear and concise way that makes it easy for your audience to understand and take notes. This template has been made using modern fonts, appealing color combinations and simple layouts. The clean and simple design is compatible with Powerpoint, Keynote and Google Slides.


4 slides
Healthcare Trends and Innovations Presentation
Showcase cutting-edge medical insights using this umbrella-themed slide design tailored for healthcare trends and innovations. Ideal for highlighting advancements, protective strategies, or sector forecasts, this template offers a clean, symbolic layout. Fully editable in PowerPoint, Keynote, and Google Slides—perfect for medical professionals, health consultants, and industry analysts alike.


6 slides
Creative 3D Elements Slide
Add visual depth and structure to your ideas with this unique 3D cube environment. Ideal for breaking down five components or phases, this layout helps your content stand out while maintaining a professional, modern aesthetic. Compatible with PowerPoint, Keynote, and Google Slides.


23 slides
Quest Qualitative Research Findings Presentation
This dynamic and sleek research template presents qualitative findings with style and clarity. Dive into research objectives, data collection, key findings, and future directions, all showcased with a minimalist black-and-white design. Perfect for impactful presentations, this template is compatible with PowerPoint, Keynote, and Google Slides, making it versatile for any audience!


5 slides
Market Share Analysis Pie Chart Presentation
Present market insights effectively with the Market Share Analysis Pie Chart Presentation. This visually engaging template helps illustrate competitive positioning, segment distribution, and industry trends through clear and customizable pie charts. Ideal for marketing reports, business strategy meetings, and investor presentations. Fully editable and compatible with PowerPoint, Keynote, and Google Slides.


6 slides
Funding Request Project Proposal
Visually communicate your project's financial needs using this tiered Funding Request Project Proposal slide. With a stacked layout ideal for outlining budget categories or funding stages, it’s perfect for grant applications, investor decks, or internal pitches. Fully customizable in PowerPoint, Keynote, and Google Slides.