


Features
- 6 Unique slides
- Fully editable and easy to edit in Microsoft Powerpoint, Keynote and Google Slides
- 16:9 widescreen layout
- Clean and professional designs
- Export to JPG, PDF or send by email


Do you have any questions?
Recommend


4 slides
Sales and Reach Across Asia Map Presentation
Visualize your company’s market presence with the Sales and Reach Across Asia Map Presentation. Featuring clean markers, color-coded regions, and icon-labeled highlights, this template helps you clearly showcase key sales zones, distribution channels, or growth markets across Asia. Perfect for business reviews, expansion pitches, and performance updates. Fully editable in PowerPoint, Keynote, Google Slides, and Canva.


8 slides
Chain of Command Mapping Presentation
Clarify your organizational flow with the Chain of Command Mapping Presentation. This template is ideal for visualizing reporting lines, departmental authority, and team structures in a clean, easy-to-follow format. Featuring modern icons, varied layouts, and editable labels, it helps simplify decision-making and responsibility tracking. Fully customizable in PowerPoint, Keynote, Canva, and Google Slides.


7 slides
Customer Journey Stages Infographic Presentation
A Customer Journey consists of a series of interactions that occur over time between your company and the customer. Our template uses a colorful color scheme and style to present a customer journey. This communicates how the customer moves through their process. The layout allows you to customize each text box with your own text. The stages are color coded, making it easy for you to identify them. This template is designed to provide the most up-to-date research and analytical data so you can effectively engage and connect with your audience. Capture your customer's journey with this template!


6 slides
Startup Investors Pitch Deck Presentation
Inspire confidence and spark investor interest with the Startup Investor Pitch Deck Presentation. Featuring a creative visual of a rocket launching from a piggy bank, this slide is ideal for illustrating funding momentum, business growth, or financial milestones. Each section allows space to highlight critical investment points such as traction, market opportunity, financials, and team highlights. Fully customizable in PowerPoint, Keynote, or Google Slides, this pitch-ready layout is perfect for entrepreneurs, startup founders, and innovation teams aiming to deliver a memorable and professional presentation.


6 slides
TAM SAM SOM for Target Reach Forecasting Presentation
Break down your market reach with clarity using the TAM SAM SOM for Target Reach Forecasting Presentation. This sleek, layered circle diagram is ideal for illustrating your total addressable market, serviceable market, and obtainable market. Customize easily in PowerPoint, Keynote, or Google Slides to align with your brand and business strategy.


5 slides
Marketing Customer Journey Presentation
Visualize your customer’s path with the Marketing Customer Journey Presentation. This slide layout is perfect for outlining the stages of your buyer’s decision-making process—from awareness to action. Highlight critical touchpoints and engagement strategies with a clean, easy-to-follow design. Fully customizable and compatible with PowerPoint, Keynote, and Google Slides.


6 slides
Creative 3D Elements Slide
Add visual depth and structure to your ideas with this unique 3D cube environment. Ideal for breaking down five components or phases, this layout helps your content stand out while maintaining a professional, modern aesthetic. Compatible with PowerPoint, Keynote, and Google Slides.


7 slides
Money Exchange Infographic Presentation
Money exchange is an important aspect of international trade and commerce, and it serves many important functions. Create a professional visual aid for your next presentation with this infographic on money exchange. The template includes customizable layouts, charts and 7 unique photo layouts. You can add or delete columns of information as desired, change fonts and sizes as well as fill text boxes with titles, descriptions and more. This colorful design is great for reporting on business growth, expenses and more. This presentation is designed in Powerpoint, Keynote and Google Slides.


7 slides
Agenda and Sections TOC Presentation
Bring your audience in with a dynamic, story-driven overview that makes each section feel intentional and easy to follow. This presentation highlights key agenda points in a clean, structured layout, helping you introduce topics with clarity and flow. Fully compatible with PowerPoint, Keynote, and Google Slides.


4 slides
Points-Based Membership Program Strategy Presentation
Communicate your rewards system with clarity using the Points-Based Membership Program Strategy presentation. This visual template is ideal for outlining tiered rewards, point accumulation methods, and redemption mechanics through a clean, card-themed layout. Perfect for loyalty teams, marketing strategists, and membership programs. Fully editable in PowerPoint, Keynote, and Google Slides.


4 slides
Productivity and Task Prioritization Presentation
Streamline efficiency with structured task prioritization using this Productivity and Task Prioritization template. Designed with rating indicators, pie charts, and color-coded sections, this slide helps visualize task importance, workload distribution, and performance evaluations. Ideal for team leaders, project managers, and business strategists, this template is fully customizable and compatible with PowerPoint, Keynote, and Google Slides.


6 slides
Root Cause Analysis of Key Problems Presentation
Get to the heart of business issues with this Root Cause Analysis of Key Problems presentation. This template helps you break down complex challenges into actionable components: Who, What, When, Where, Why, and How. Clean, color-coded arrows ensure clarity. Ideal for strategic reviews and process optimization. Fully editable in Canva, PowerPoint, and Google Slides.
7 slides
Arrow Process Flow Presentation
Illustrate step-by-step processes with the Arrow Process Flow Presentation. This dynamic template visually maps out sequential steps, making it ideal for workflow diagrams, business strategies, and project planning. Customize colors, text, and icons to align with your brand. Compatible with PowerPoint, Keynote, and Google Slides for effortless editing.


6 slides
OKR Goal-Setting Framework Presentation
Achieve clarity and focus with the OKR Goal-Setting Framework. This structured layout helps visualize objectives and key results using hexagonal elements for a clear strategic overview. Perfect for business planning, performance tracking, and team alignment. Fully editable and compatible with PowerPoint, Keynote, and Google Slides for effortless customization.


26 slides
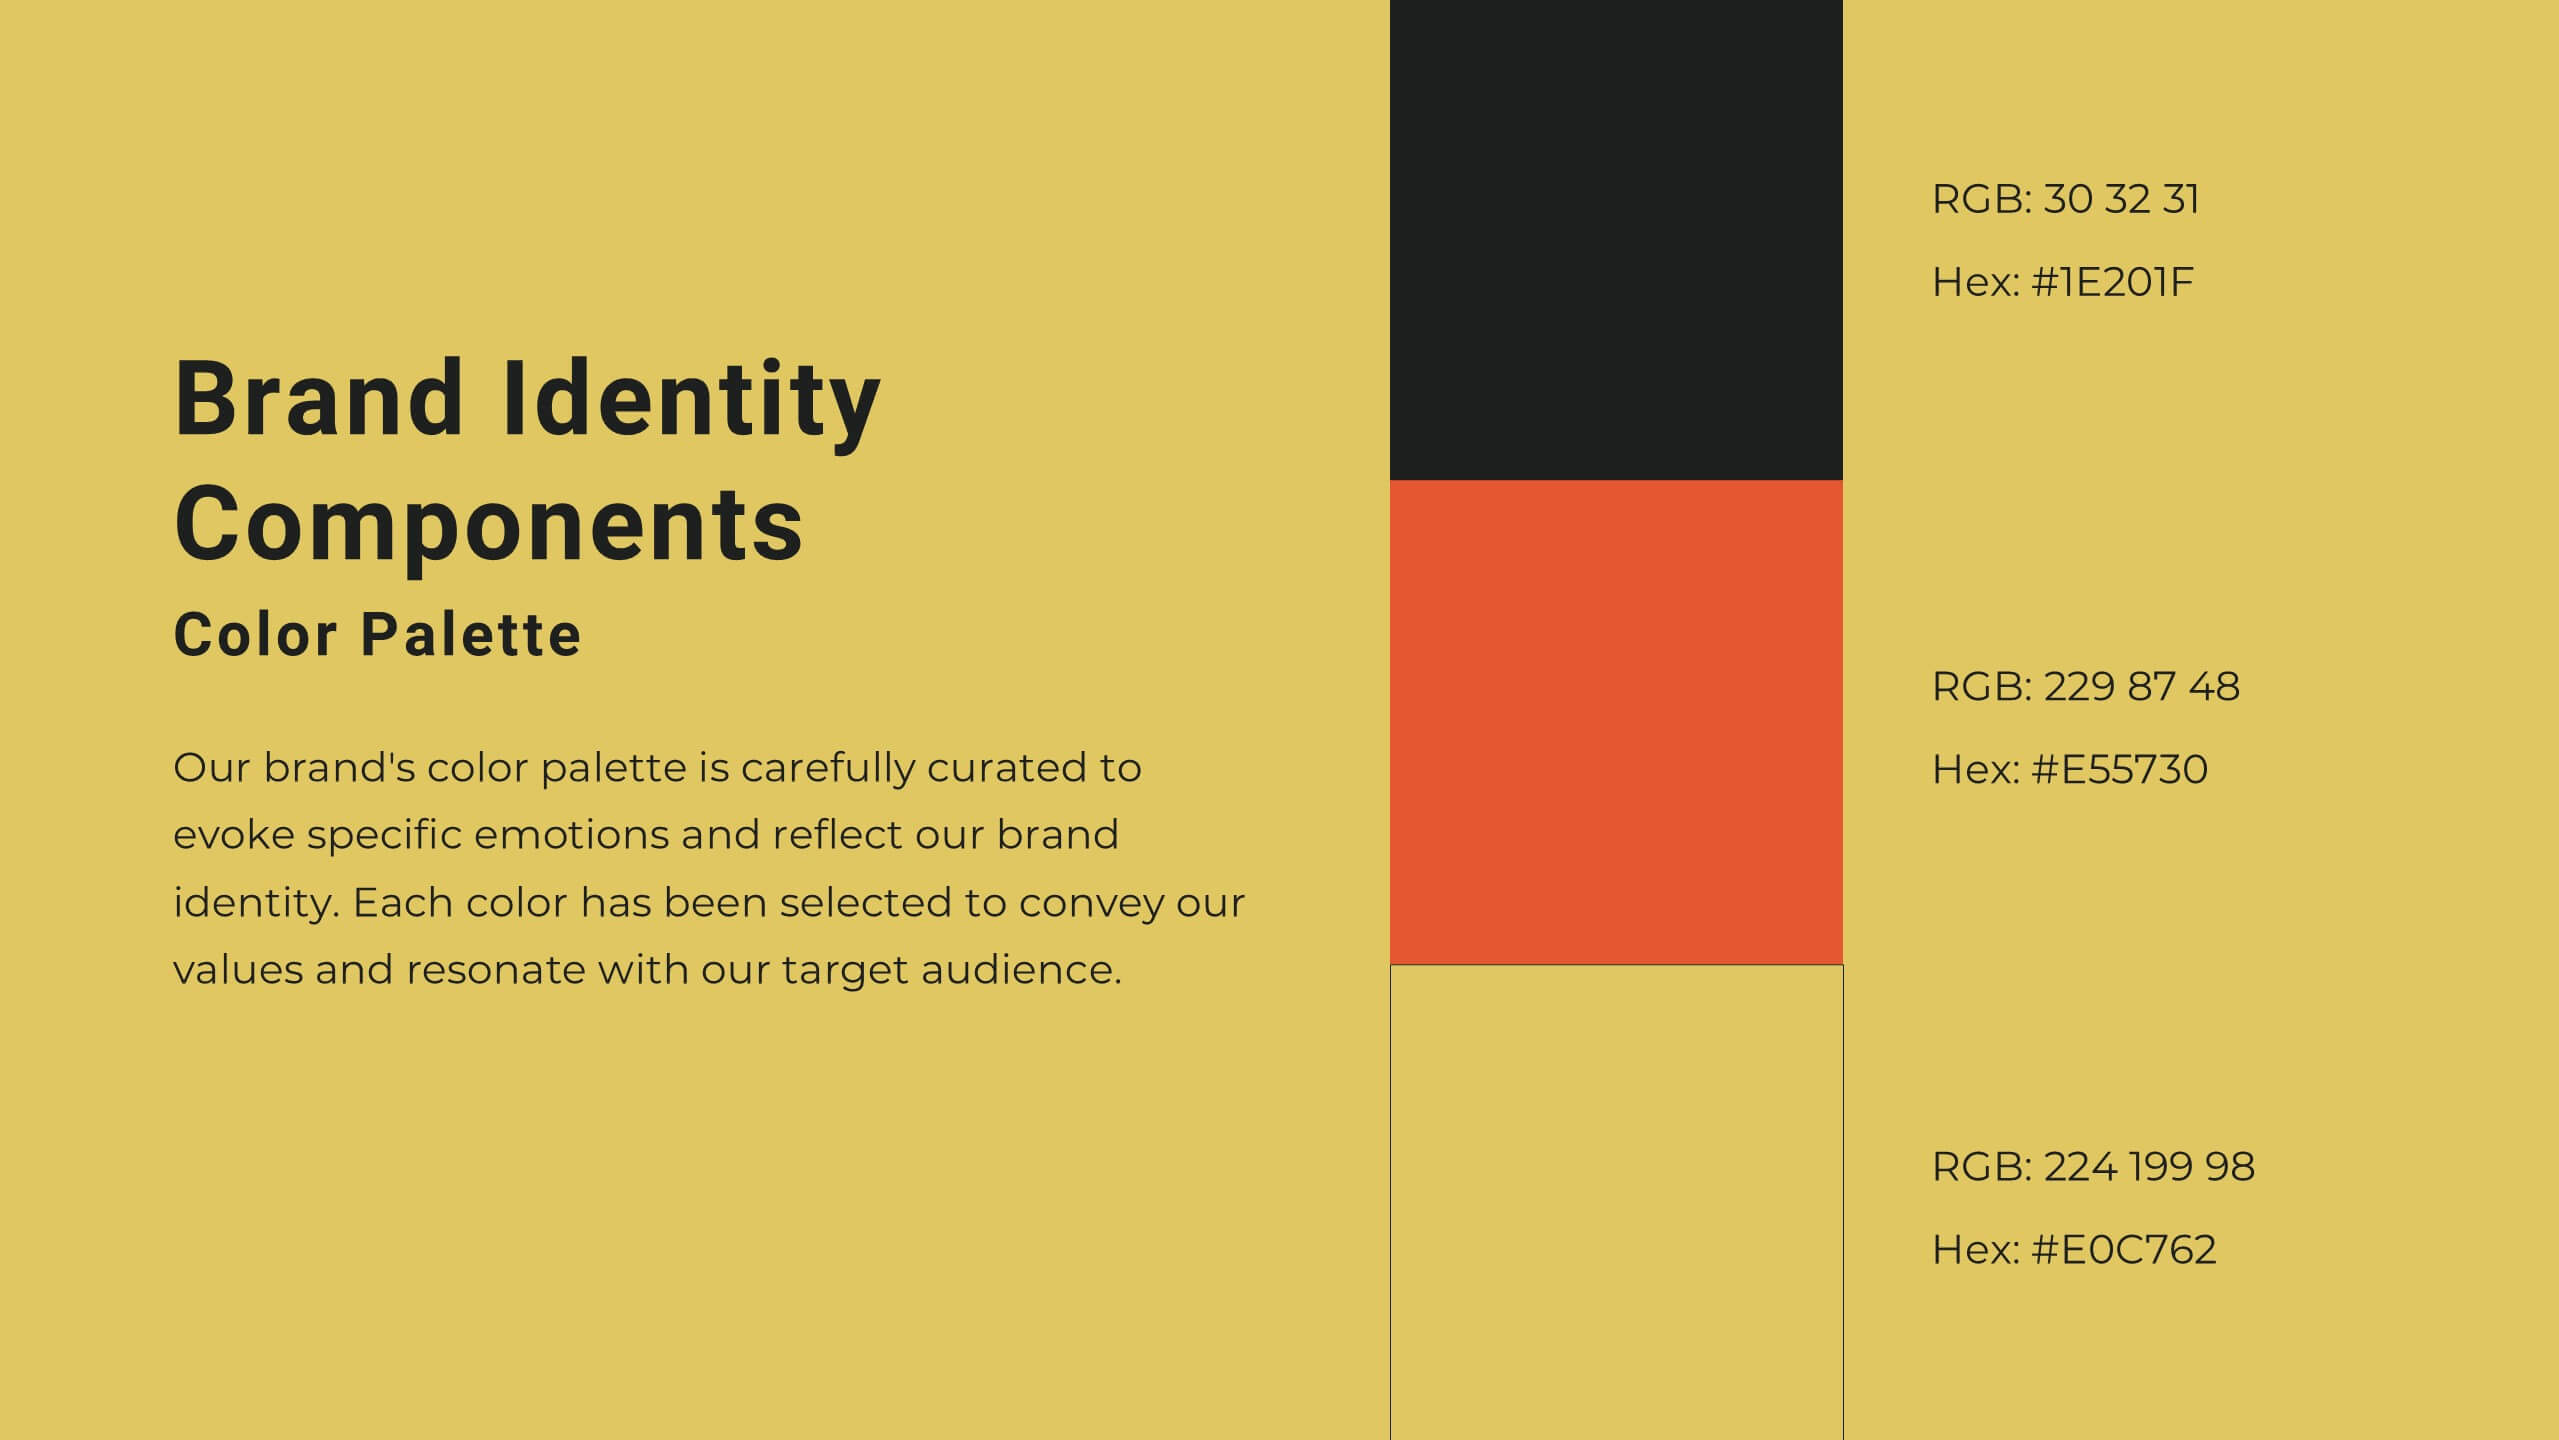
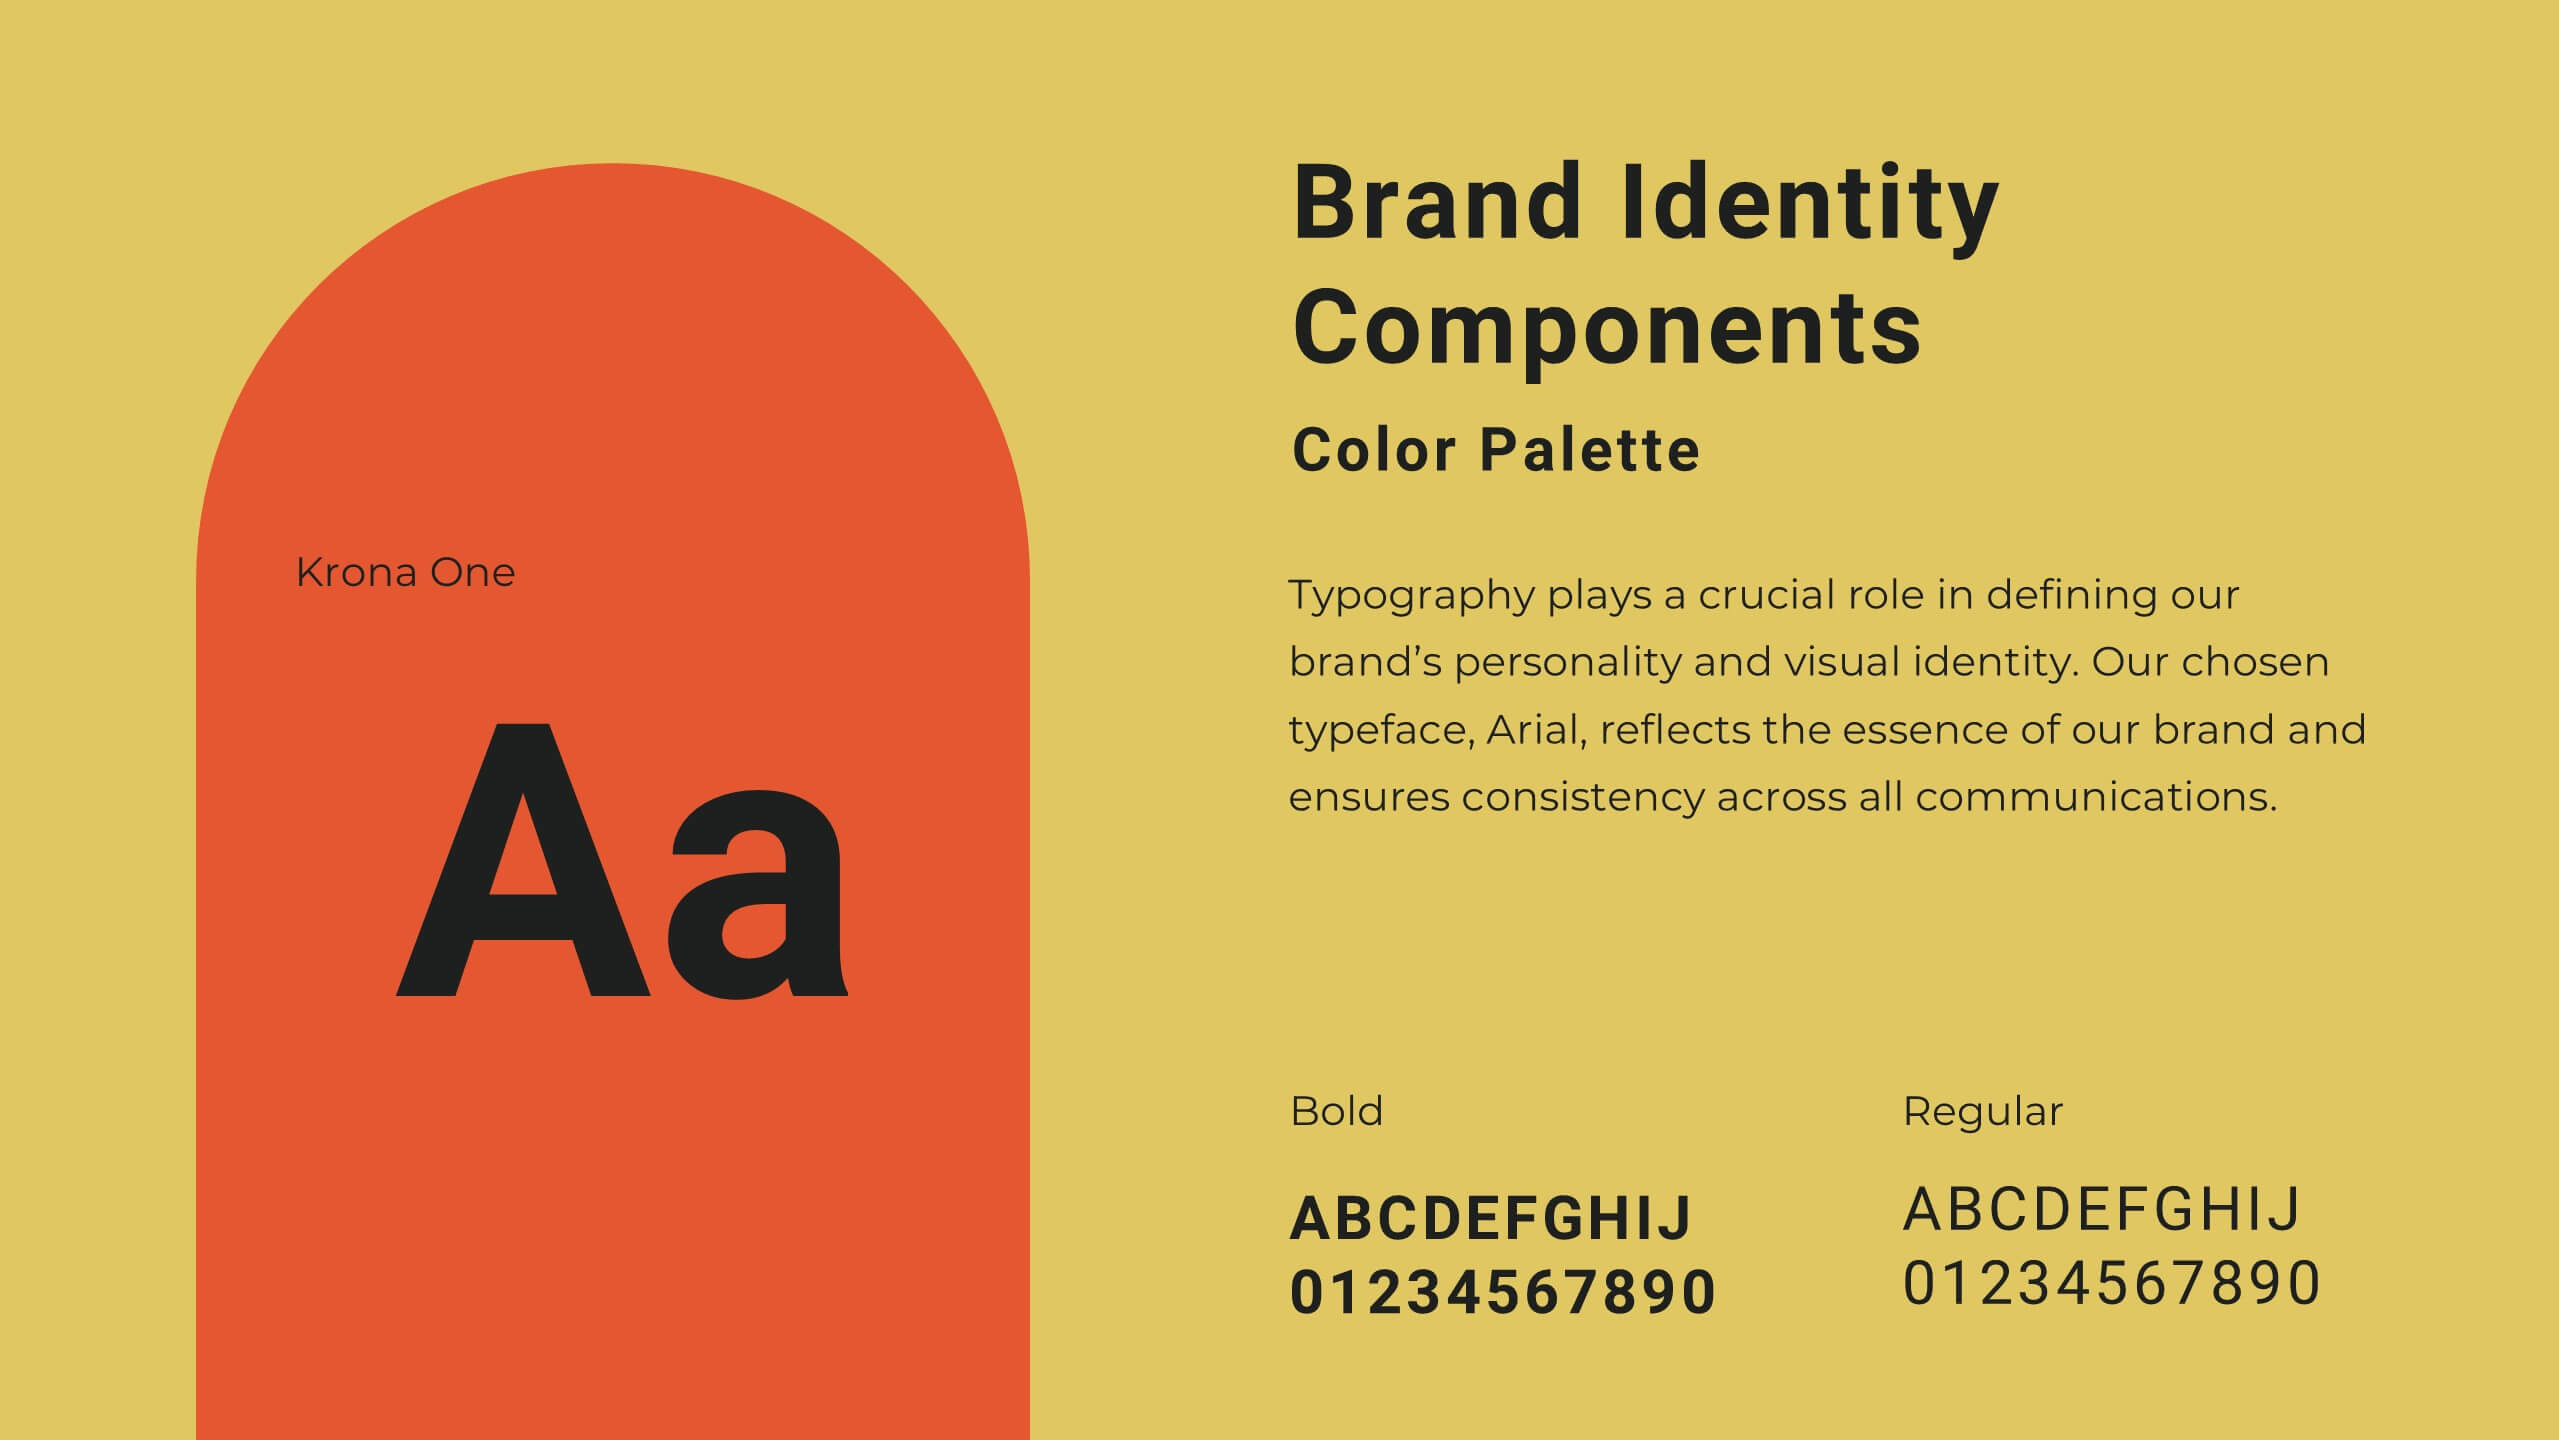
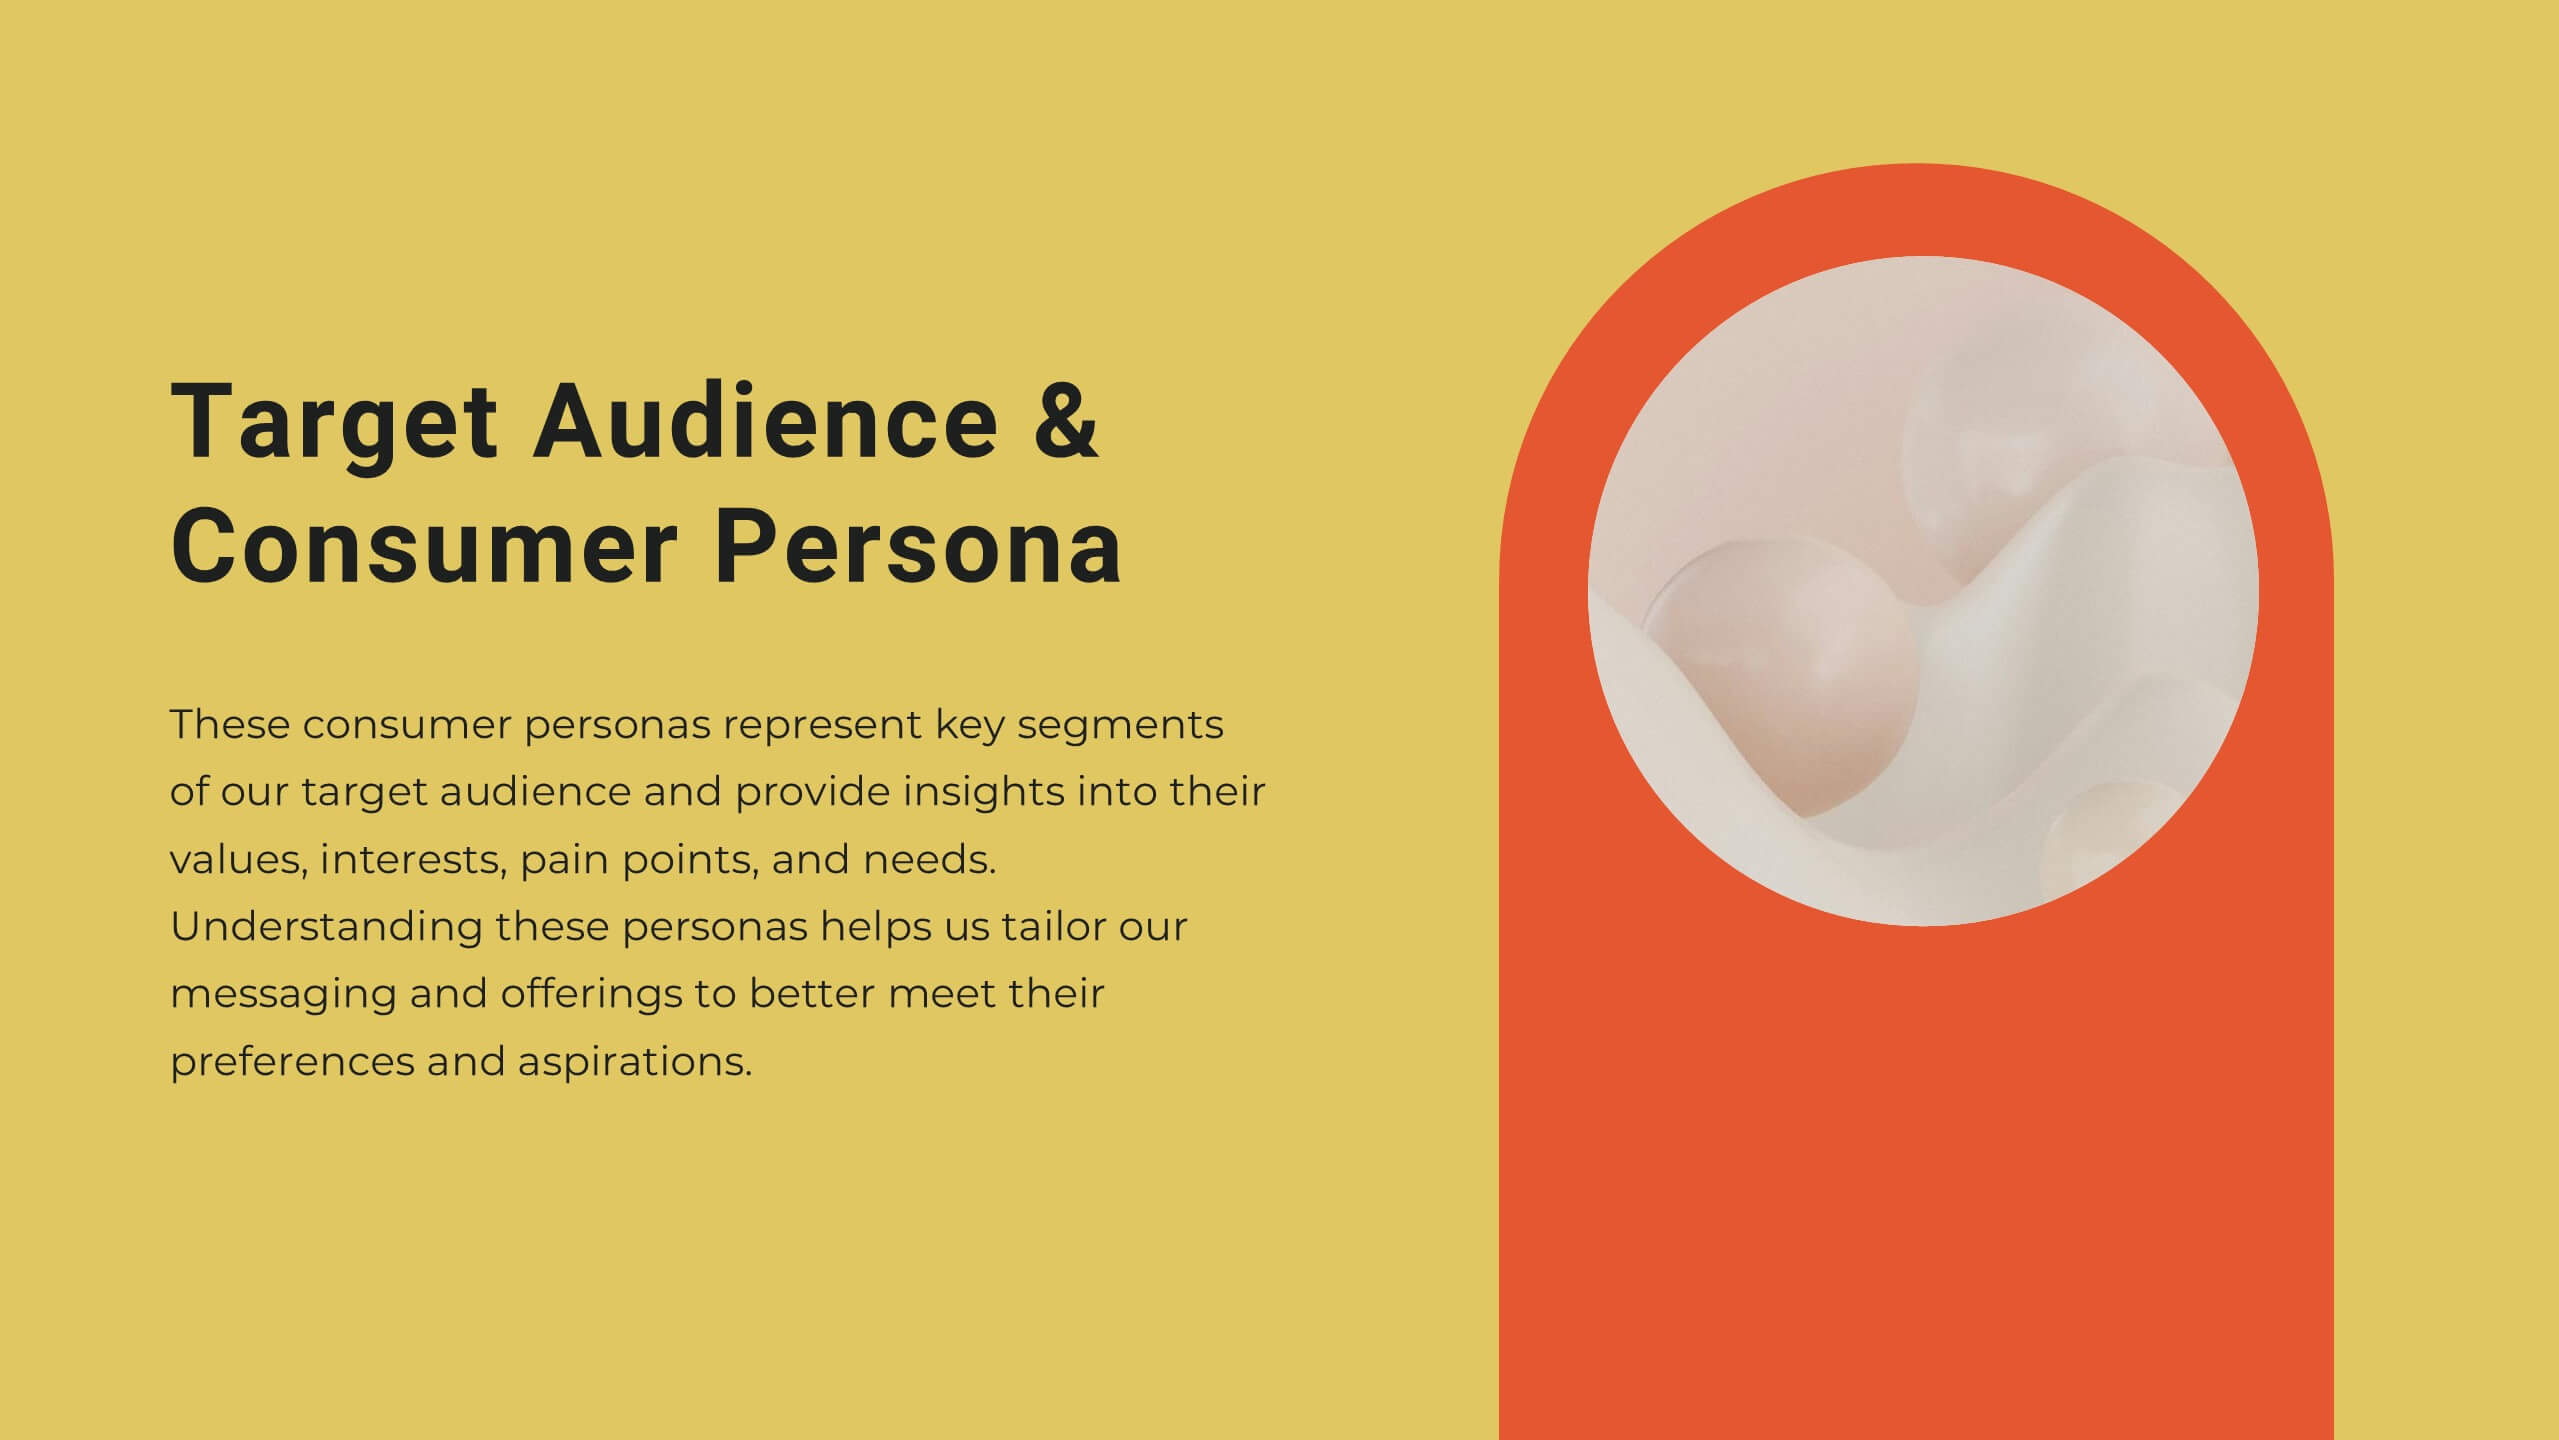
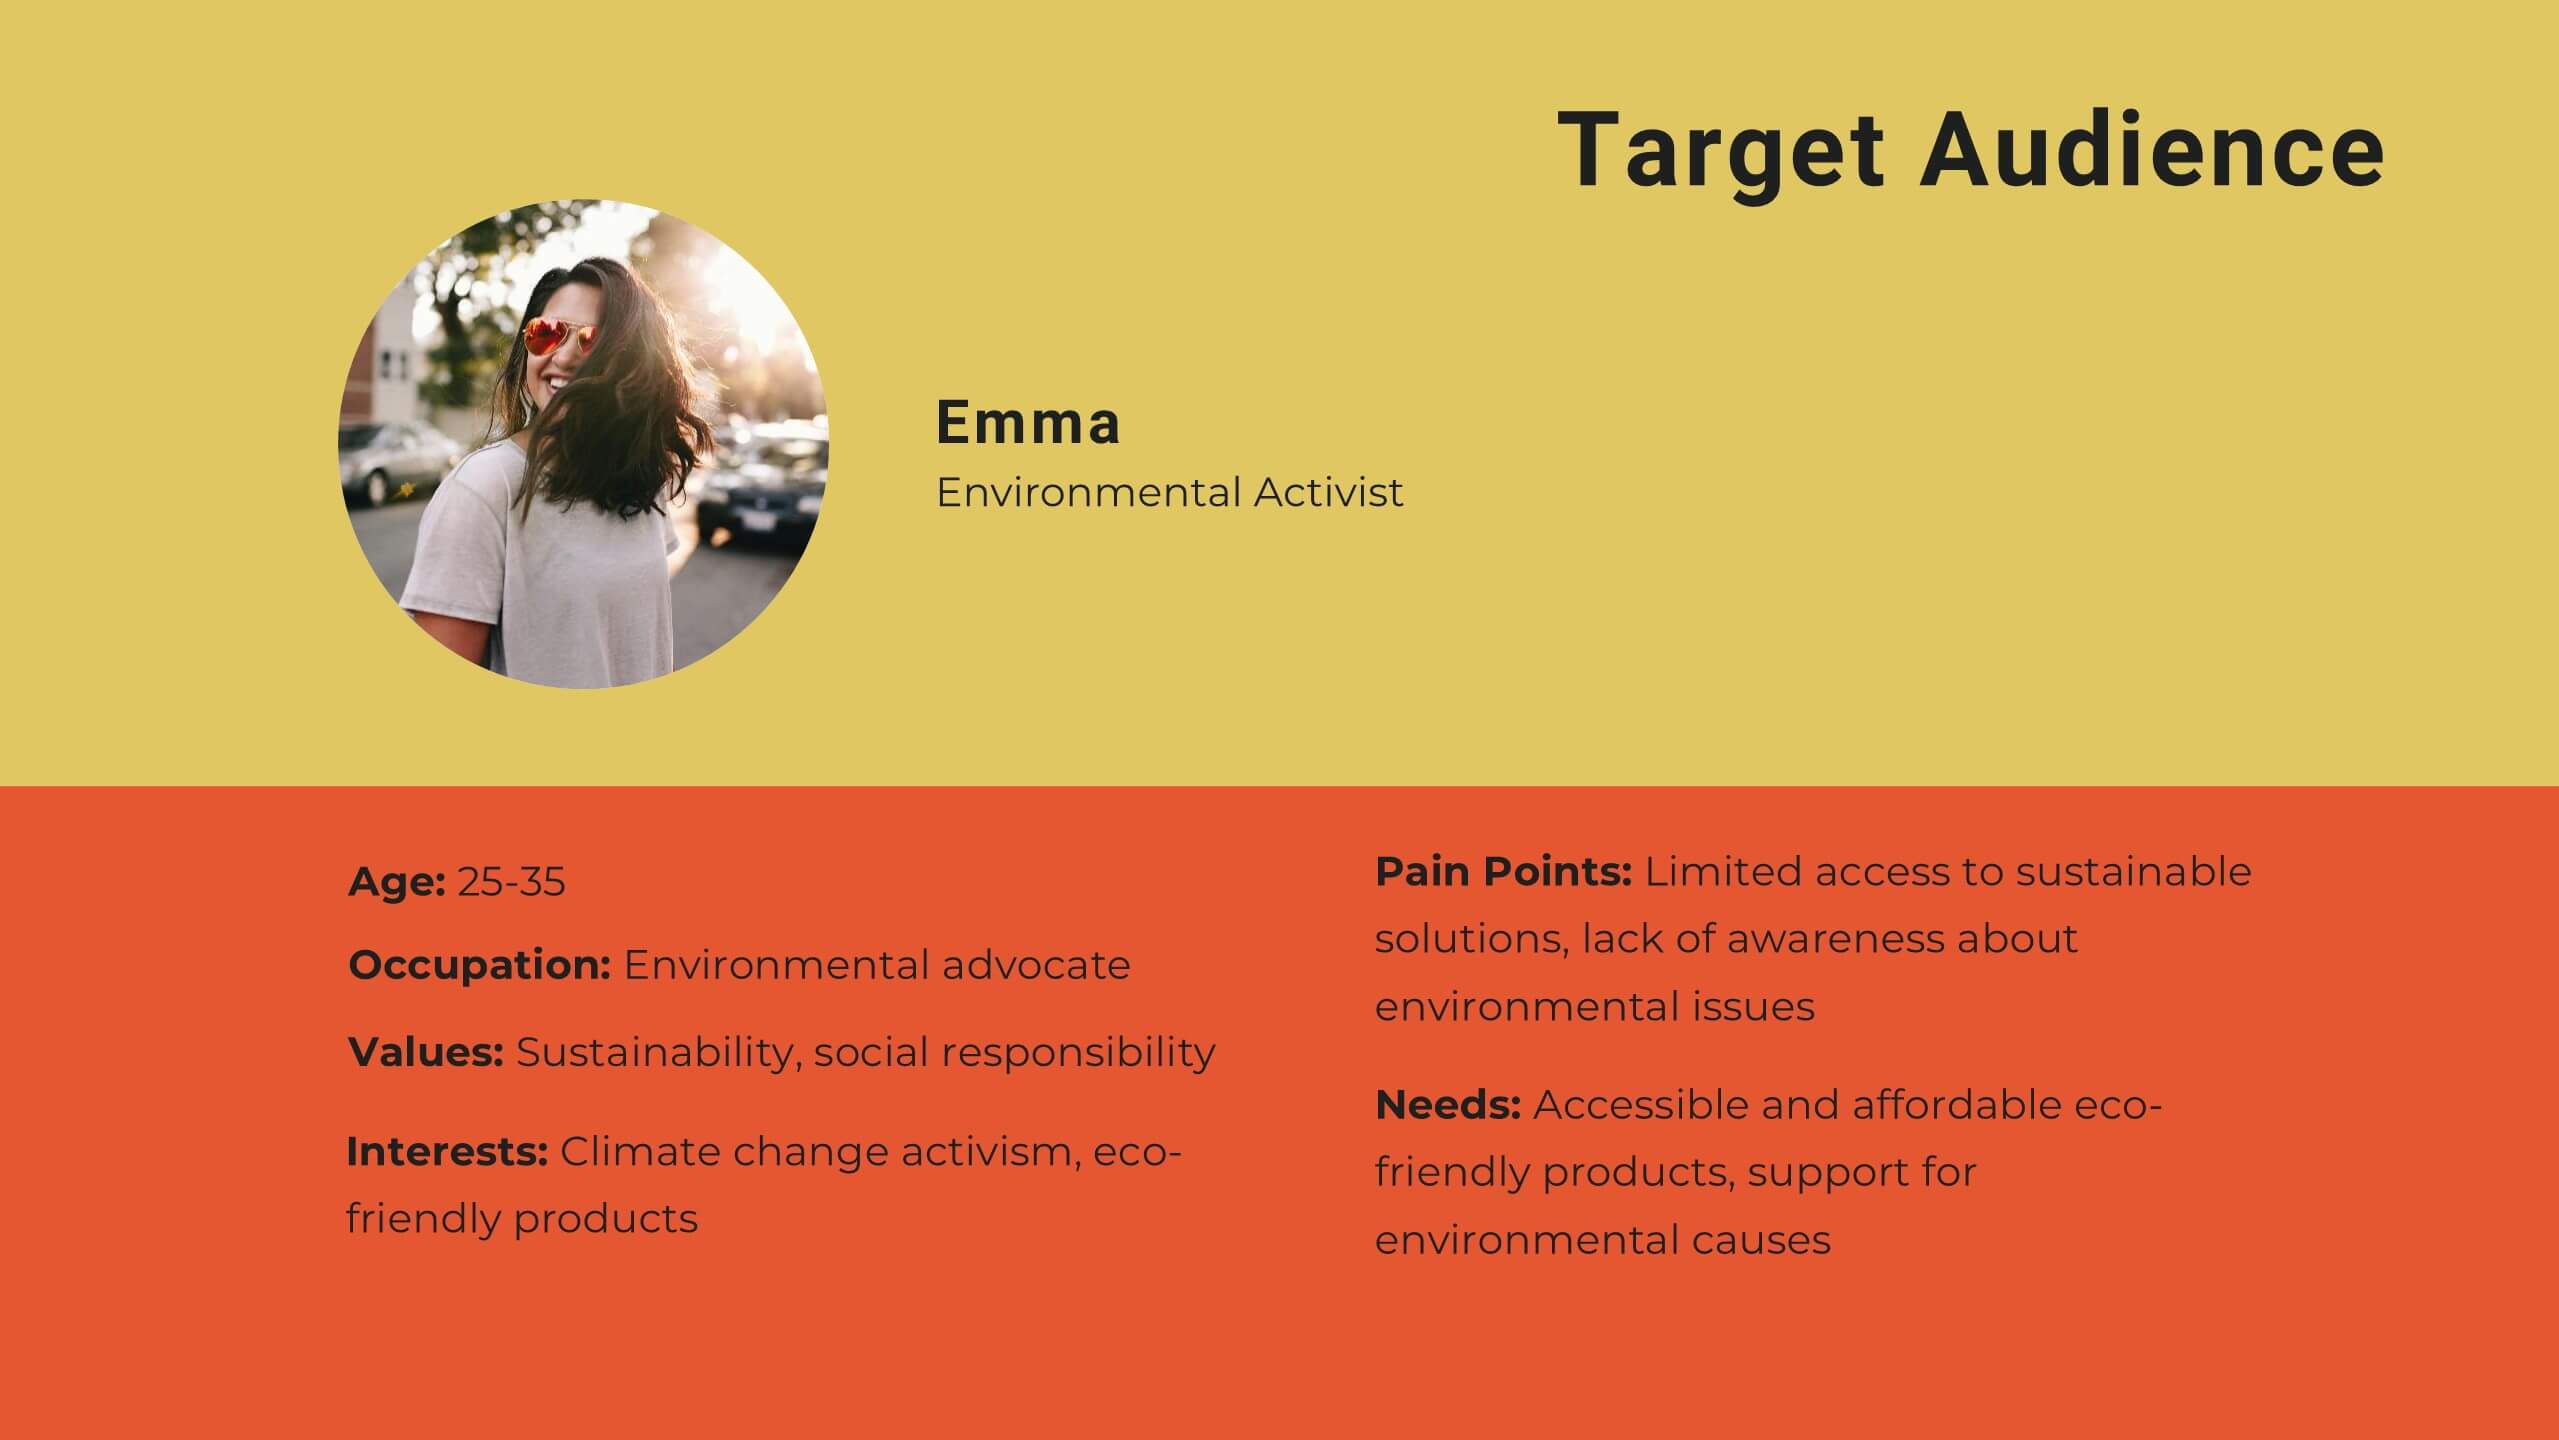
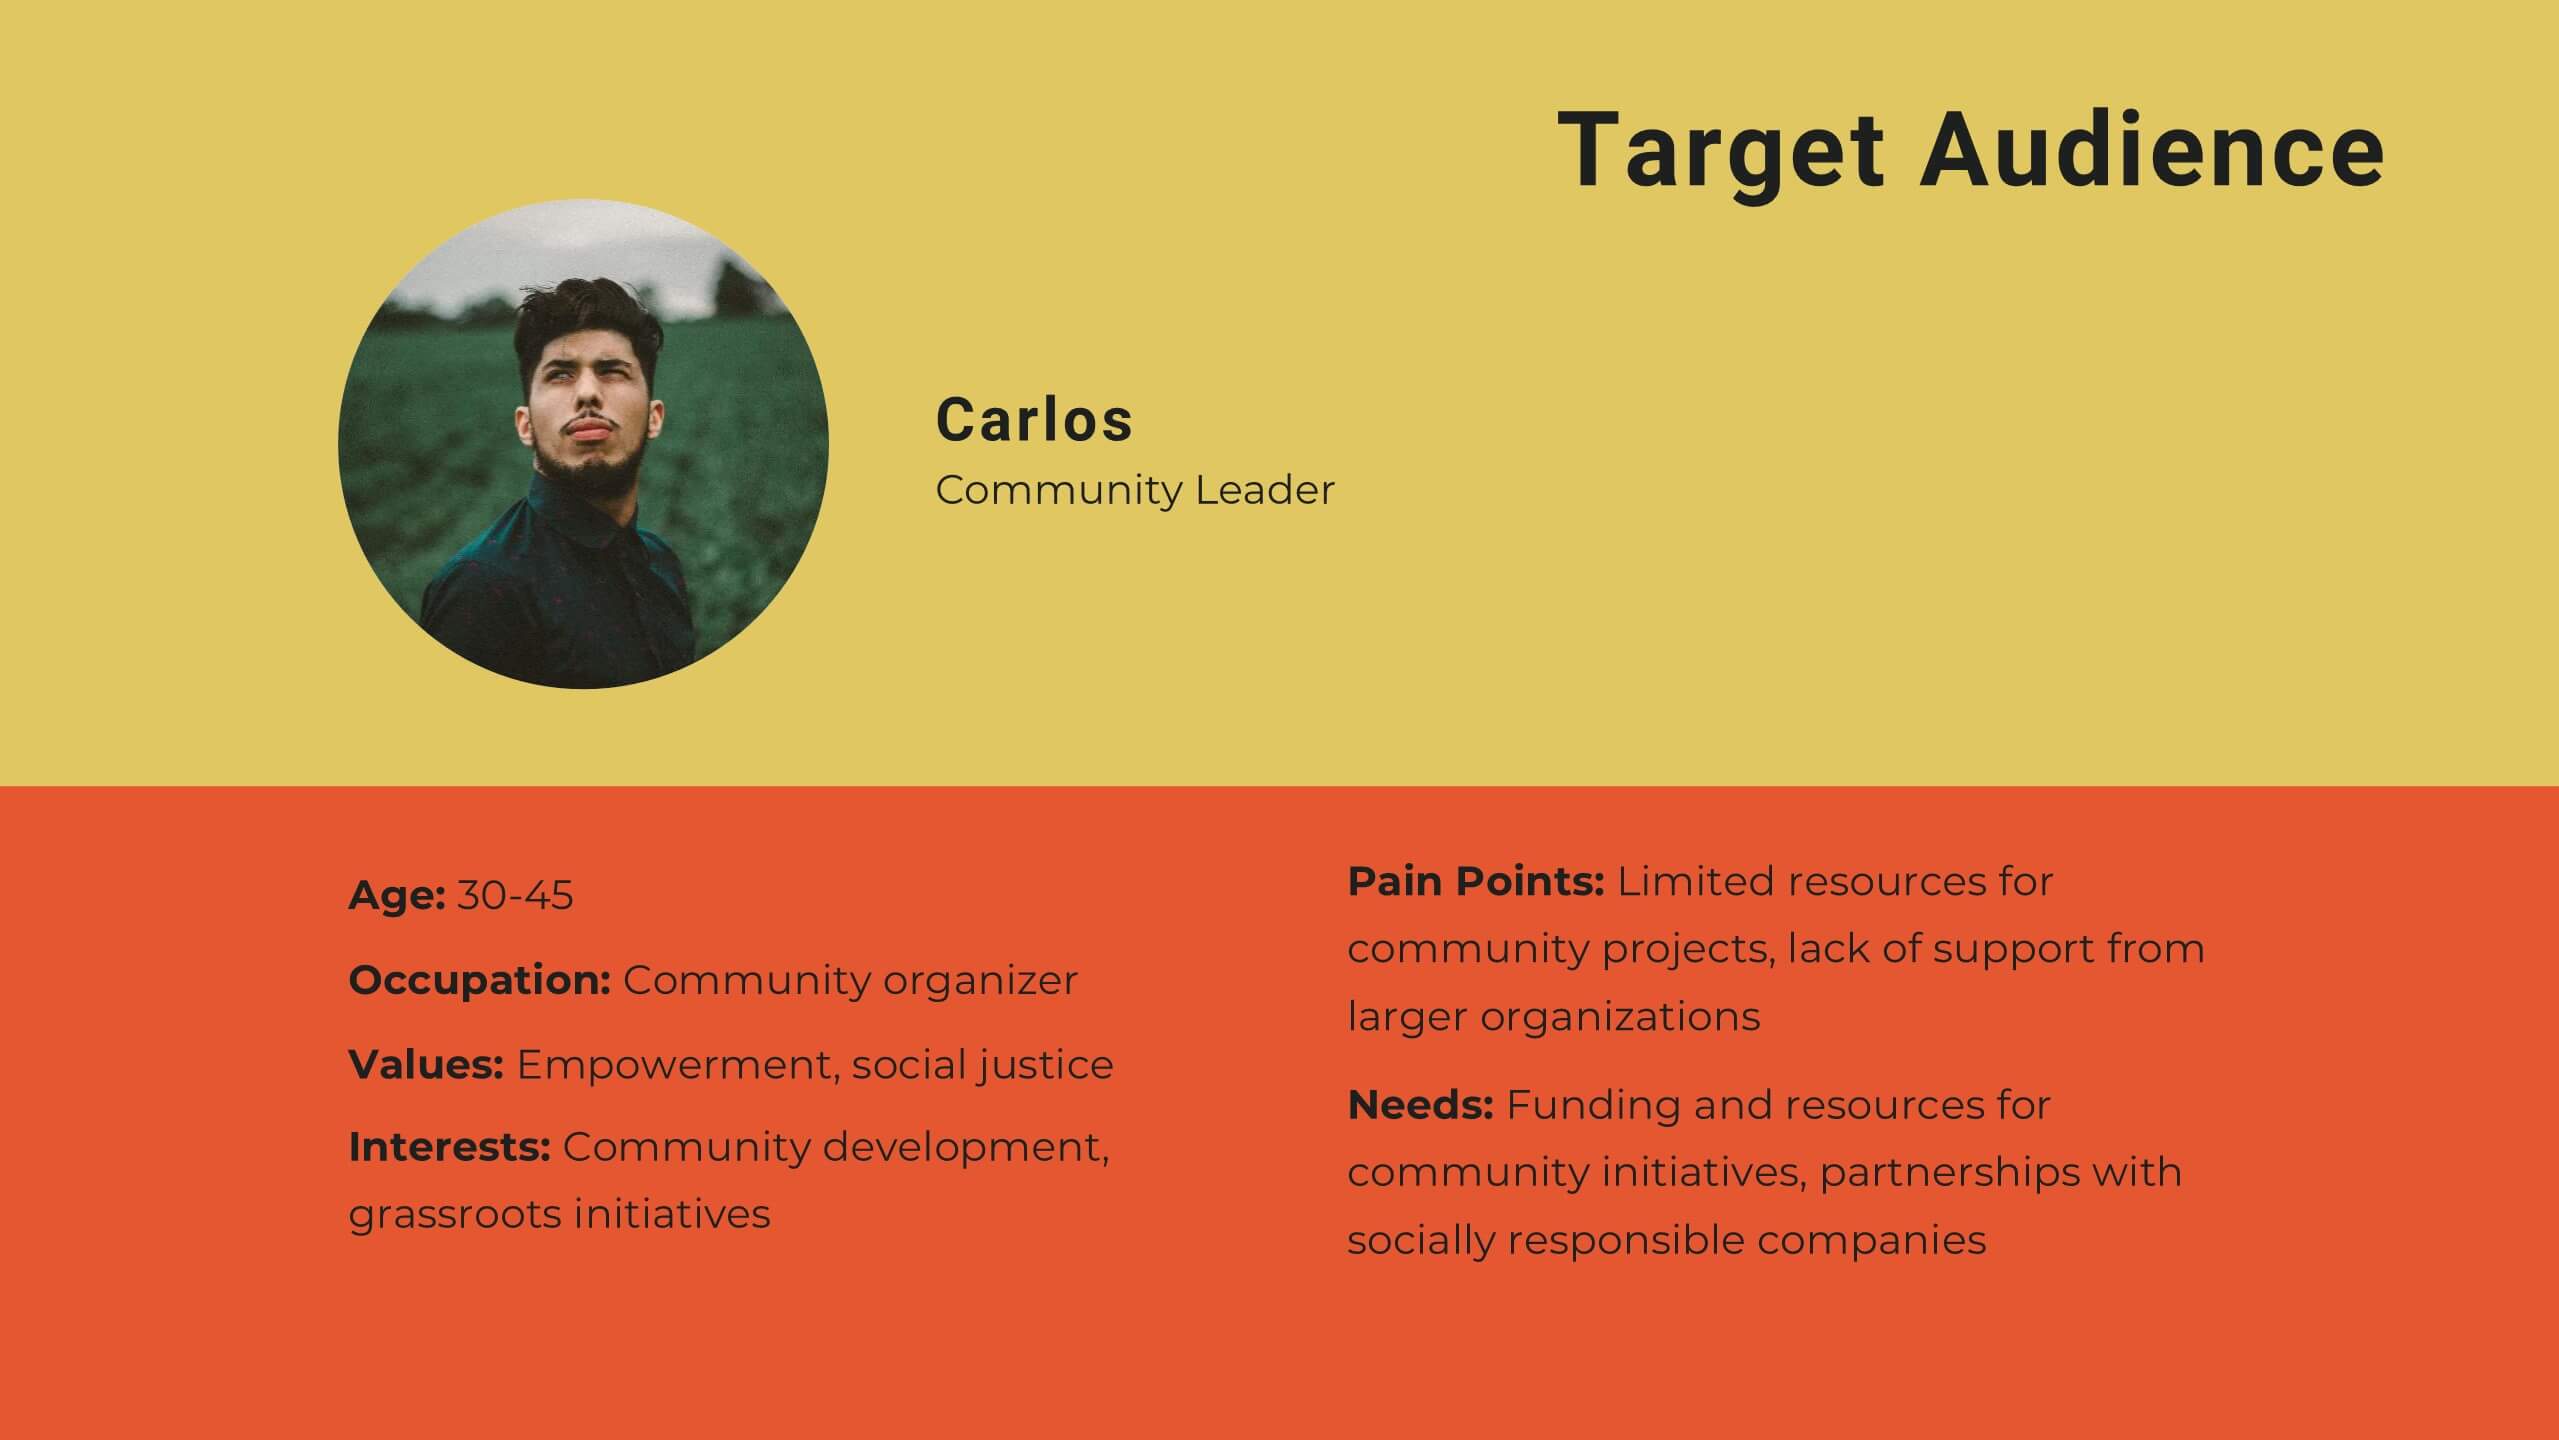
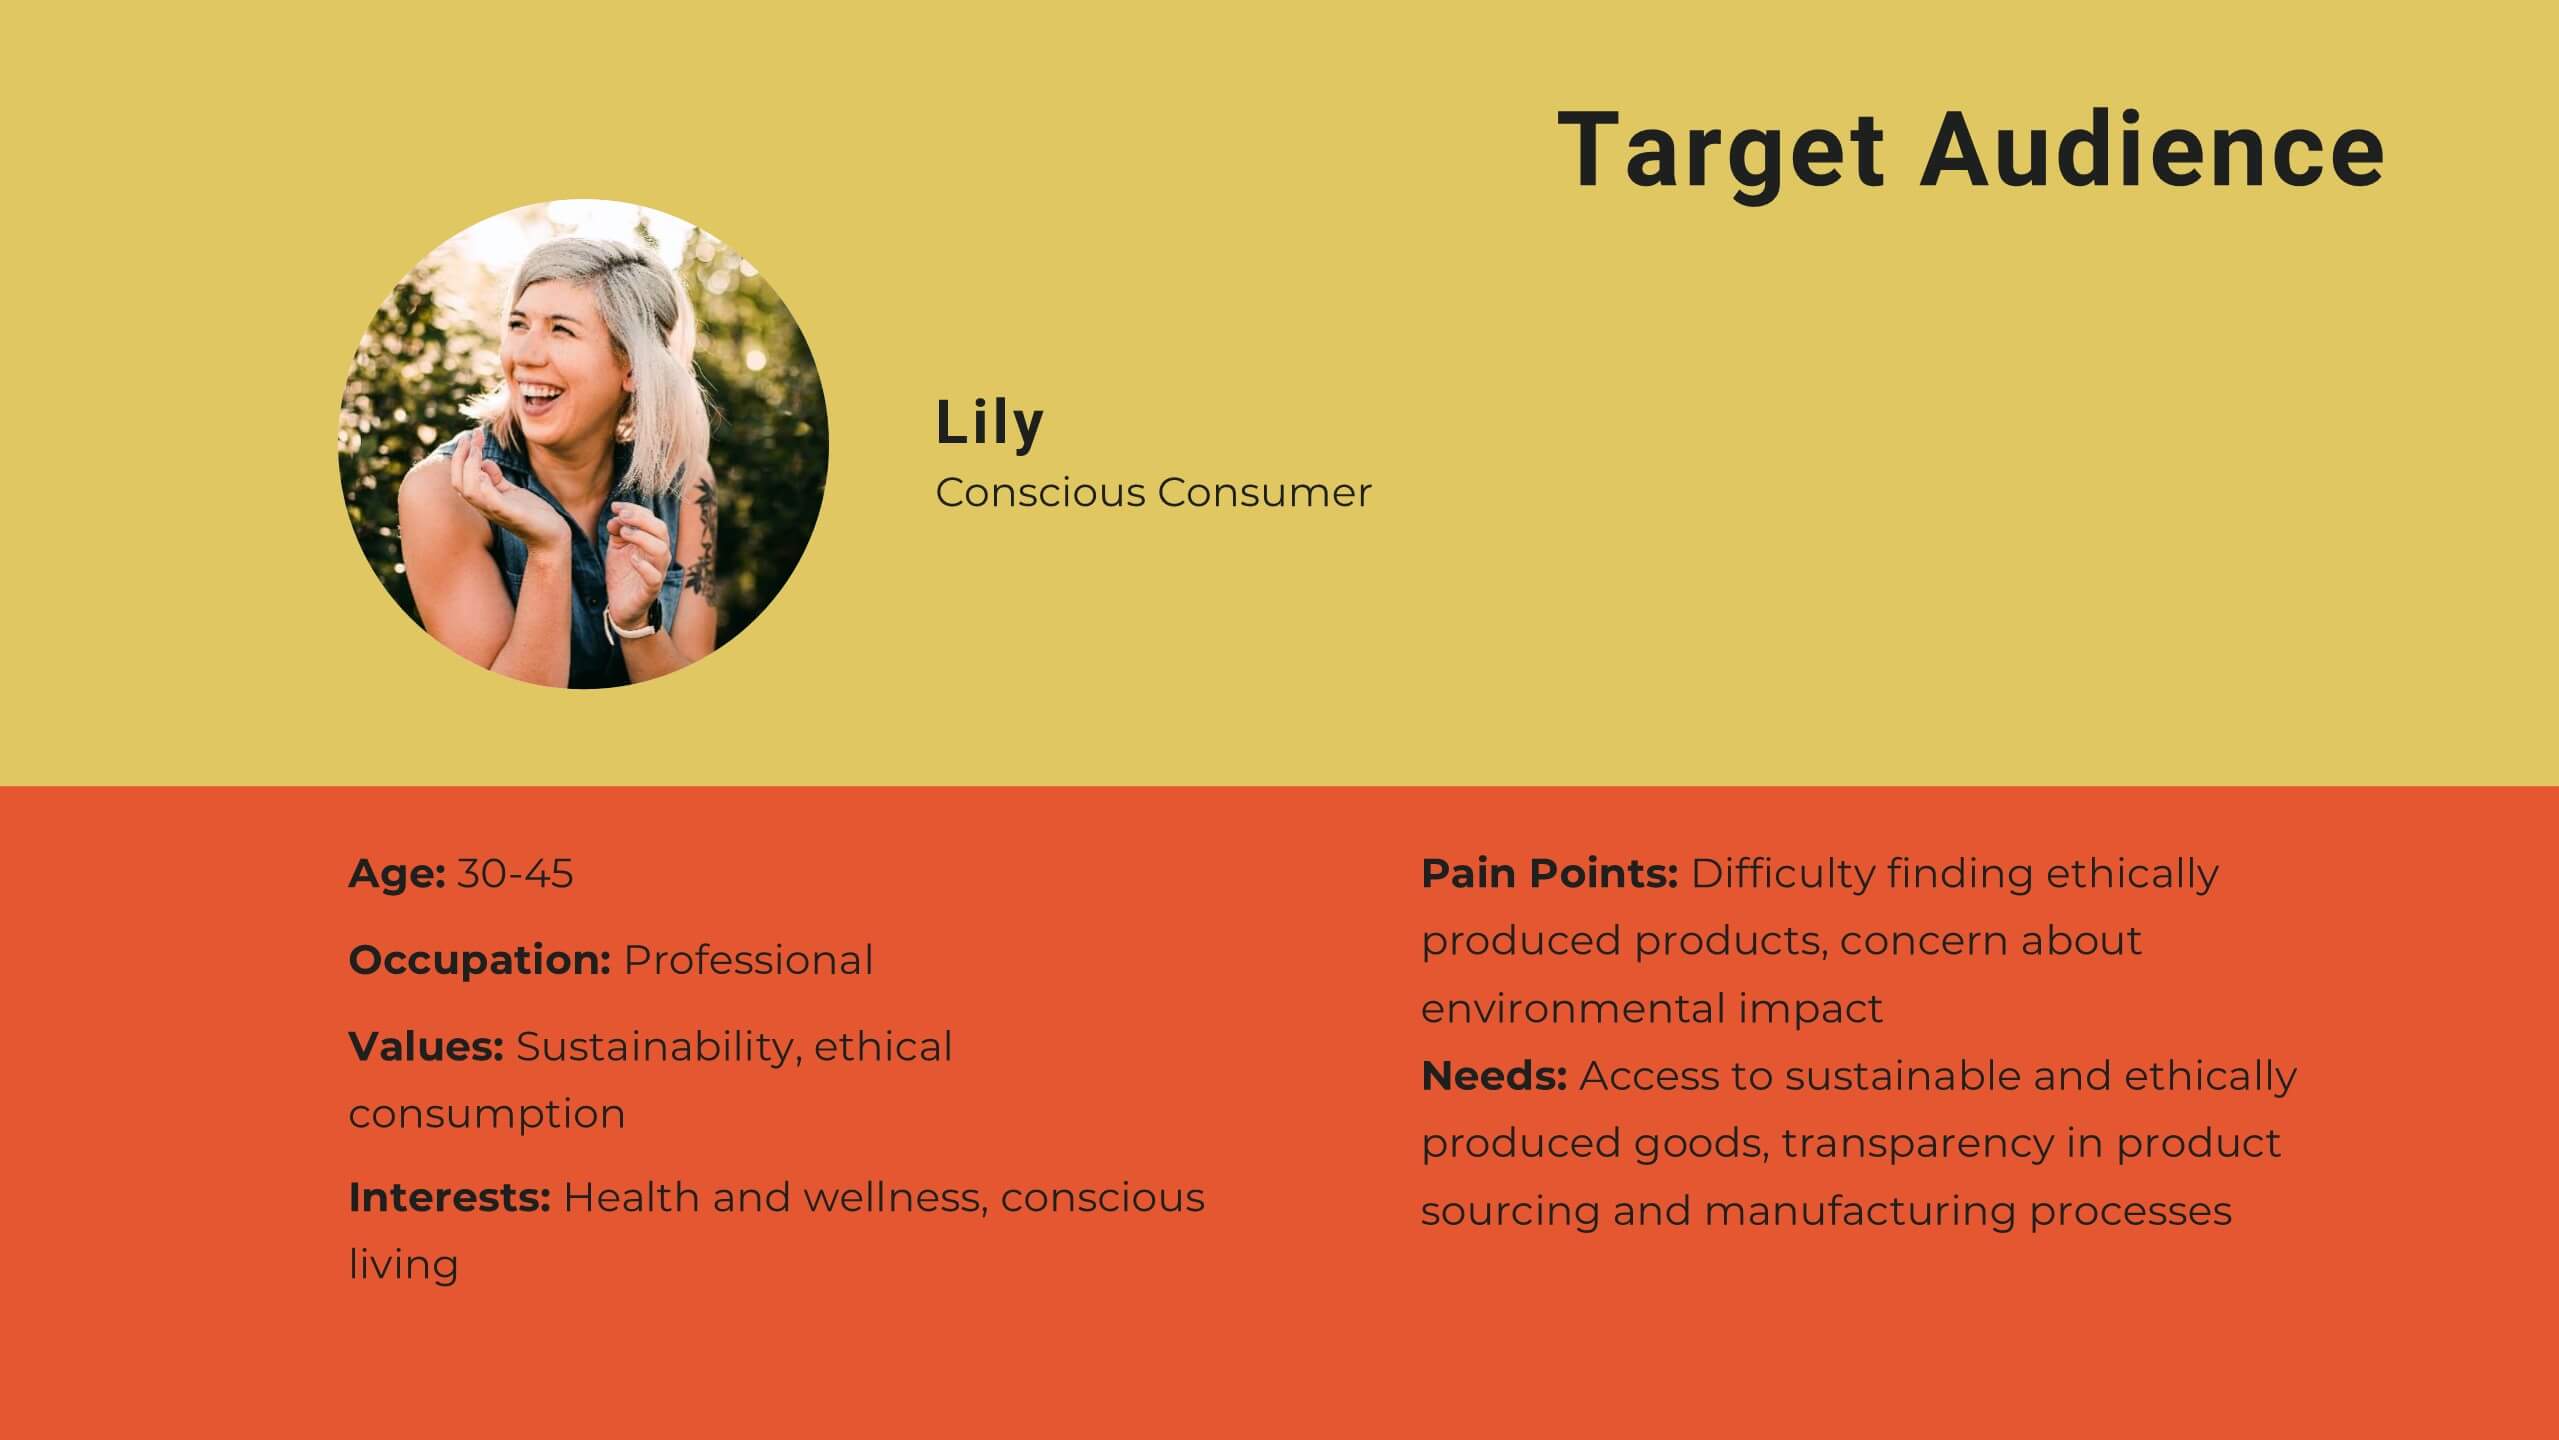
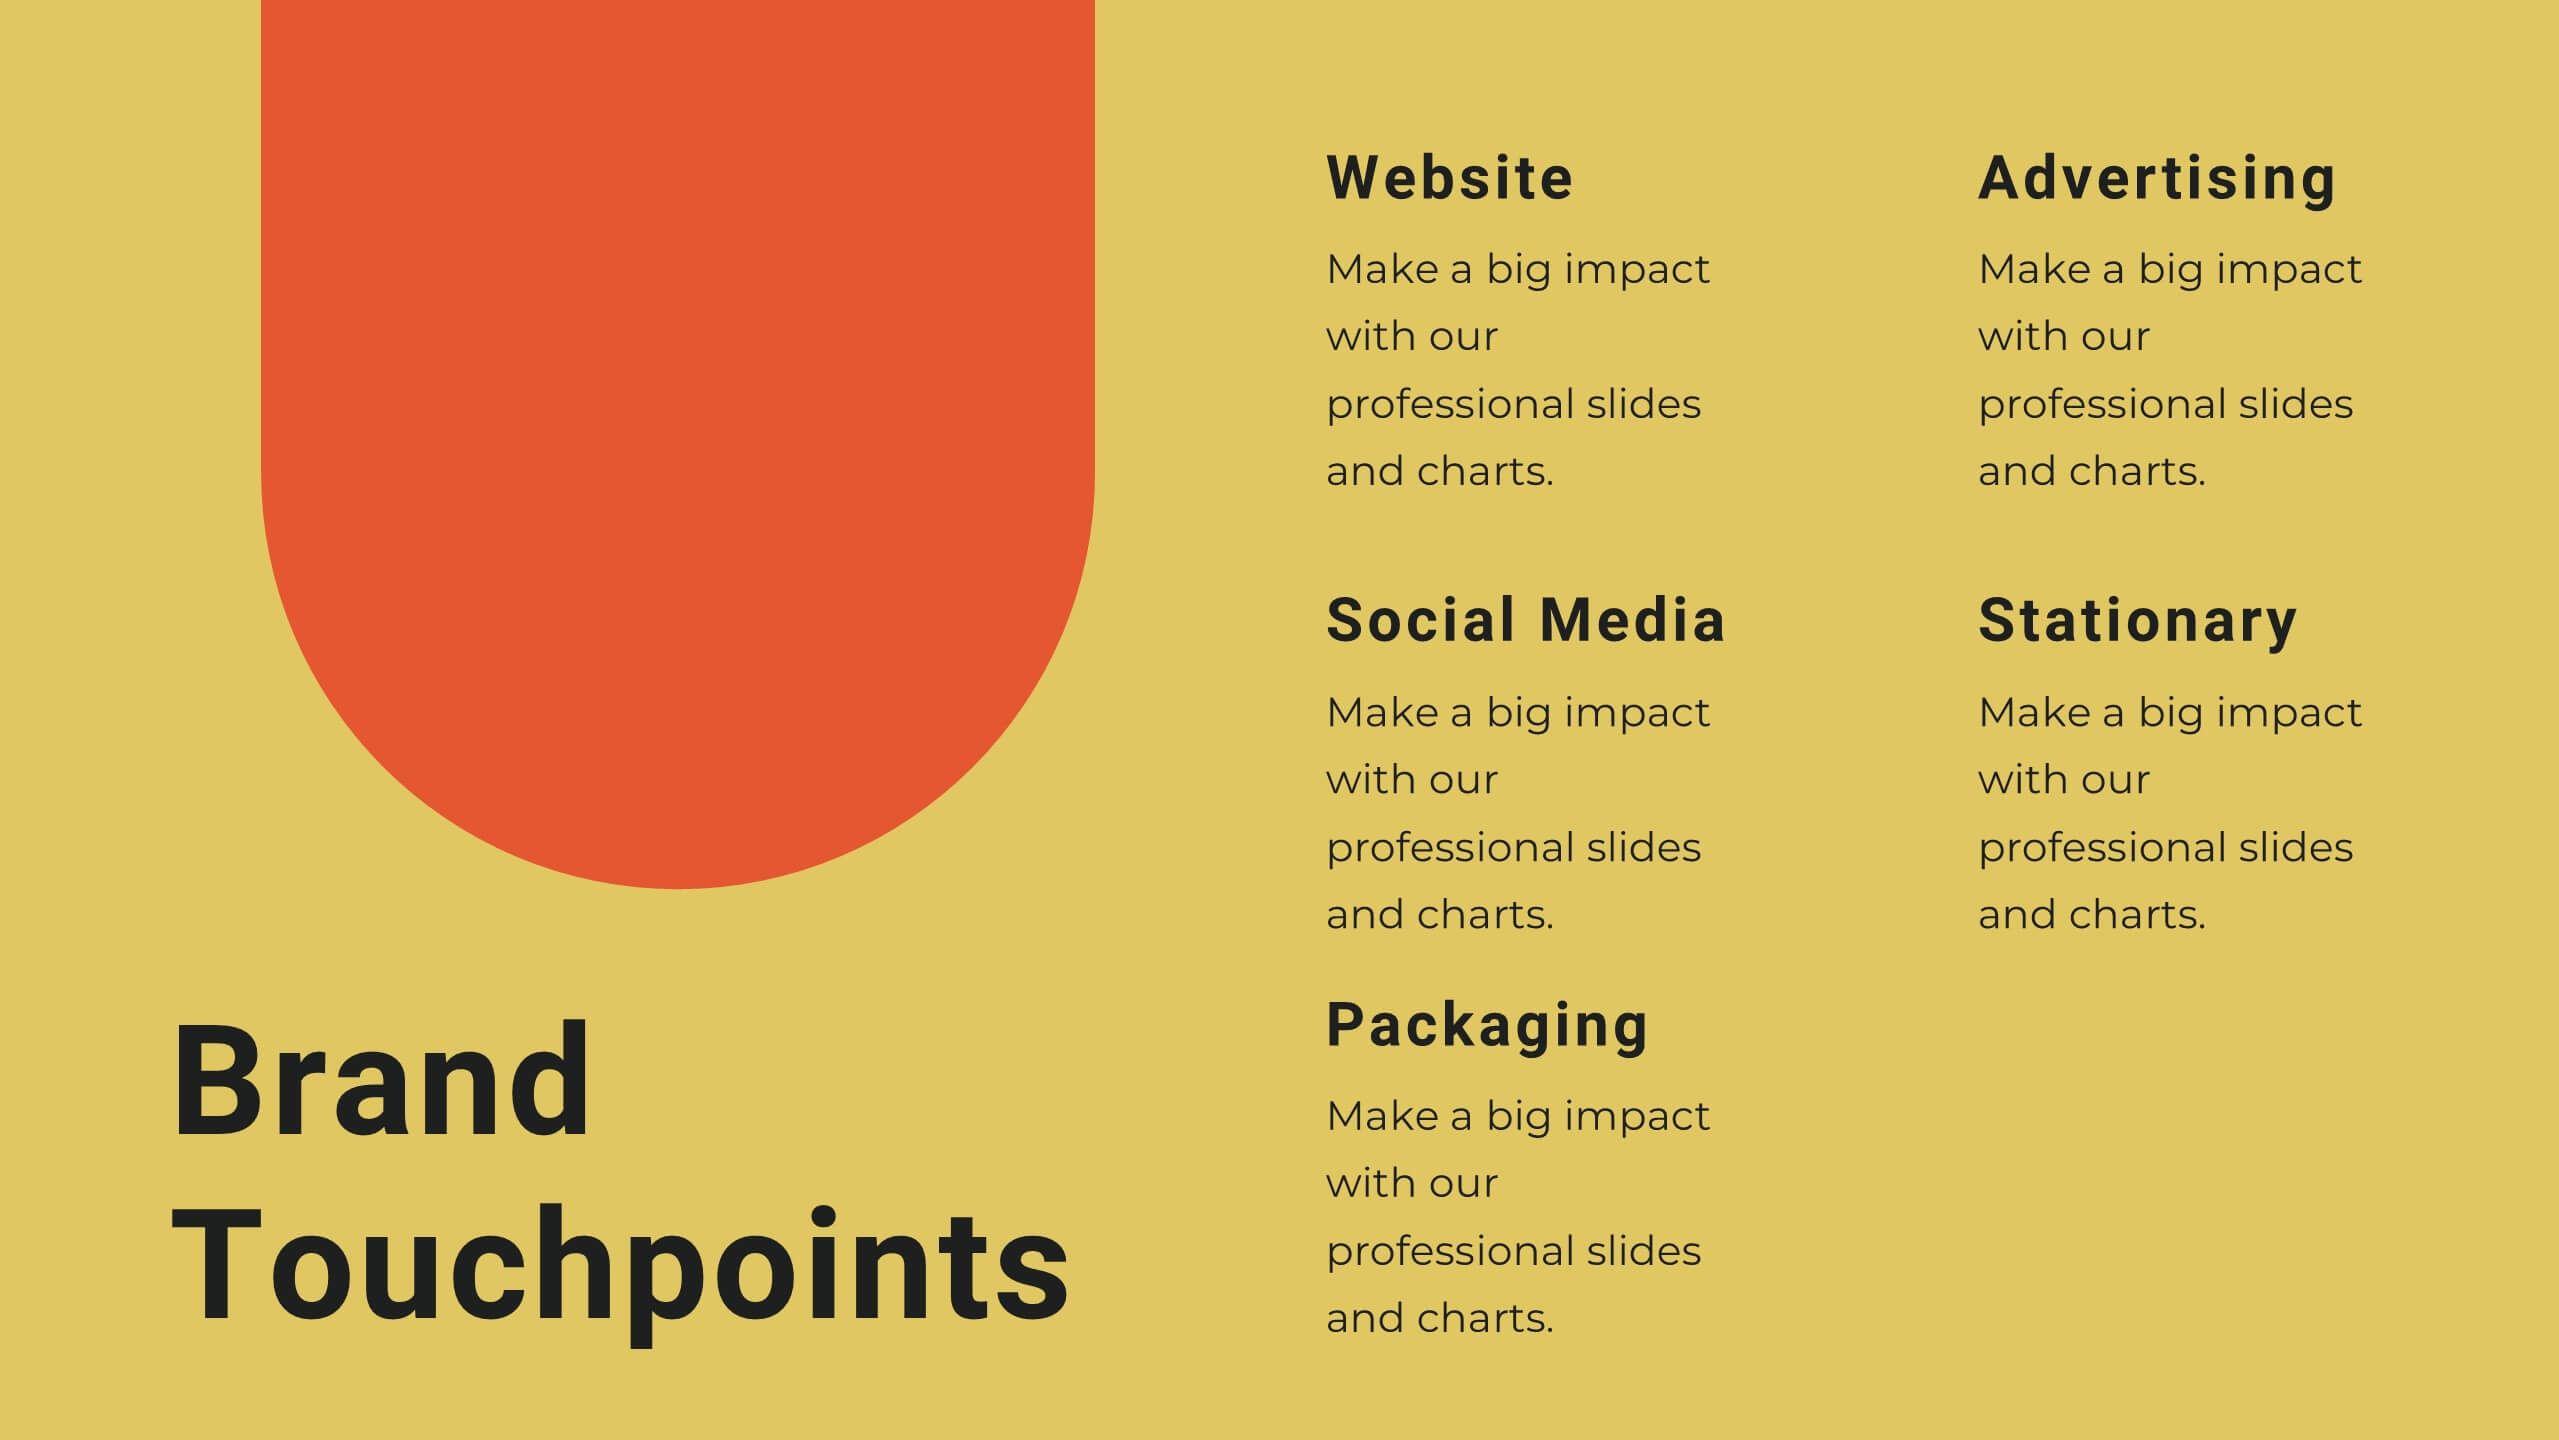
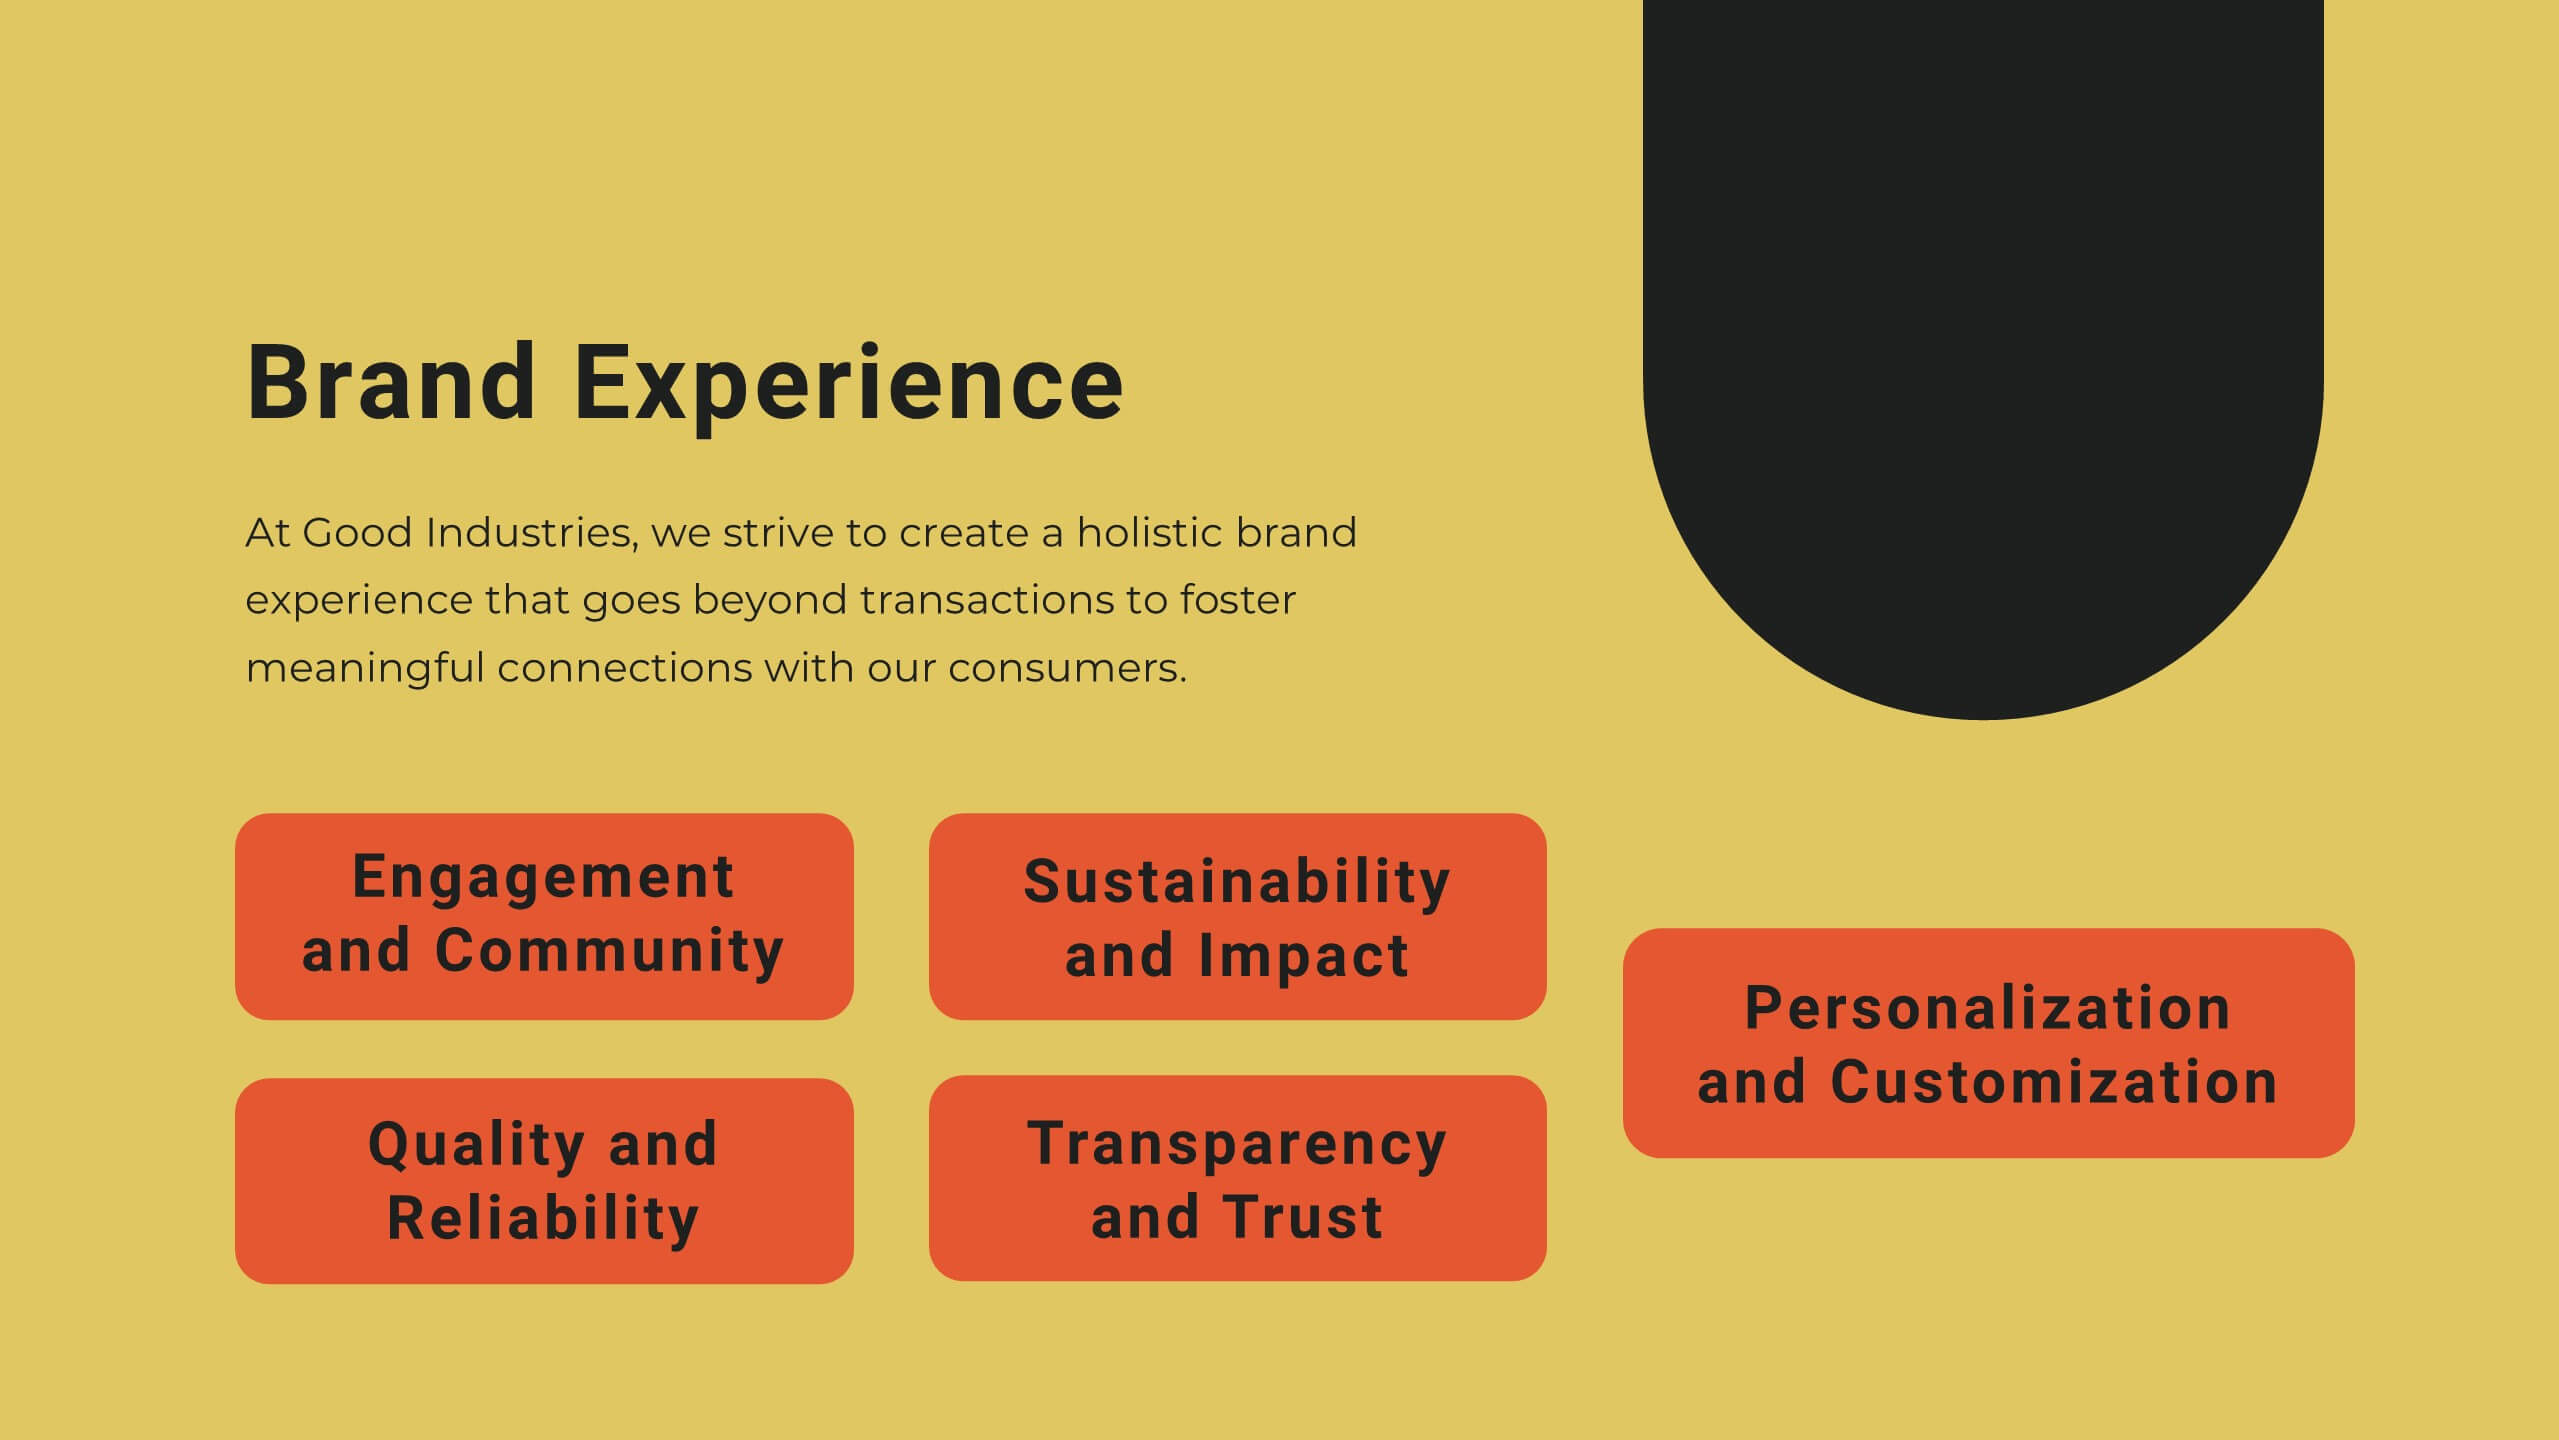
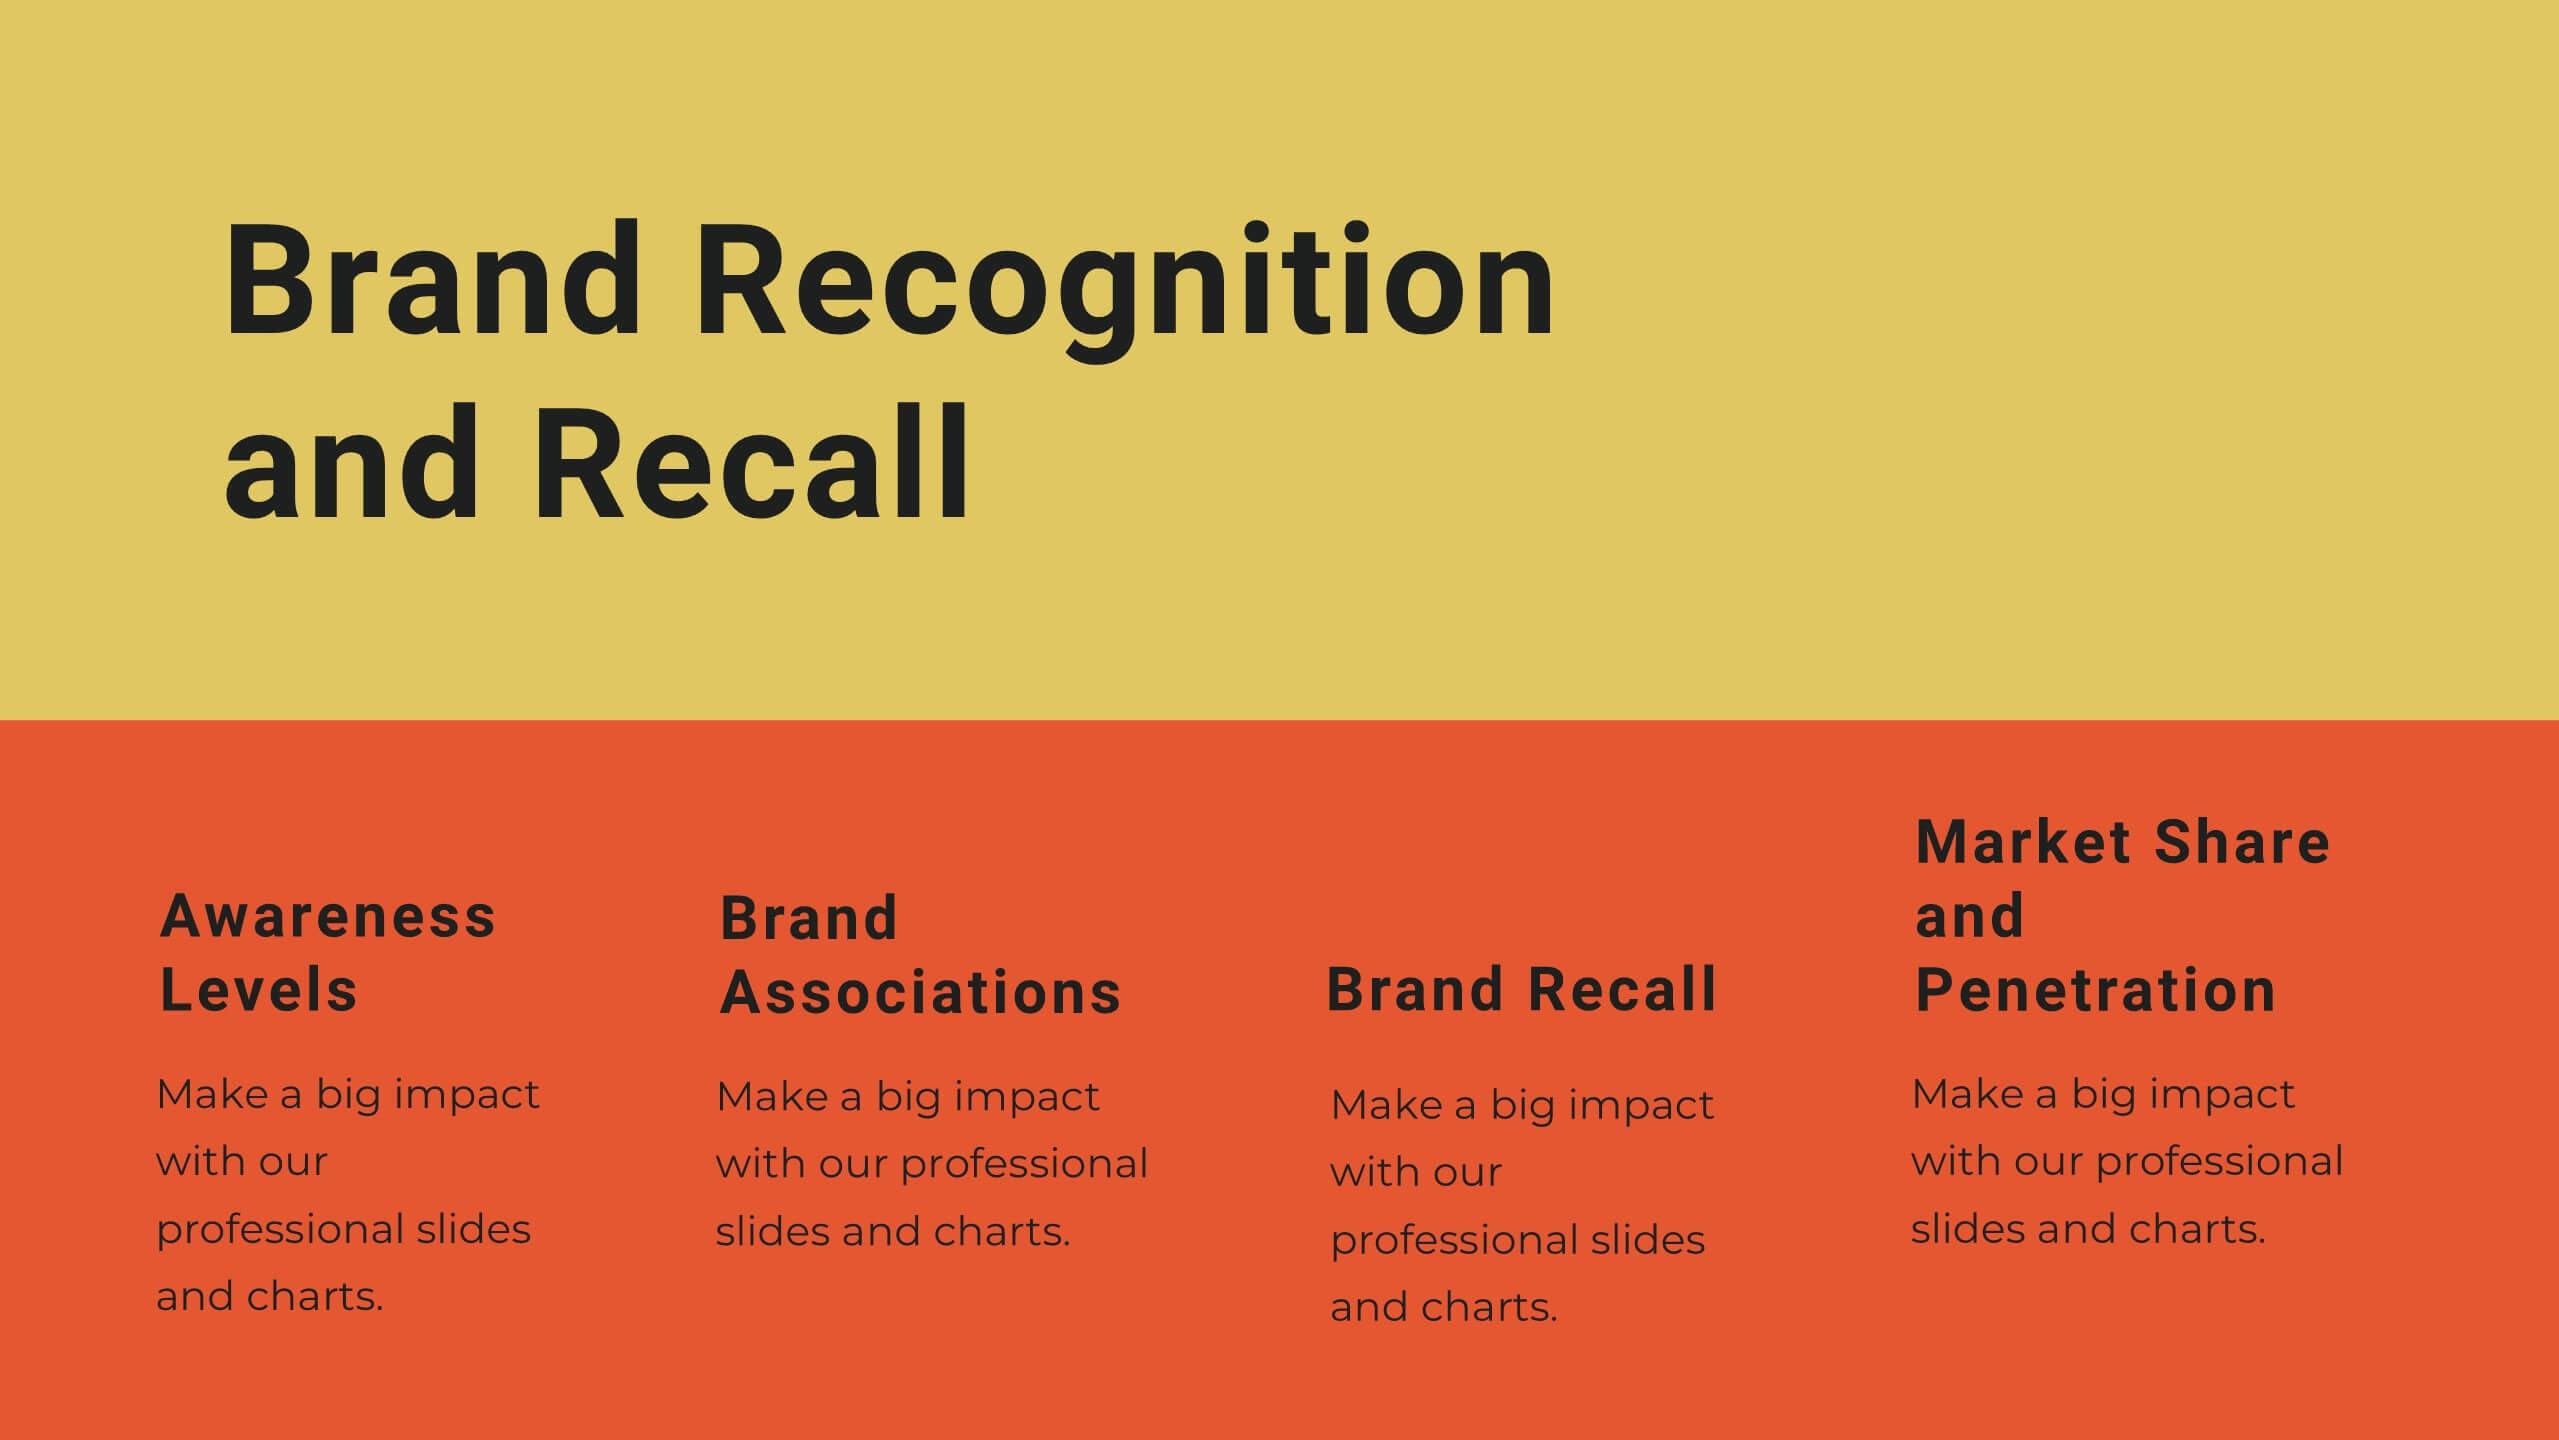
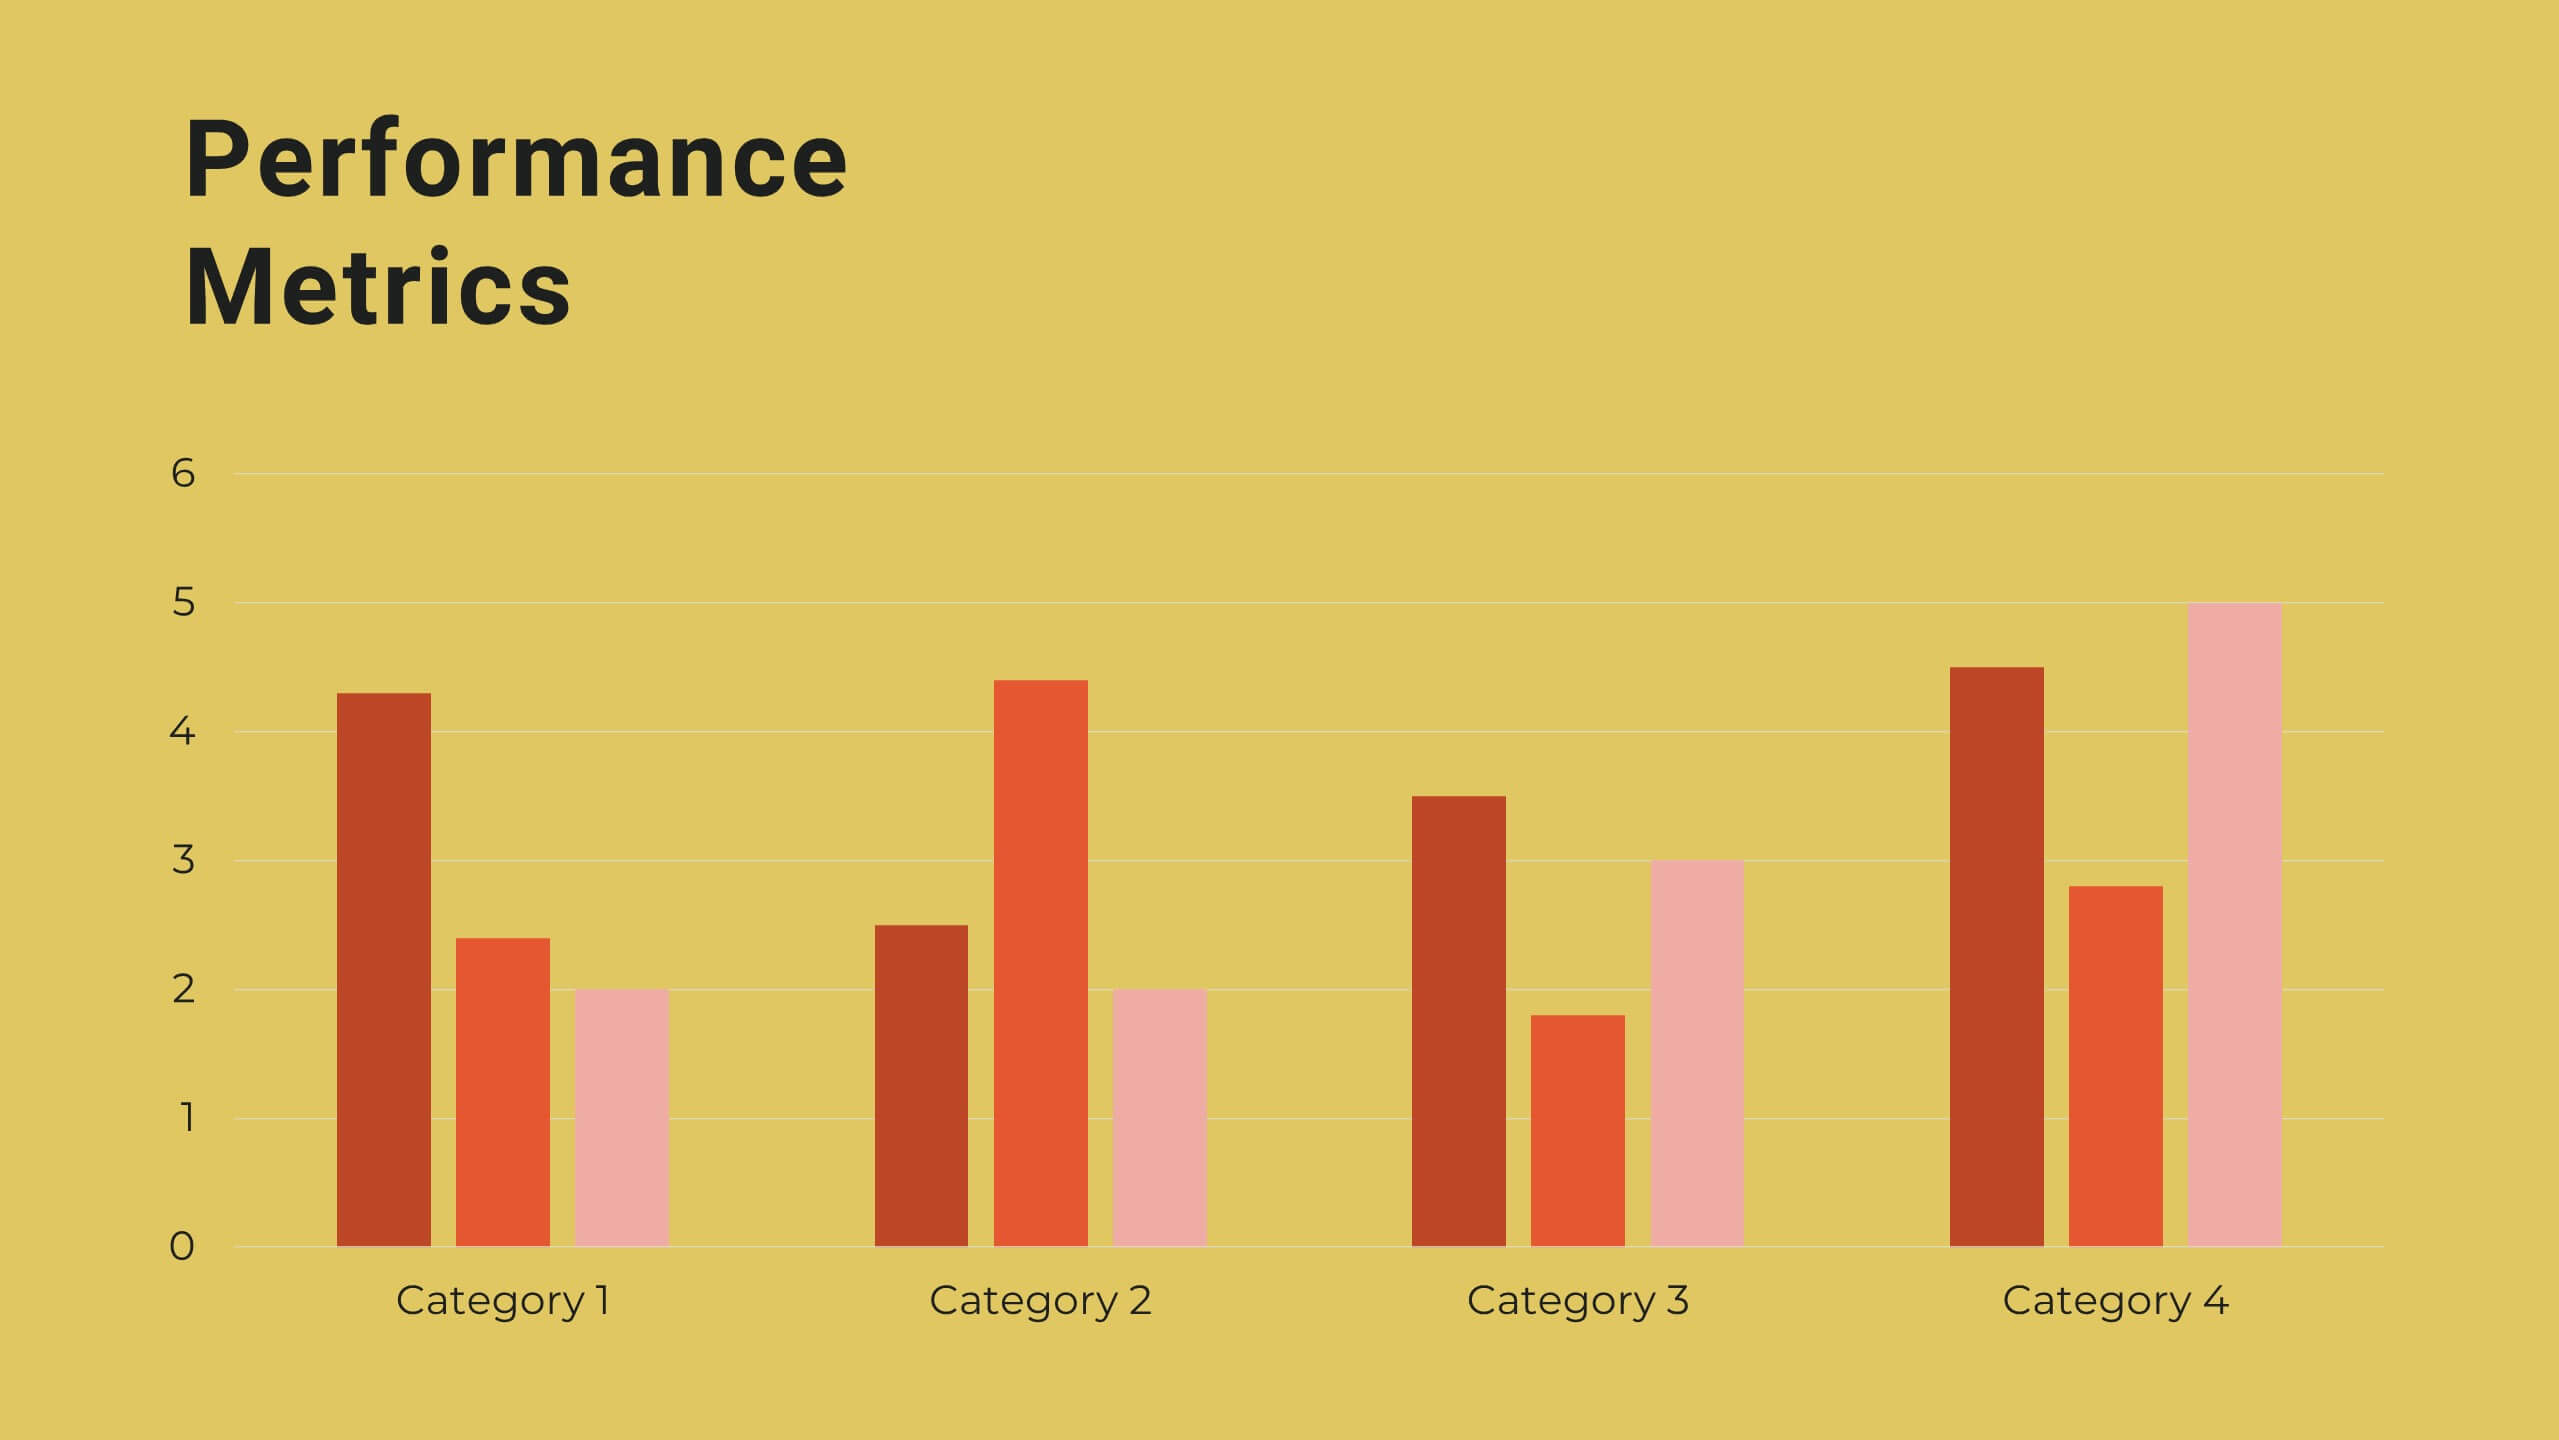
Yttrium Brand Strategy Report Presentation
Present your brand strategy with confidence using this vibrant, structured template! Covering brand identity, values, audience personas, and positioning, this template is perfect for crafting a compelling brand narrative. Fully customizable, it’s designed for seamless use in PowerPoint, Keynote, and Google Slides, making it an ideal tool for branding presentations.
22 slides
Beacon Product Development Plan Presentation
Develop your product strategy with this dynamic template! Perfect for highlighting company overview, product features, and market analysis. Showcase your target market, unique selling proposition, and competitive analysis with ease. Ideal for product demonstrations and sales strategy discussions. Compatible with PowerPoint, Keynote, and Google Slides. Impress your audience and elevate your product development presentations!


21 slides
Astral Startup Business Plan Presentation
This sleek and professional Startup Business Plan template is designed to help you convey your startup’s potential to investors and stakeholders effectively. With a minimalist design and a structured flow, it covers all essential aspects of your business plan, from mission and vision to financial overview and growth plan. Each slide is crafted to present critical information in a clear and concise manner, making it easier for your audience to grasp the key points. This template is fully compatible with PowerPoint, Keynote, and Google Slides, allowing you to customize it to suit your branding and presentation style. Use this template to create a compelling and impactful presentation that will leave a lasting impression on your audience.