


Features
- 23 Unique Slides
- Fully editable and easy to edit in Microsoft Powerpoint, Keynote and Google Slides
- 16:9 widescreen layout
- Clean and professional designs
- Export to JPG, PDF or send by email


Do you have any questions?
Recommend


5 slides
Project Risk Management Framework Presentation
Visualize challenges before they arise with this dynamic framework designed to map, assess, and mitigate project risks efficiently. Its circular layout highlights every critical stage, helping you communicate strategies clearly and professionally. Fully editable and compatible with PowerPoint, Keynote, and Google Slides for effortless customization and presentation flexibility.


4 slides
Leadership Training Framework Presentation
Inspire growth and guide your team toward success with this clear and modern presentation layout. Designed to illustrate leadership principles, development stages, and coaching strategies, it helps communicate training goals with professionalism and ease. Fully customizable and compatible with PowerPoint, Keynote, and Google Slides for seamless use across platforms.


26 slides
Haeleigh Presentation Template
The Haeleigh Powerpoint Template is a 26 modern slide template that is perfect for any presentation. With a clean classy aesthetic and easy to read text, this template is ideal for reading content and looking professional. The use of nude colors helps keep the look clean and easy to read. The theme comes packed with features to target your audience and help you get your message across. The charts, graphics, timelines included are easy to edit. This template is also perfect for businesses seeking to make an impression on their audience. Haeleigh is mobile friendly and easy to navigate.


5 slides
United States States Outline Presentation
Make your data pop with a vibrant, easy-to-read snapshot of U.S. state insights. This presentation helps you highlight regional trends, compare performance, and showcase key information using a clean state-by-state outline. Perfect for reports, geography topics, or analytics. Fully compatible with PowerPoint, Keynote, and Google Slides.


8 slides
Corporate Office Scenes Illustrations Presentation
Bring workplace communication to life with this slide featuring an illustrated office meeting scene and a four-point list layout. Each segment is color-coded with accompanying icons, making it ideal for presenting corporate strategies, team roles, or process workflows. Designed for clarity and visual appeal, this slide is perfect for business reports, training decks, or client briefings. Easily customizable in PowerPoint, Keynote, and Google Slides.


6 slides
Restaurant Branding Food Presentation
Bring your ideas to life with a presentation that feels fresh, playful, and full of personality. This layout helps you showcase food branding concepts, menu themes, and visual identity elements in a clear, engaging flow that’s easy for audiences to follow. Fully compatible with PowerPoint, Keynote, and Google Slides.


26 slides
Maev Presentation Template
Maev is a perfect modern template with a clean and professional feel. Maev was designed by professionals to help businesses connect with their audience. This template has a modern, chic aesthetic and very detailed look which is extremely appealing. The colors are fresh which help keep the look clean and easy to read. The theme comes packed with features to target your audience and help you get your message across. Charts, timelines and easy to edit text, this template is perfect for businesses seeking to make an impression on their audience. by demonstrating they are transparent and reliable.


5 slides
Performance Metrics Dashboard Presentation
Turn complex data into clear, engaging visuals with a clean, modern dashboard layout that highlights performance results at a glance. Perfect for tracking KPIs, progress, and team outcomes, this template brings structure and clarity to reports. Easily editable in PowerPoint, Keynote, and Google Slides for professional presentations.


20 slides
Trend Report Presentation
Navigate the latest market developments with this Trend Report presentation template. Perfect for displaying current marketing trends, consumer behavior, and future predictions, this vibrant template includes slides for social media strategies, influencer marketing, and more. Fully compatible with PowerPoint, Keynote, and Google Slides, it’s ideal for professionals looking to stay ahead in dynamic industries.


2 slides
Bold and Minimal Opening Presentation Layout
Make your first slide speak volumes with this bold yet minimal opening layout. Designed to grab attention while keeping things simple, this template helps you introduce your presentation with clarity and confidence. Great for modern business decks, it’s fully customizable and works seamlessly in PowerPoint, Keynote, and Google Slides.


5 slides
Customer Retention and Loyalty Marketing Presentation
Showcase your loyalty strategies in a visually compelling way with this modern shopping cart-themed slide. Ideal for outlining customer retention initiatives, this template highlights five key tactics or rewards using numbered icons and clean layout sections. Great for marketers, retail teams, and business consultants. Fully editable in PowerPoint, Keynote, and Google Slides.


22 slides
Syncopate Agency Portfolio Presentation
Showcase your agency’s expertise and achievements with a professional portfolio presentation designed to captivate and inform. This versatile template is tailored for agencies looking to highlight their services, approach, and client success stories with clarity and impact. The presentation includes thoughtfully designed slides covering company mission, market analysis, creative processes, case studies, and future strategies. Utilize dedicated sections to detail campaign executions, partnership opportunities, and awards received. The layout balances aesthetic appeal with functionality, ensuring your audience remains engaged throughout your presentation. Compatible with PowerPoint, Google Slides, and Keynote, this template is fully customizable. Easily edit colors, text, and images to align with your agency's branding. Present your portfolio with confidence, leaving a lasting impression on clients, partners, and stakeholders.


4 slides
Circular Data Flow in Systems Presentation
Visualize relationships and flow within your systems using the Circular Data Flow in Systems Presentation. Ideal for showcasing input-output dynamics, data loops, or stakeholder interaction, this diagram presents centralized nodes with surrounding connectors for clarity. Each element is editable and works seamlessly in PowerPoint, Google Slides, and Canva.


4 slides
Meetings Agenda Slide Presentation
Make every meeting feel purposeful with a clean layout that highlights topics, timing, and key discussion points effortlessly. This presentation helps teams stay aligned, organized, and ready to follow the flow of the session. Perfect for planning or reporting. Fully compatible with PowerPoint, Keynote, and Google Slides.


22 slides
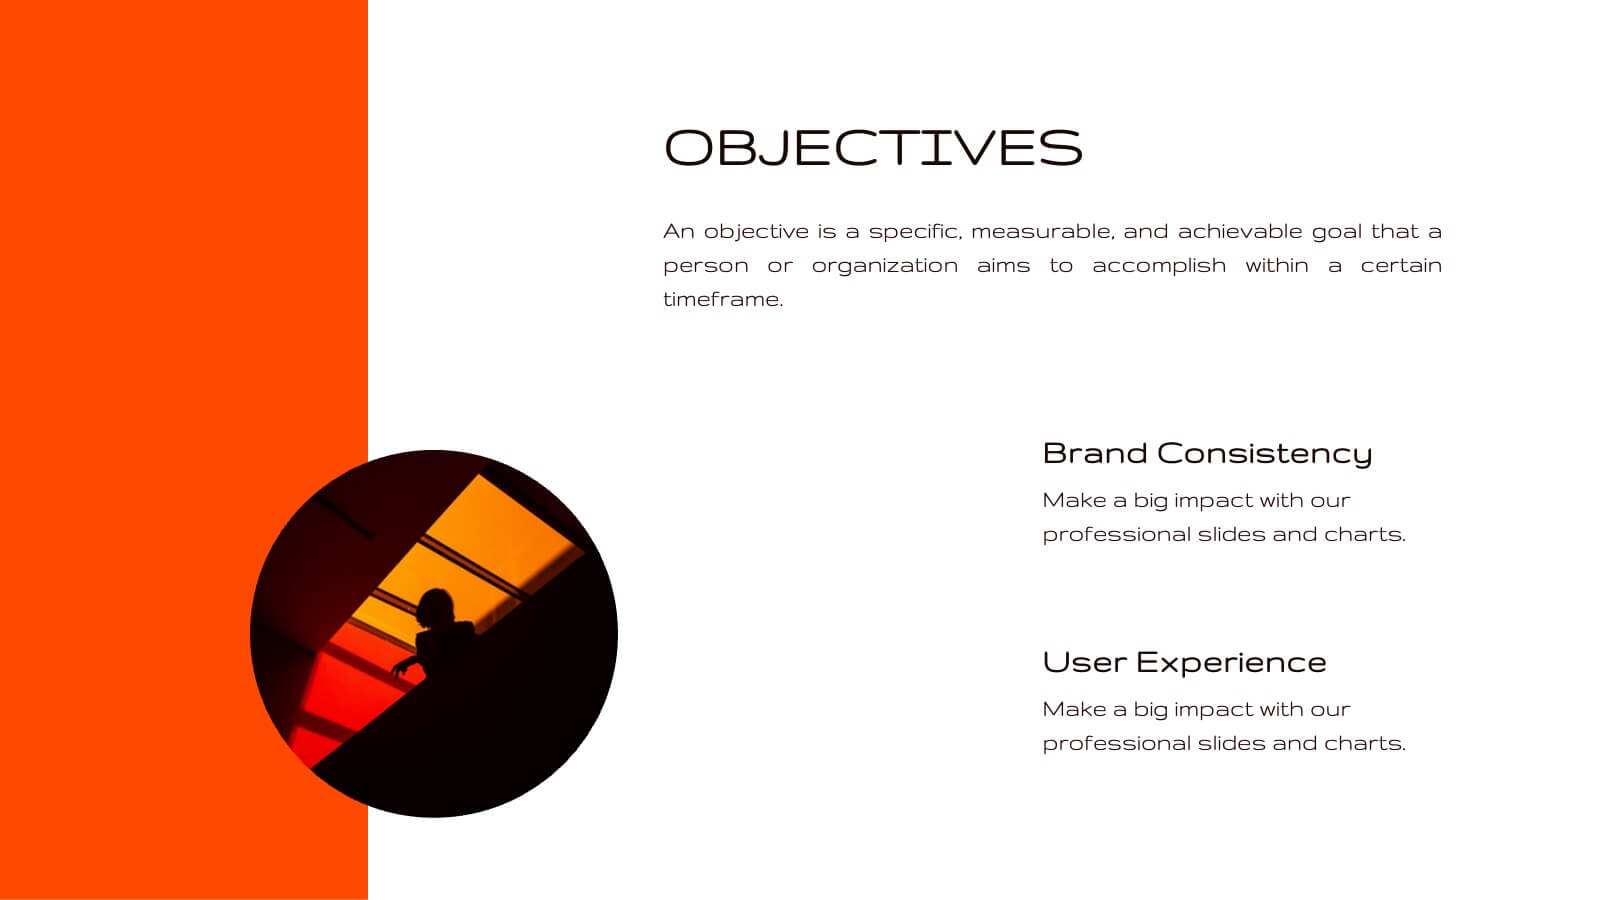
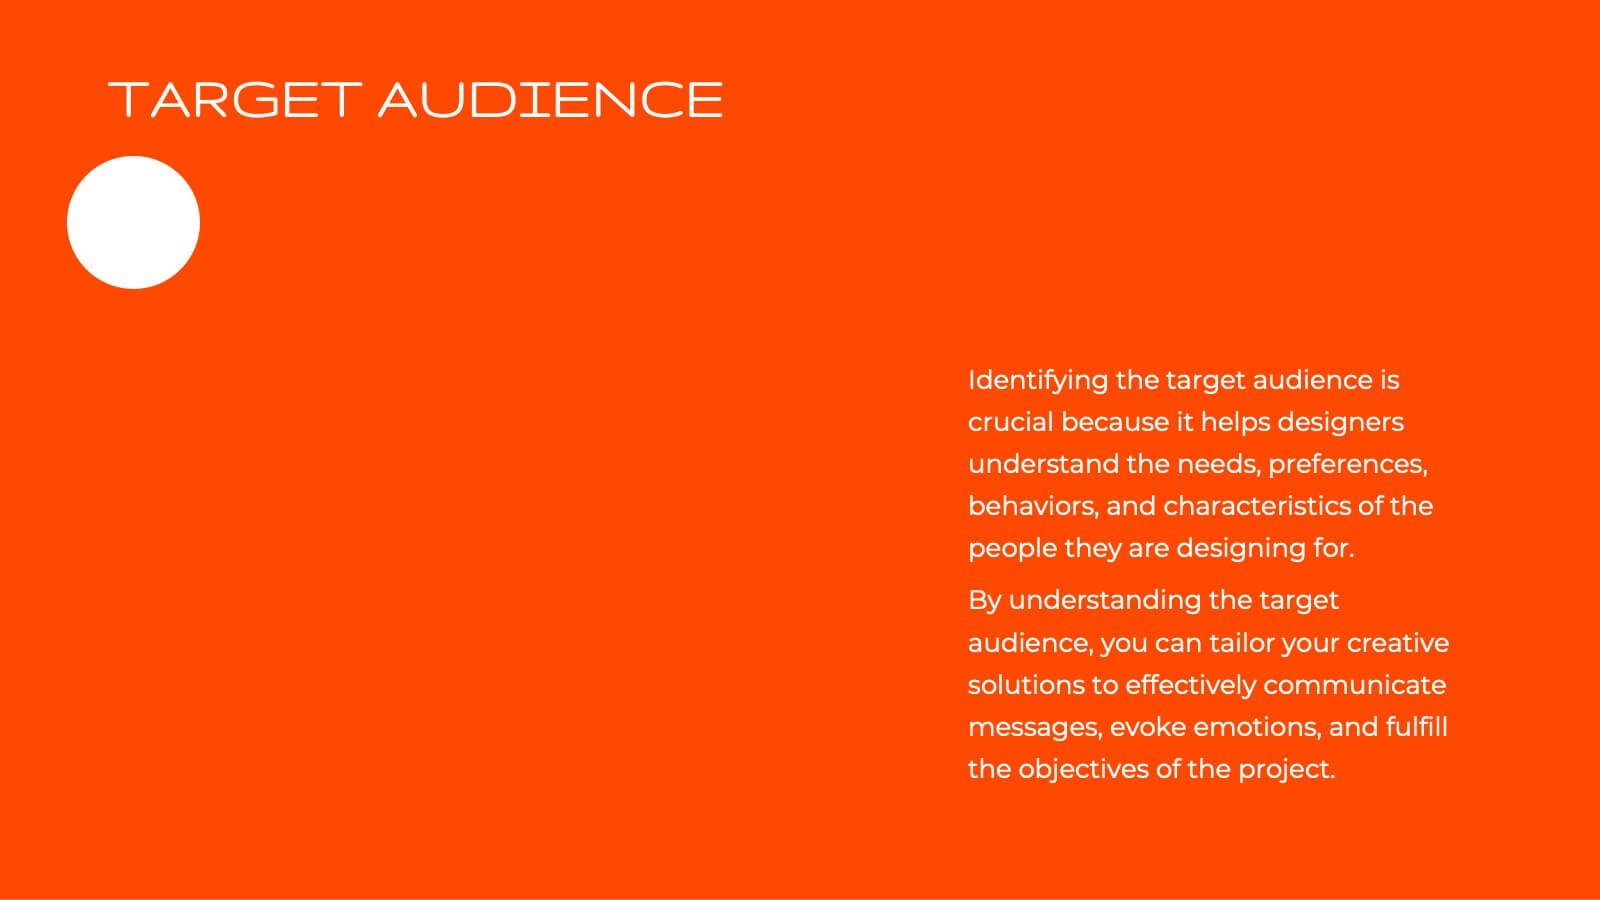
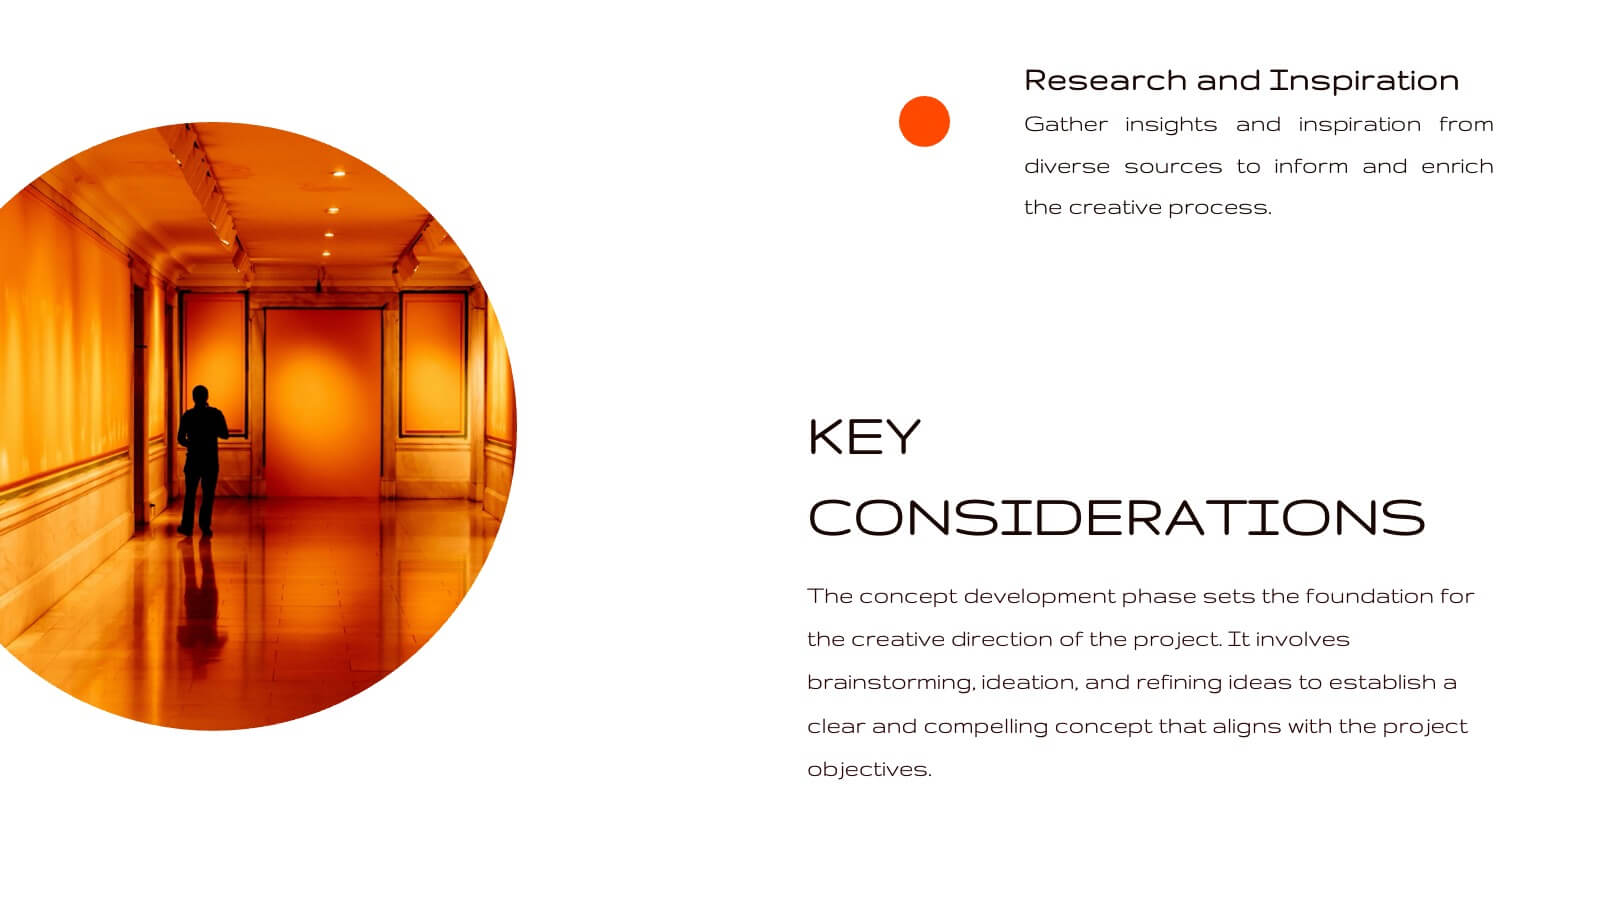
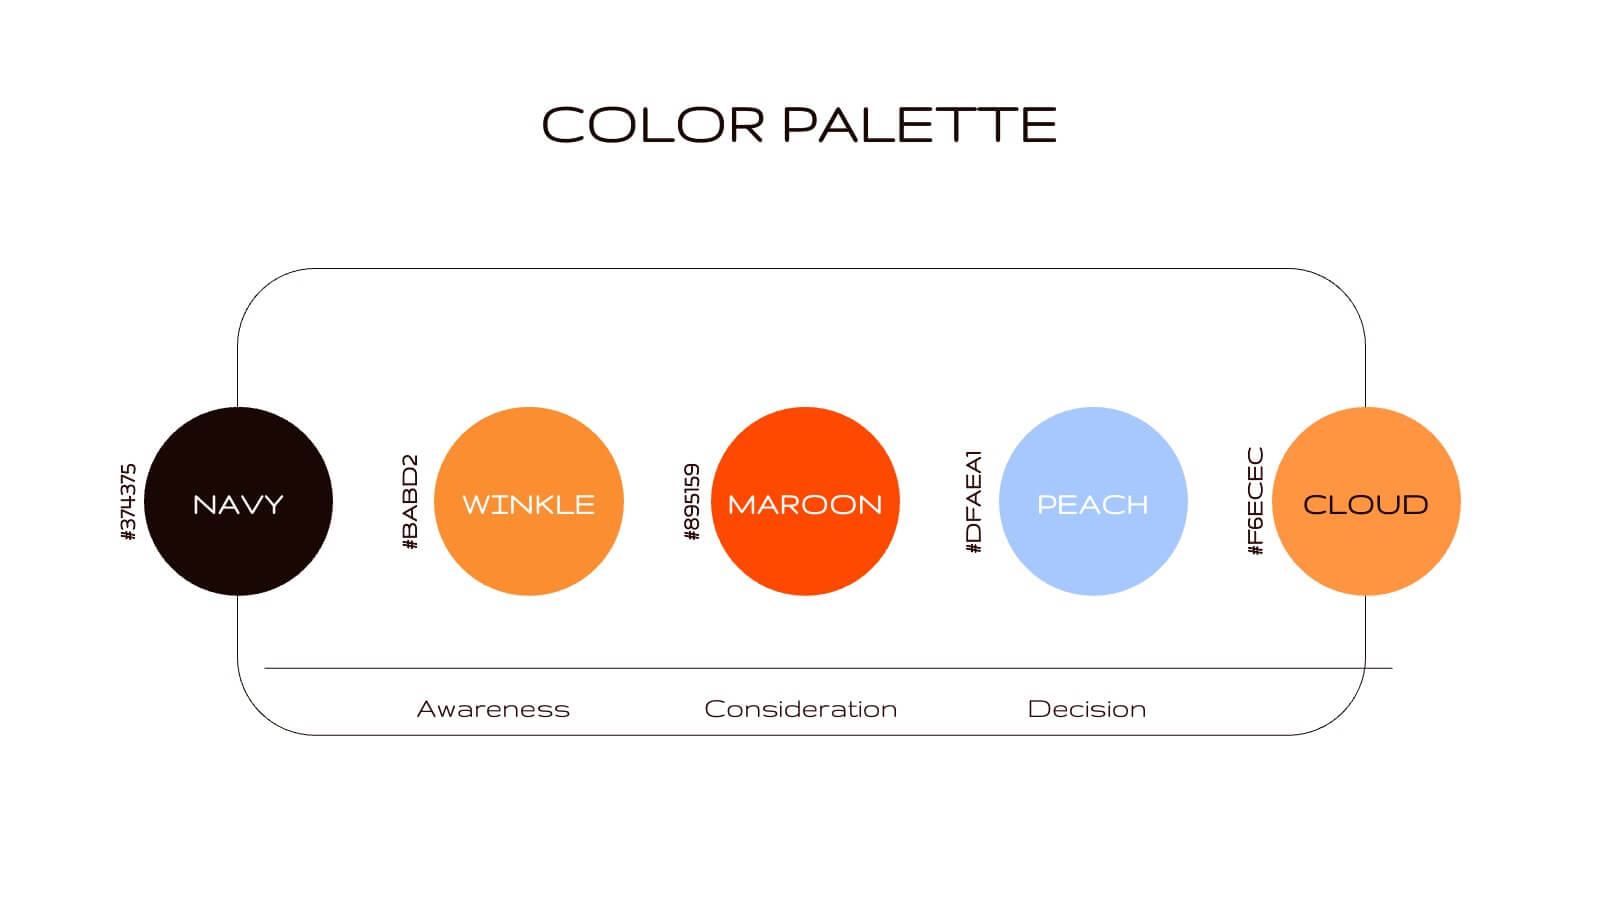
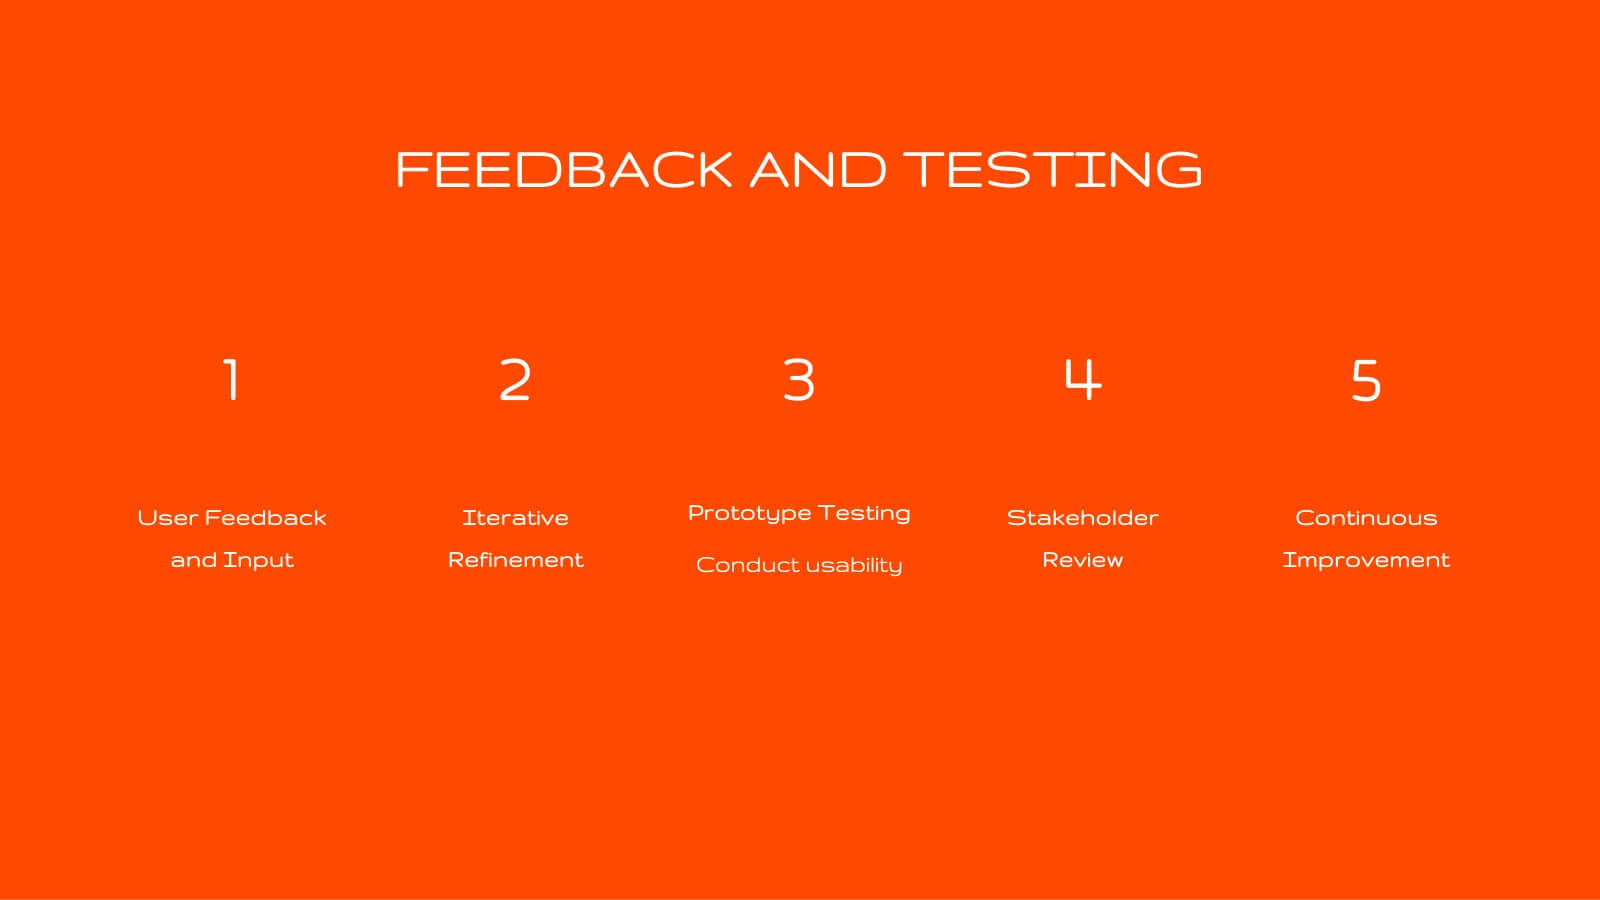
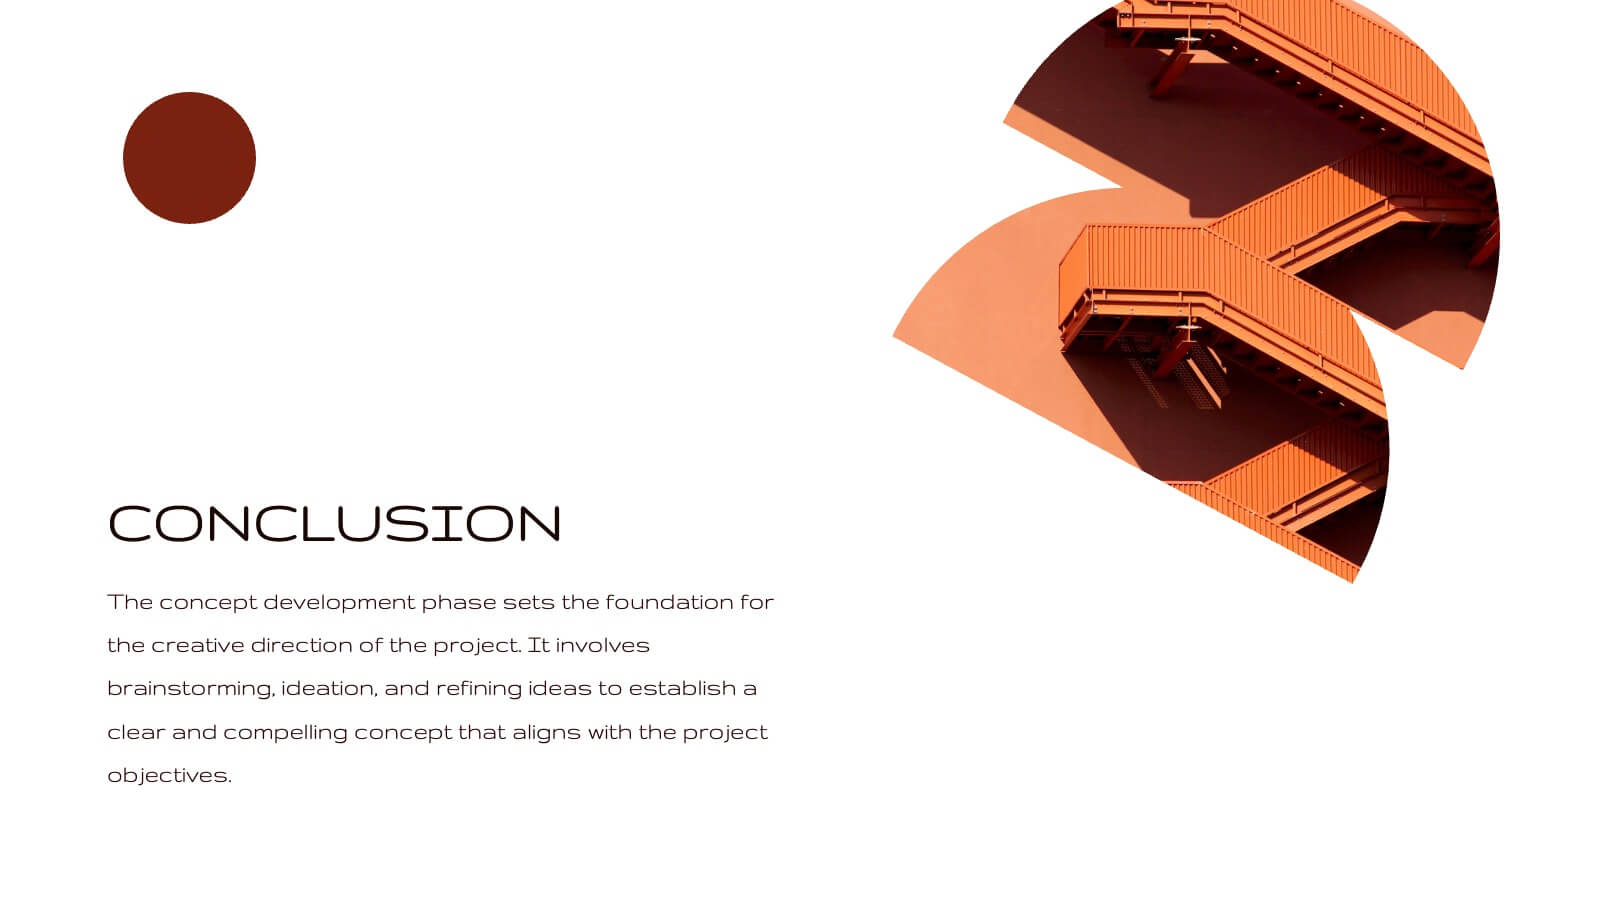
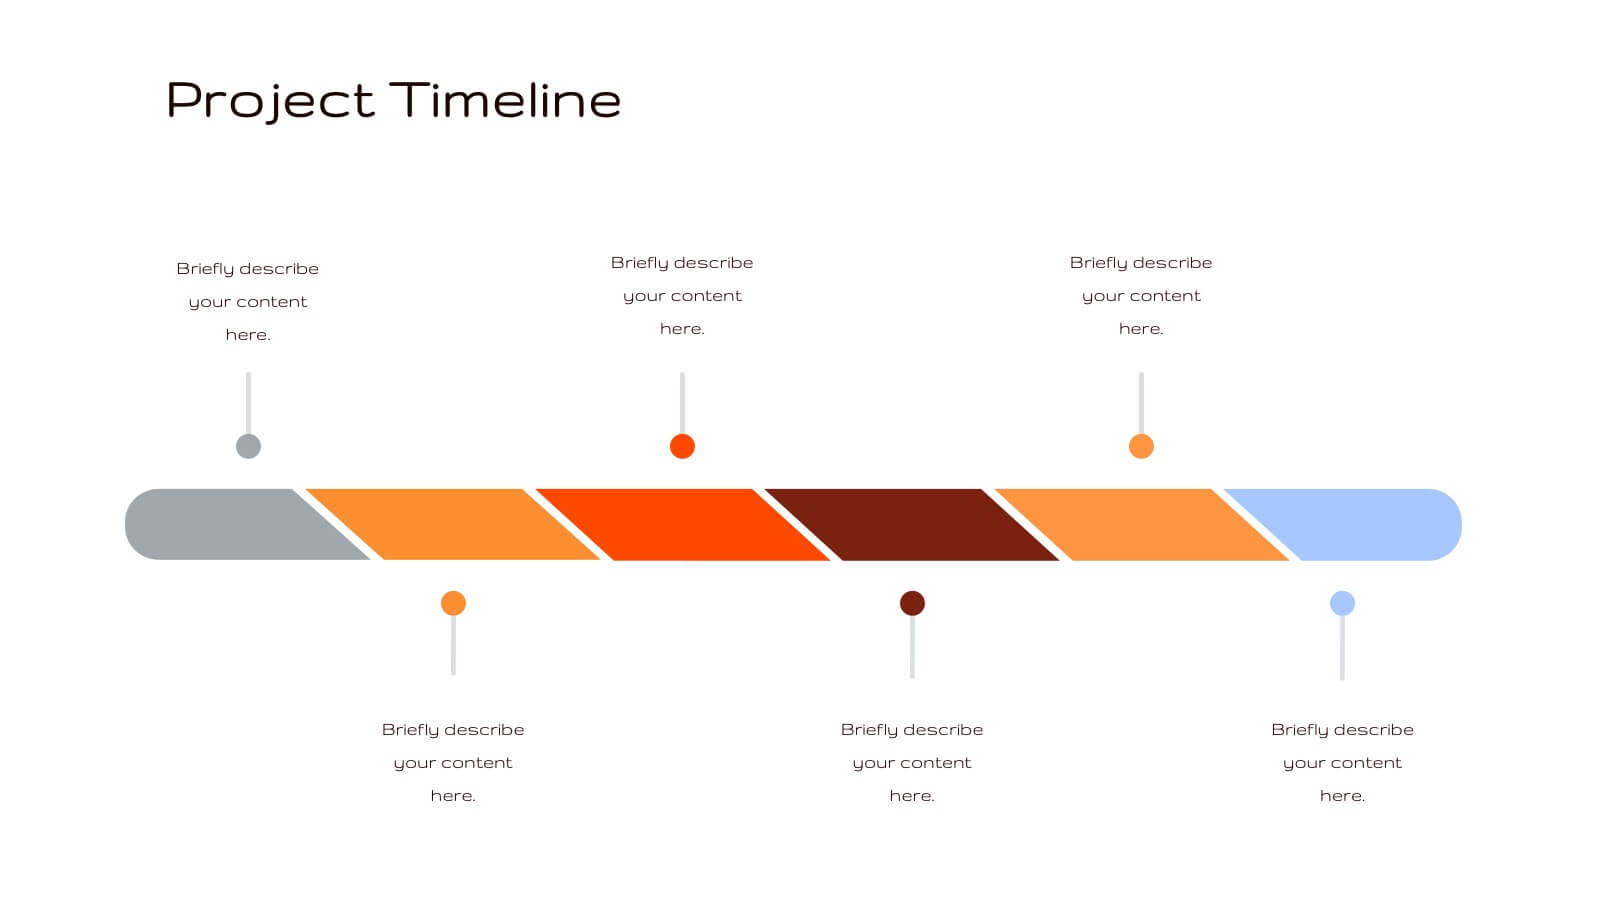
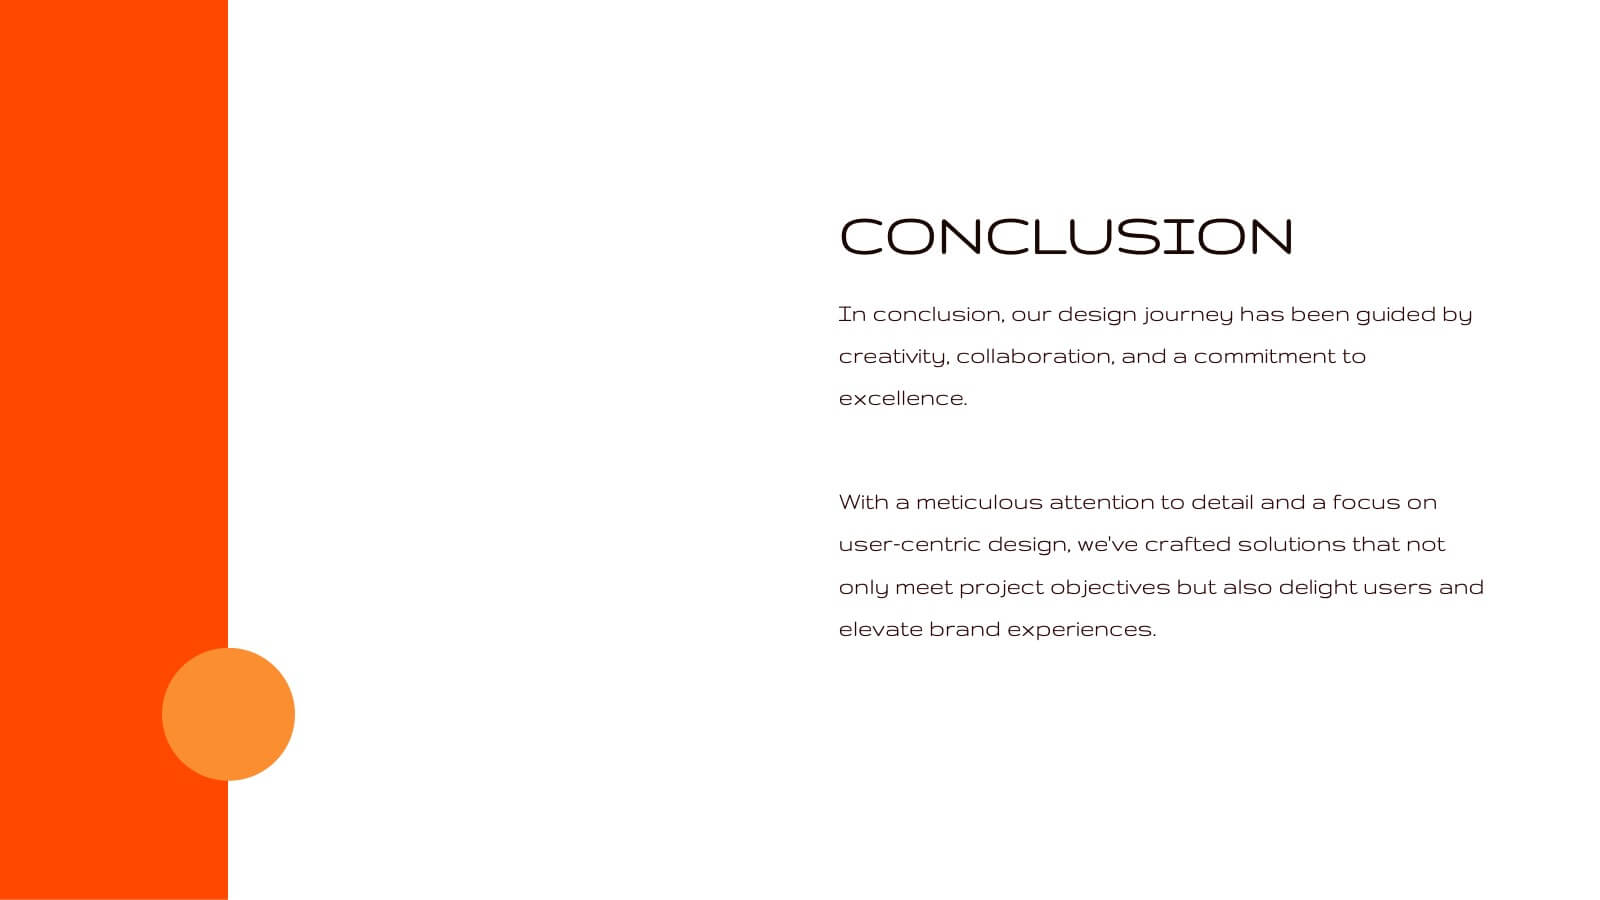
Radiance Creative Design Report Presentation
Bring your design ideas to life with this vibrant, engaging presentation template. Ideal for showcasing creative processes, concept development, and project timelines, it features a striking color palette and clean layout. This template is designed to captivate your audience and clearly communicate your design vision. Compatible with PowerPoint, Keynote, and Google Slides, it’s perfect for any platform.


5 slides
Interactive Data Analysis Report Presentation
Turn complex data connections into an engaging visual story with this sleek, modern layout. Ideal for presenting analytical findings, performance insights, or interconnected systems, it helps simplify information while keeping it visually dynamic. Fully editable and compatible with PowerPoint, Keynote, and Google Slides for easy customization and professional results.


6 slides
Meeting and Event Planning Schedule Presentation
Plan smarter and meet deadlines with the Meeting and Event Planning Schedule Presentation. This organized layout helps teams visualize phases, dates, and key activities at a glance—perfect for scheduling workshops, meetings, or launch events. Fully customizable in PowerPoint, Keynote, and Google Slides.