


Features
- 5 Unique slides
- Fully editable and easy to edit in Microsoft Powerpoint, Keynote and Google Slides
- 16:9 widescreen layout
- Clean and professional designs
- Export to JPG, PDF or send by email


Do you have any questions?
Recommend


5 slides
Tiered Strategy Framework Pyramid Presentation
Break down your plan into clear, actionable steps with this Tiered Strategy Framework Pyramid presentation. Each arrow-shaped tier helps visualize hierarchical strategies, workflows, or growth levels. Use this layout to communicate priorities, initiatives, or milestones in a sleek and modern format. Fully editable in Canva, PowerPoint, or Google Slides.


22 slides
Arachne Digital Marketing Strategy Plan Presentation
Weave a powerful digital marketing strategy with this sleek, Arachne-inspired presentation! Perfect for outlining your digital marketing plans, this template helps you highlight key strategies, analytics, and campaign goals in a structured and visually engaging way. Its modern design keeps your audience focused. Compatible with PowerPoint, Keynote, and Google Slides.


7 slides
Pillar of Success Infographic
Pillars of Success is a metaphorical term used to describe principles or key elements that are essential for achieving success in various aspects of life, whether it's in personal development, business, education, relationships, or any other domain. This infographic template unveils the essential principles that constitute the very pillars upon which triumph and accomplishment stand. Compatible with Powerpoint, Keynote, and Google Slides. The pillars represent foundational factors that contribute to success. This template symbolizes the foundation of any successful venture, emphasizing the importance of a strong start.


5 slides
Contemporary History Timeline Infographics
Immerse your audience in a visual journey through time with the contemporary history timeline infographics template. Rendered in a sophisticated blue and white palette, this resource is designed to add a creative twist to historical chronology, making it an educational yet captivating. History educators, academic students, and researchers will find this vertical-style infographic ideal for distilling complex timelines into engaging visual narratives. Compatible with Powerpoint,Keynote, and Google Slides. This template is equipped with sleek graphics, thematic icons, and dedicated image placeholders specifically tailored for historical content.


23 slides
Pomona Business Plan Presentation
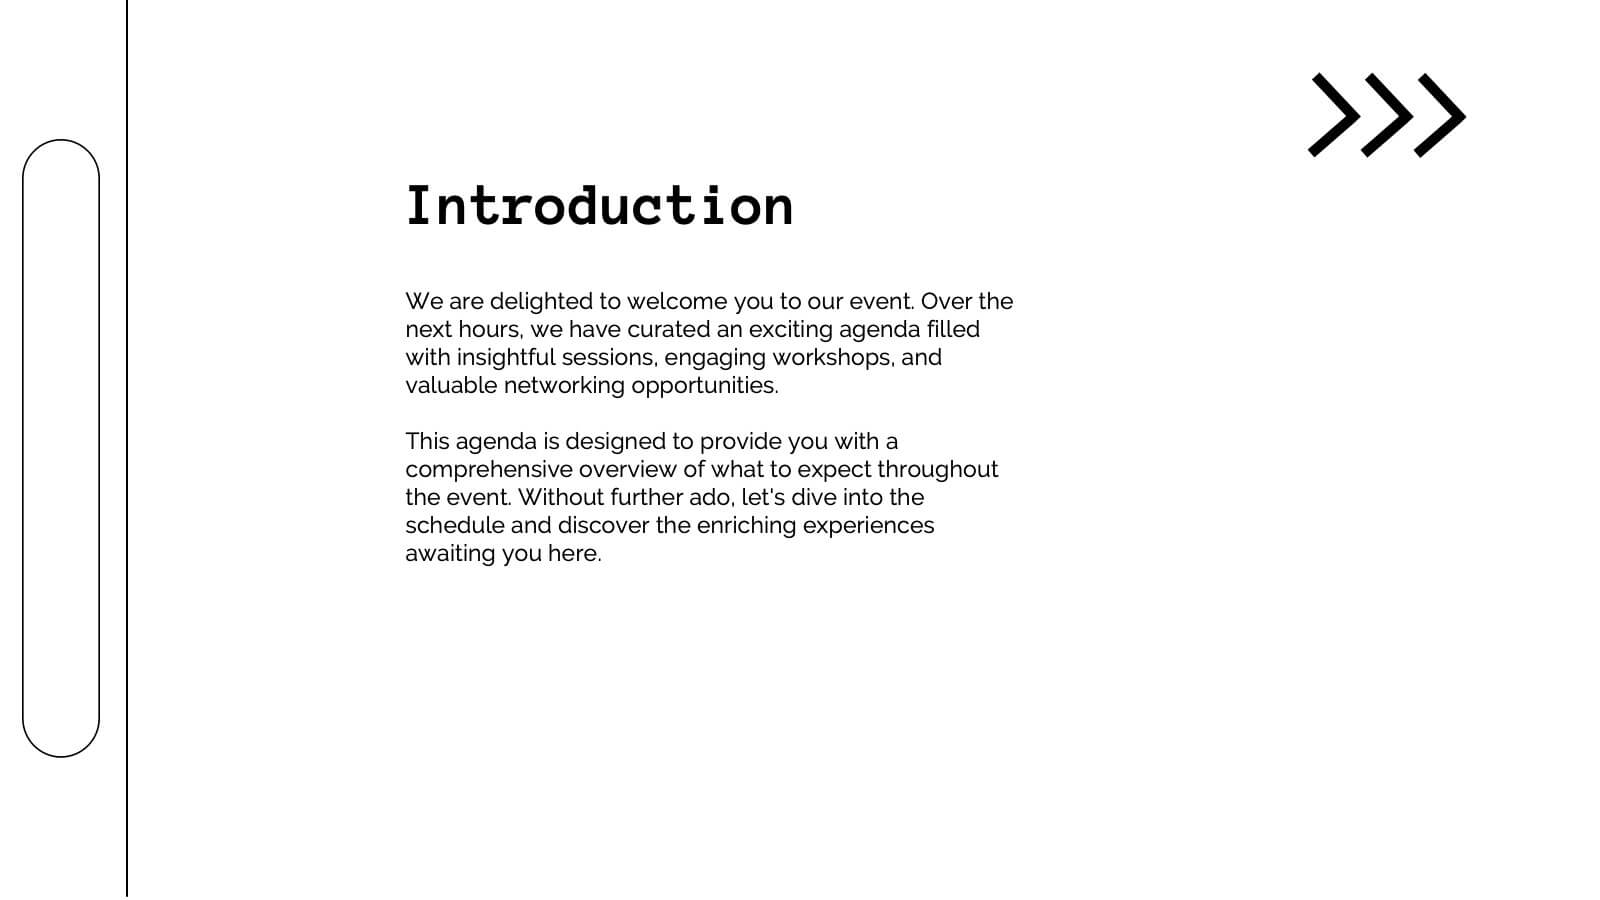
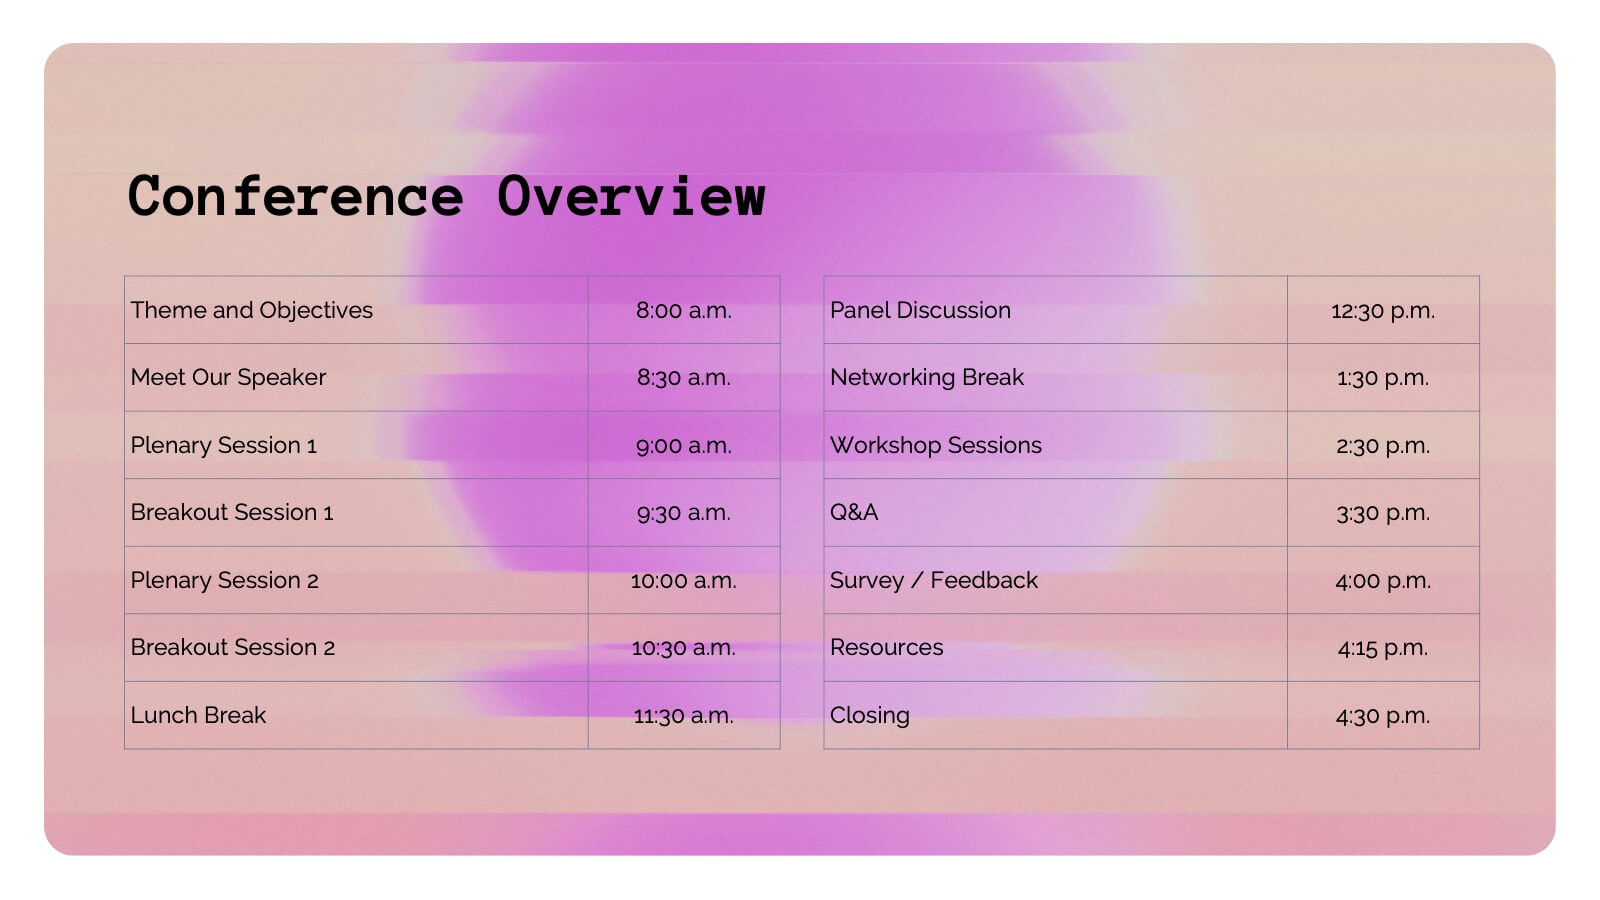
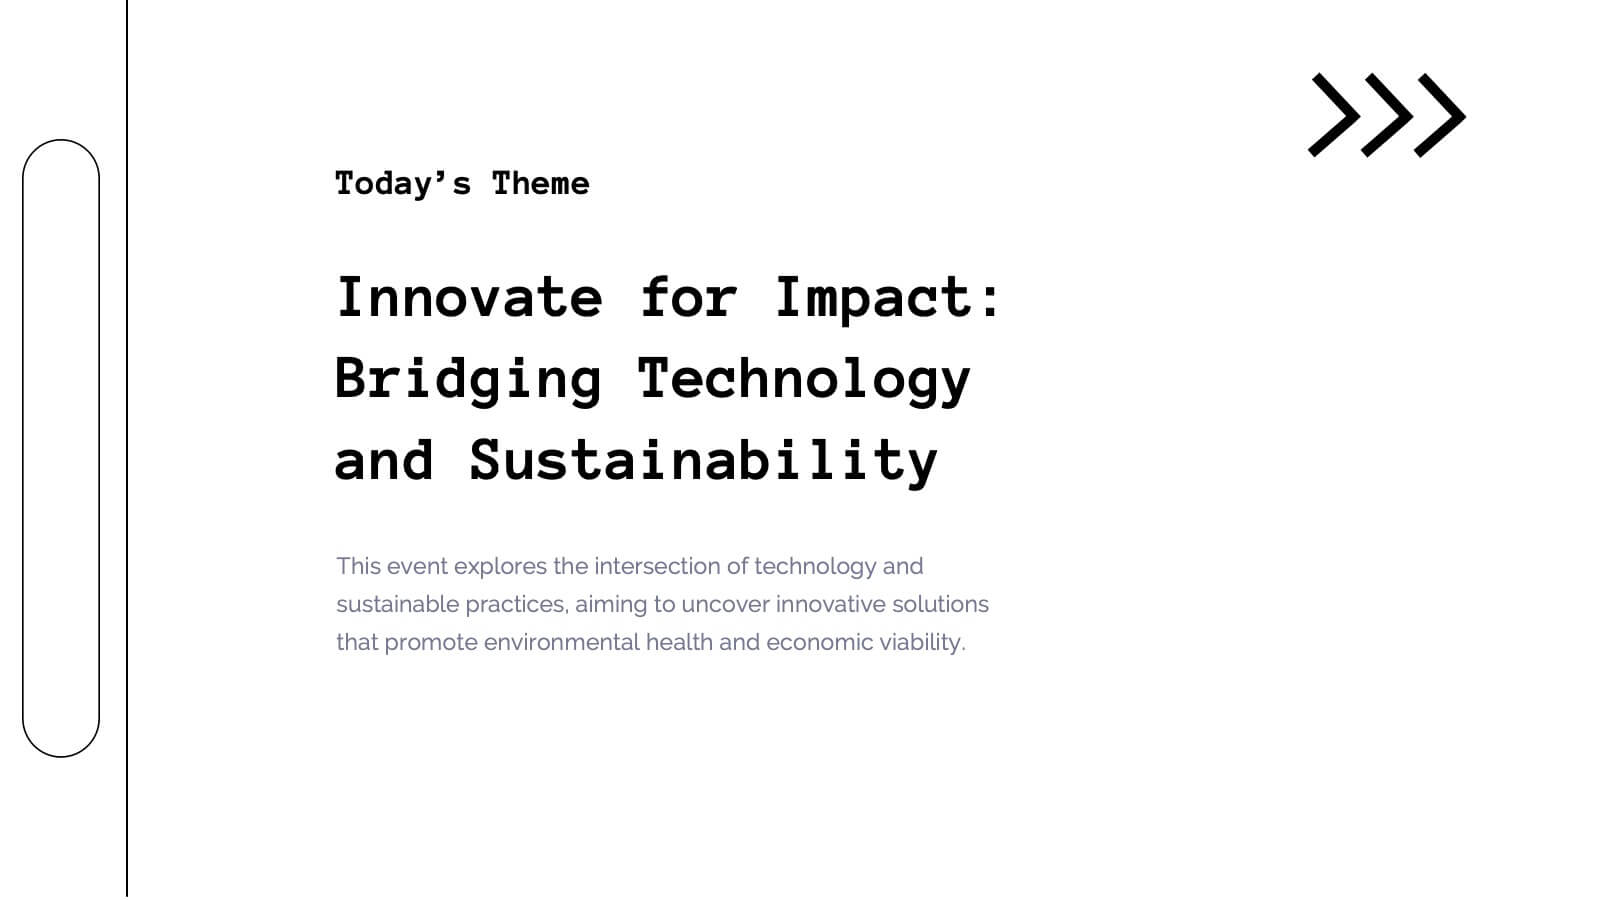
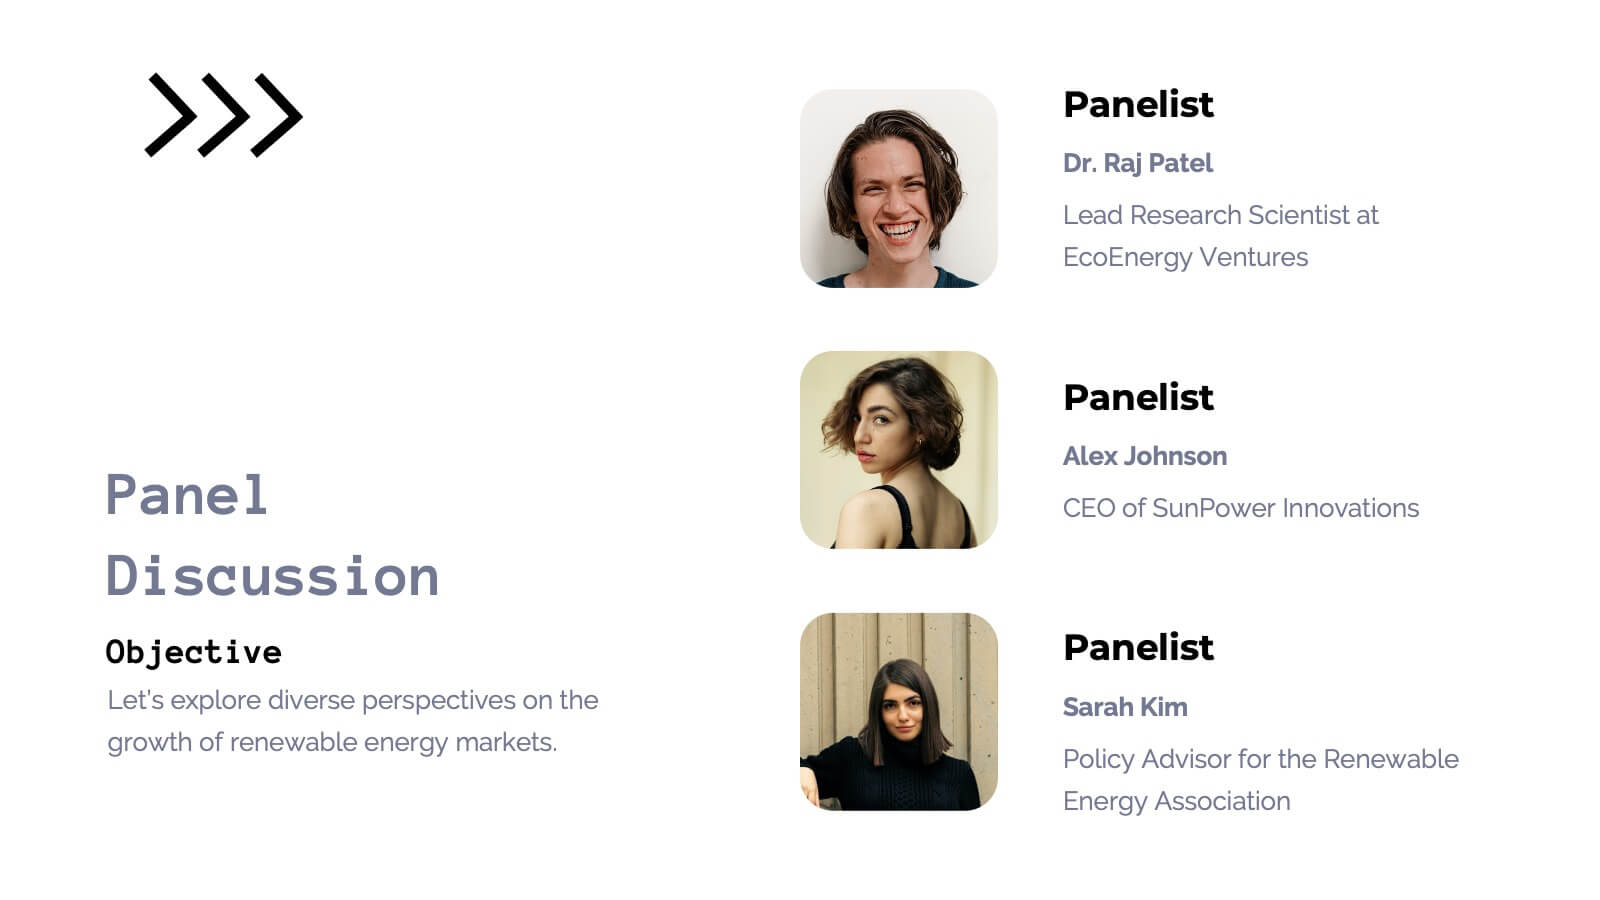
This vibrant and adaptable event agenda template is perfect for organizing your business conference or corporate event. It includes customizable sections for session details, speaker information, and key activities like networking breaks, workshops, and panel discussions. Compatible with PowerPoint, Keynote, and Google Slides, it ensures a smooth and engaging event presentation experience!


4 slides
3-Step Supply Chain and Logistics Planning Presentation
Bring your workflow to life with a clean three-stage visual that makes your process feel fast, simple, and smart. This slide helps explain planning steps, logistics timelines, and supply chain actions in a way that’s easy for any audience to follow. Fully compatible with PowerPoint, Keynote, and Google Slides.


5 slides
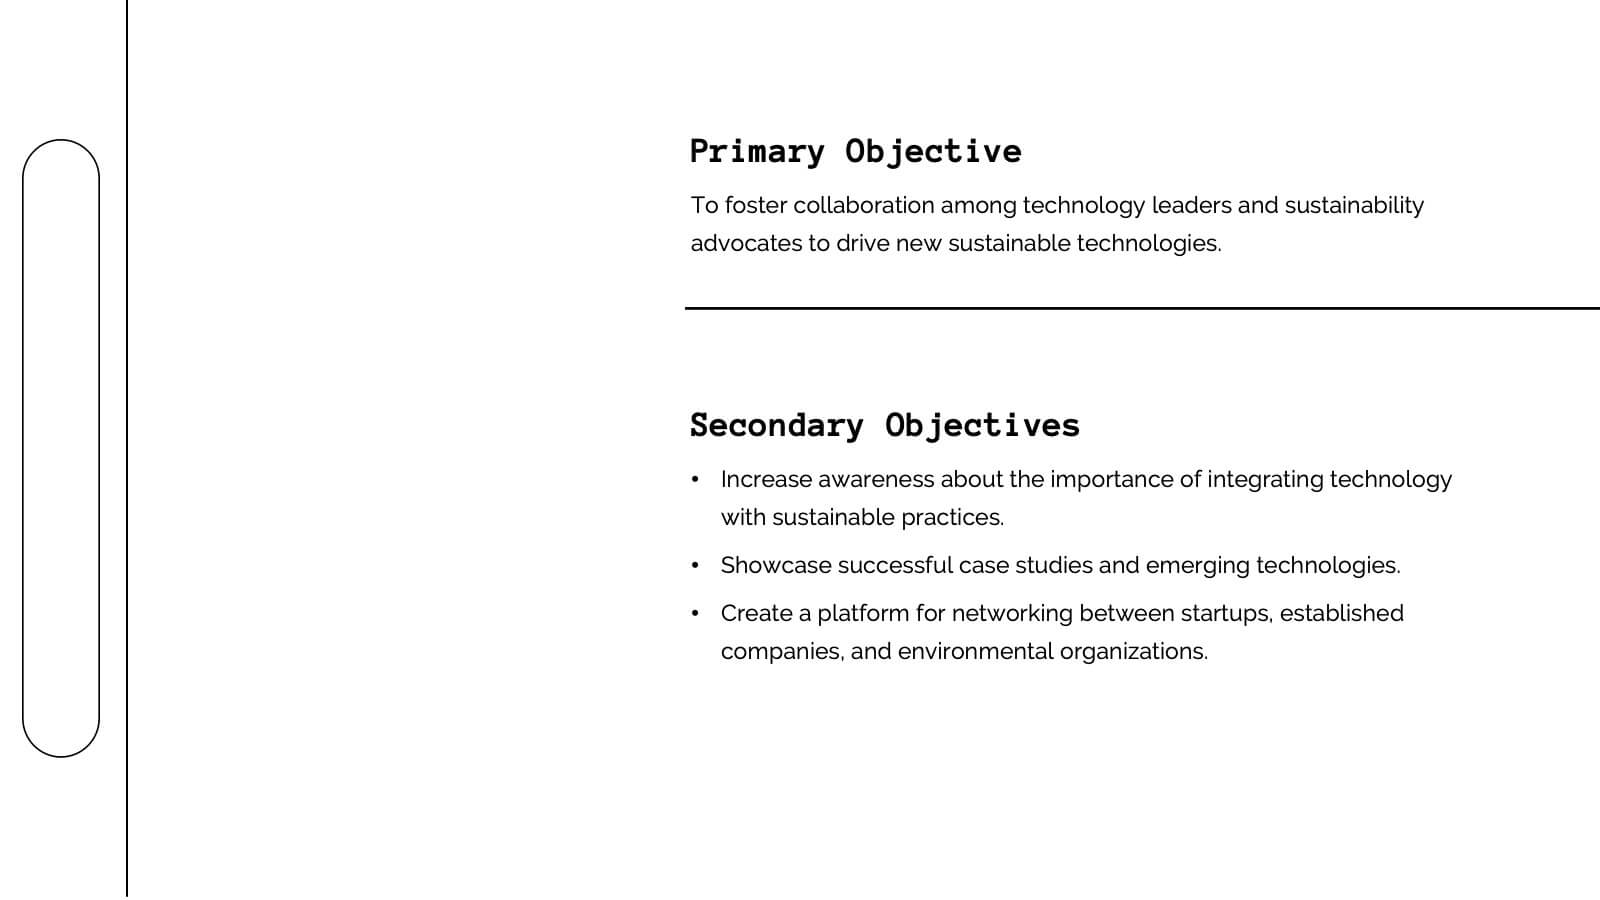
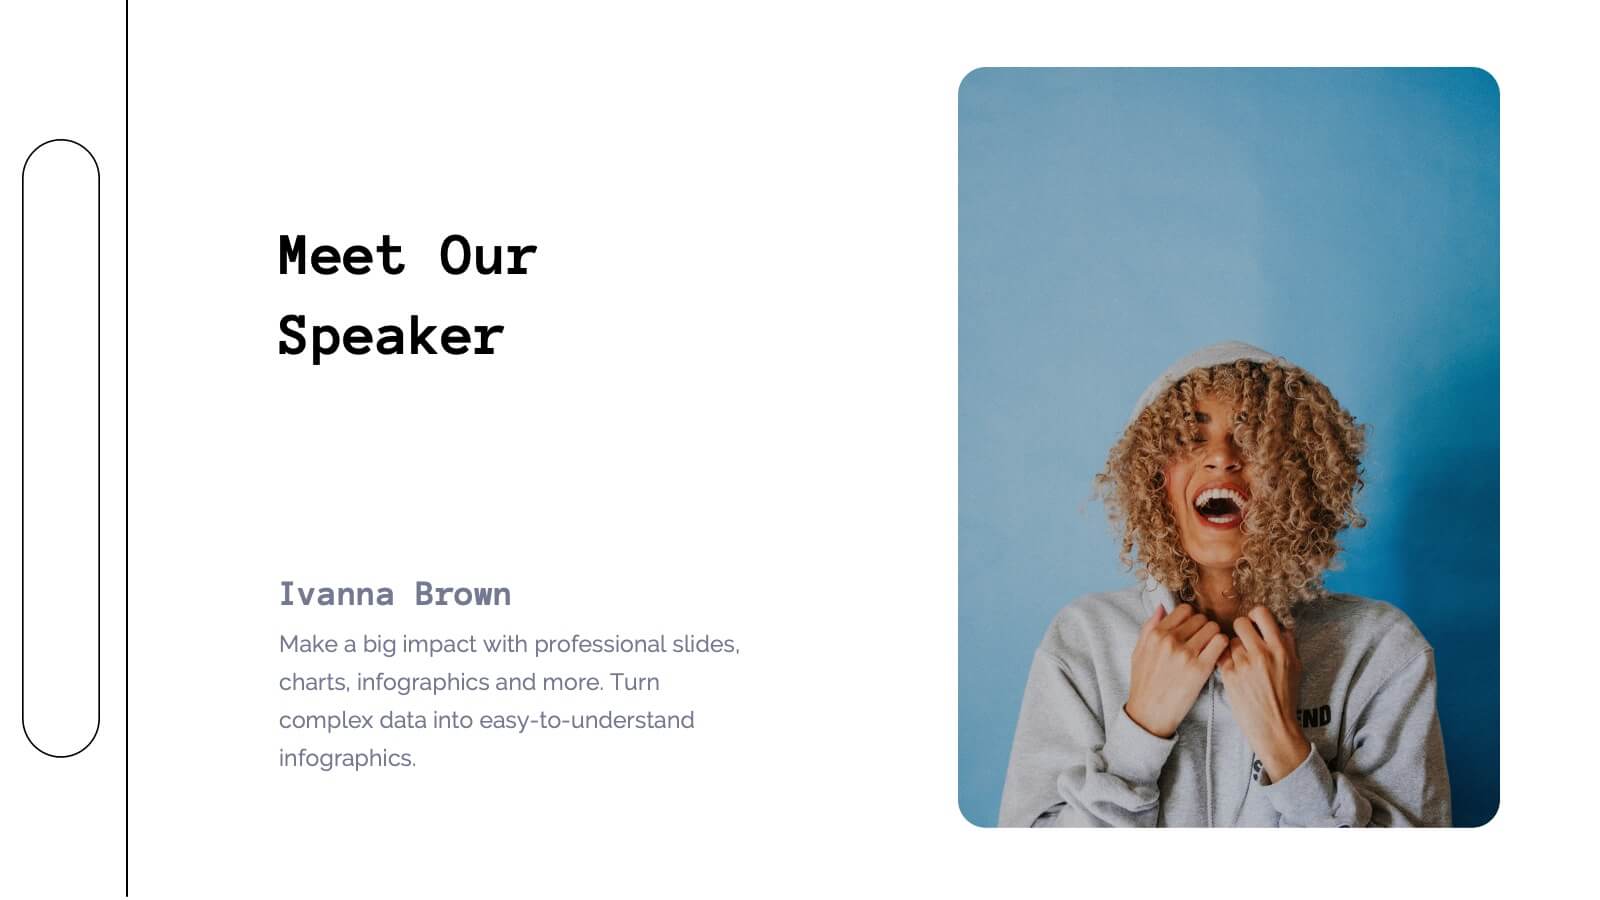
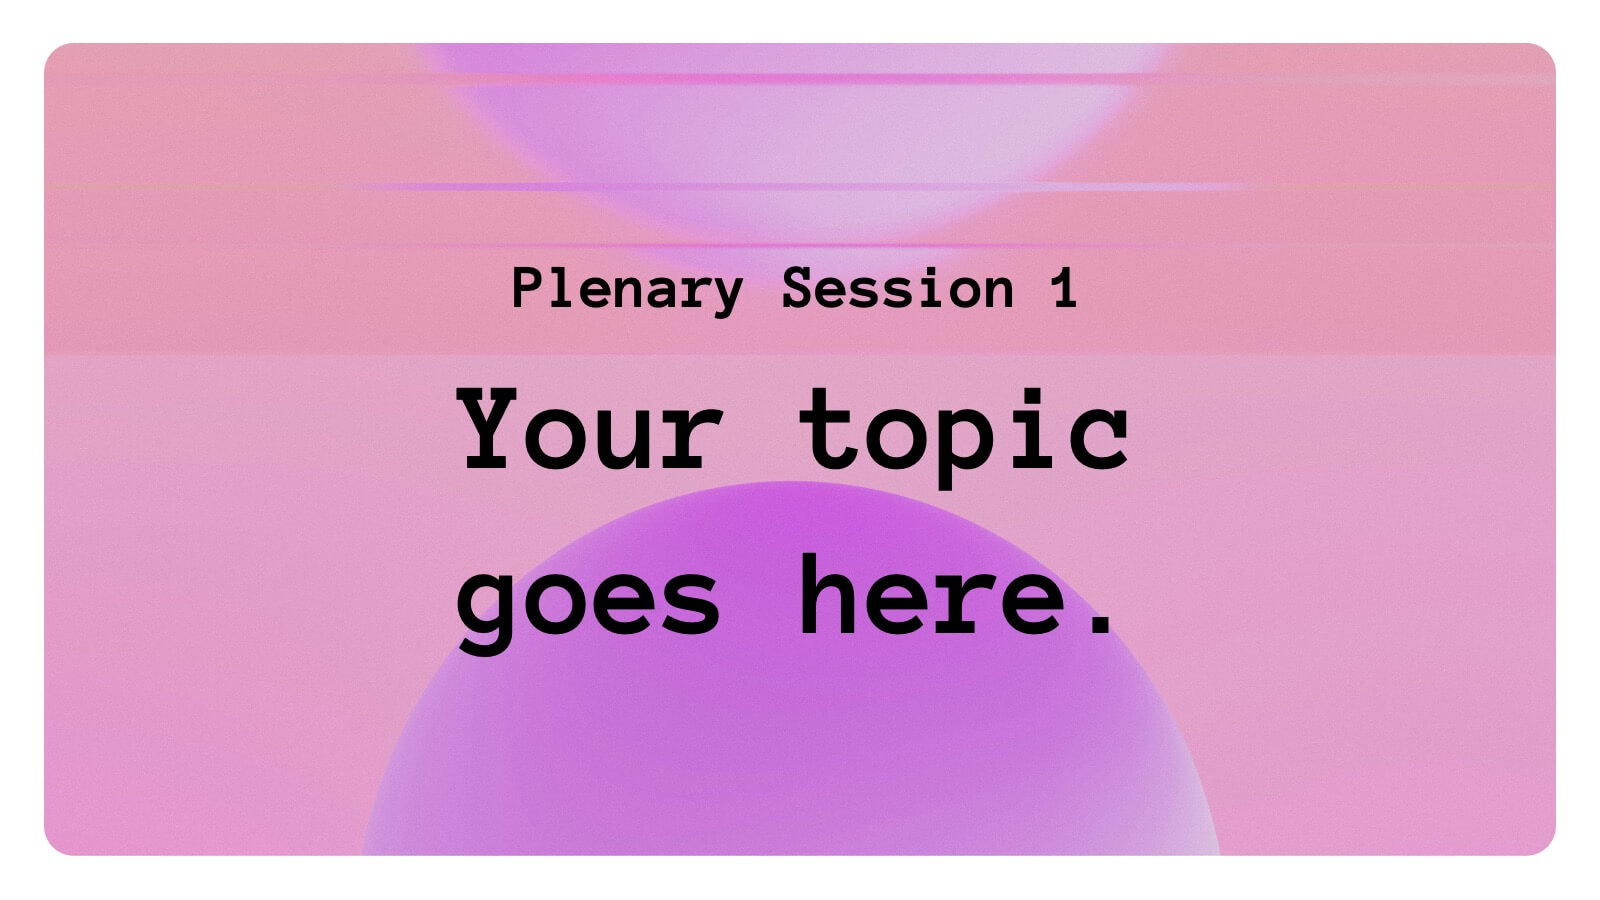
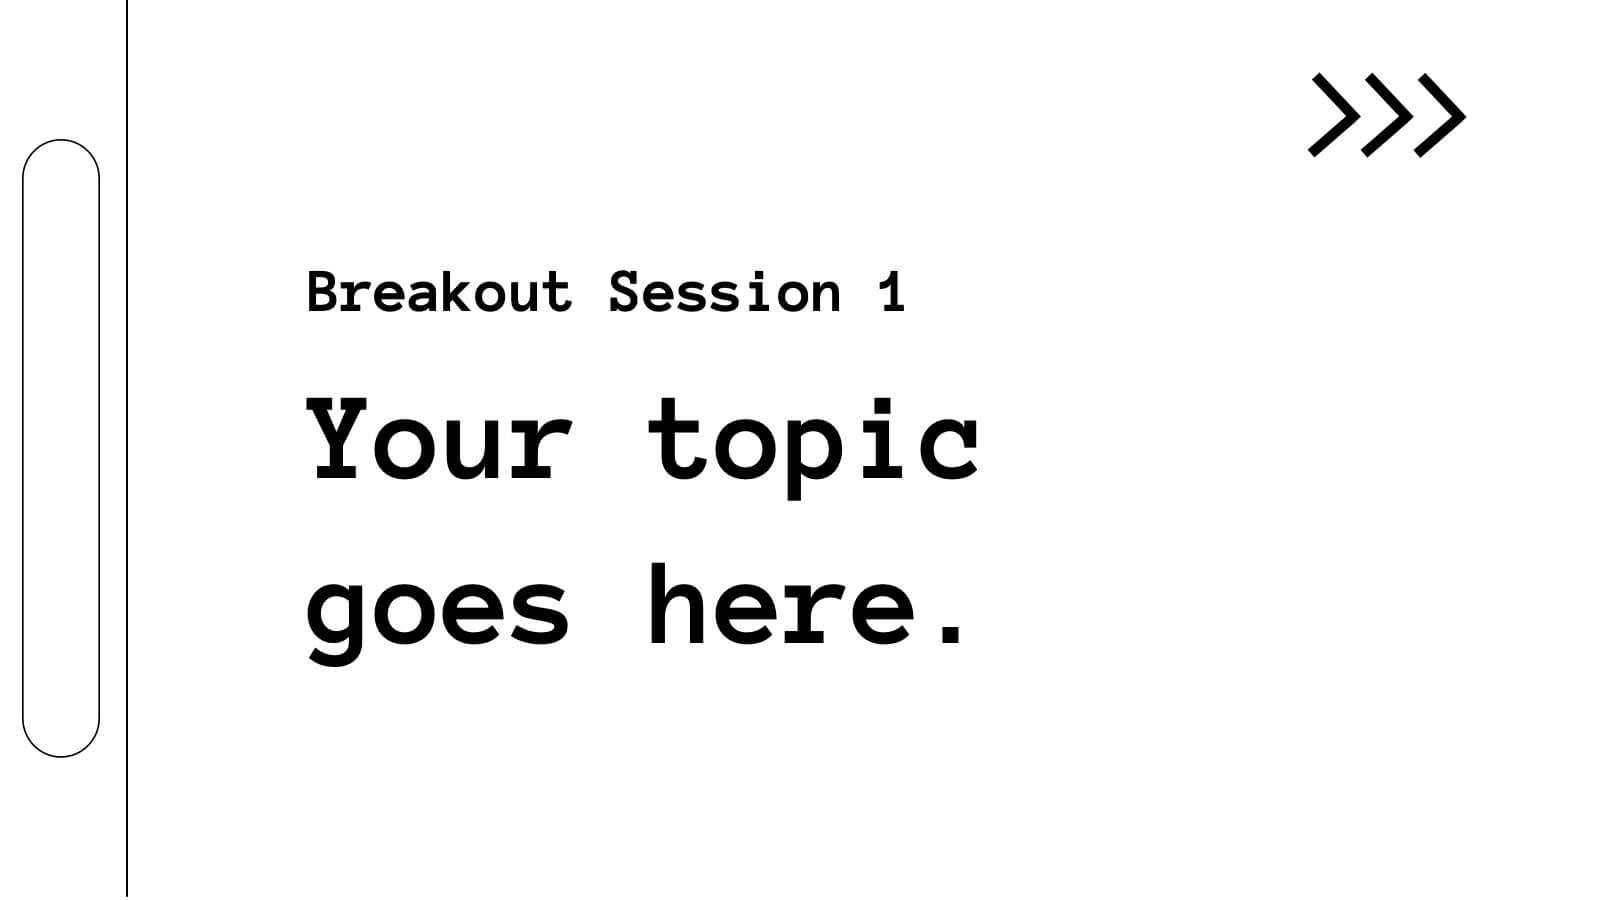
Eco-Friendly Business Strategy Slides Presentation
Inspire sustainable growth with a clean, modern presentation built for eco-conscious businesses. Perfect for outlining green initiatives, corporate responsibility goals, or environmental strategies, it helps you communicate ideas with clarity and impact. Fully editable and compatible with PowerPoint, Keynote, and Google Slides for a seamless, professional presentation experience.


6 slides
Cyber Security Architect Infographic
Cybersecurity refers to the practice of protecting computer systems, networks, and data from unauthorized access, use, disclosure, disruption, modification, or destruction. This infographic template provides an overview of the role and responsibilities of a cyber security architect. This template is designed to showcase the key skills, expertise, and activities involved in the field of cyber security architecture. The infographic features a modern and professional design that immediately grabs attention. The infographic includes practical tips and best practices for individuals interested in pursuing a career as a cyber security architect.


6 slides
Best Solution Proposal Presentation
Present your ideas with clarity and confidence using this modern, structured layout that highlights problems, opportunities, and proposed solutions step by step. Ideal for showcasing strategies or business improvements, it keeps information organized and persuasive. Fully compatible with PowerPoint, Keynote, and Google Slides for effortless customization and presentation.


5 slides
Corporate Strategic Planning Presentation
Create a winning strategy with this corporate strategic planning template. Designed for business leaders, it helps structure goals, initiatives, and key performance areas in a clear, visual format. Ideal for strategic decision-making and long-term planning. Fully customizable and compatible with PowerPoint, Keynote, and Google Slides for seamless editing and presentation.


5 slides
Investor Pitch Slide Deck Presentation
Captivate investors from the first slide with a clean, modern design that showcases your business idea, traction, and vision with clarity. This presentation helps you structure key points effectively for funding discussions. Fully customizable and compatible with PowerPoint, Keynote, and Google Slides for a seamless pitching experience.


20 slides
Unity Sales Proposal Presentation
Boost your sales strategy with this comprehensive sales proposal template! Perfect for outlining objectives, processes, and customer value propositions. Ideal for sales teams aiming to close deals and impress clients. Compatible with PowerPoint, Keynote, and Google Slides, this template ensures your sales presentations are clear, persuasive, and professional. Drive your sales success today!


5 slides
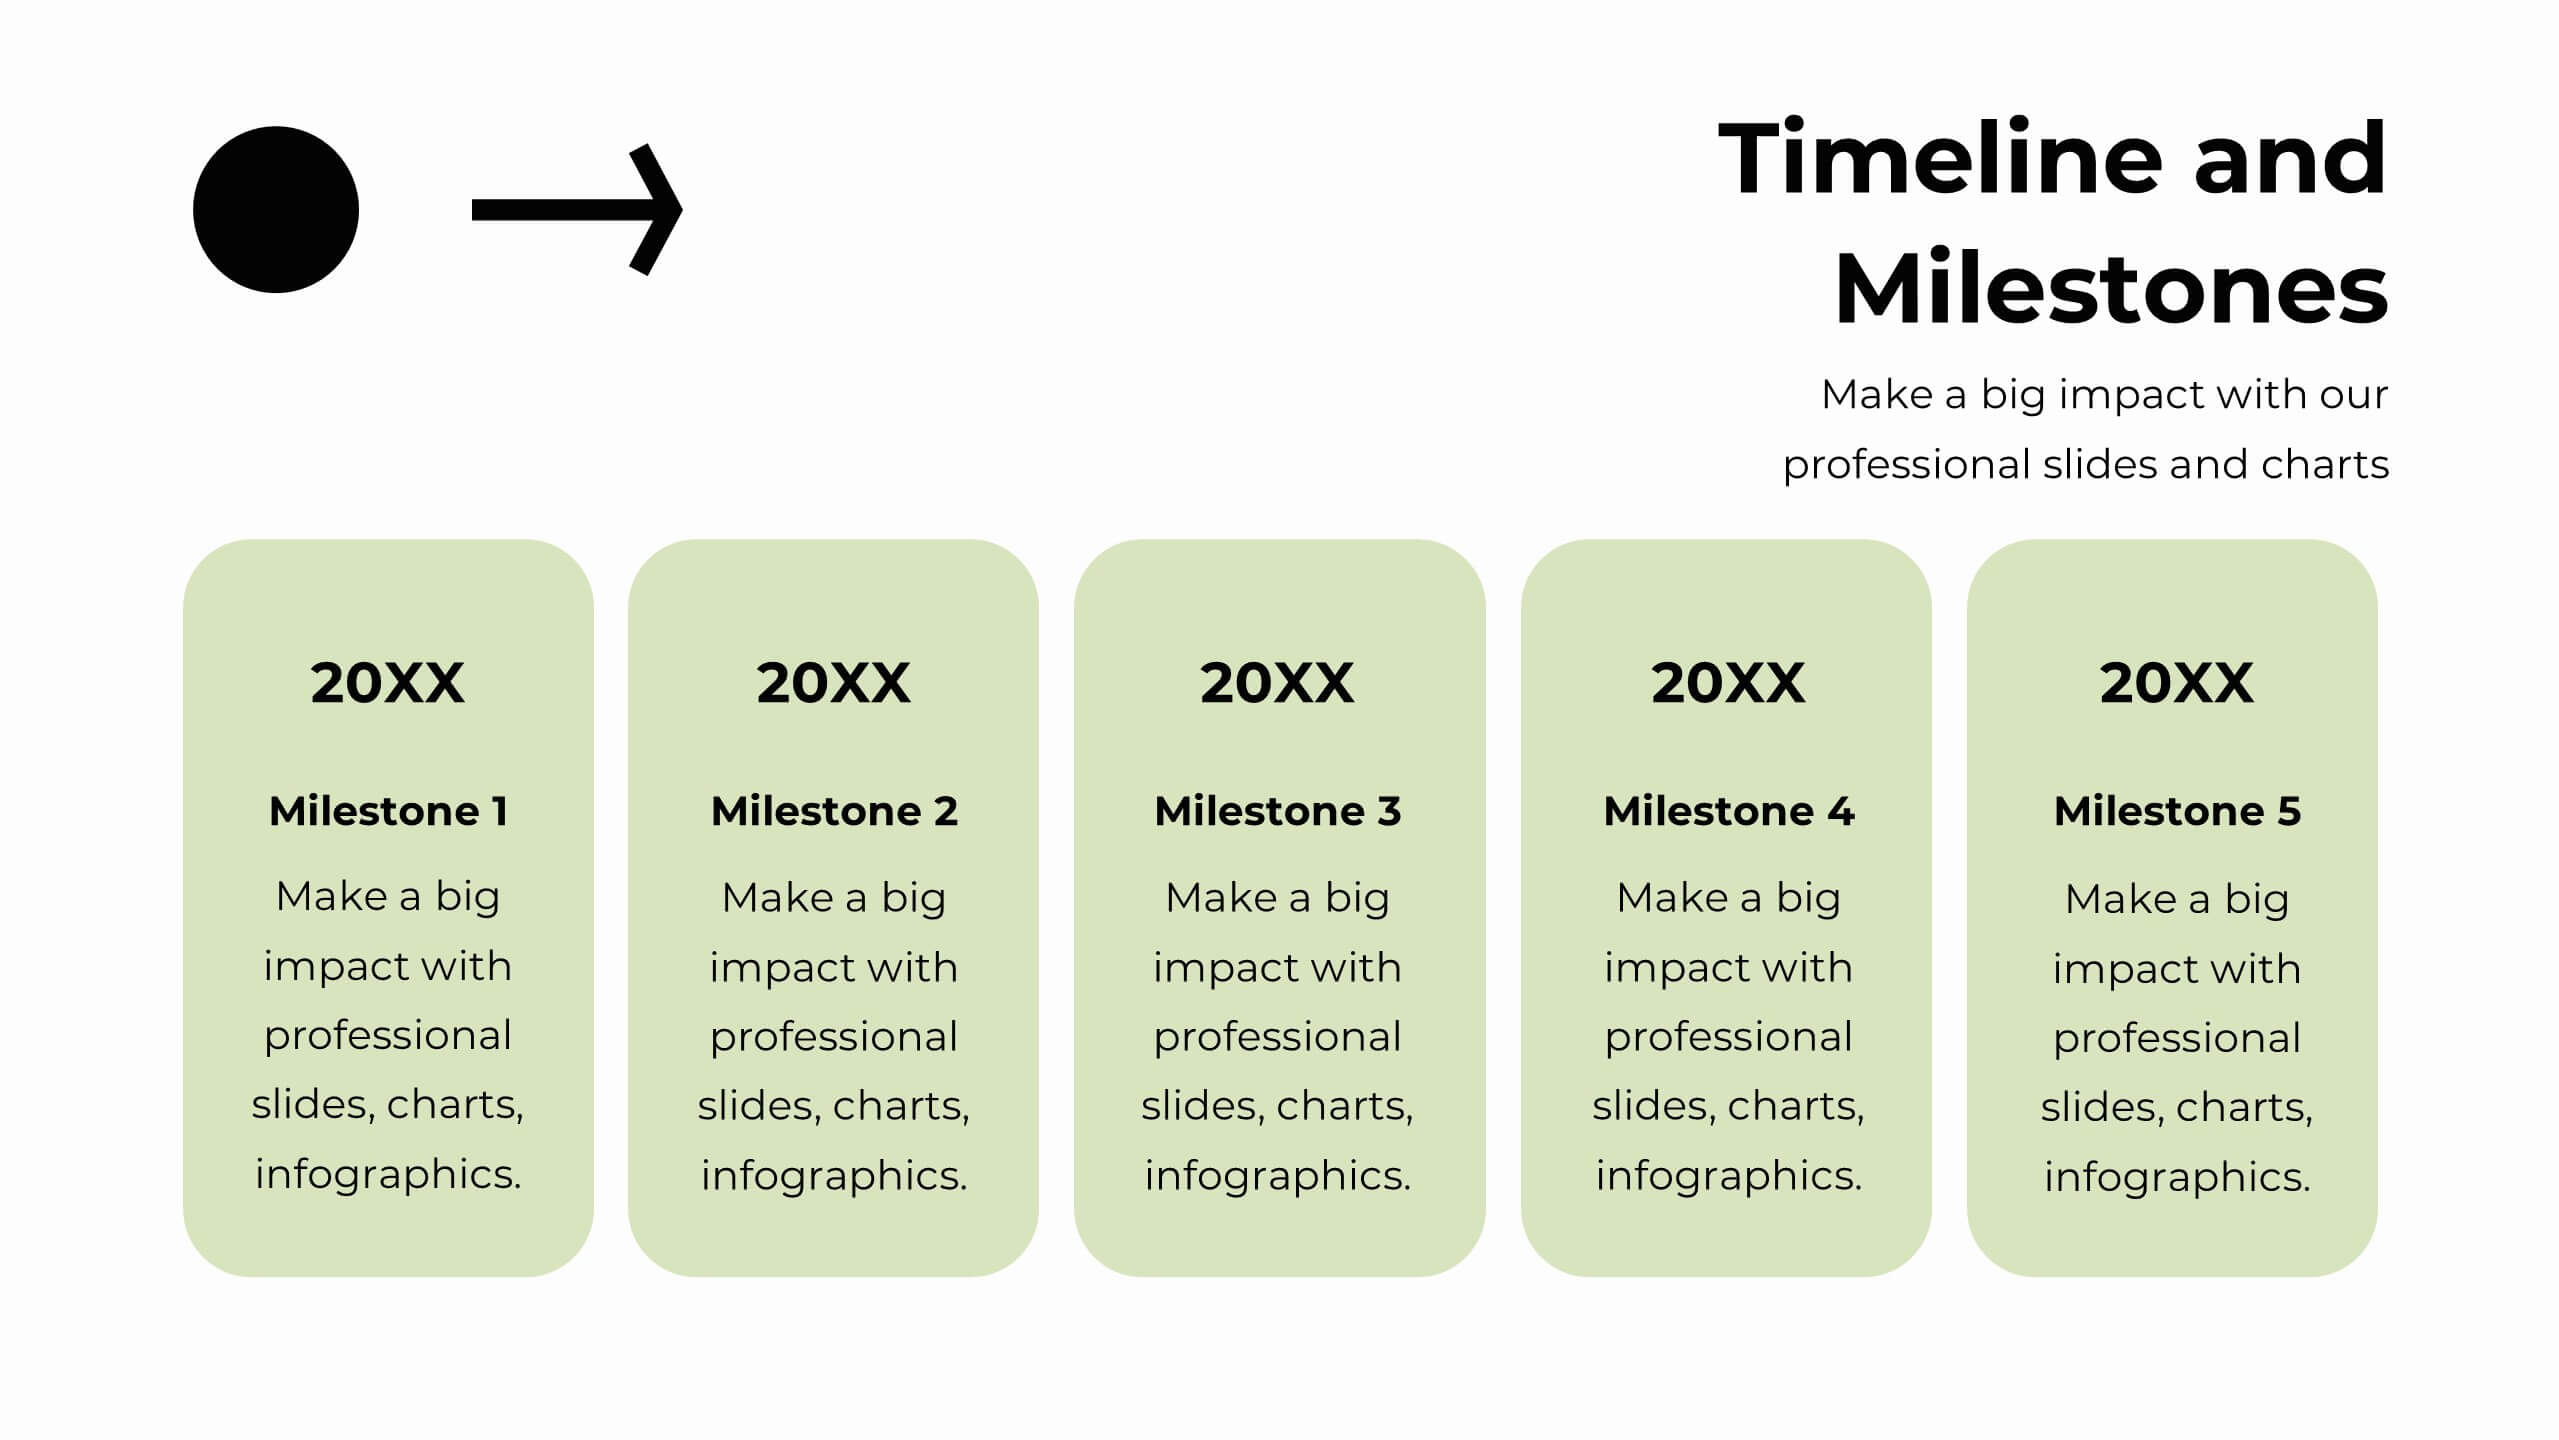
Milestones Timeline Presentation
The "Milestones Timeline Presentation" template is designed to illustrate the chronological development of a project or event. It's an effective visual tool that aligns milestones along a straightforward horizontal pathway, enhancing clarity and focus on important dates and goals. Each milestone is marked with distinct icons and titles, making it easy to convey progress and upcoming objectives. This template is particularly useful for project managers, team leaders, and educators who need to communicate key phases and achievements in a temporal context. It serves as an invaluable asset for meetings, reports, or educational materials, ensuring that each milestone is clearly highlighted and easily understood.


6 slides
Employee Feedback Survey Results Presentation
Showcase Employee Feedback Survey Results with a data-driven and professional layout designed for clear visualization and analysis. This PowerPoint, Keynote, and Google Slides-compatible template features stacked bar charts for easy trend comparison, helping you present workplace insights effectively. Fully customizable with editable text, colors, and labels, this template ensures a seamless and engaging presentation of employee feedback metrics.
23 slides
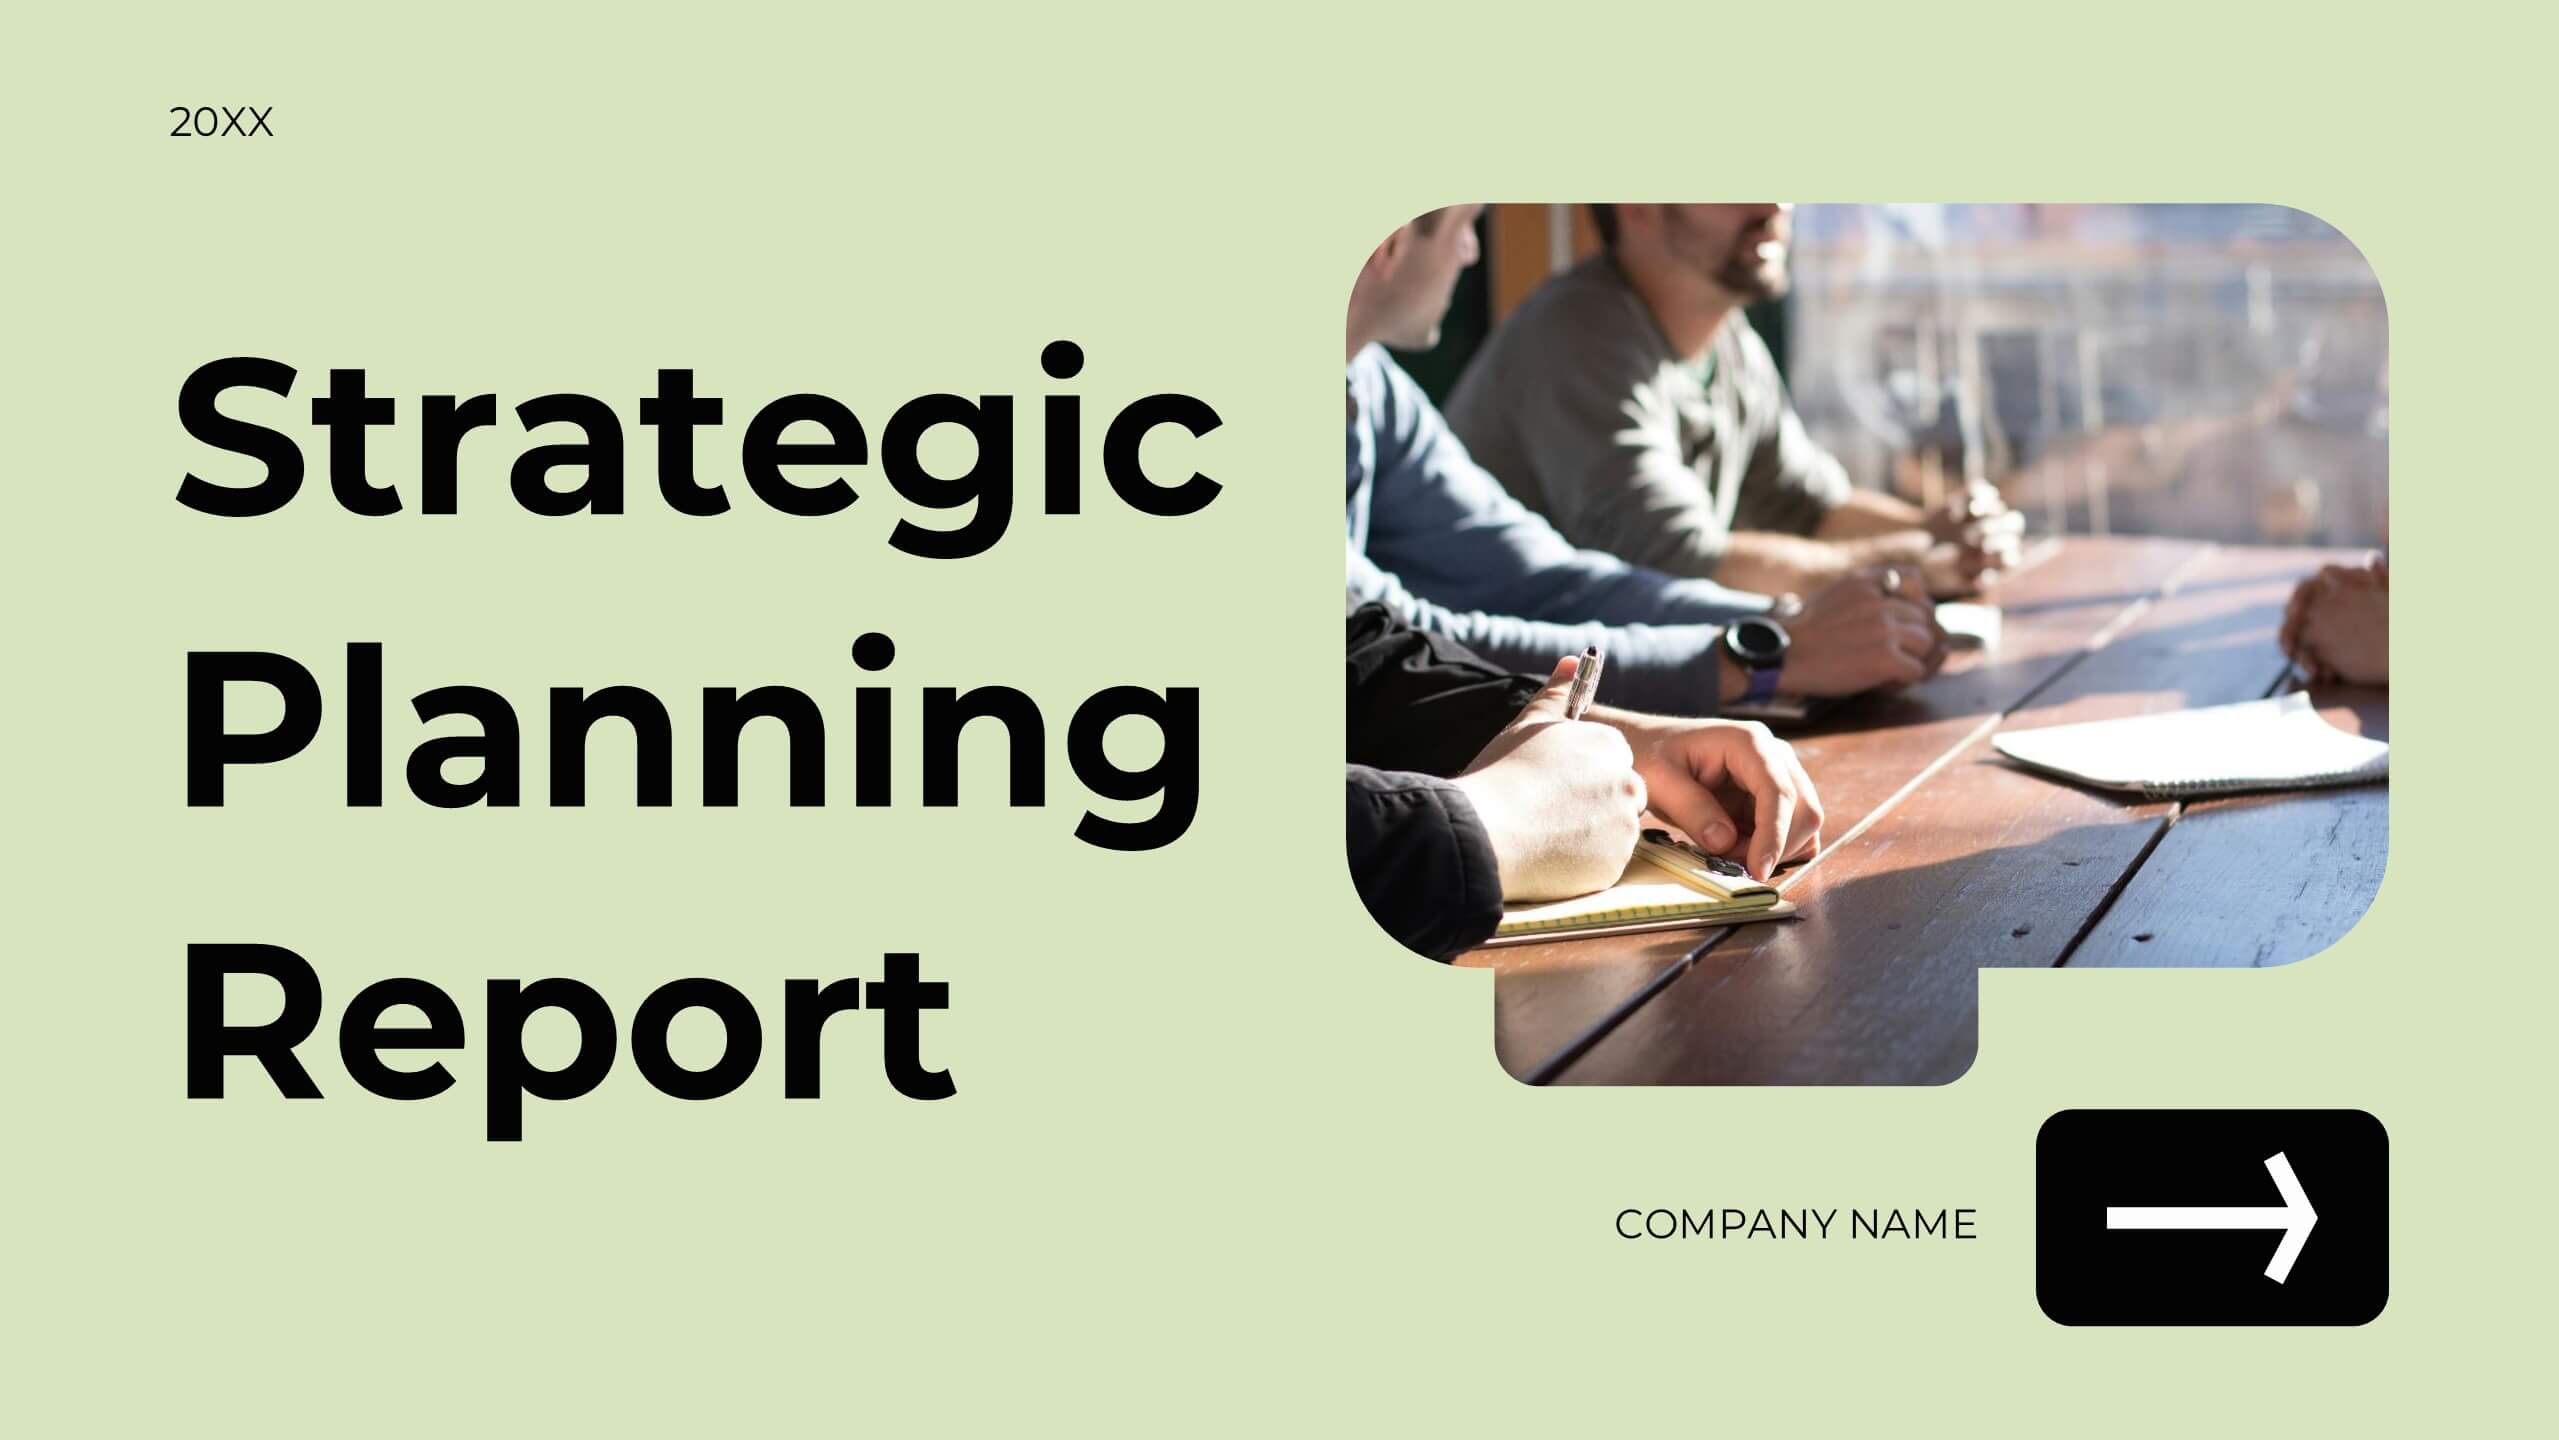
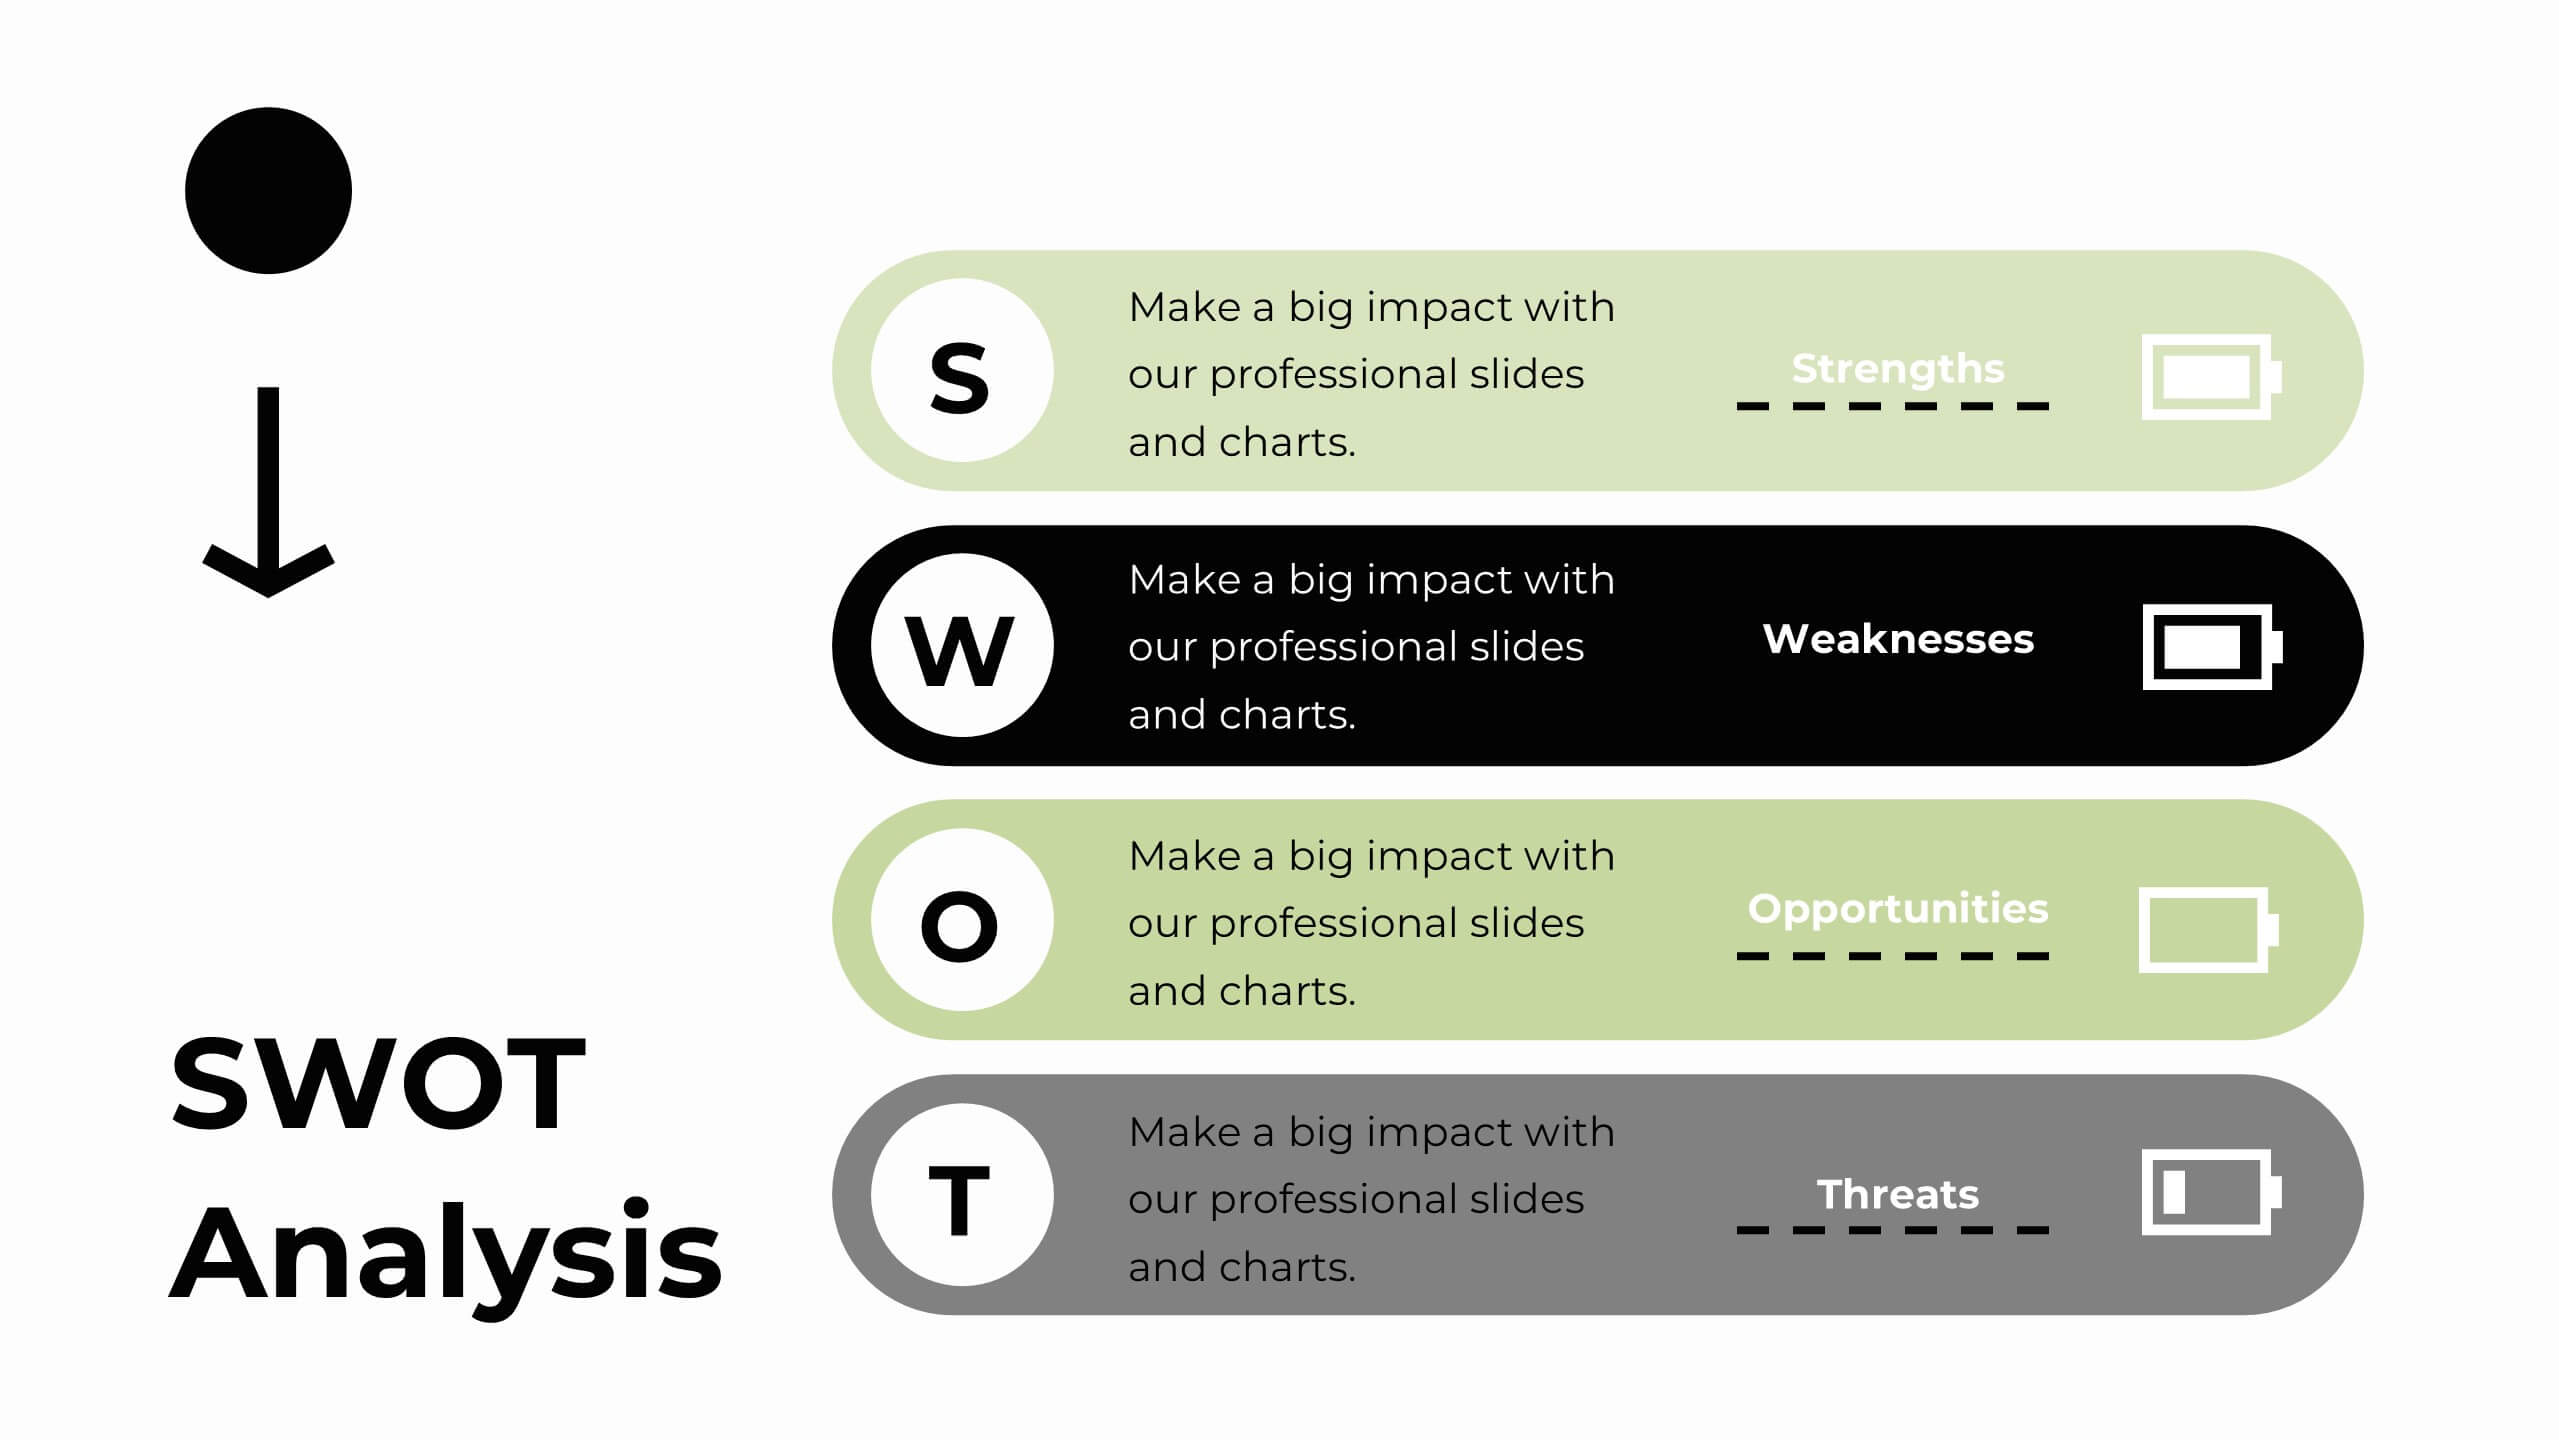
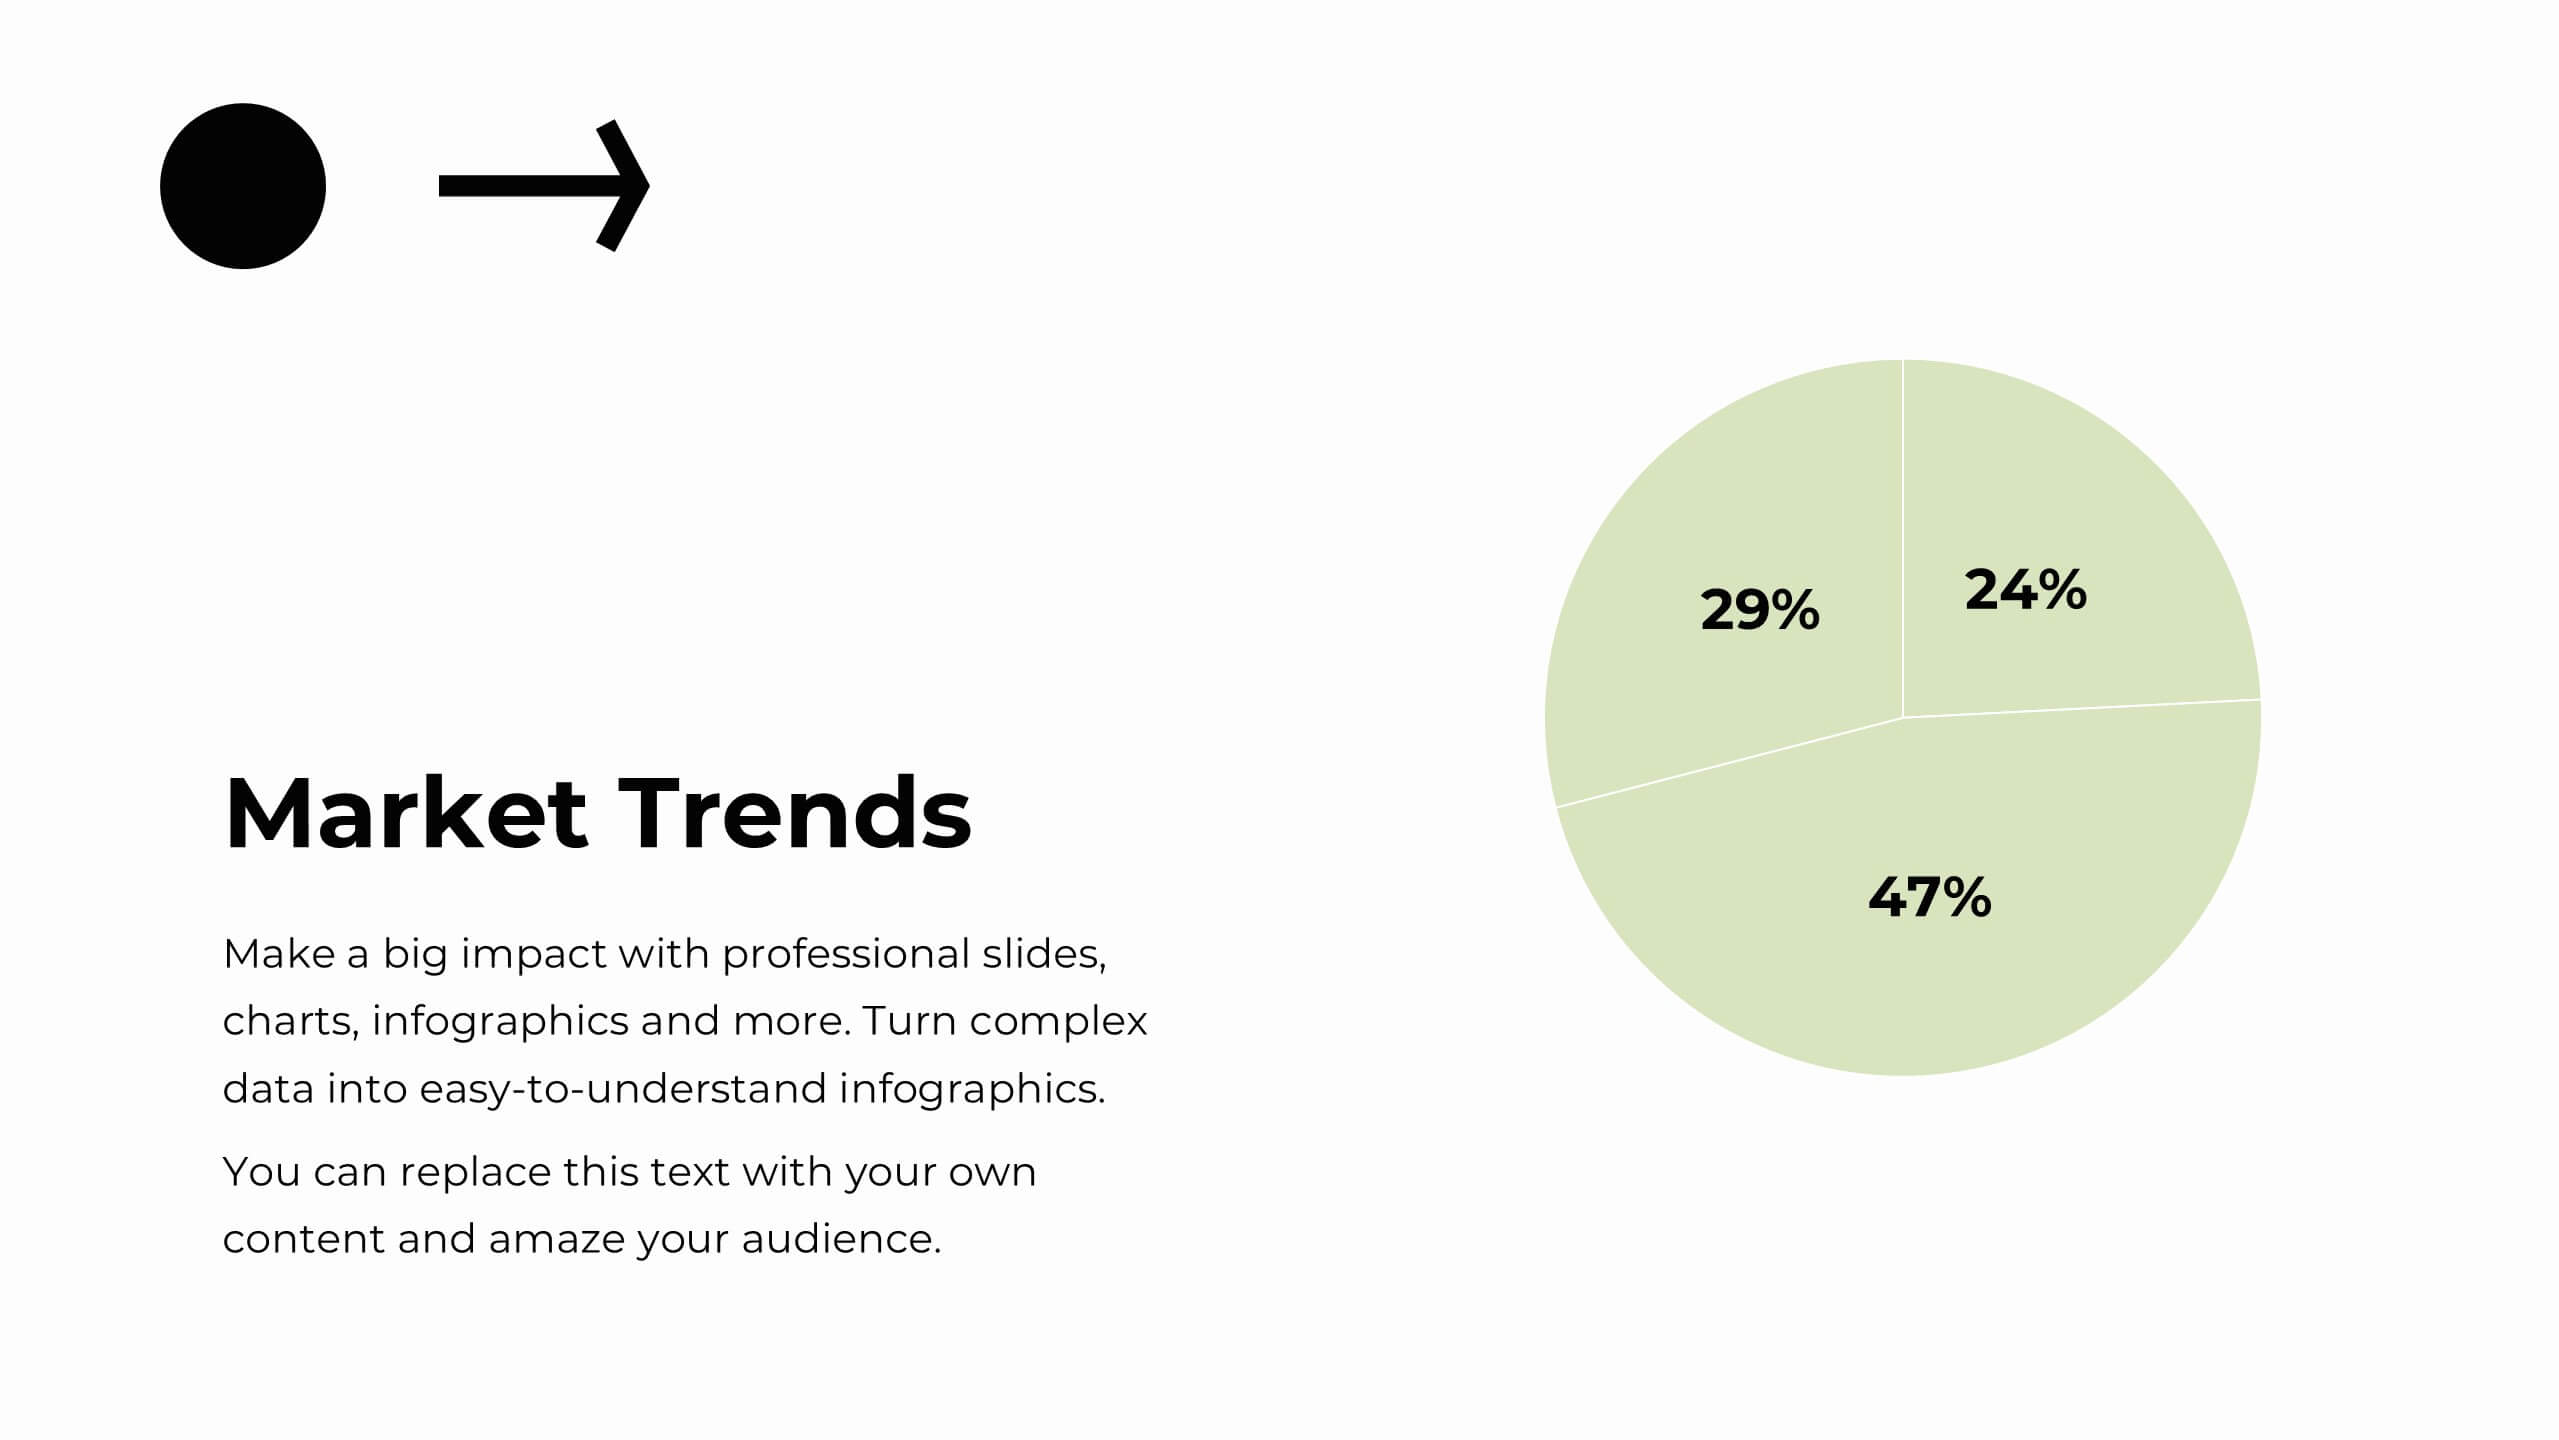
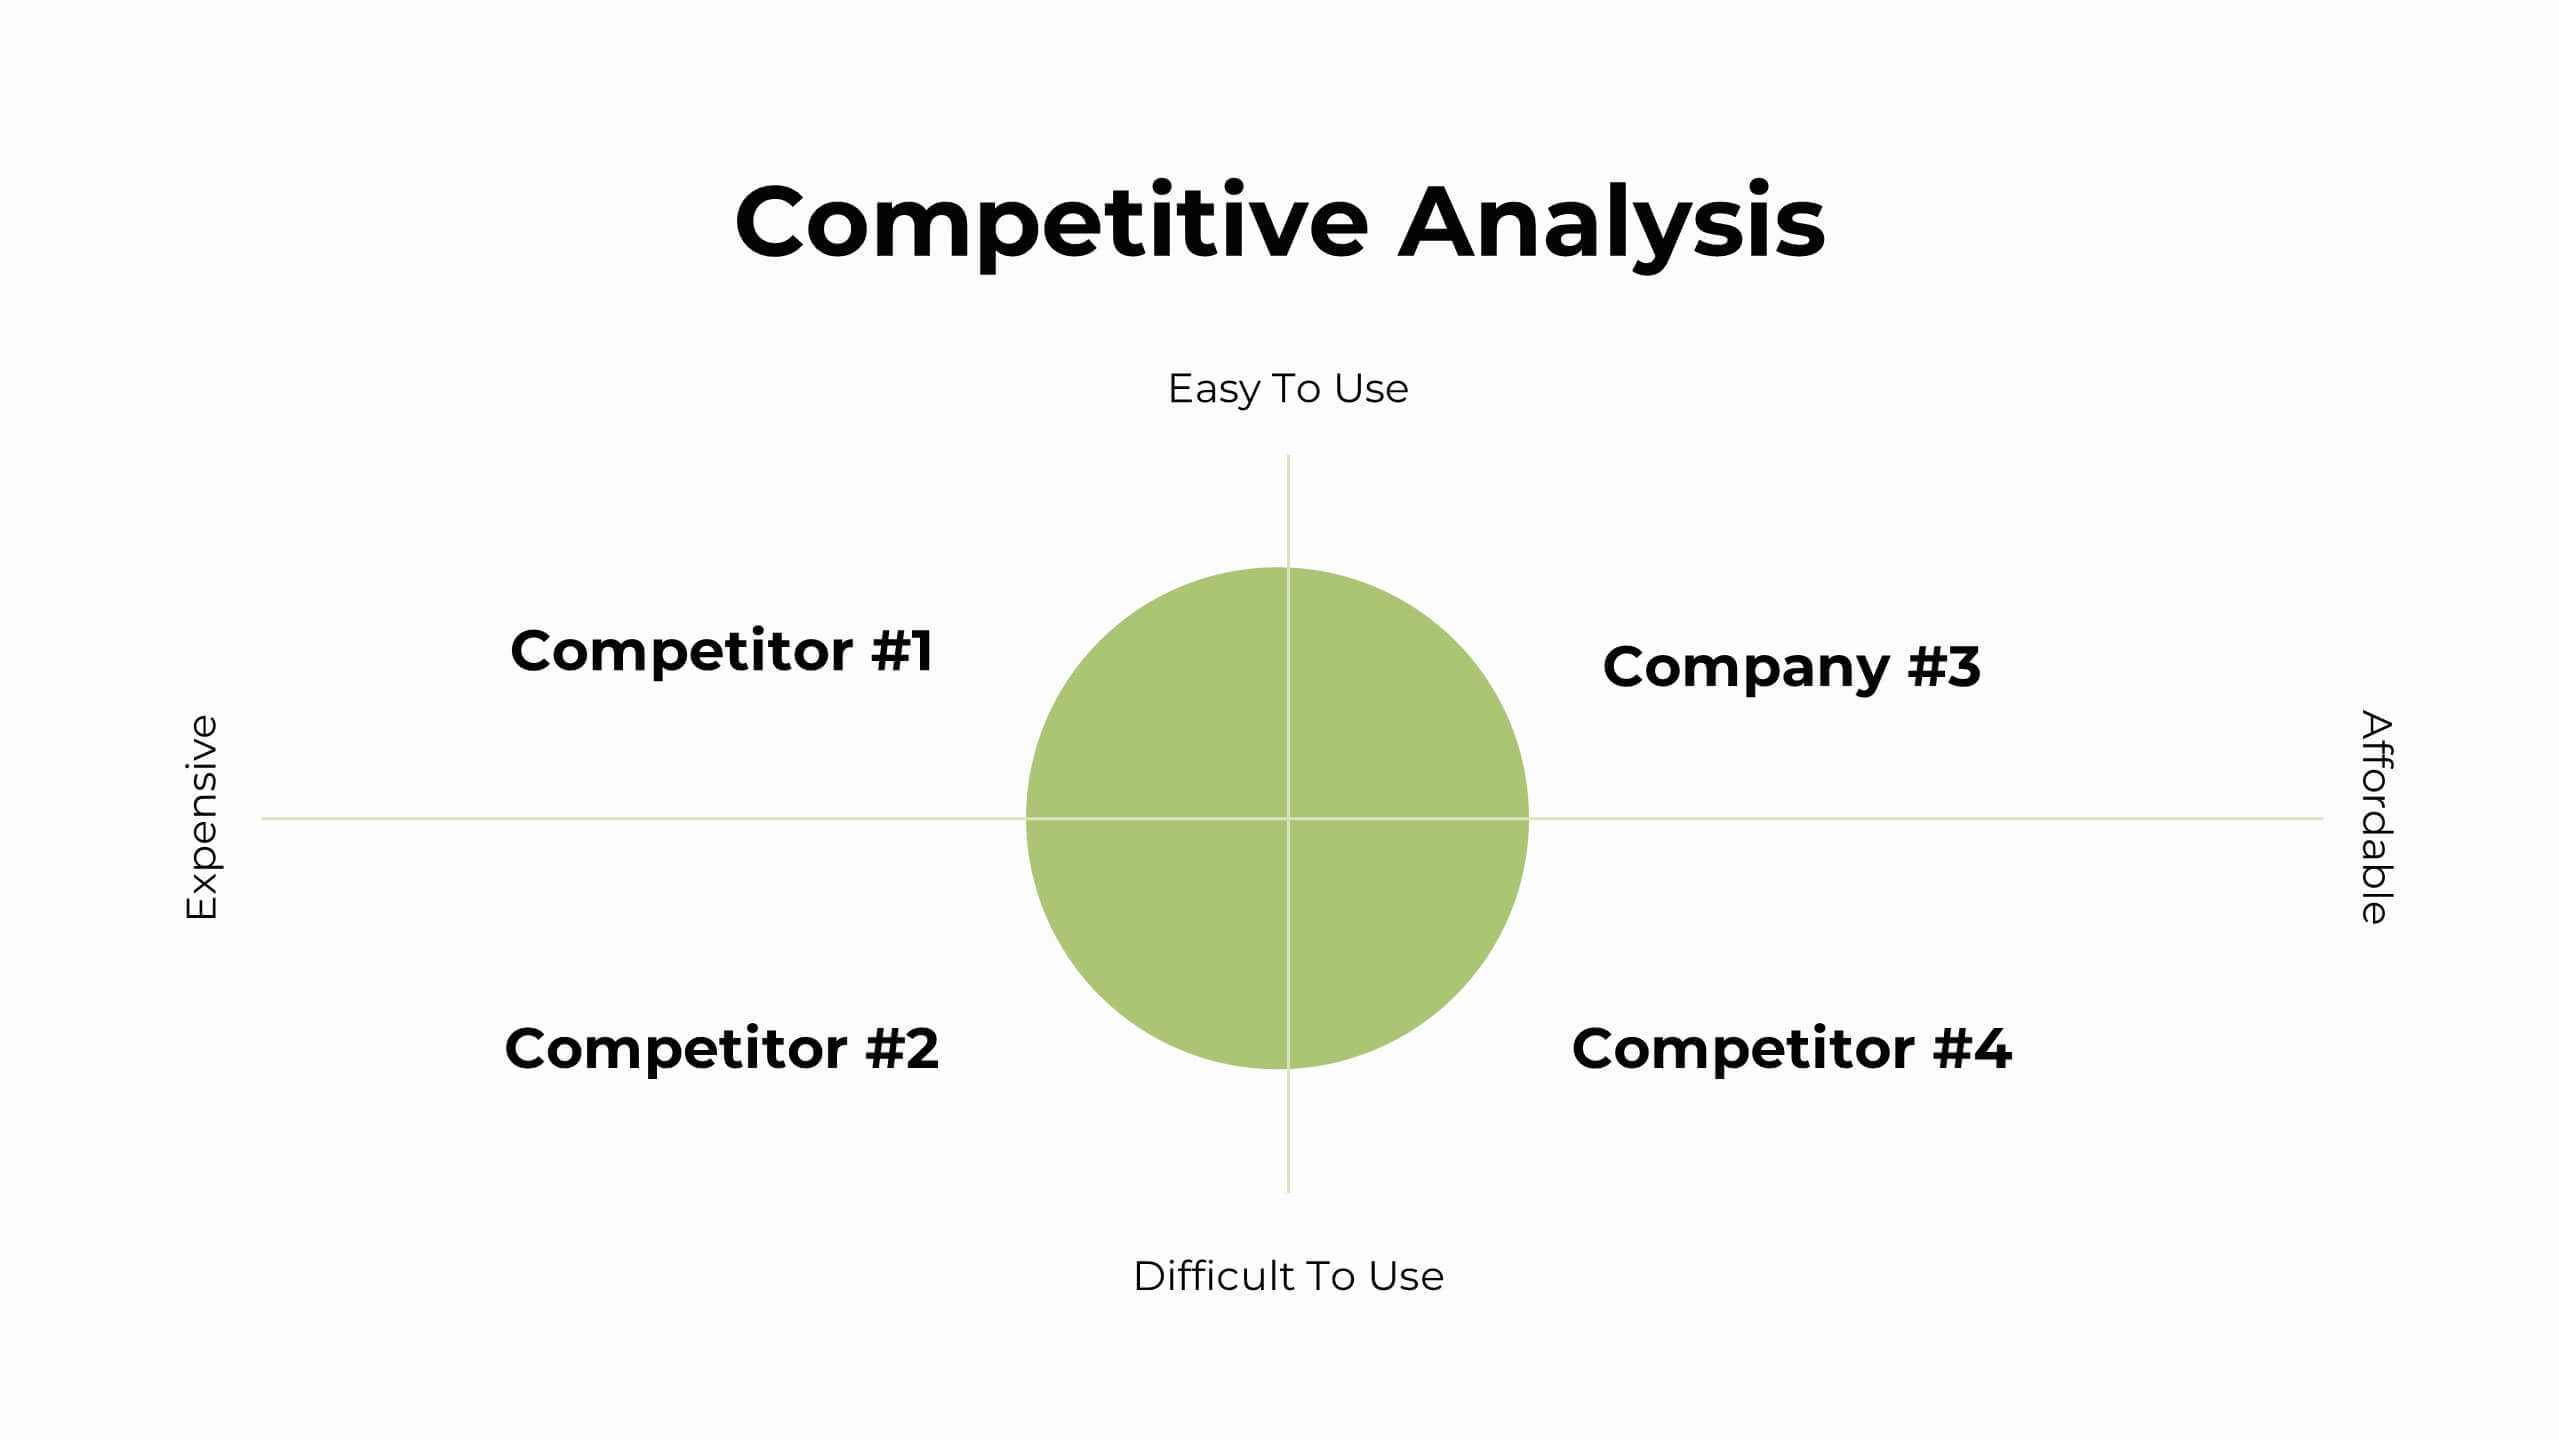
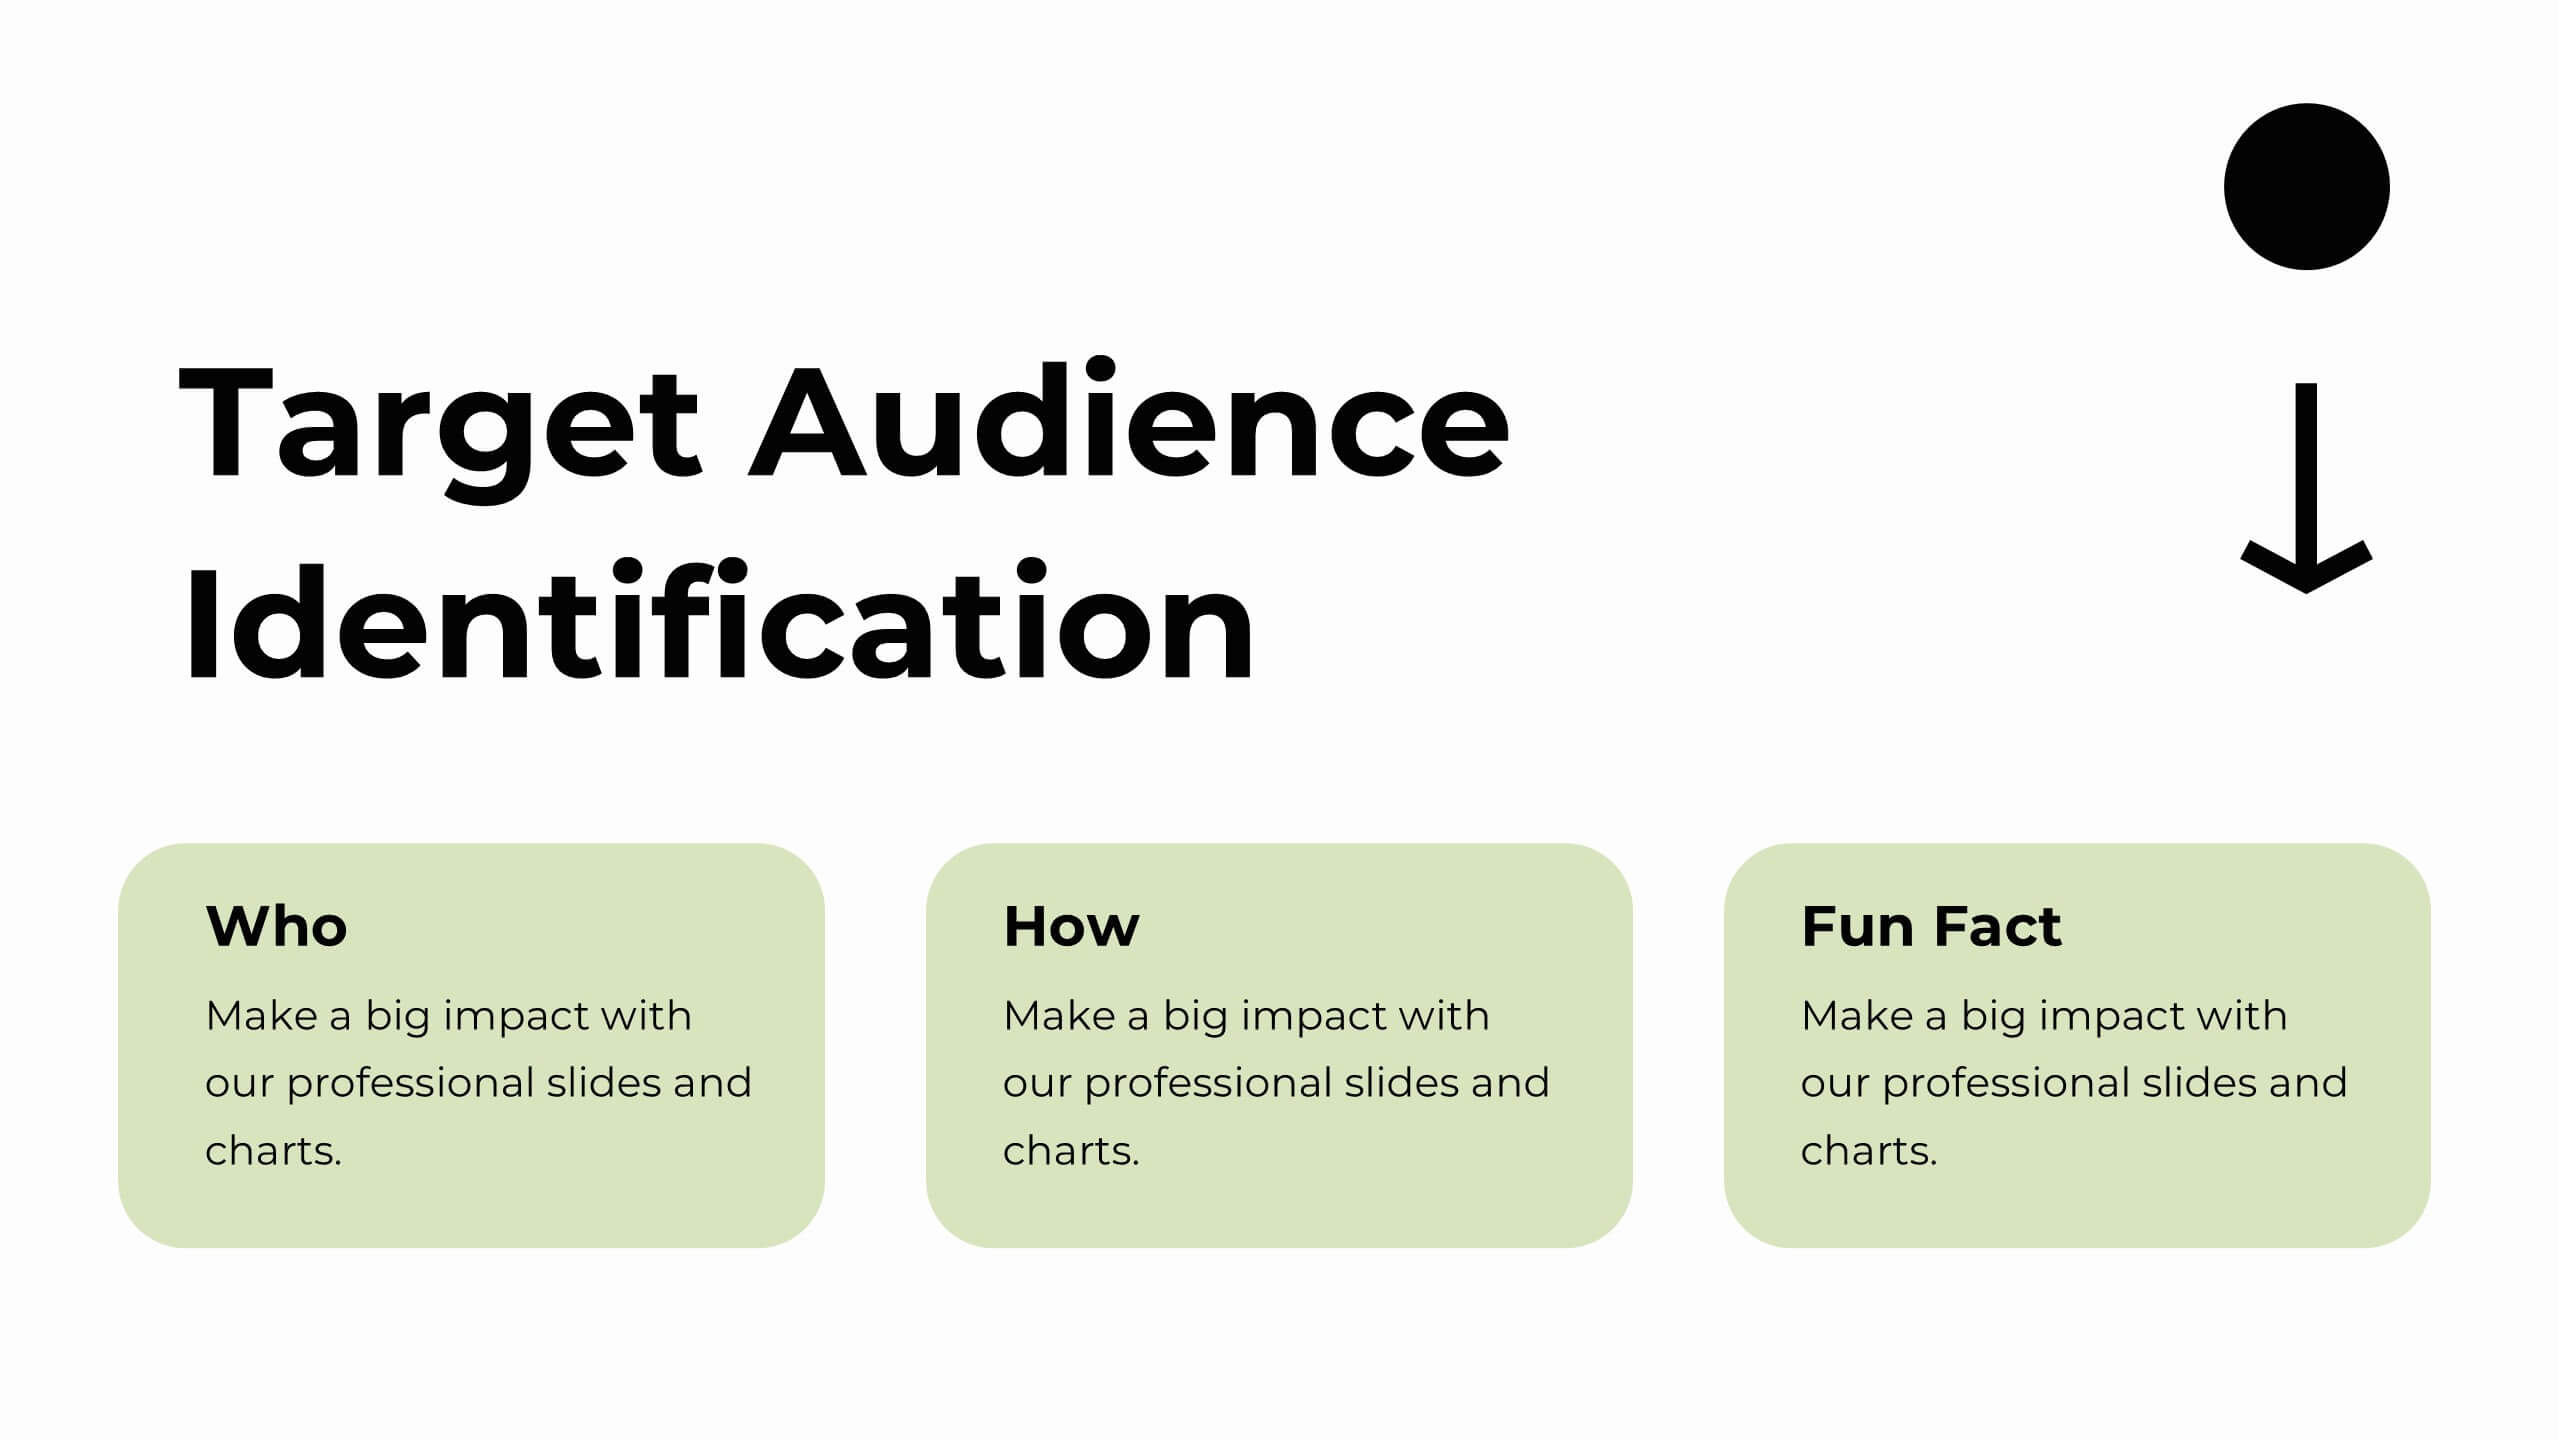
Zirconium Strategic Planning Report Presentation
Plan and present your strategies with precision using this comprehensive strategic planning report template! Designed for clear communication of goals, market trends, SWOT analysis, and growth opportunities, it’s perfect for aligning team objectives and driving success. Fully customizable and compatible with PowerPoint, Keynote, and Google Slides, this template is ideal for strategic initiatives and performance reviews.


6 slides
Efficient Scheduling and Time Management Presentation
Stay on time and on target with the Efficient Scheduling and Time Management presentation slide. Designed with smartwatch graphics showing time progression, this layout visually emphasizes planning, deadlines, and time-based tasks. Ideal for outlining agendas, productivity methods, or resource allocation strategies. Each time block includes editable text fields for key milestones or steps. Compatible with PowerPoint, Keynote, and Google Slides.


7 slides
Alphabet Letters Infographic
An alphabet infographic is a visual representation or graphic that presents information related to the alphabet, often used for educational purposes or to convey information in a creative and engaging manner. Get ready to embark on a joyful journey through the wonderland of letters and words with our alphabet letters infographic. This infographic template includes various elements like letters, words, examples, pronunciation guides, or related images. This is more than just an infographic—it's a vibrant celebration of language, learning, and pure happiness. Dive into the kaleidoscope of alphabets and spread the cheer!