


Features
- 4 Unique slides
- Fully editable and easy to edit in Microsoft Powerpoint, Keynote and Google Slides
- 16:9 widescreen layout
- Clean and professional designs
- Export to JPG, PDF or send by email


Do you have any questions?
Recommend


5 slides
Market Growth Strategy
Break down your strategic growth roadmap with this layered Market Growth Strategy template. Each stack represents a phase in your market expansion journey—ideal for illustrating plans, KPIs, or product scaling. Fully editable and compatible with PowerPoint, Keynote, and Google Slides for seamless use across platforms.


7 slides
Blue Ocean Methodology Infographic
Unveil the strategy of untapped market spaces with our blue ocean methodology infographic. Elegantly presented in shades of blue and white, this infographic offers a deep dive into the innovative strategy that focuses on creating new demand in non-contested market areas. Ideally tailored for business strategists, entrepreneurs, and innovators, it sheds light on the significance of venturing beyond the saturated marketplaces and the competition. Designed for PowerPoint, Keynote, and Google Slides, this comprehensive template provides a crystal-clear framework, aiding in crafting groundbreaking strategies and capturing fresh market space.


6 slides
Customer Value Proposition Framework Presentation
Clarify your business offering with the Customer Value Proposition Framework Presentation. This template is designed to help you align your products or services with customer needs through a side-by-side visual of the Value Proposition Canvas. Highlight pain points, customer gains, and how your solution uniquely addresses them. Fully customizable in PowerPoint, Keynote, and Google Slides. Perfect for marketers, product managers, and strategic planning teams.


23 slides
Pomona Business Plan Presentation
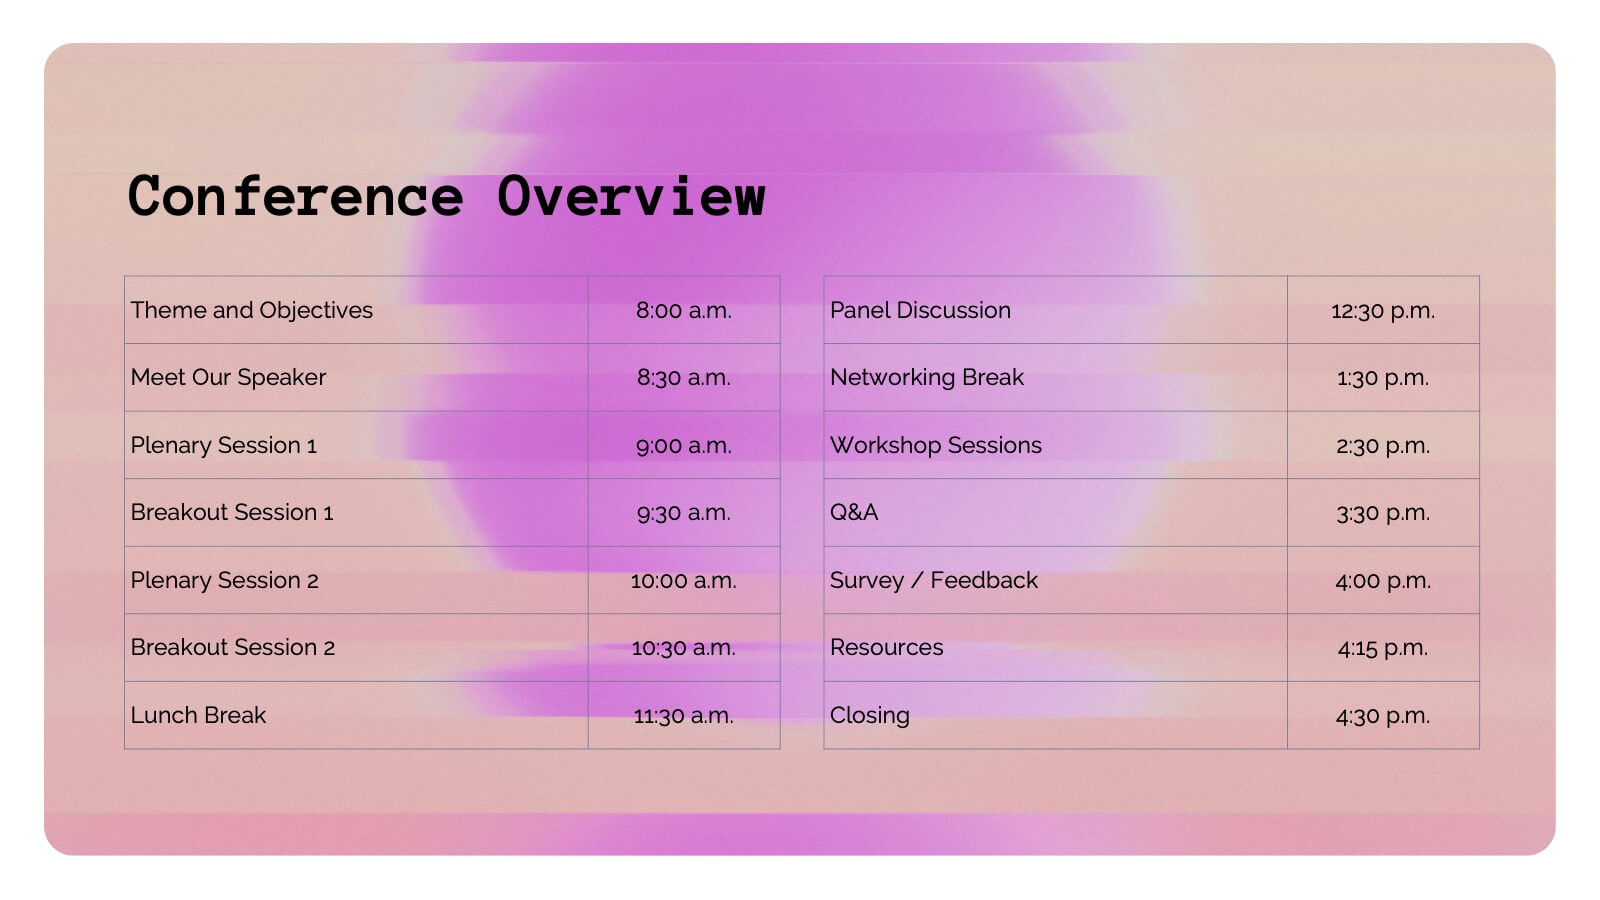
This vibrant and adaptable event agenda template is perfect for organizing your business conference or corporate event. It includes customizable sections for session details, speaker information, and key activities like networking breaks, workshops, and panel discussions. Compatible with PowerPoint, Keynote, and Google Slides, it ensures a smooth and engaging event presentation experience!


7 slides
30 60 90 Nutritional Plan Infographic
Chart a path to healthful living with the 30 60 90 Nutritional Plan Infographic. In a vibrant mix of yellow, purple, blue, and white, this template presents a visually delightful guide to nutrition enthusiasts and health-conscious audiences. The tailored design encourages a gradual approach to dietary transitions, making it easier to understand and adhere to. Health coaches, dietitians, or fitness trainers will find this as an indispensable tool for workshops, webinars, or consultations. Its seamless integration with PowerPoint, Keynote, and Google Slides enhances the user experience during presentations.


5 slides
Country Breakdown South America Map Presentation
Turn complex regional data into clear visual insights with this modern map layout designed for South America. Perfect for showcasing country statistics, market segmentation, or performance comparisons, this slide keeps information clean and engaging. Fully compatible with PowerPoint, Keynote, and Google Slides for easy editing and professional presentations.


4 slides
Decision-Making Options Presentation
Make confident choices with the Decision-Making Options template. This structured layout helps visualize various decision paths, making it ideal for strategic planning, leadership discussions, and risk assessment. Fully customizable and designed for clarity, this template works seamlessly with PowerPoint, Keynote, and Google Slides for effortless presentation and collaboration.


21 slides
Astromeda Product Launch Presentation
This Product Launch Presentation template offers a clean and modern design to showcase your product effectively. It covers key areas such as market analysis, competitive landscape, pricing strategy, and sales approach. Fully customizable and compatible with PowerPoint, Keynote, and Google Slides, it's perfect for startups and businesses launching new products.


5 slides
Cross-Functional Team Collaboration Presentation
Visualize multi-department synergy with the Cross-Functional Team Collaboration Presentation. Ideal for mapping collaborative structures, workflows, or project roles across divisions. This layout emphasizes alignment and cooperation between teams. Easily customizable in PowerPoint, Keynote, and Google Slides—perfect for strategy sessions, management briefings, or team onboarding presentations.


10 slides
Key Takeaways List Presentation
Streamline your key points with our "Key Takeaways List Presentation" template. This versatile infographic design offers a clear, structured format for enumerating crucial information across four distinct stages. Each stage is visually represented with vibrant, color-coded sections to ensure readability and impact. Whether you're summarizing a meeting, outlining project steps, or highlighting important data, this template provides a straightforward way to communicate your message effectively. Compatible with PowerPoint, Keynote, and Google Slides, it's ideal for professionals seeking to make their presentations more engaging and organized.


10 slides
Cause and Effect Fishbone Presentation
Visualize root causes and streamline analysis with this Cause and Effect Fishbone infographic. Ideal for identifying issues across categories, it helps present logical flows clearly. Fully editable and perfect for business, strategy, or process improvement discussions. Compatible with PowerPoint, Keynote, and Google Slides for effortless customization.


26 slides
Understanding Cryptocurrency Presentation
Step into the future of finance with this engaging presentation on cryptocurrency. Covering key topics like blockchain technology, digital wallets, market trends, and security best practices, this template helps simplify complex concepts for any audience. Fully customizable and compatible with PowerPoint, Keynote, and Google Slides for a seamless and informative presentation experience.
7 slides
Arrow Infographic Presentation Template
Arrow Infographics are a great tool to visualize changes, positioning and processes. You can use the arrows to show the direction of your startup or to explain the stages of a business plan. Present your strategies, stages, and plans in a clear & concise way. Use this arrow Infographic template to present complex topics. Arrows are great for highlighting the progress of a project and its relationship with other projects. Use this template to visualize the process of a business strategy. This Arrow Infographic Template gives you all the essentials you need when it comes to creating your own.


21 slides
Elixara Startup Funding Proposal Presentation
Give your startup the pitch it deserves with this elegantly designed funding proposal presentation. Covering key areas like business model, competitive analysis, financial overview, and growth strategies, this template helps you present your vision with confidence. Fully customizable and compatible with PowerPoint, Keynote, and Google Slides for a seamless investor-ready experience.


6 slides
Cryptocurrency Analysis Infographics
Analyze cryptocurrency effectively with our Cryptocurrency Analysis infographic template. This template is fully compatible with popular presentation software like PowerPoint, Keynote, and Google Slides, allowing you to easily customize it to illustrate and communicate various aspects of cryptocurrency analysis. The Cryptocurrency Analysis infographic template offers a visually engaging platform to explore and explain the key elements of analyzing cryptocurrencies, including market trends, technical analysis, fundamental analysis, and investment strategies. Whether you're a cryptocurrency enthusiast, trader, or investor, this template provides a user-friendly canvas to create informative presentations and educational materials. Enhance your cryptocurrency knowledge and analysis skills with this SEO-optimized Cryptocurrency Analysis infographic template, thoughtfully designed for clarity and ease of use. Customize it to showcase cryptocurrency charts, indicators, risk management techniques, and insights into the volatile world of digital assets, ensuring that your audience gains valuable insights into this evolving field. Start crafting your personalized infographic today to become a more proficient cryptocurrency analyst.


5 slides
Corporate Skills Training Program Presentation
Elevate corporate capability with the 'Corporate Skills Training Program' template, ideal for detailing strategic workforce development. It's crafted for organizations aiming to enhance employee competencies and performance metrics. This template is compatible with PowerPoint, Keynote, and Google Slides, ensuring adaptability across various presentation platforms.


5 slides
Leadership and Workforce Culture
Inspire growth from the ground up with this bold, step-by-step visual that captures the journey of leadership and team development. From culture-building to individual progress, this layout helps you illustrate each stage clearly and confidently. Fully compatible with PowerPoint, Keynote, and Google Slides.