


Features
- 6 Unique slides
- Fully editable and easy to edit in Microsoft Powerpoint, Keynote and Google Slides
- 16:9 widescreen layout
- Clean and professional designs
- Export to JPG, PDF or send by email


Do you have any questions?
Recommend
5 slides
Goal-Oriented Arrow Diagram Strategy
Visualize alignment, focus, and convergence toward business objectives with this dynamic arrow-to-target diagram. Perfect for strategy teams, consultants, and marketing leads to communicate multi-stream initiatives driving toward one central goal. Fully editable in PowerPoint, Keynote, and Google Slides to suit your content and branding needs.


6 slides
5-Step Investment Planning Presentation
Guide your audience through a clear, structured journey with a modern layout that turns each financial step into a simple, visual milestone. This presentation helps you explain goals, outline processes, and communicate actionable insights with ease and clarity. Fully editable and compatible with PowerPoint, Keynote, and Google Slides.


5 slides
Human-Centered Design Thinking Strategy
Showcase empathy-driven innovation with the Human-Centered Design Thinking Strategy Presentation. This slide visually emphasizes user-focused thinking by combining a head silhouette with colorful puzzle icons representing each strategic step. Ideal for UX strategy meetings, product development pitches, and innovation workshops, it includes five editable segments labeled A to E, each with matching text fields to explain your core insights or process stages. Compatible with PowerPoint, Keynote, and Google Slides for seamless editing and presentation.


23 slides
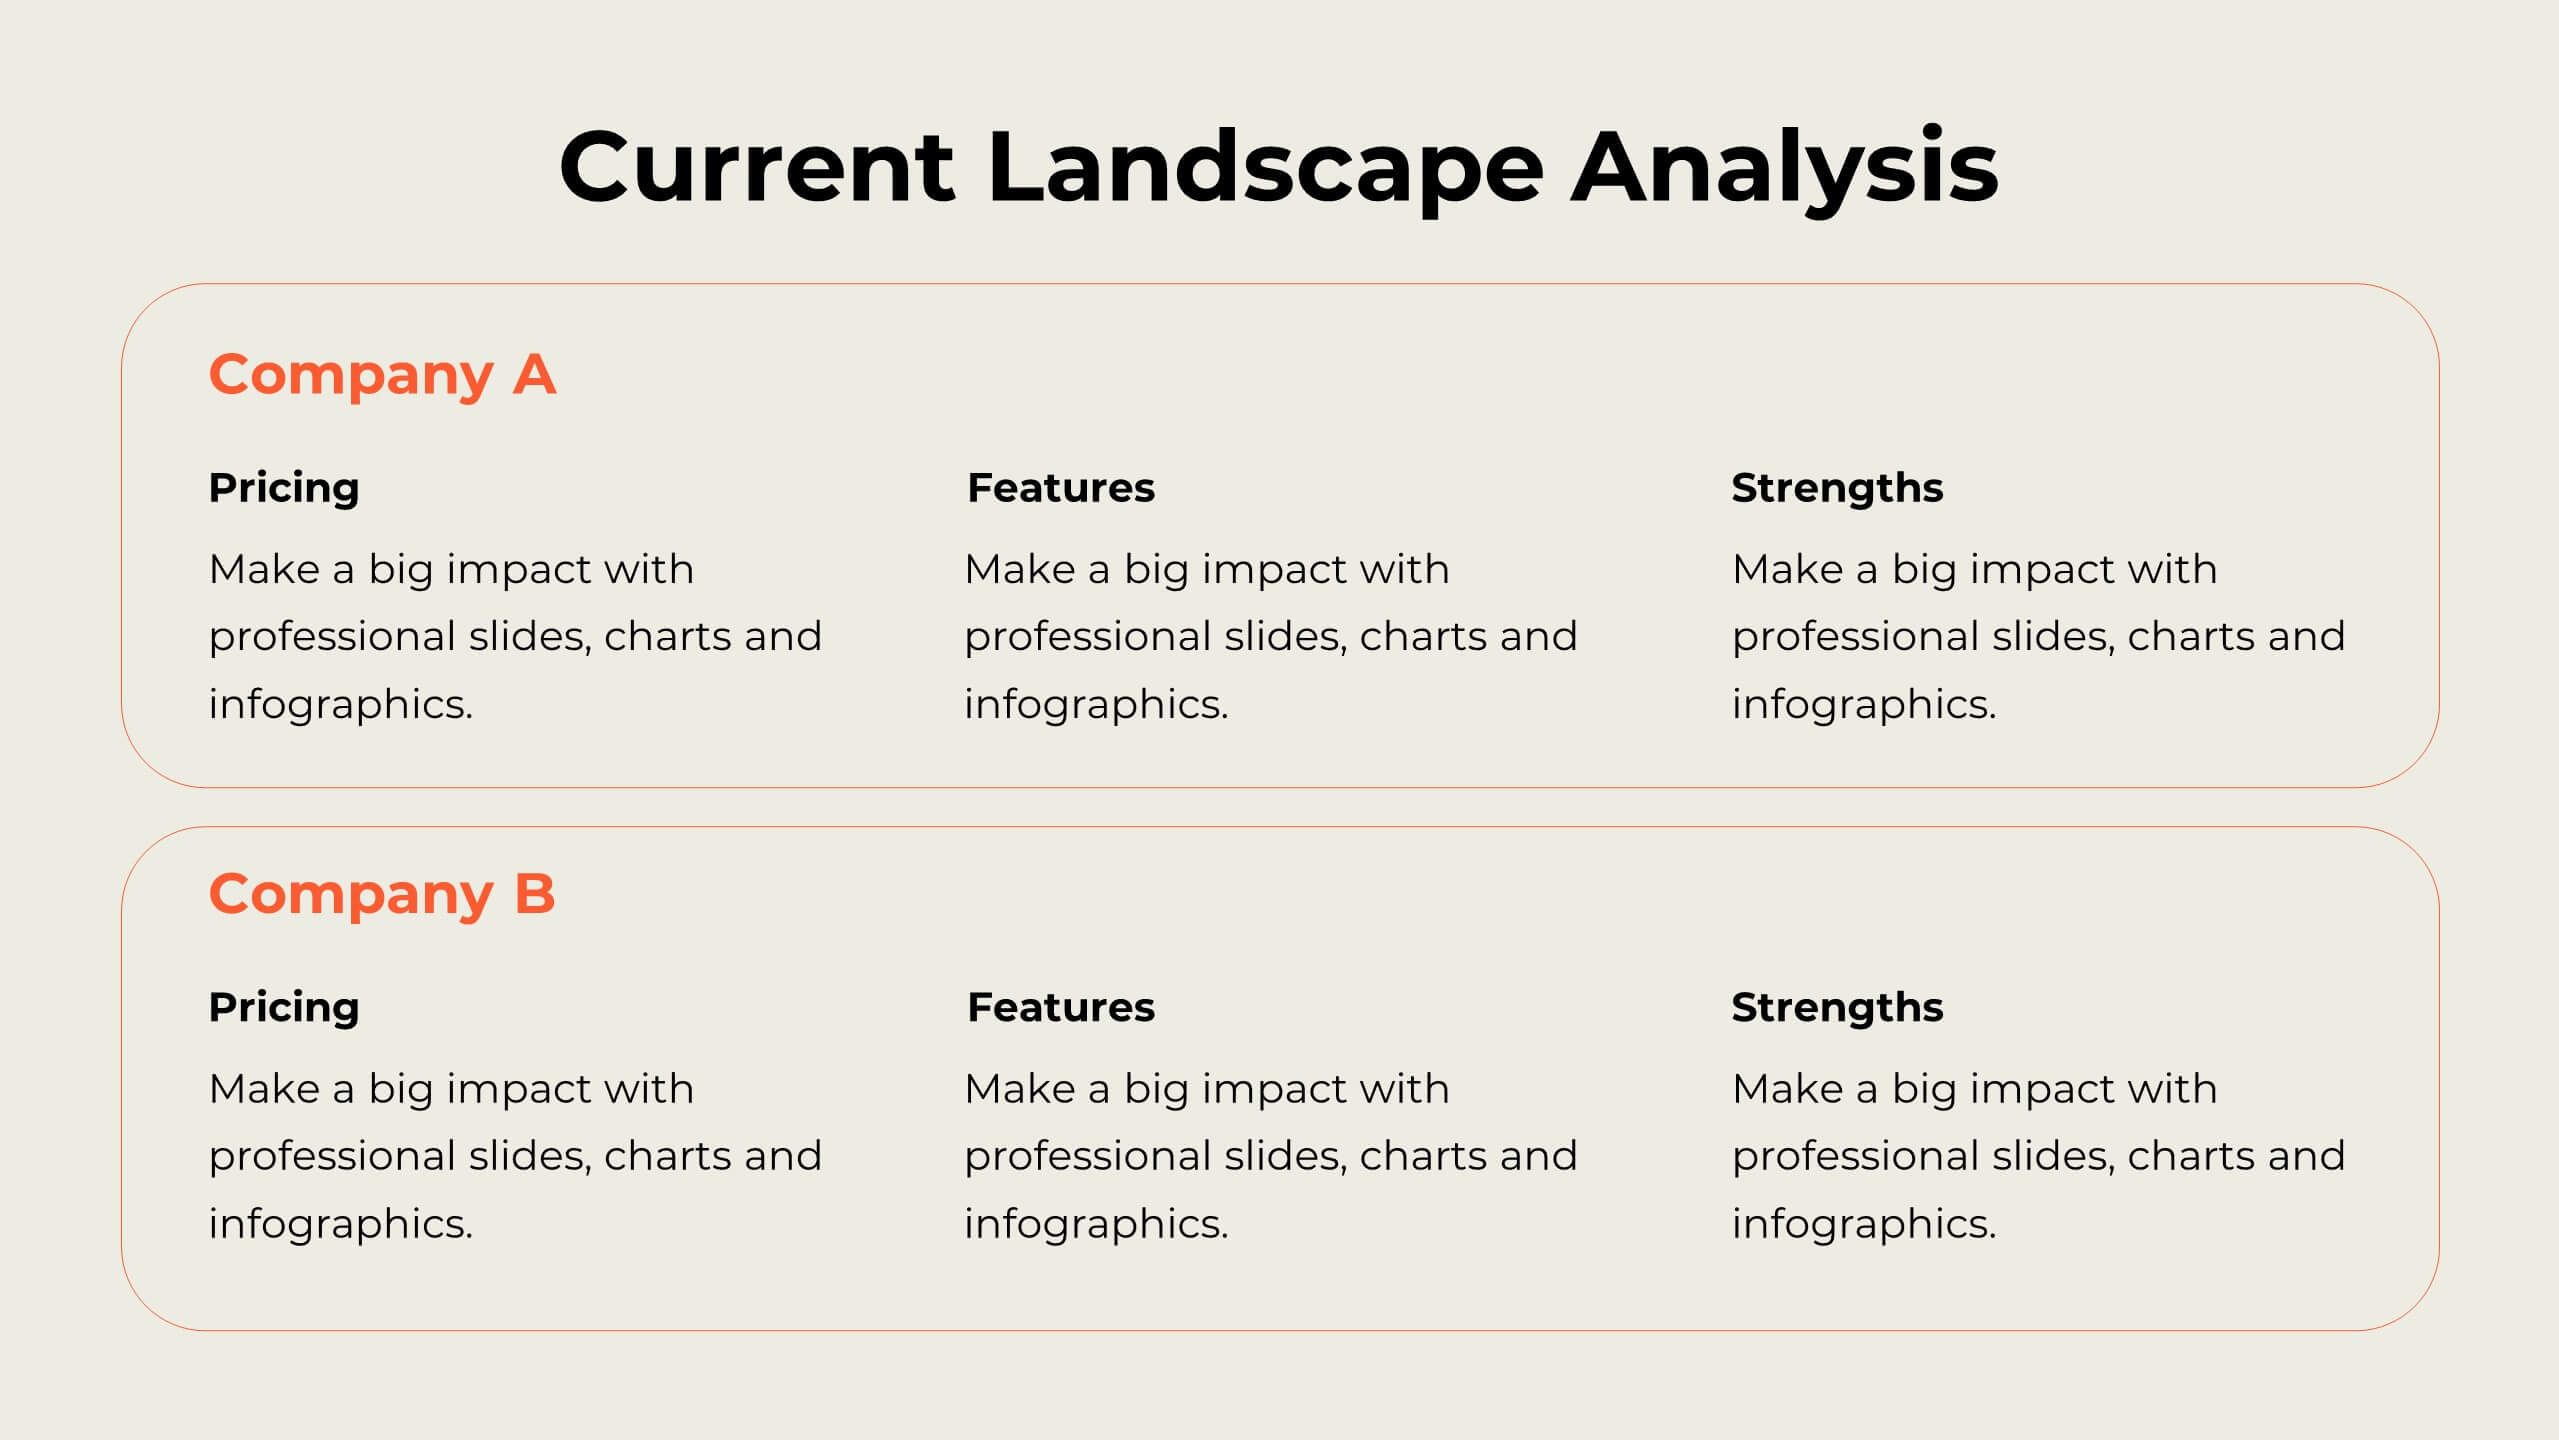
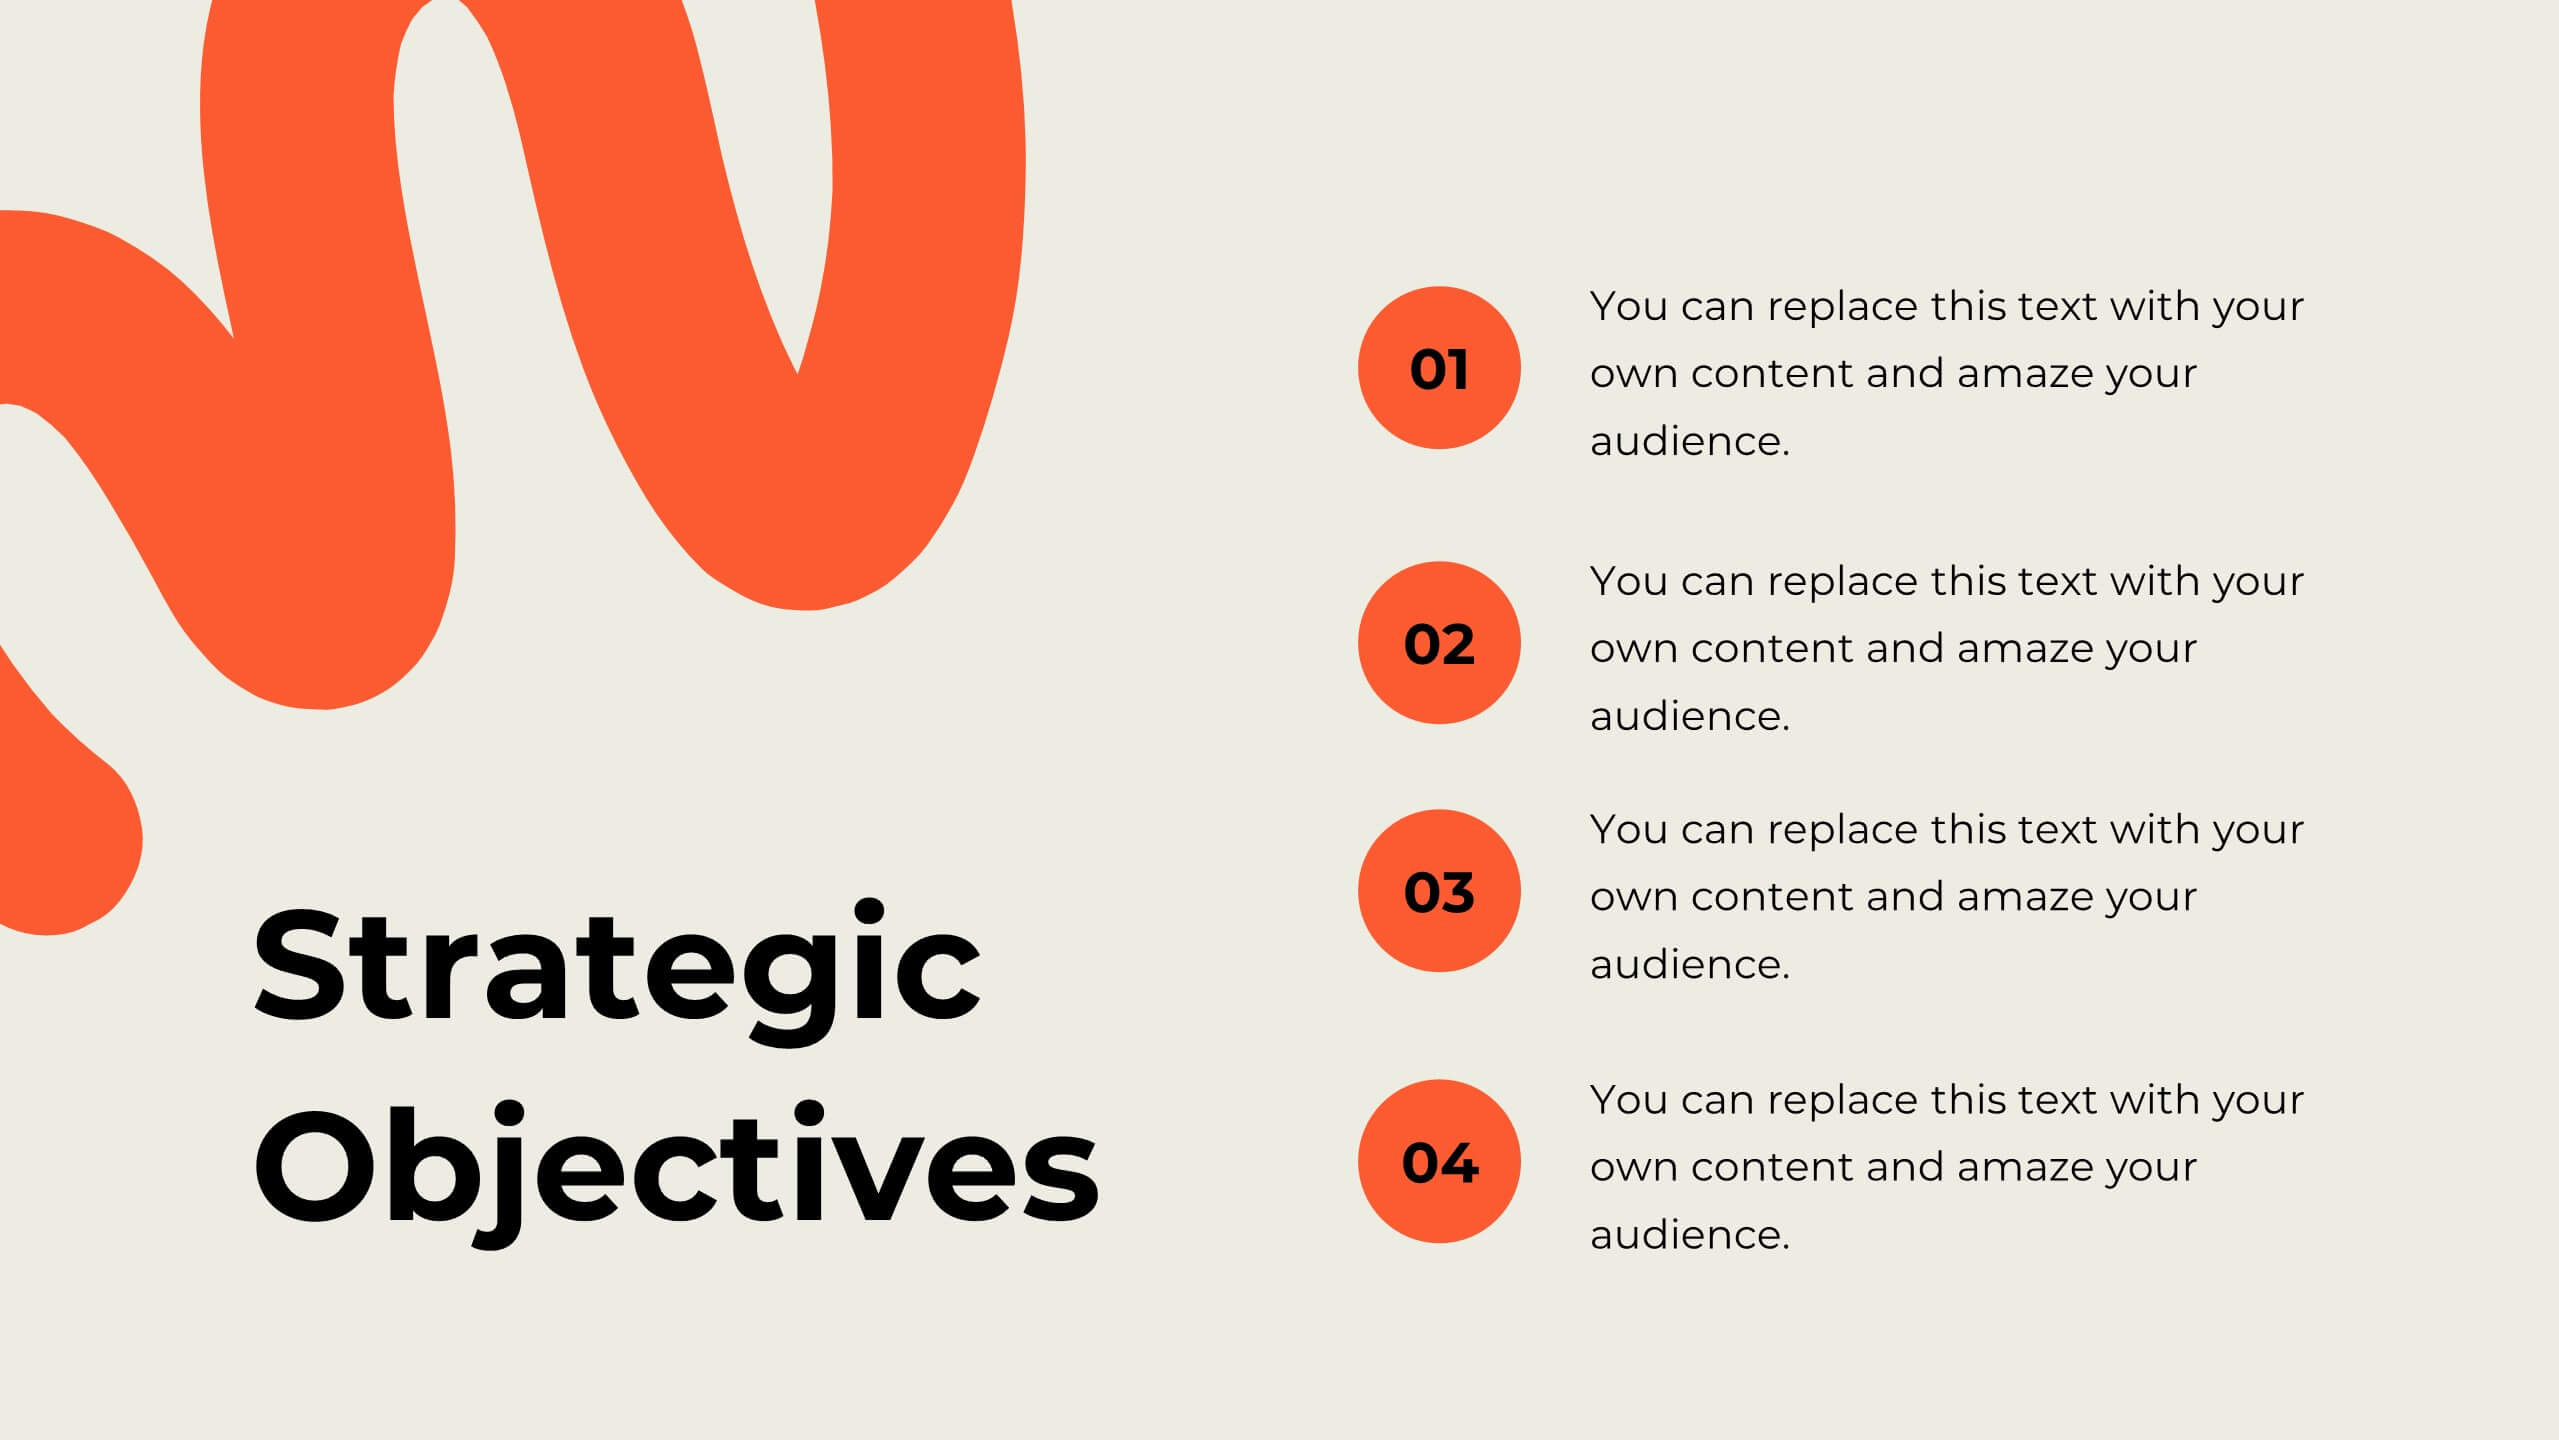
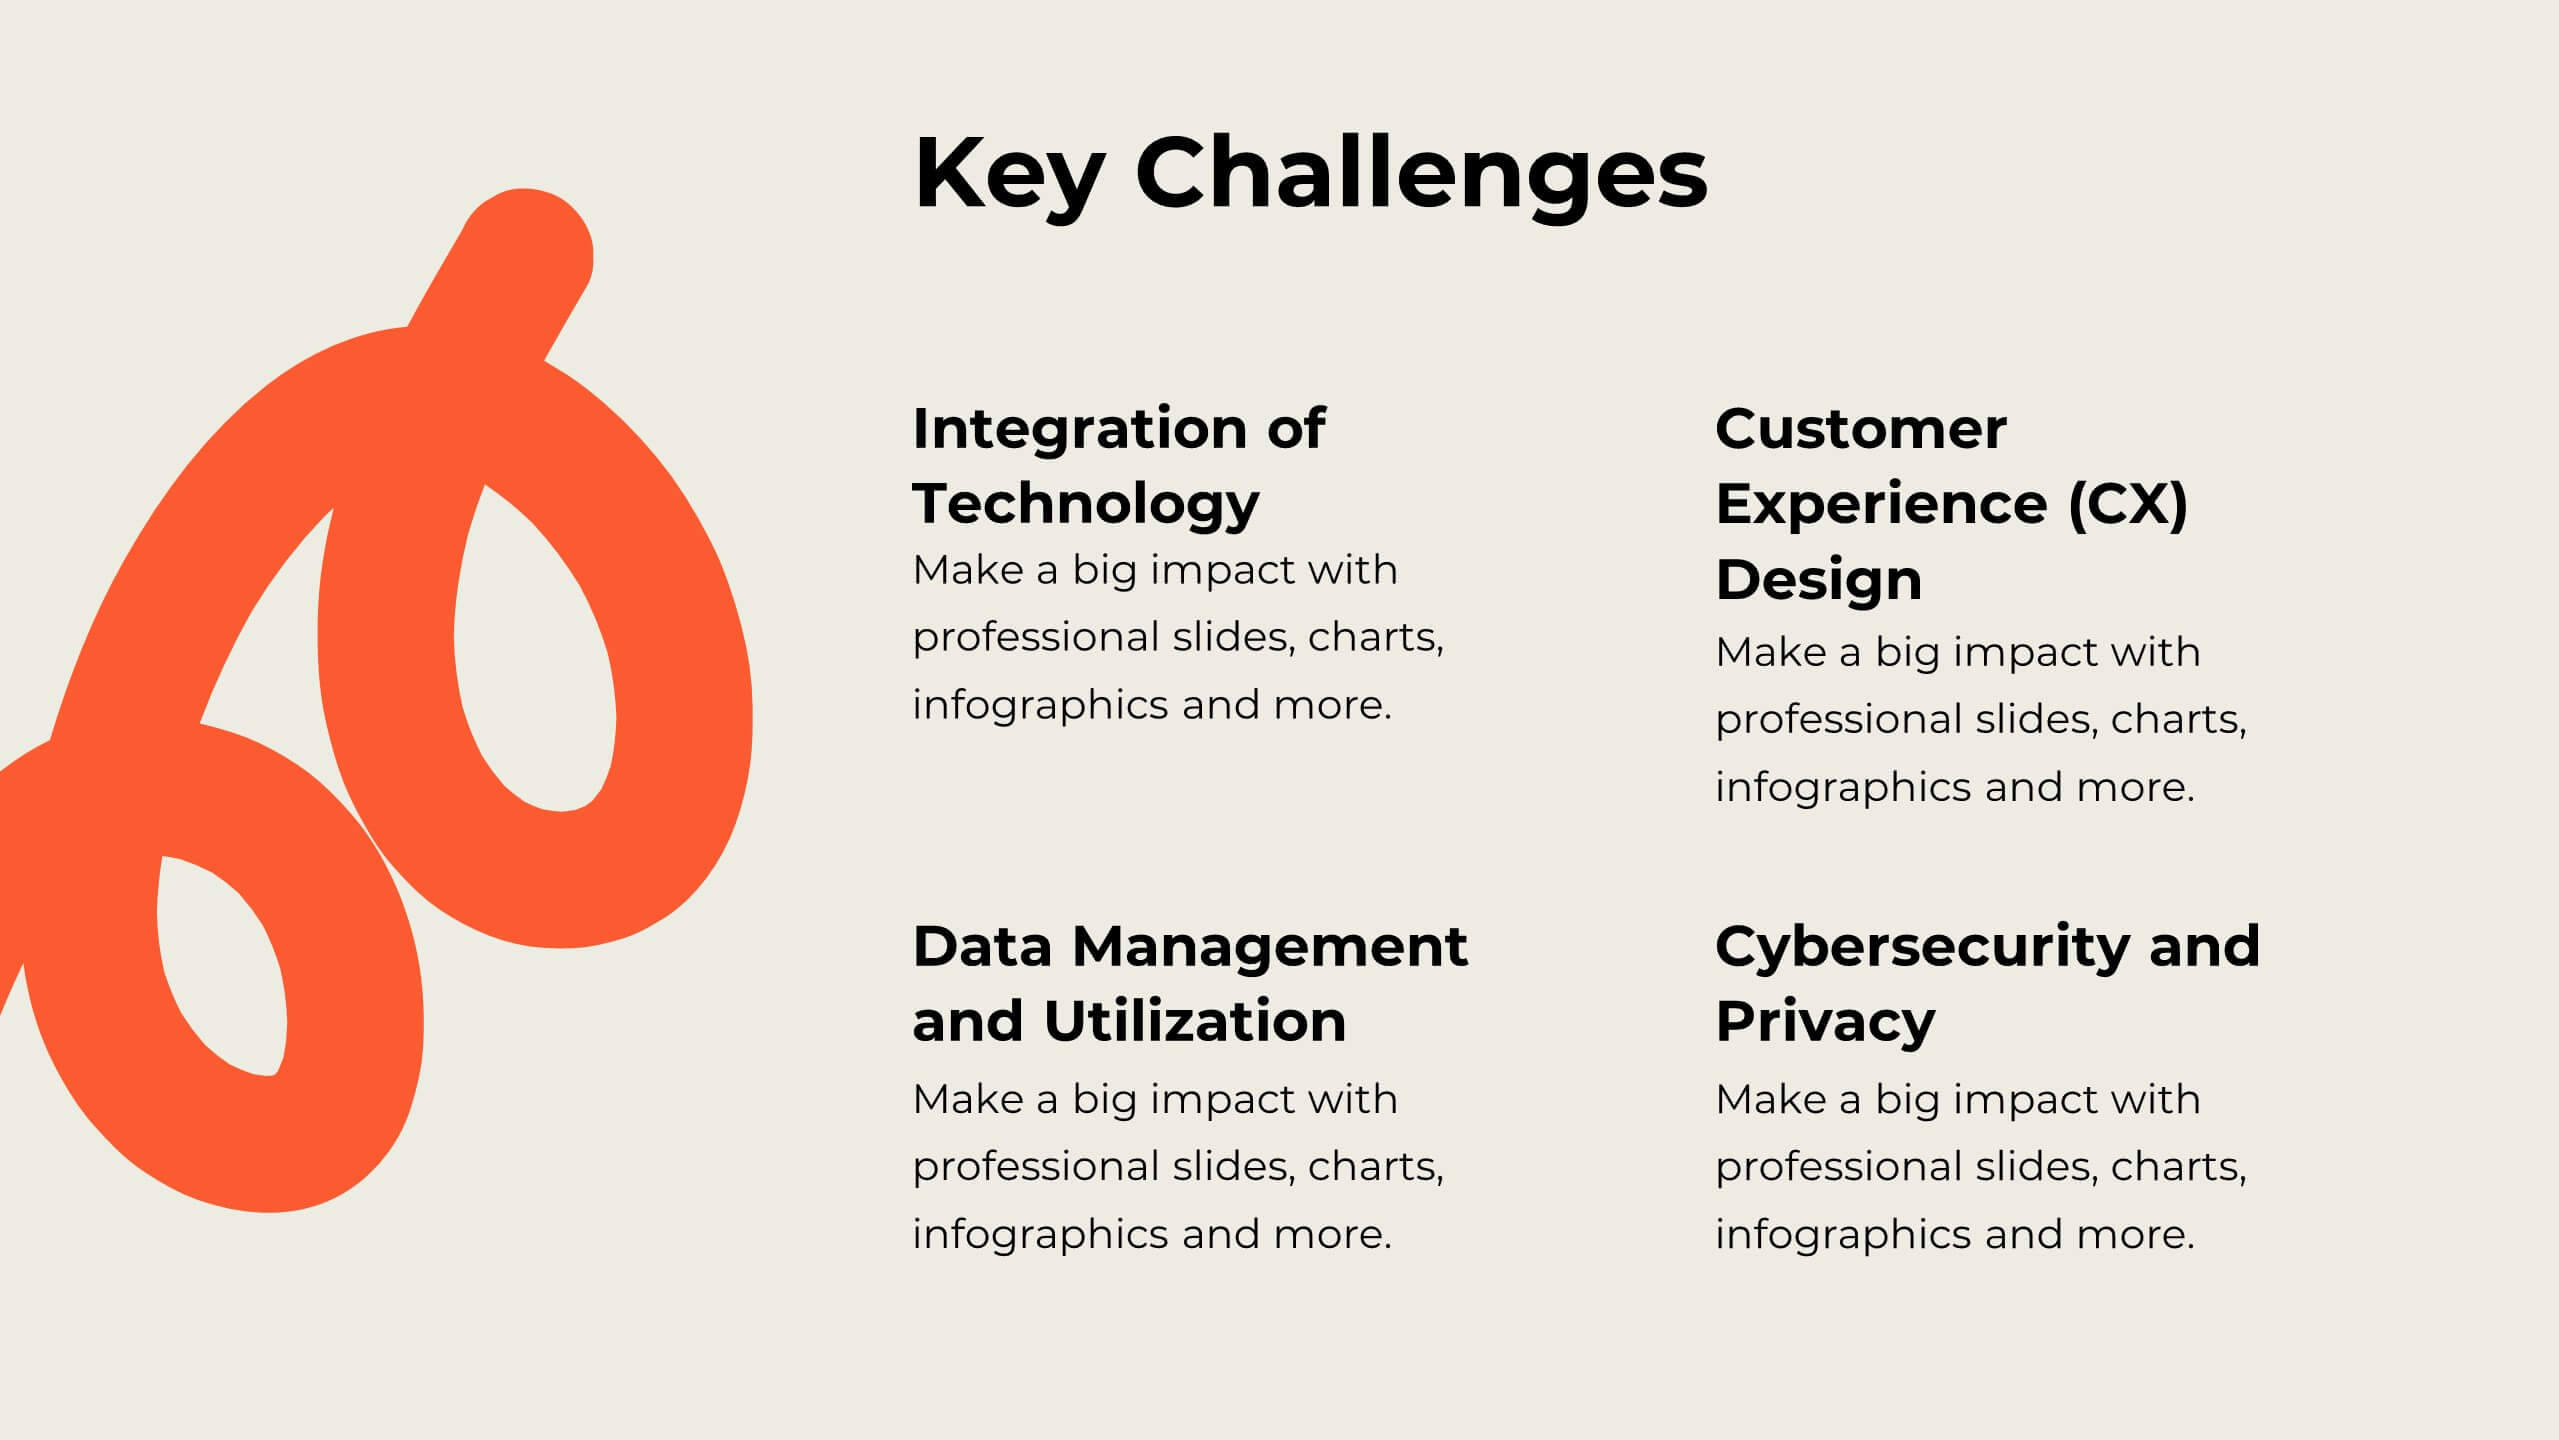
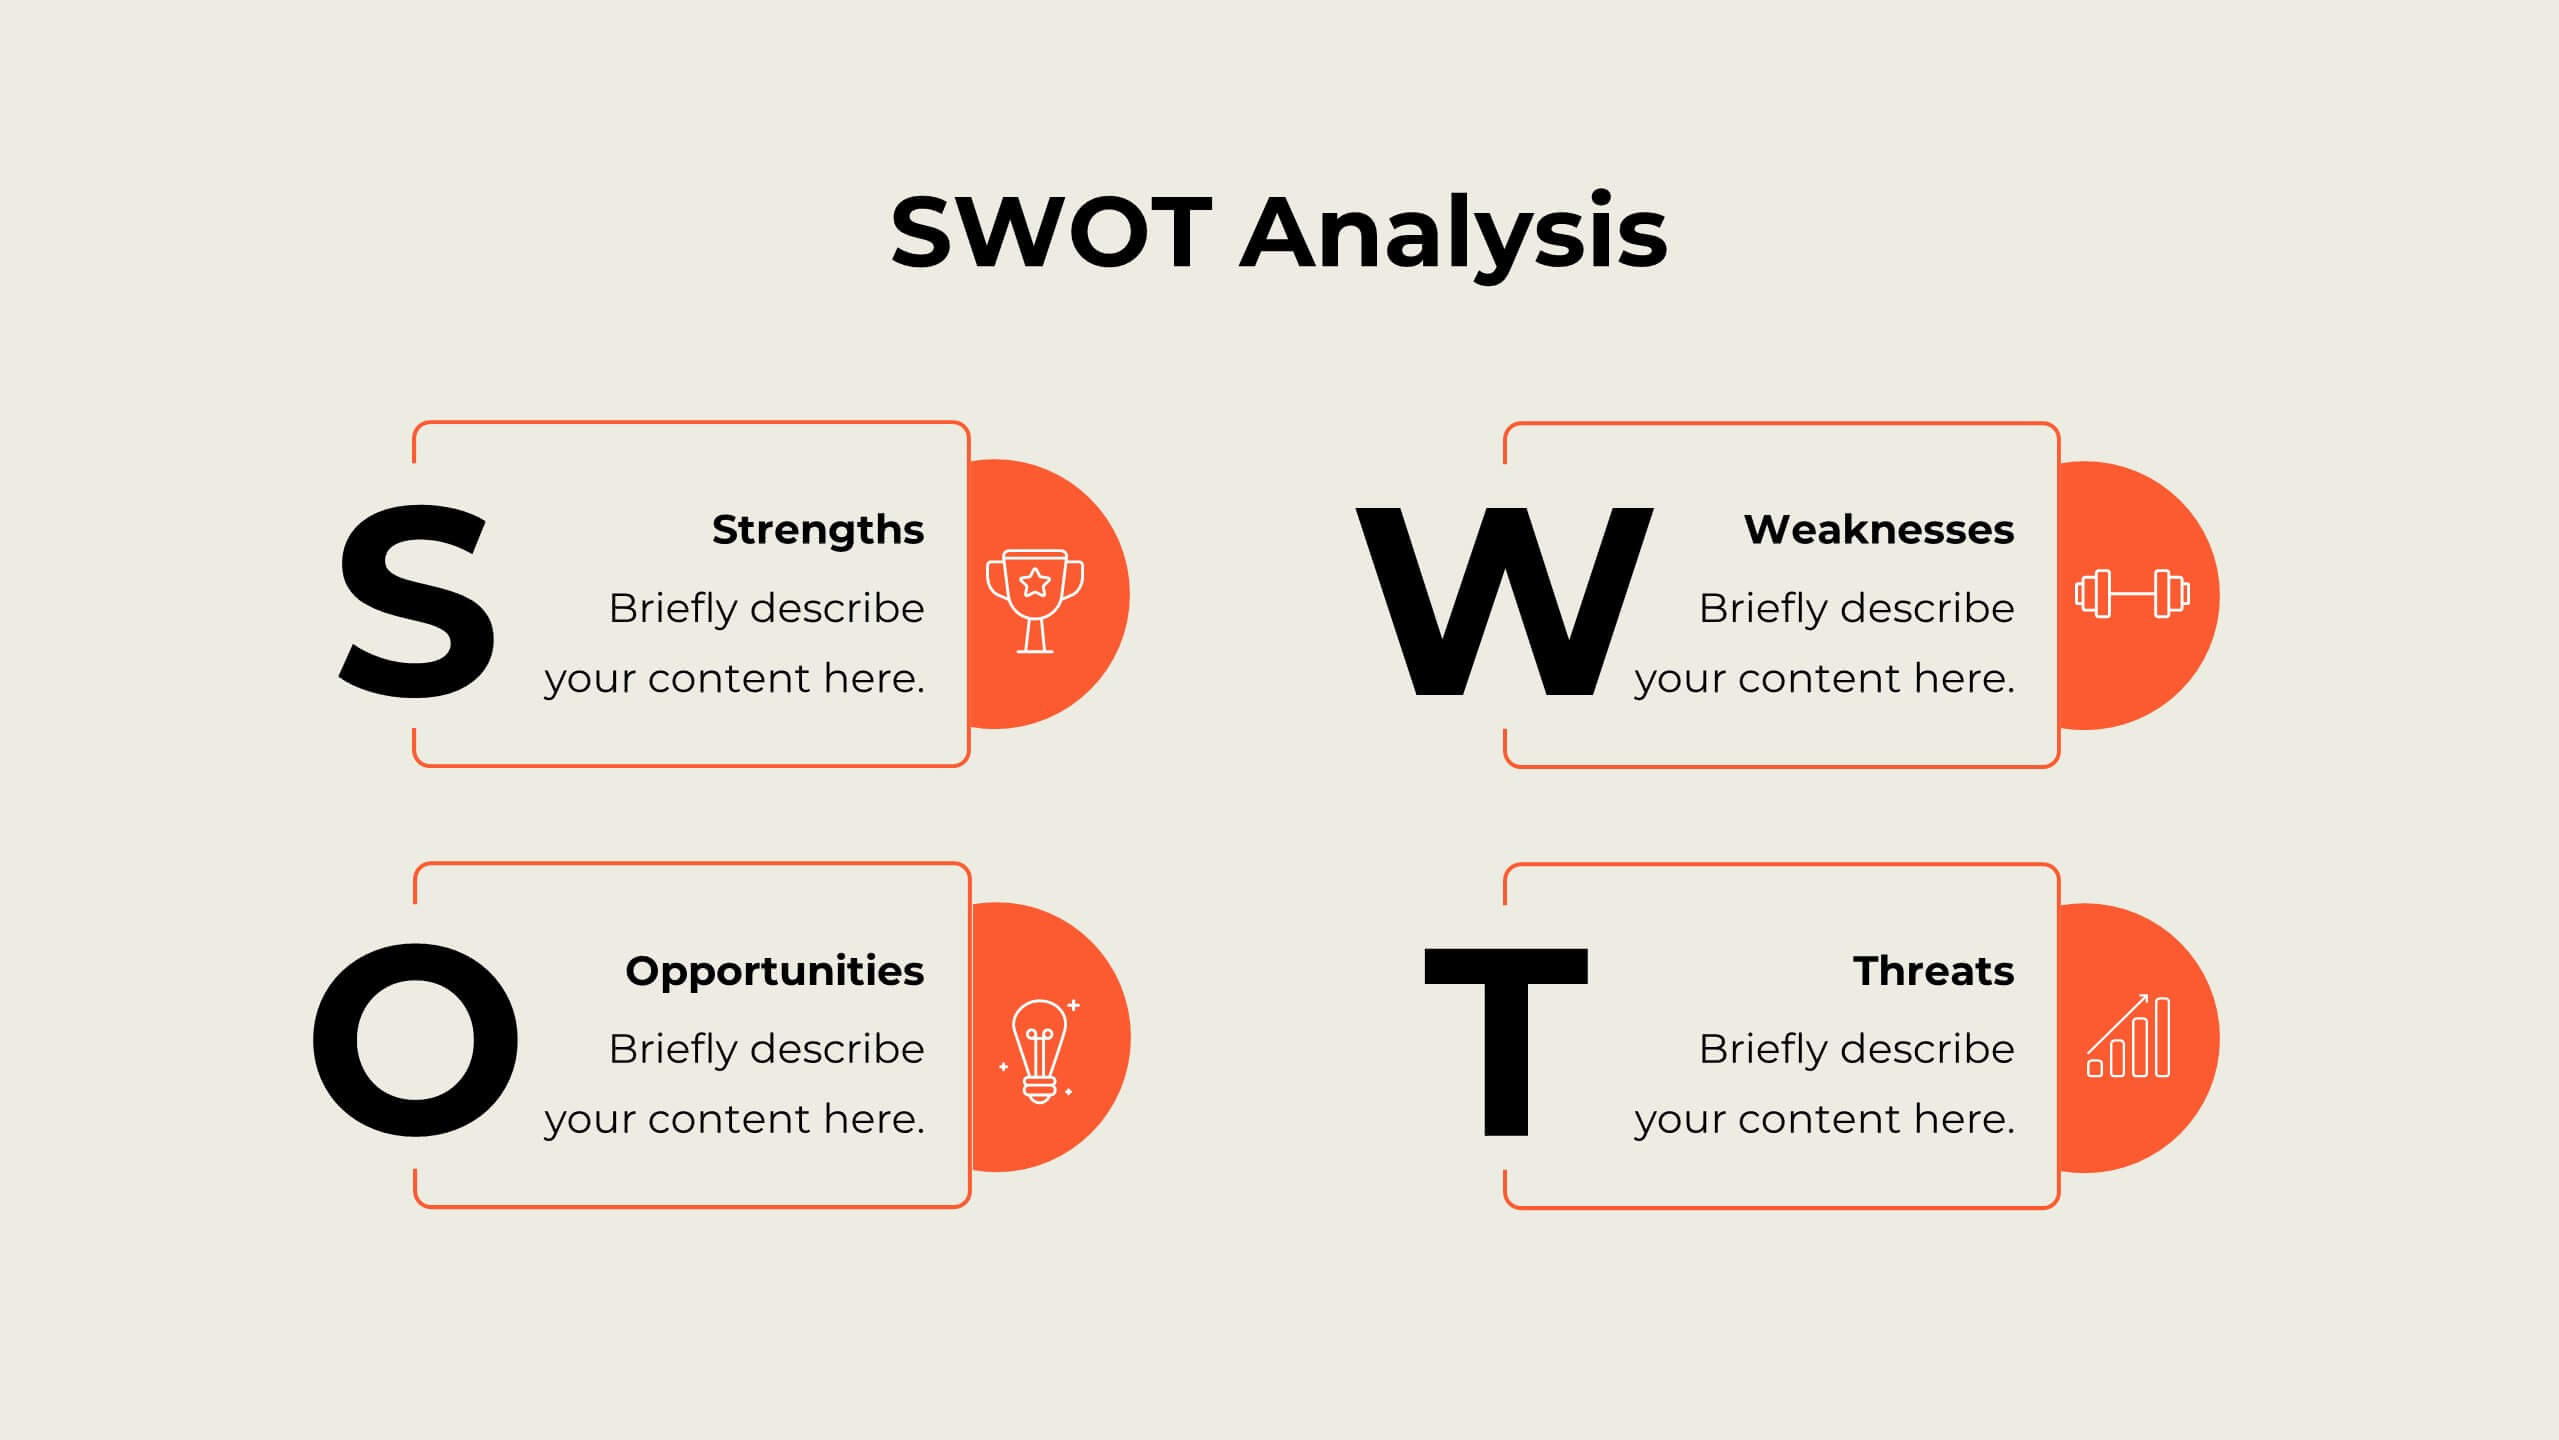
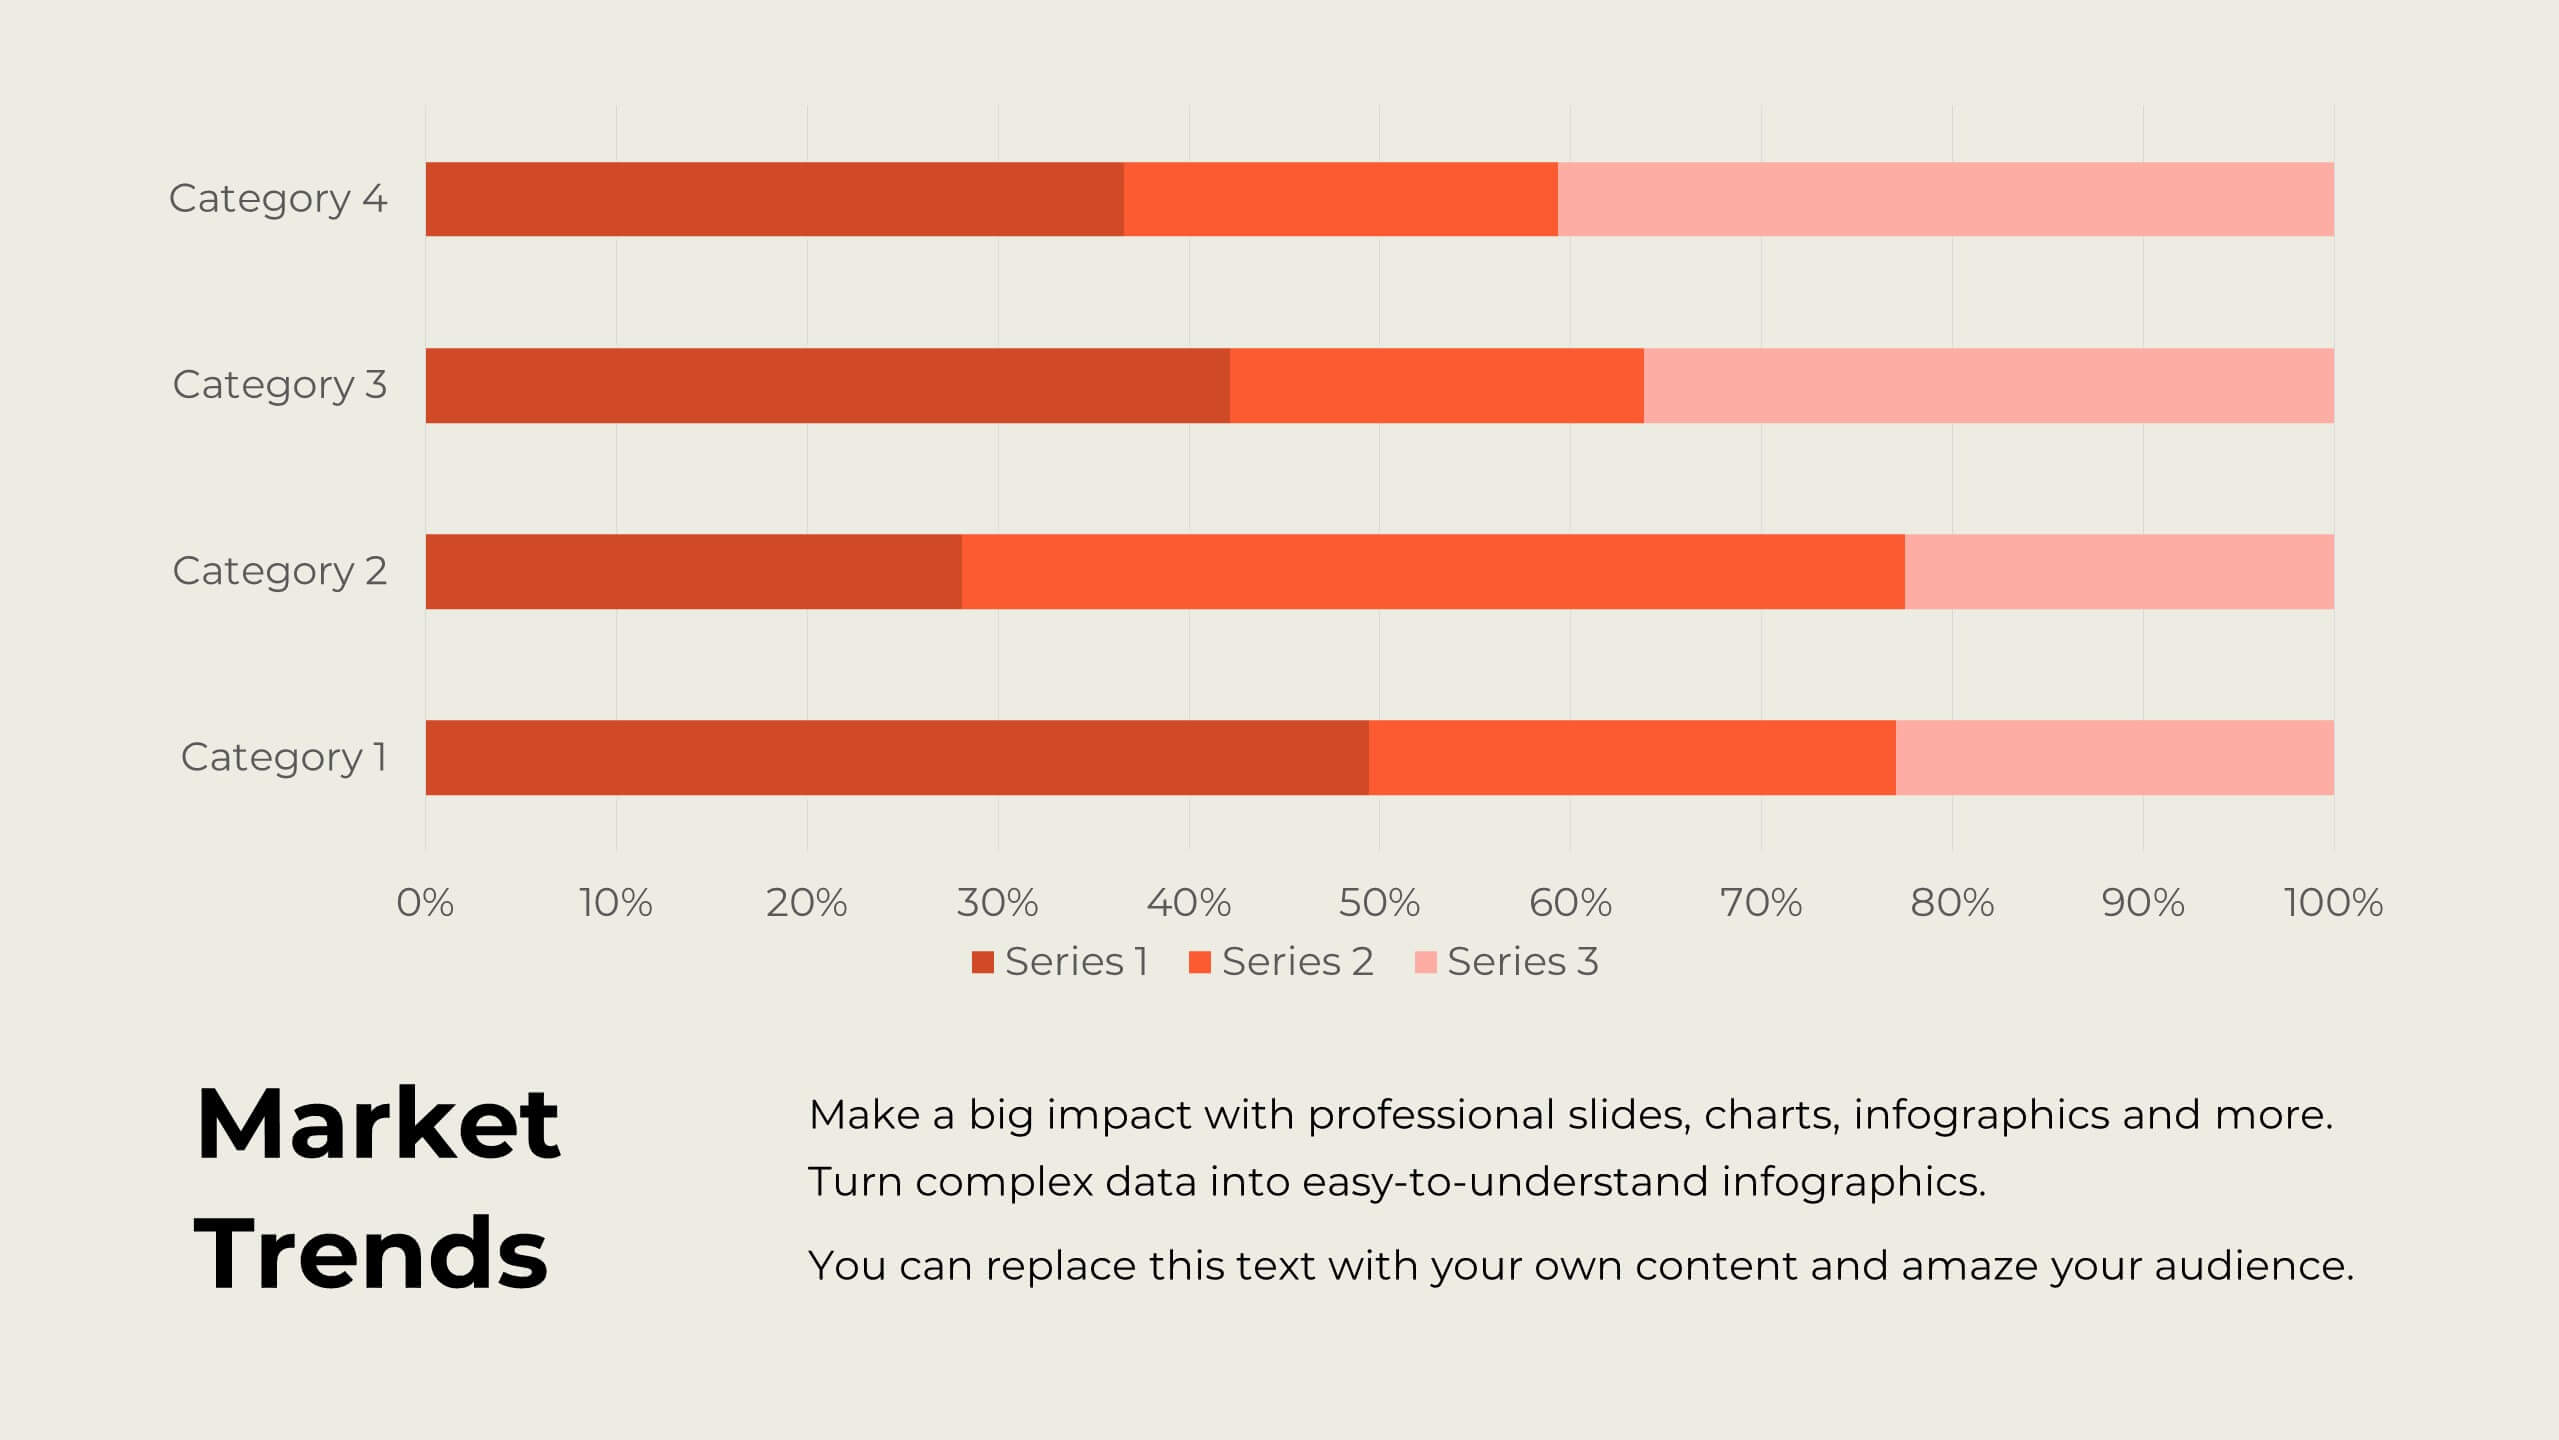
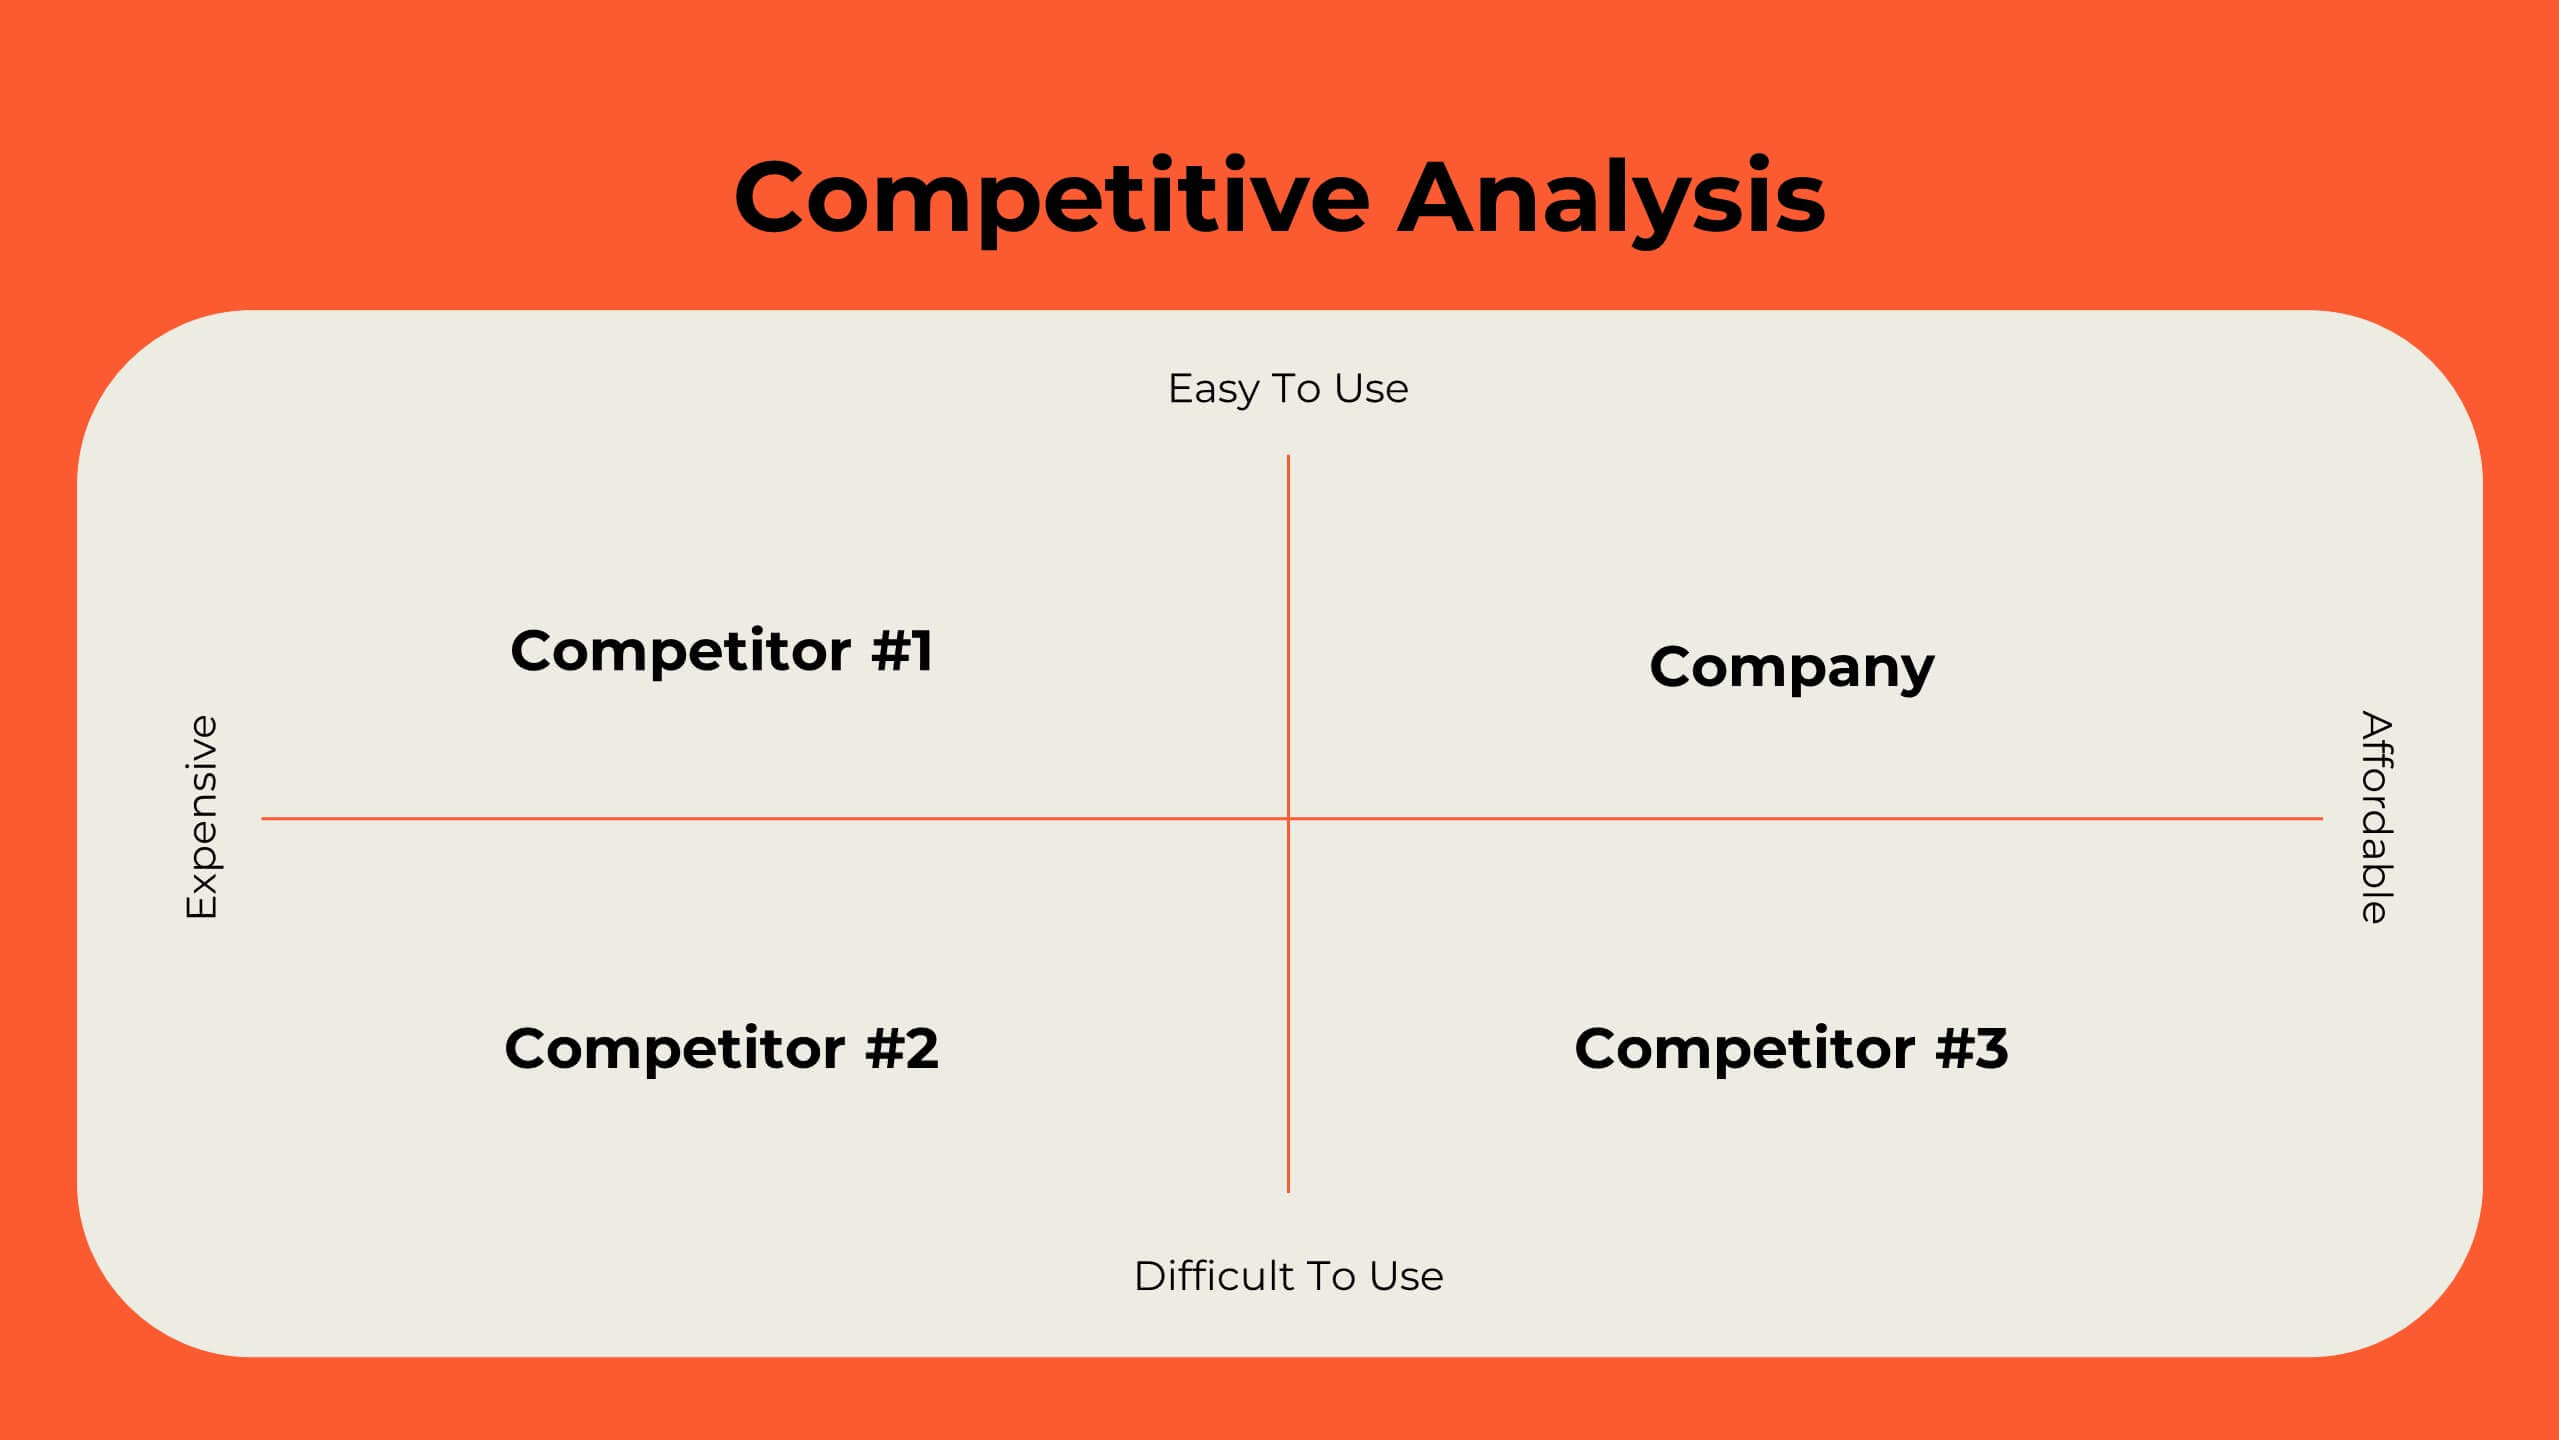
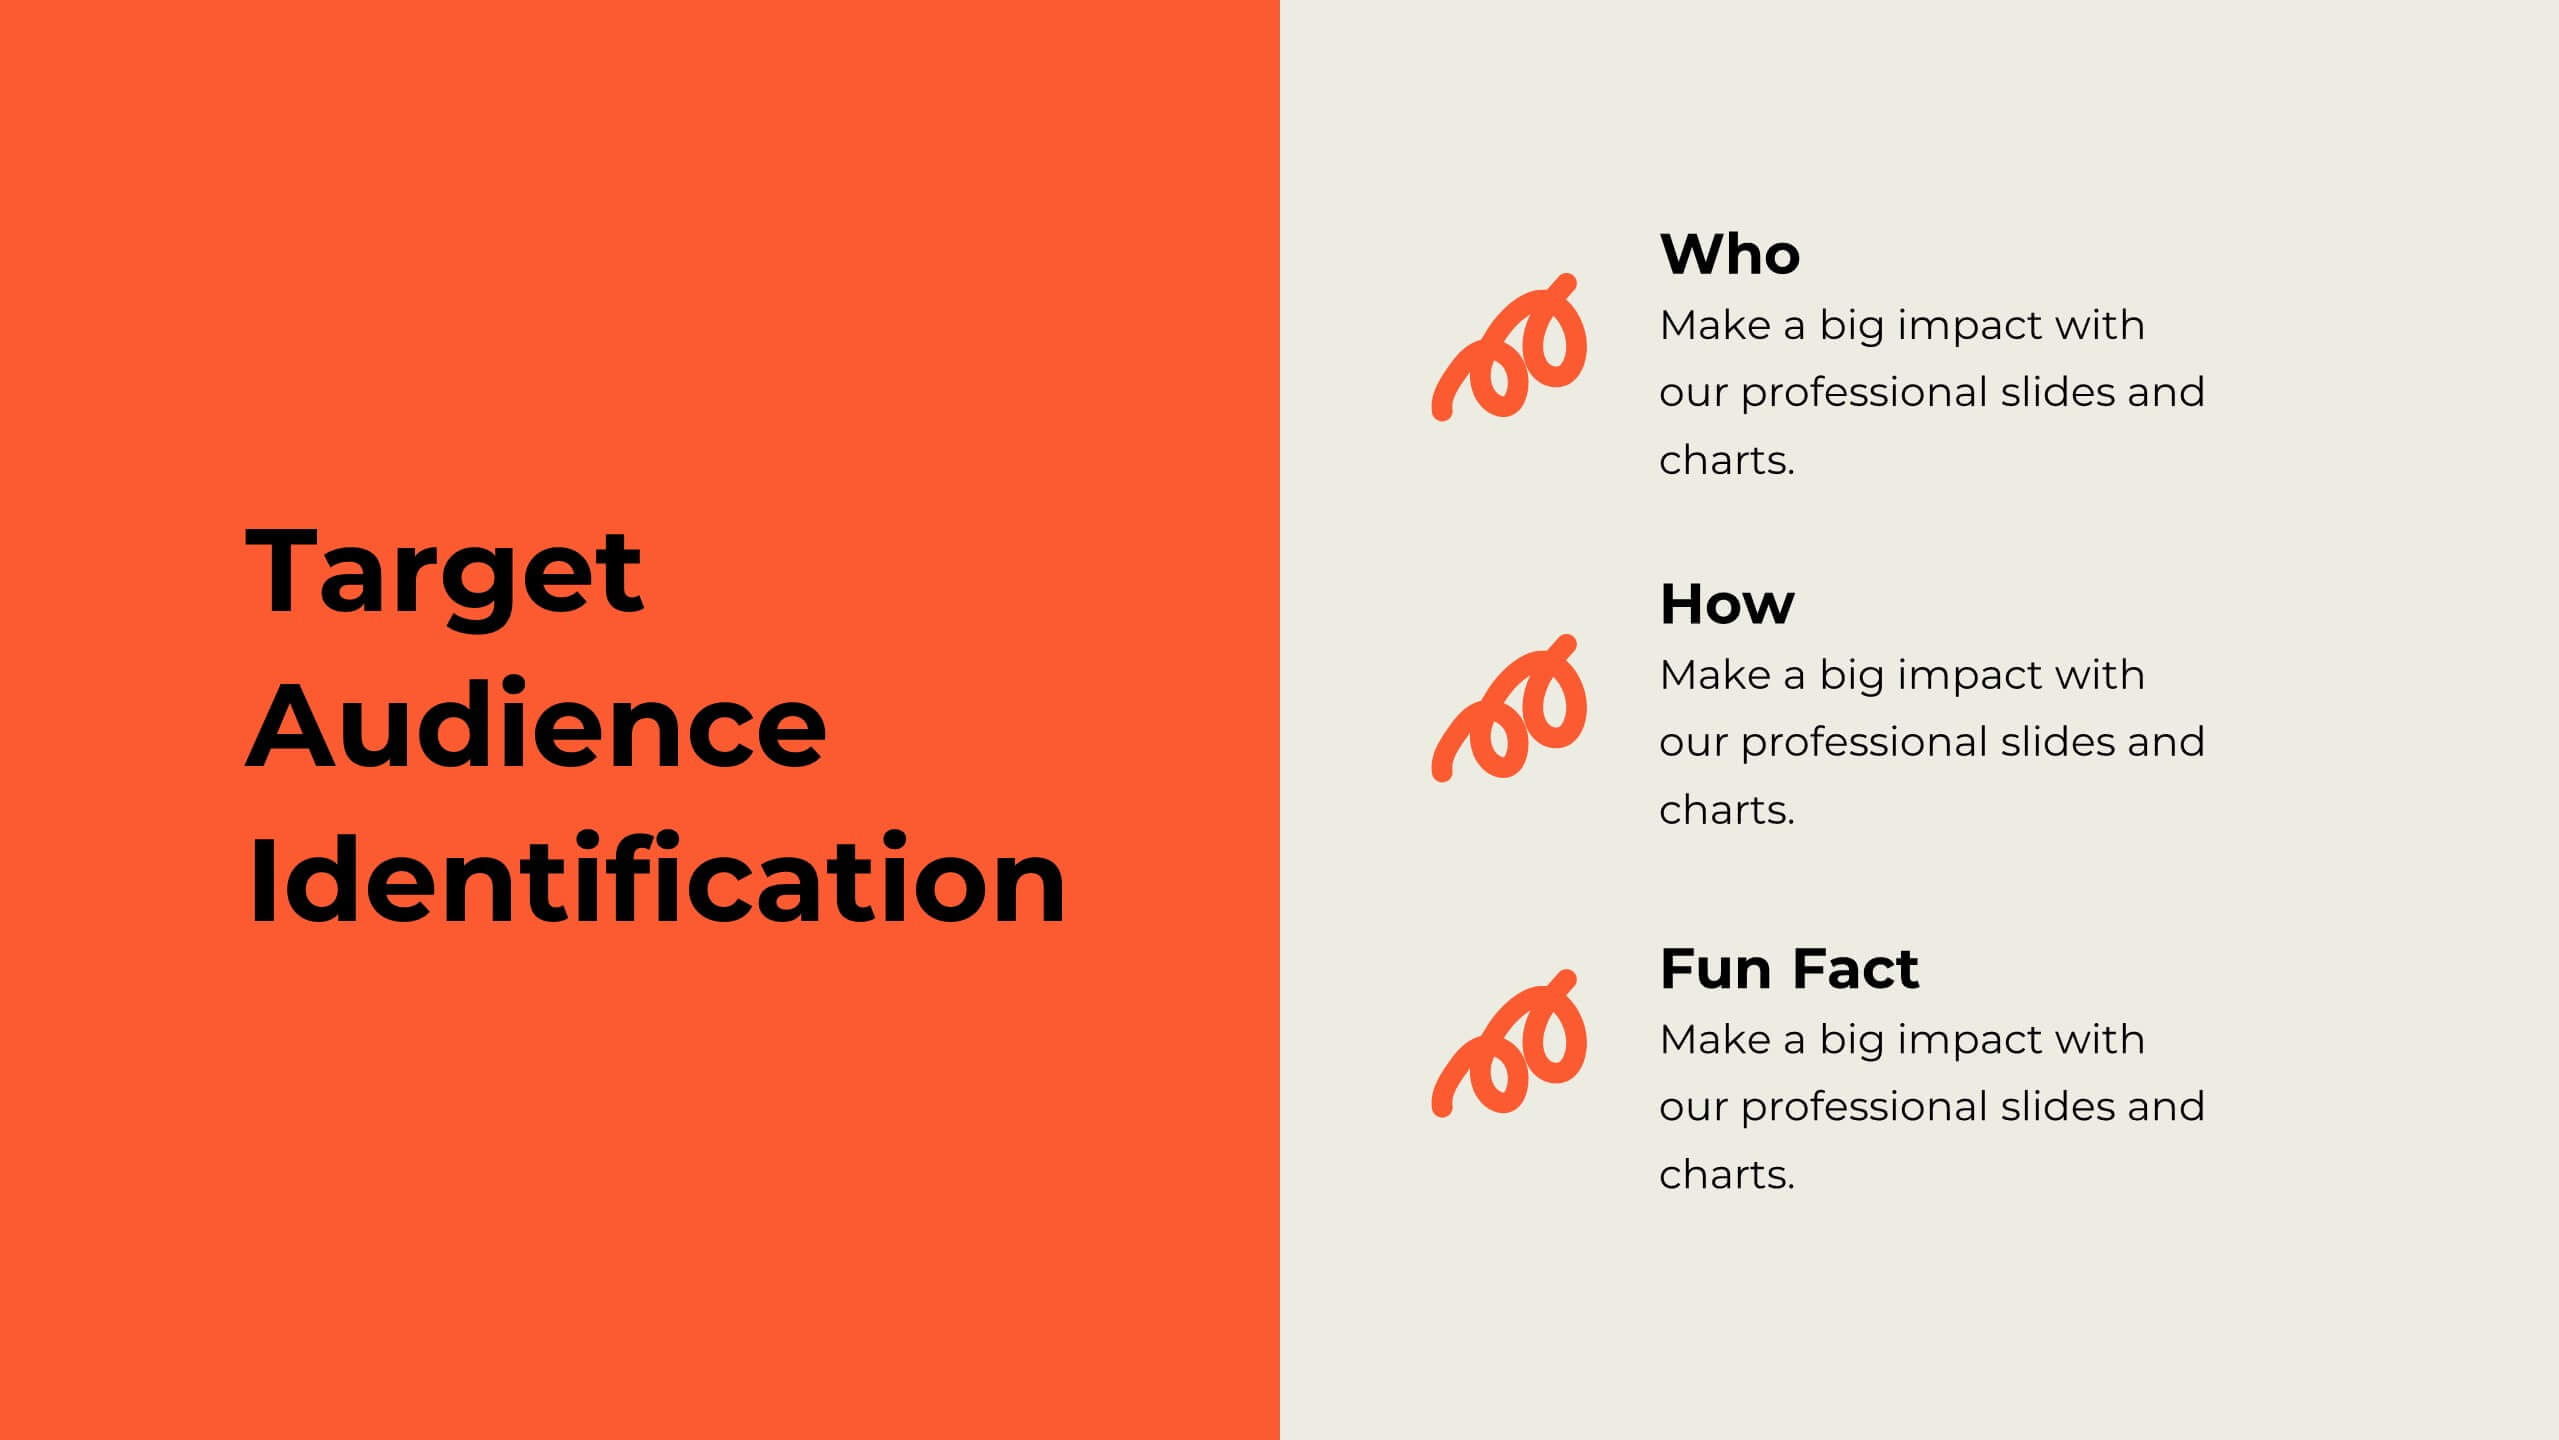
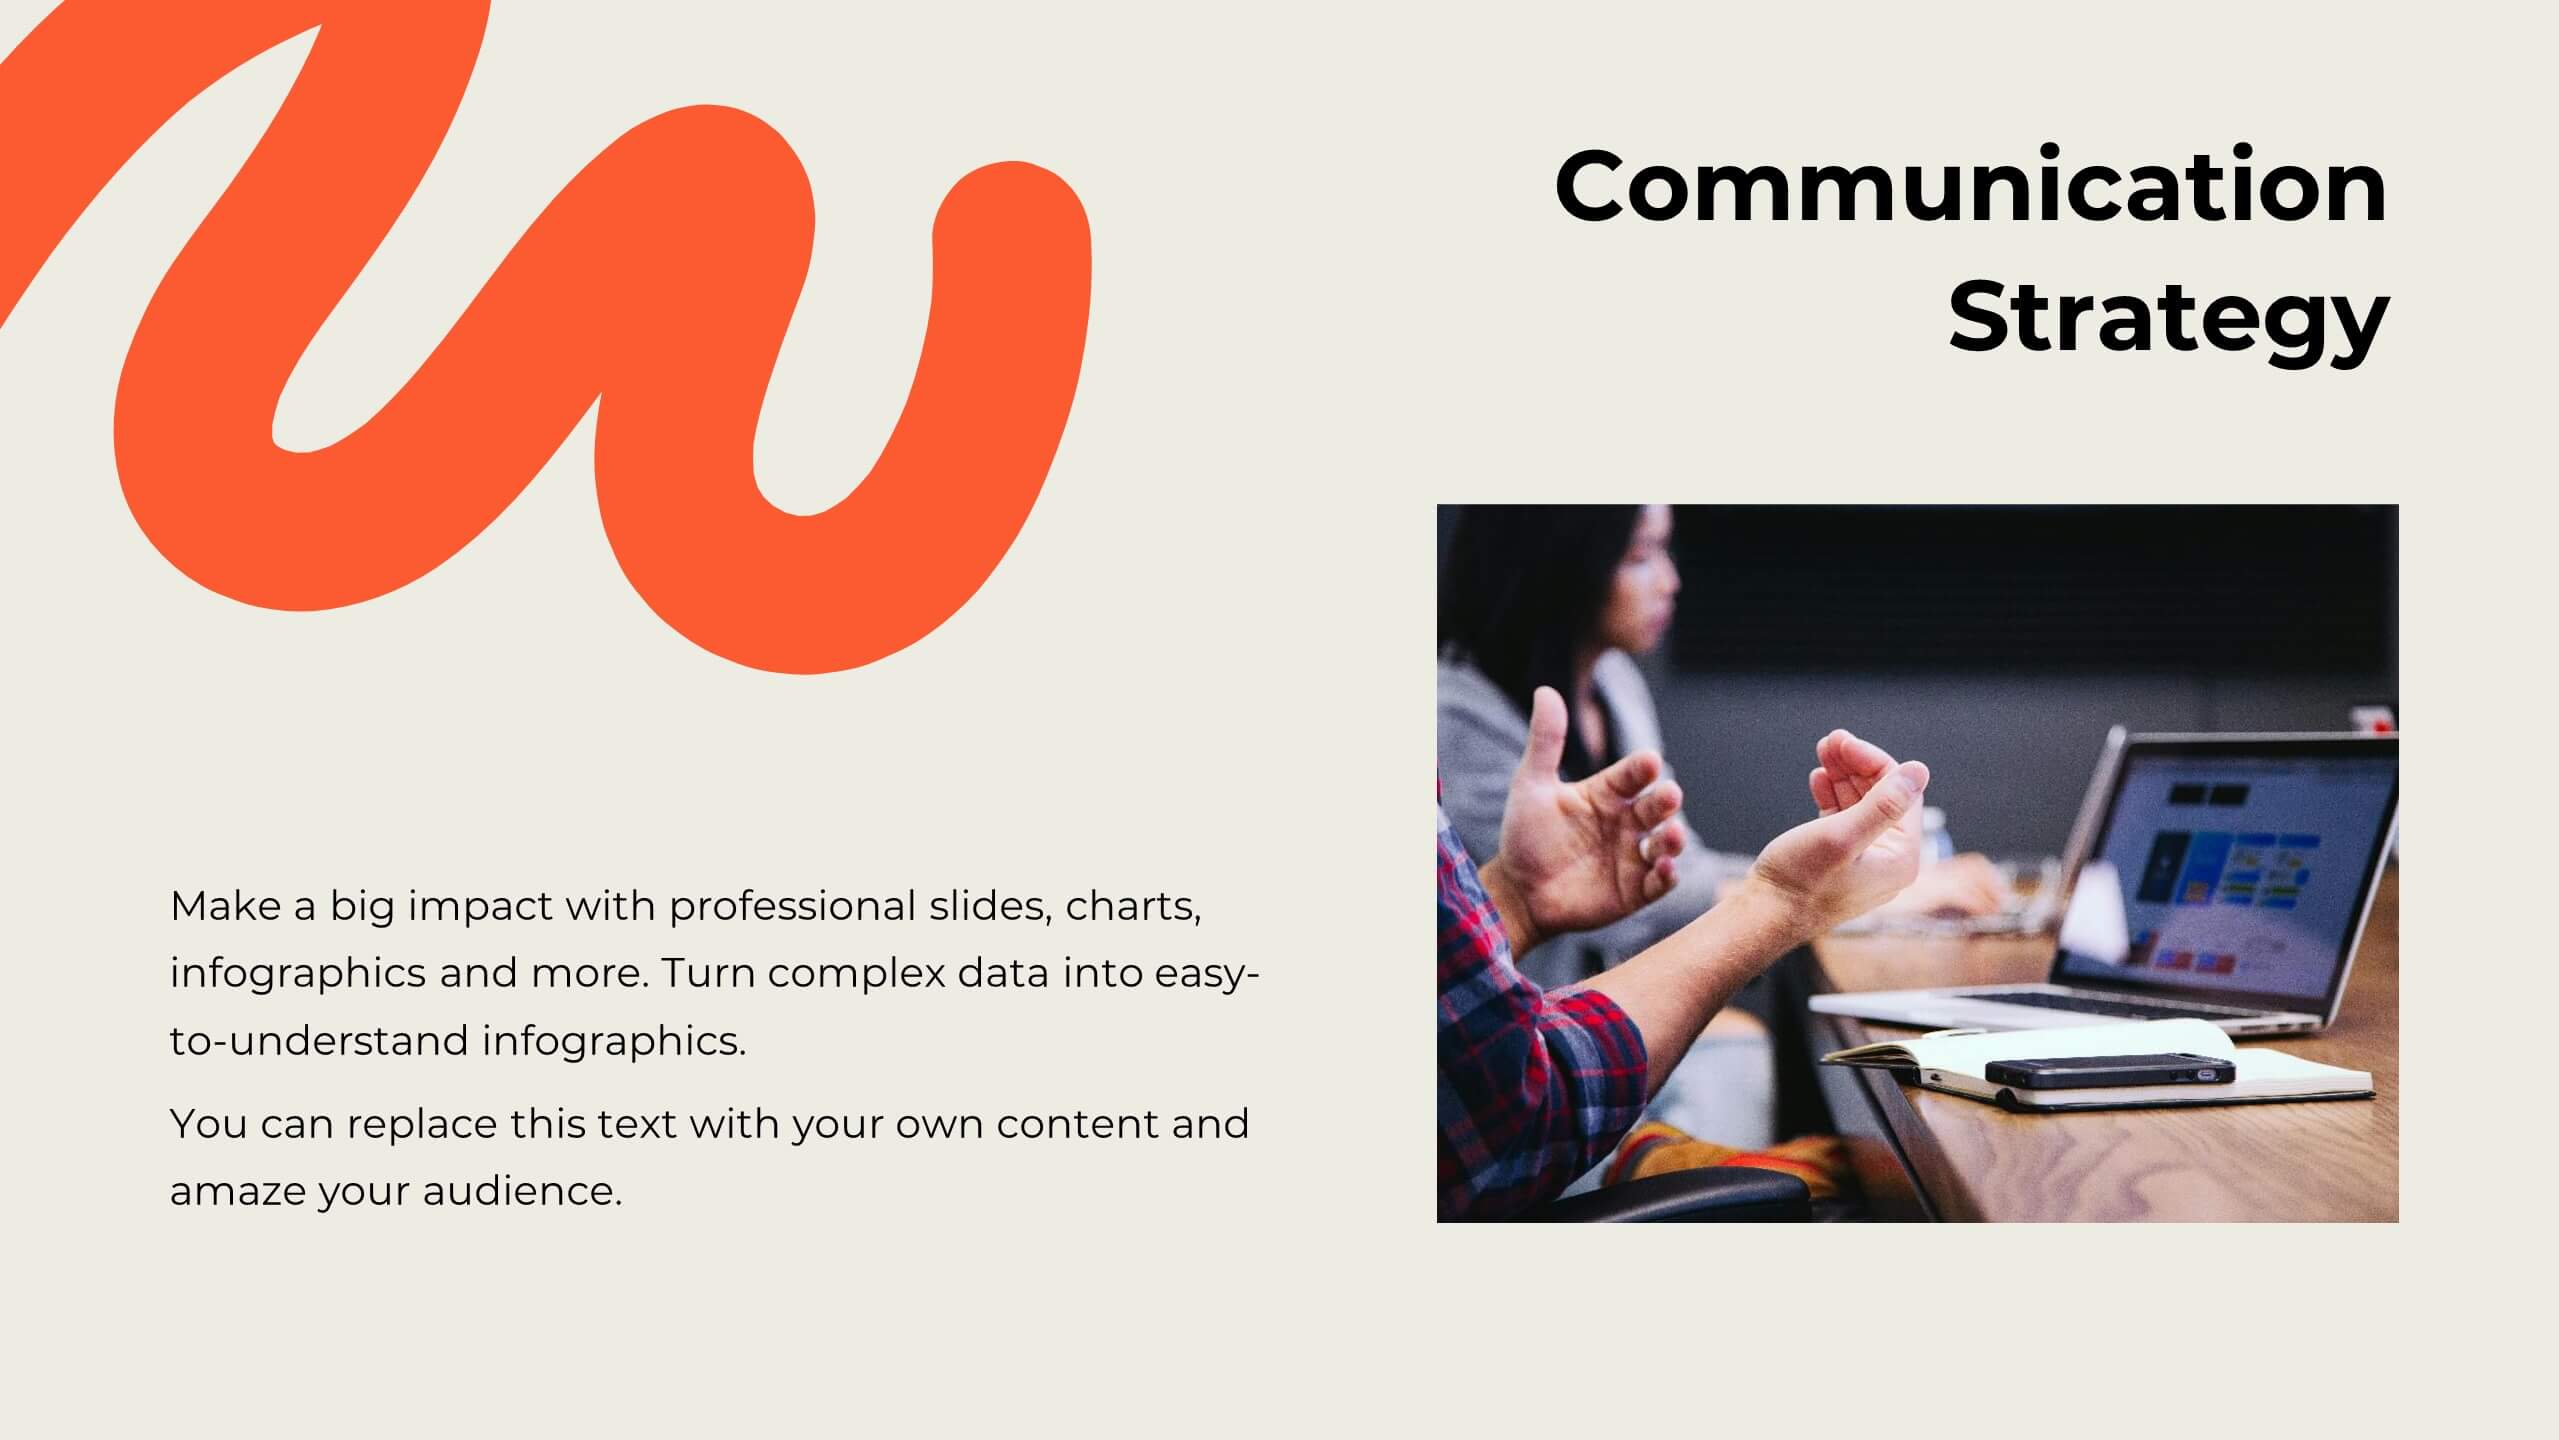
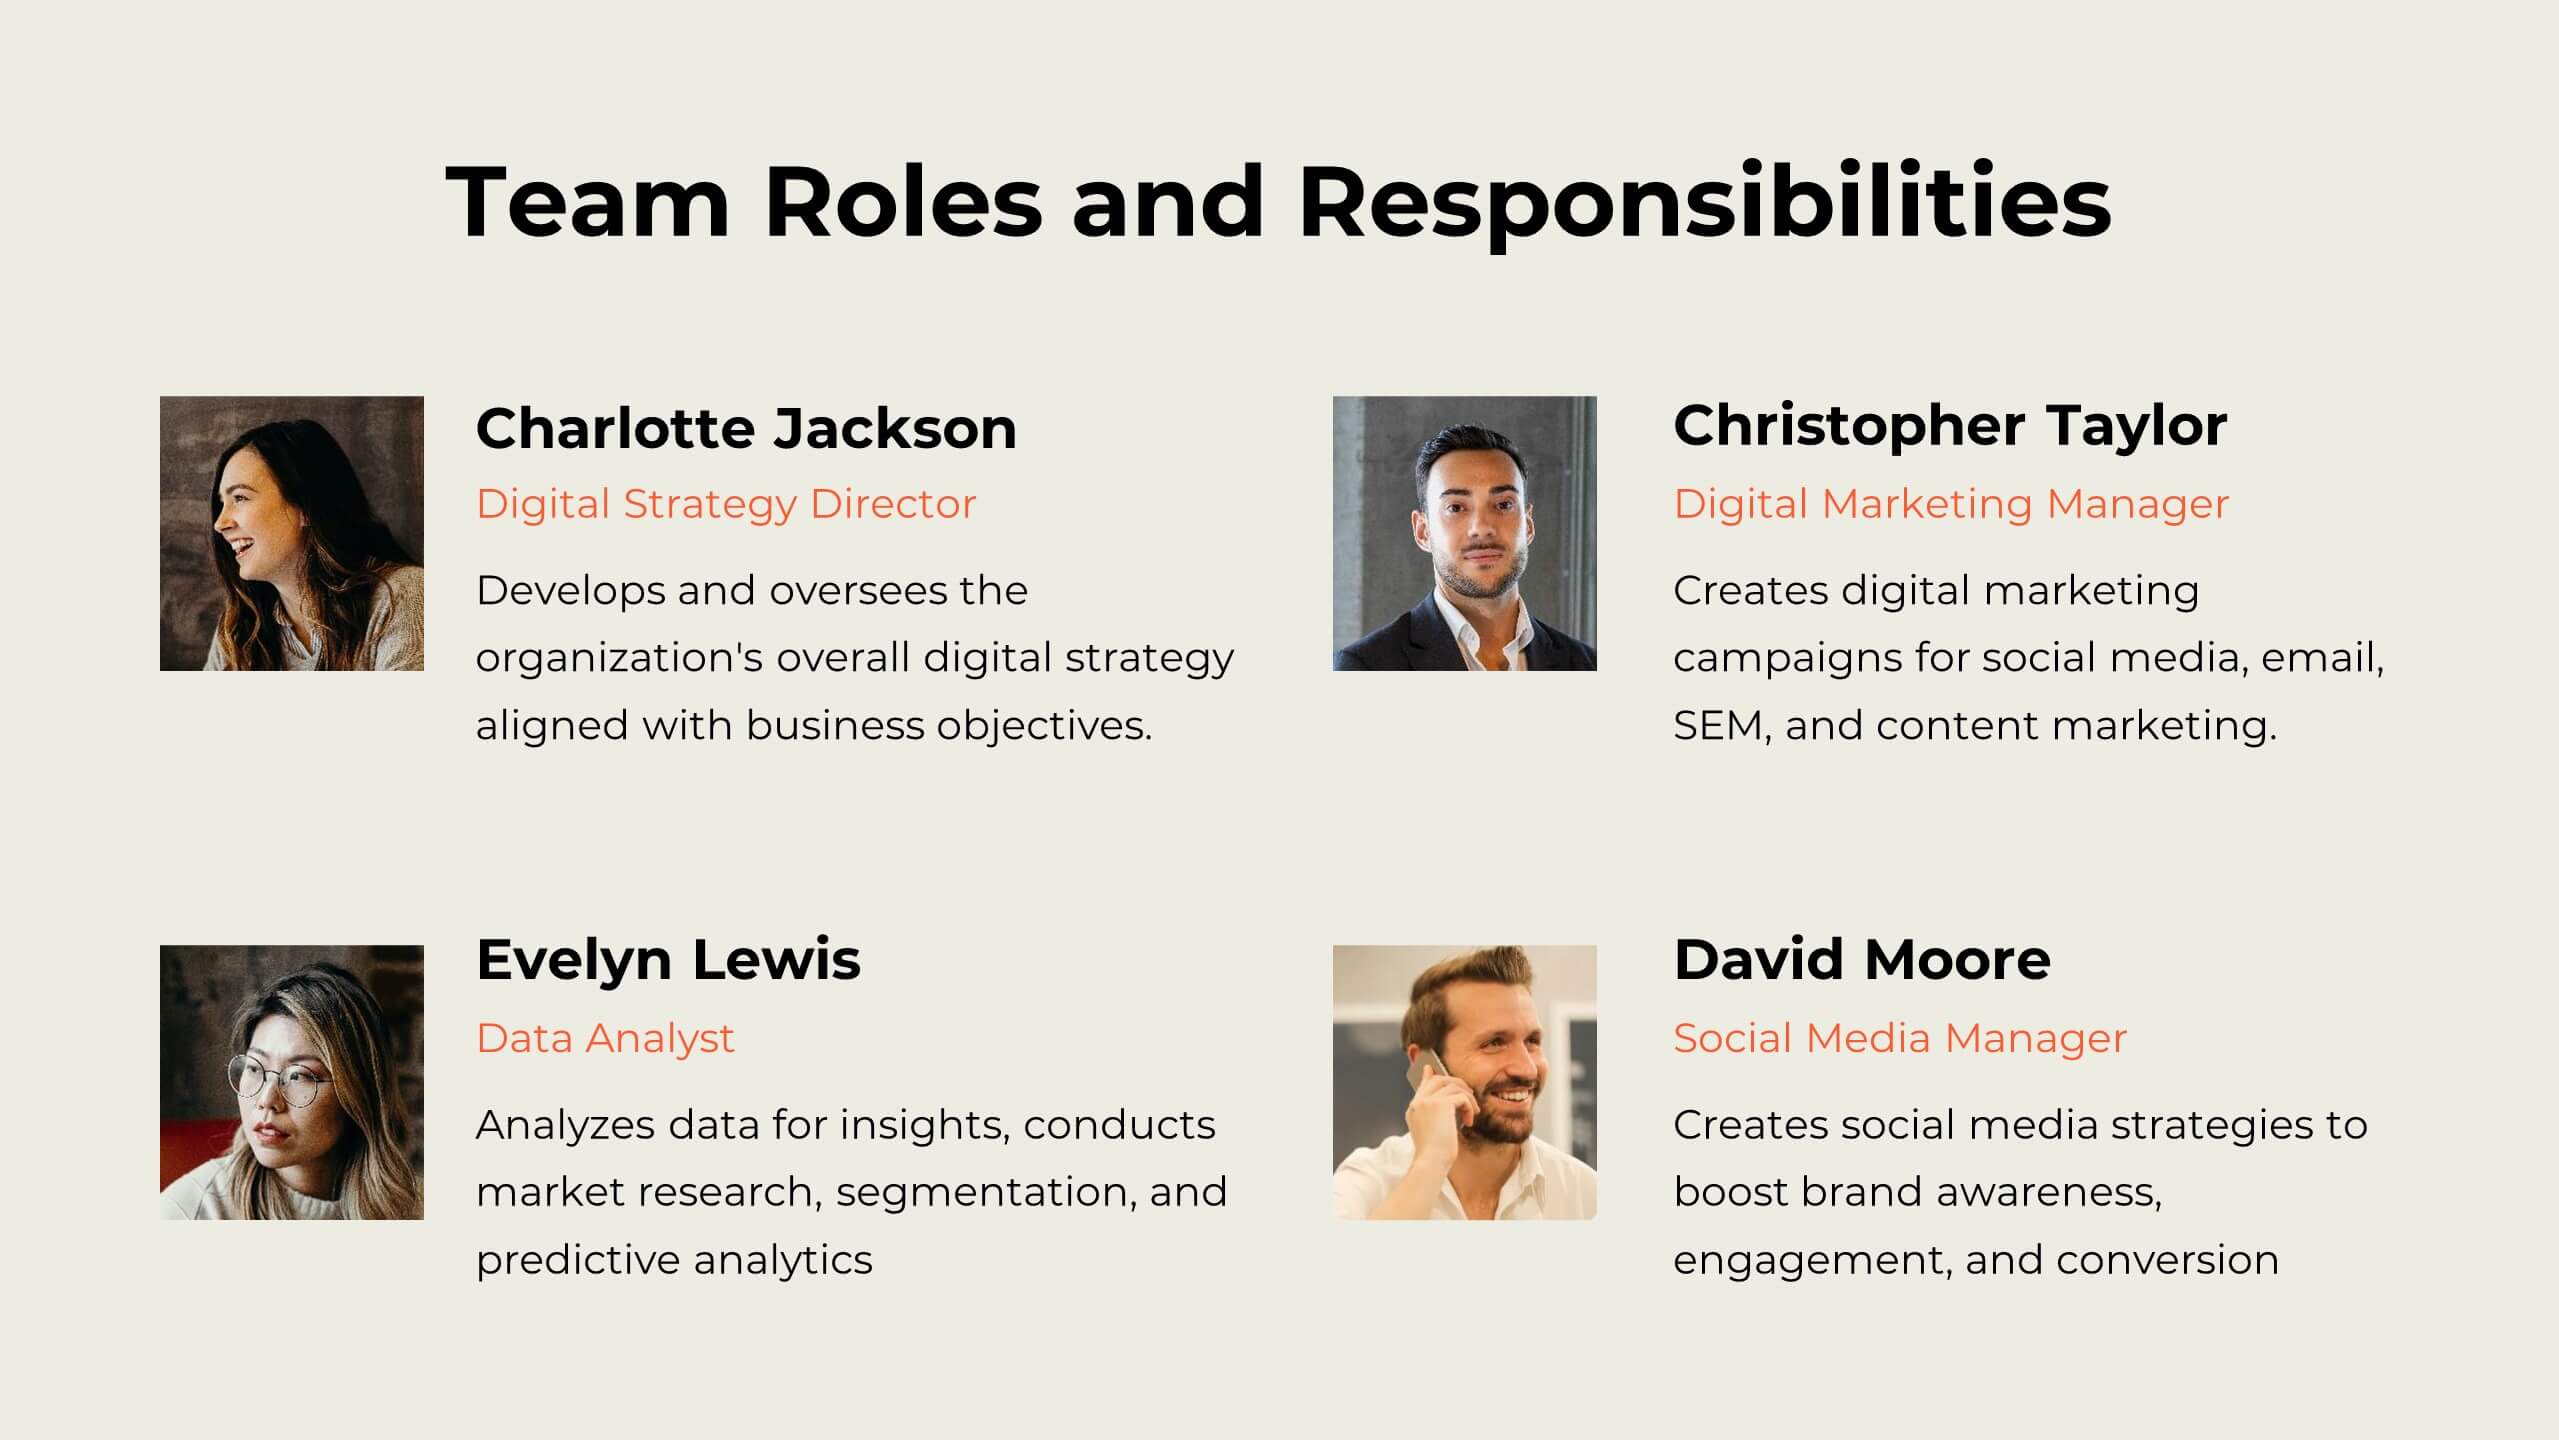
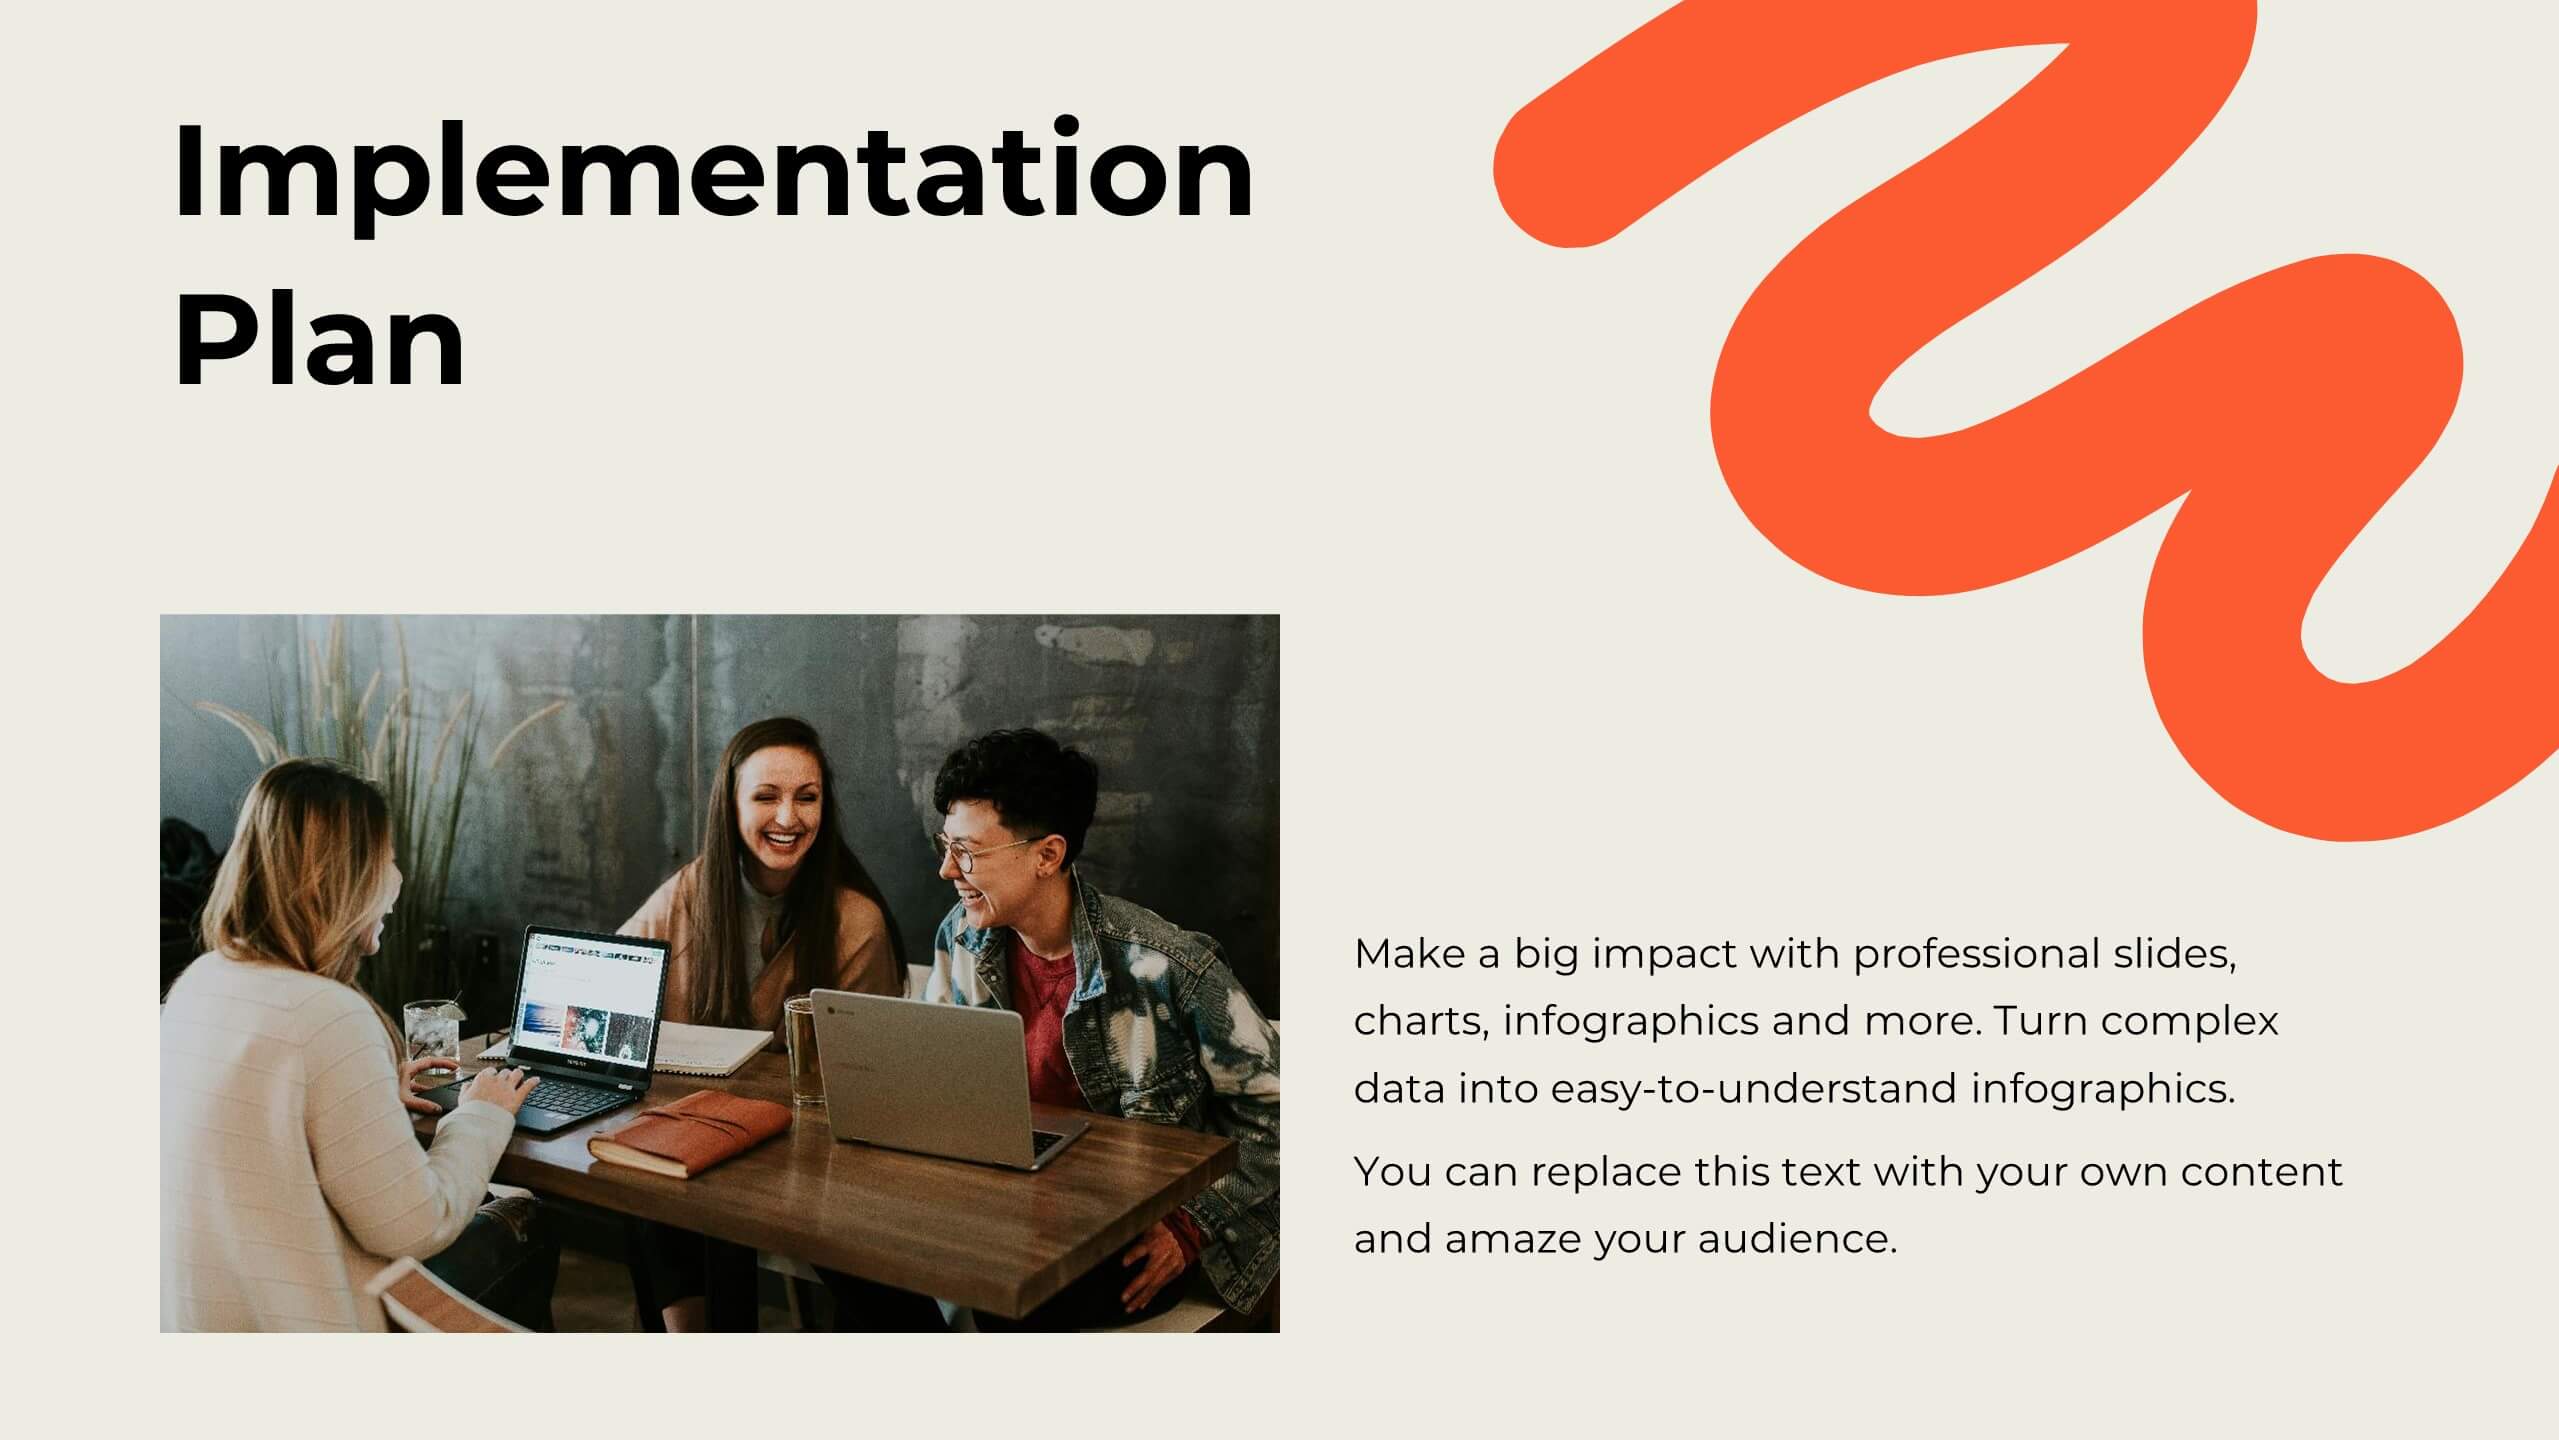
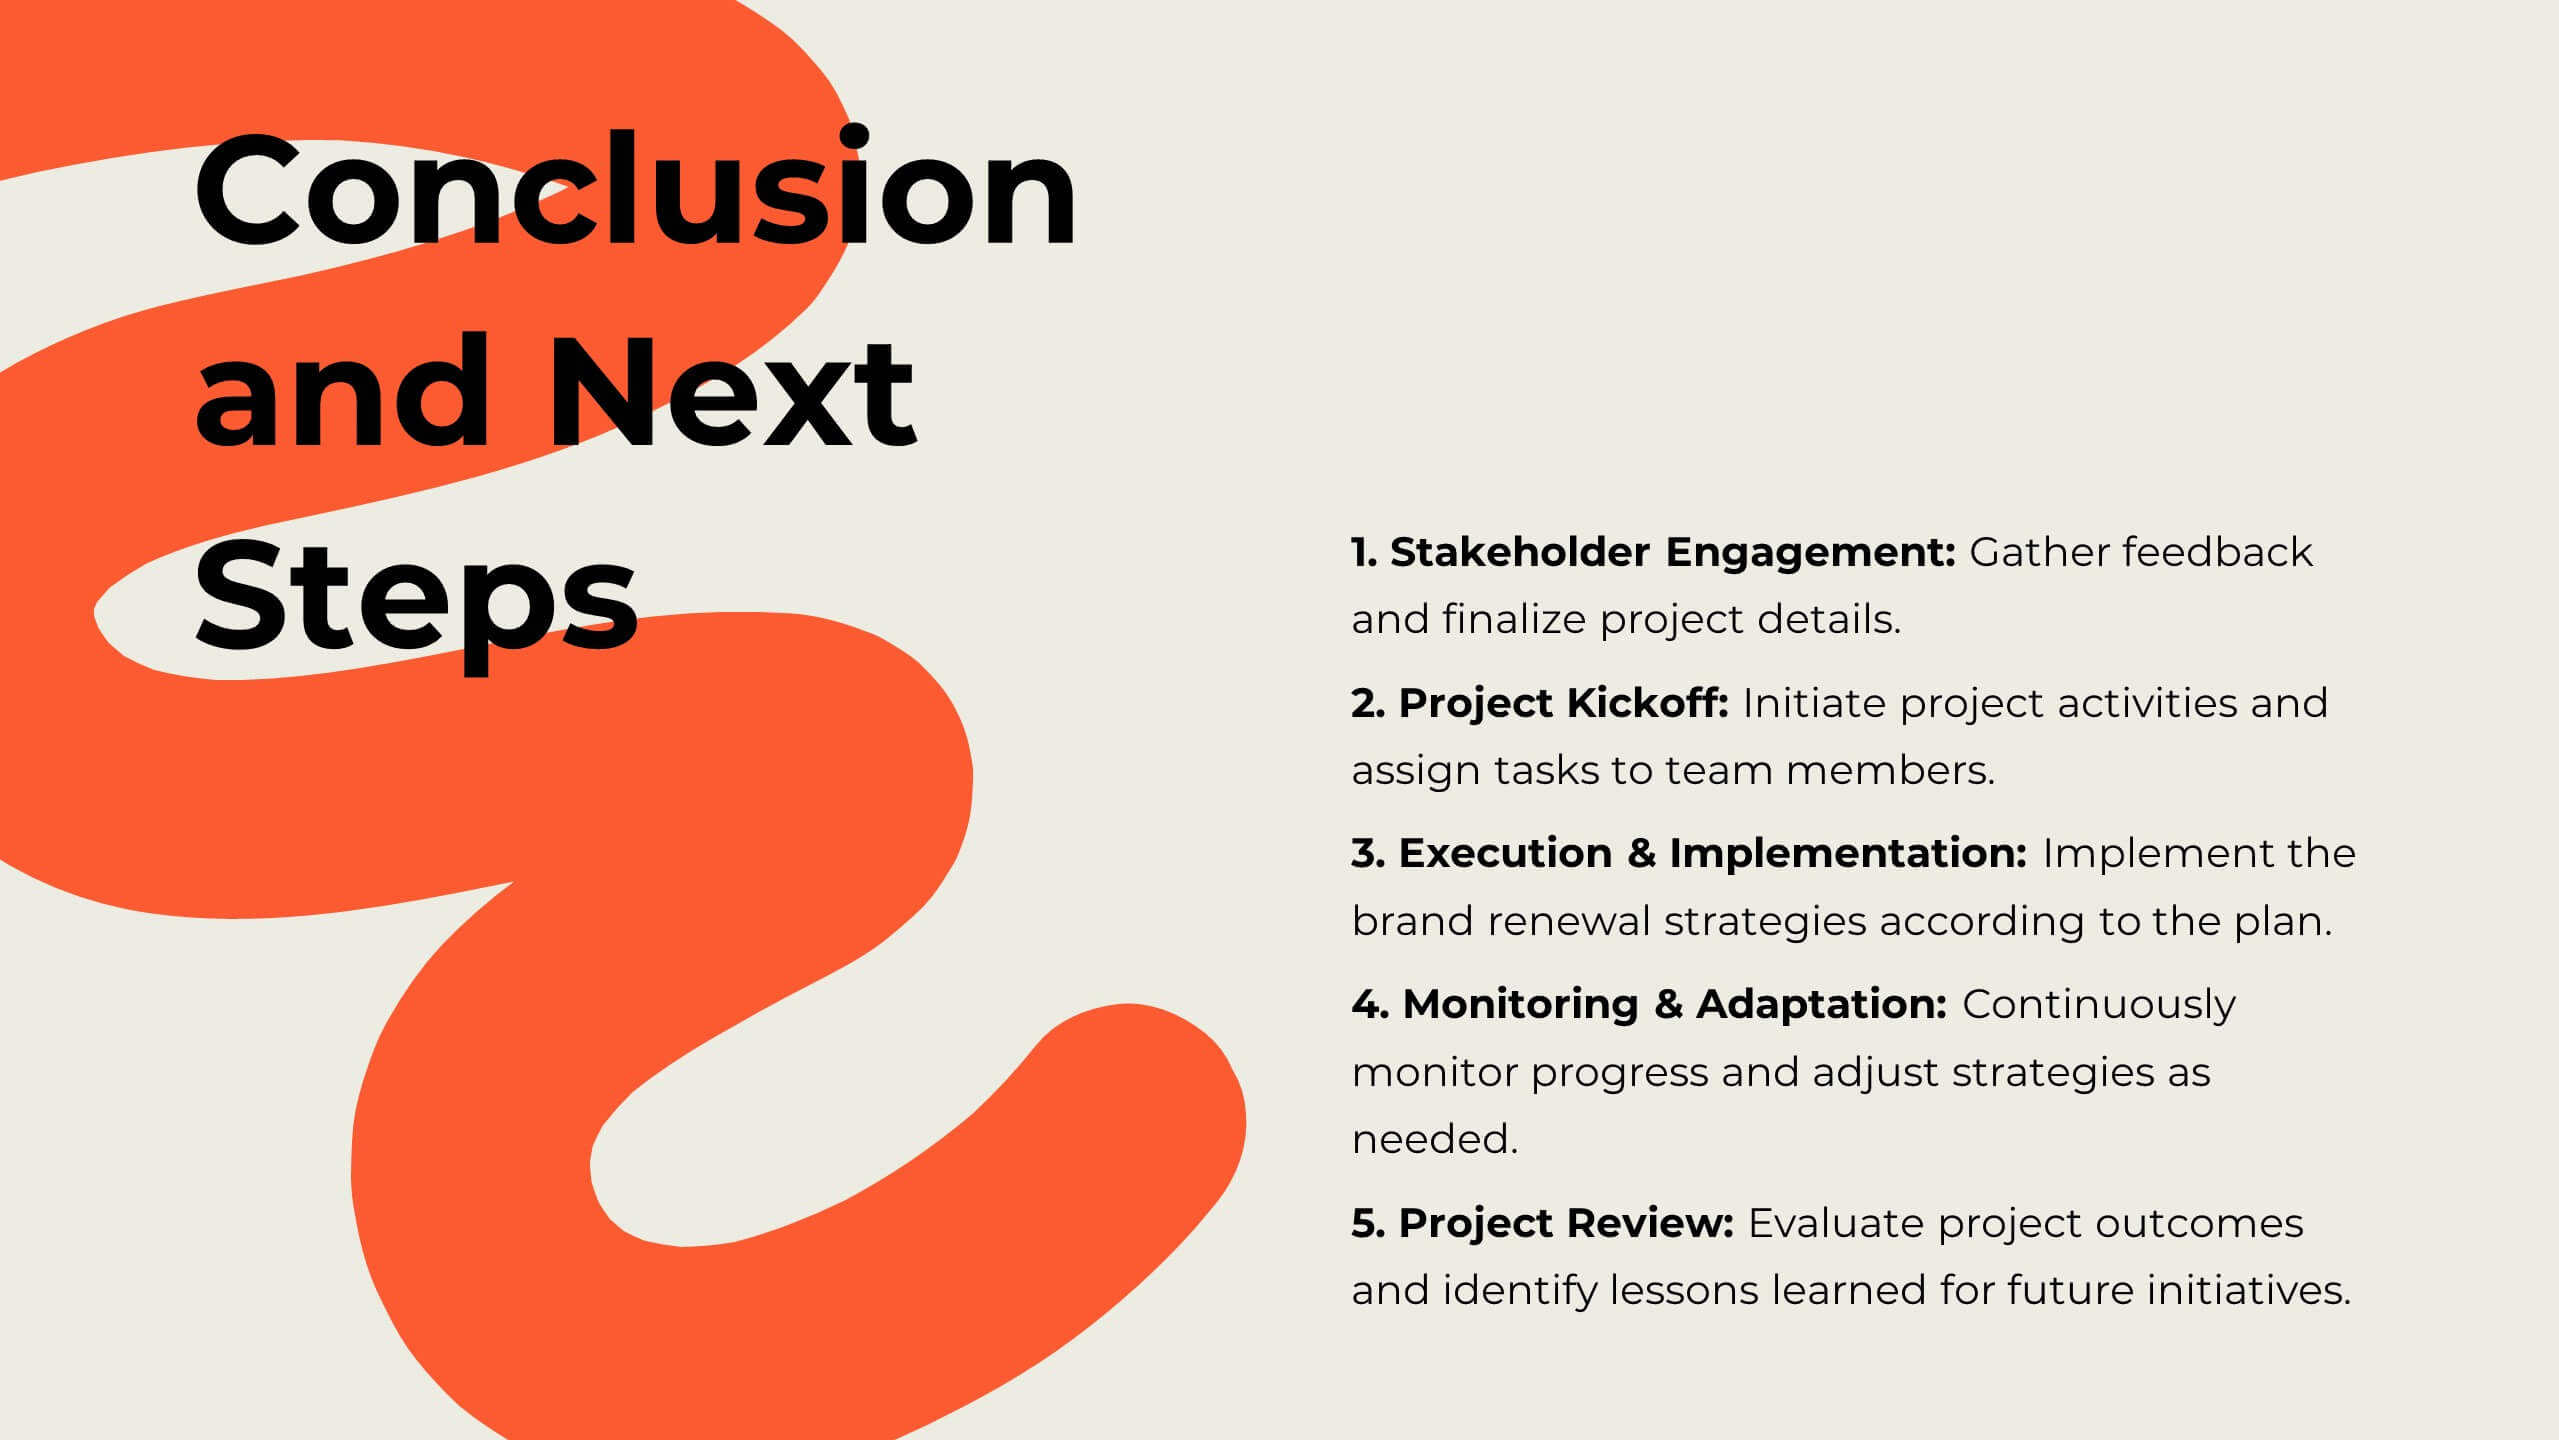
Mirage Digital Strategy Presentation
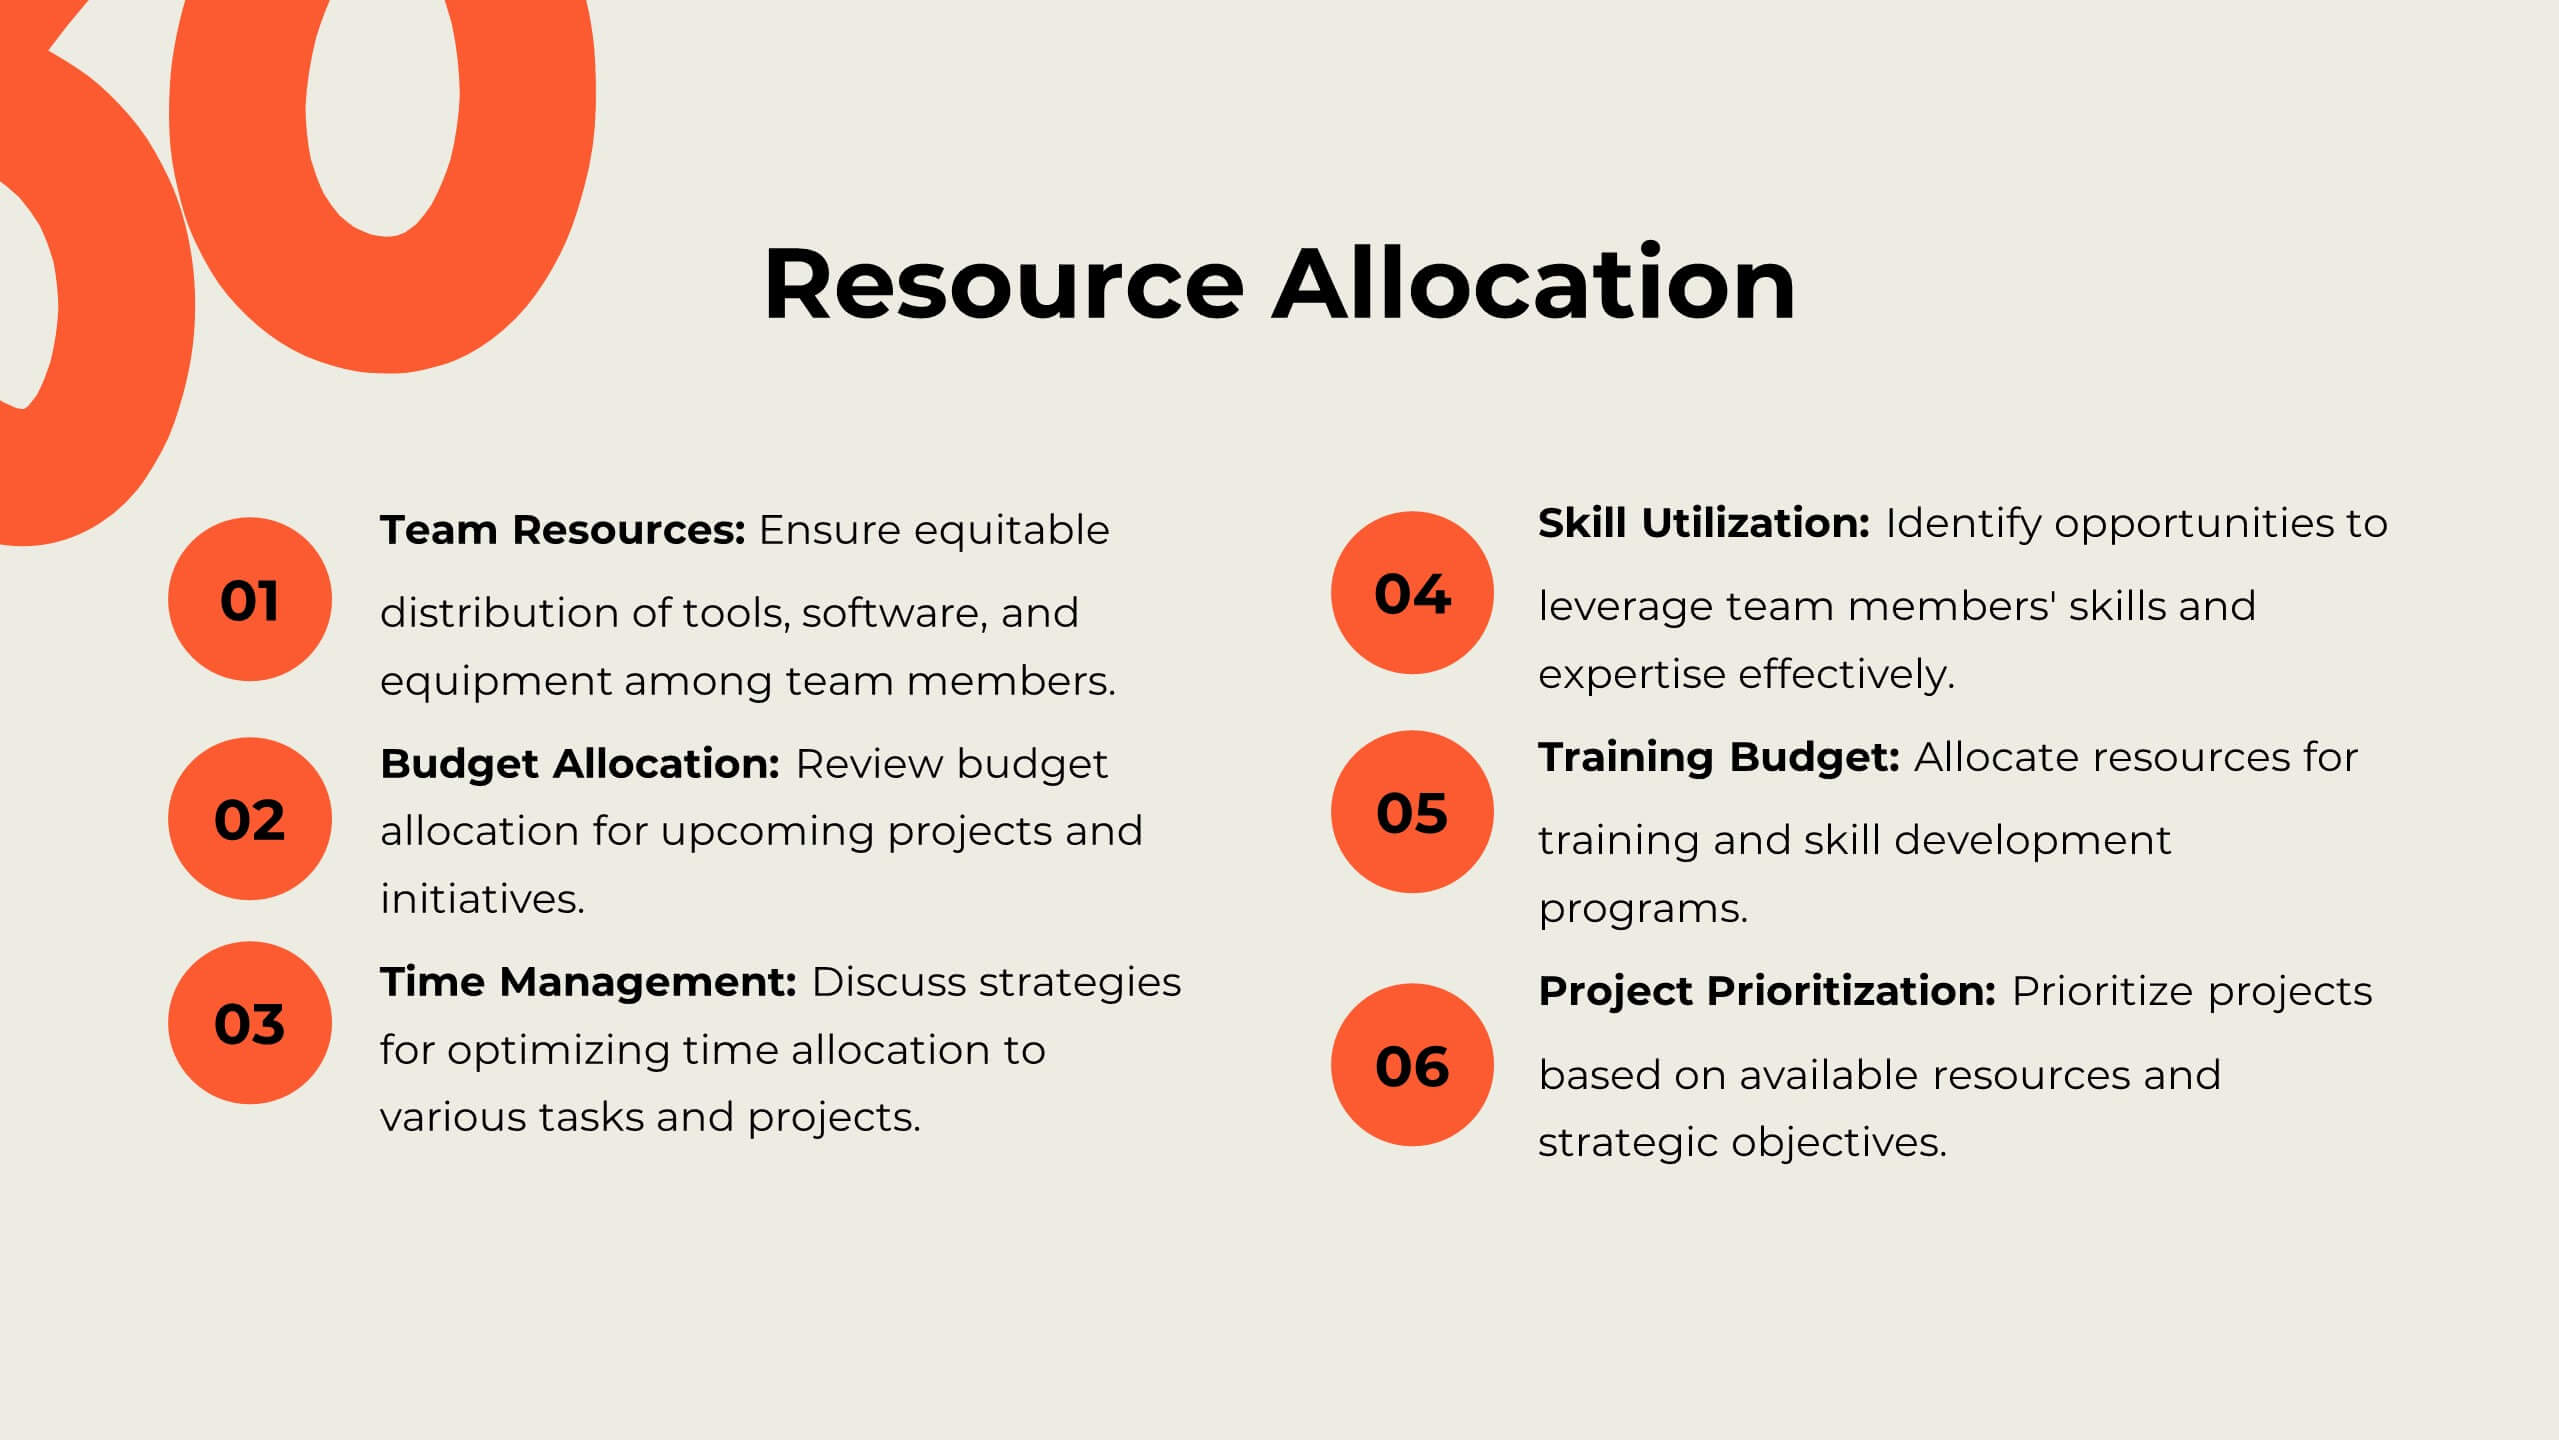
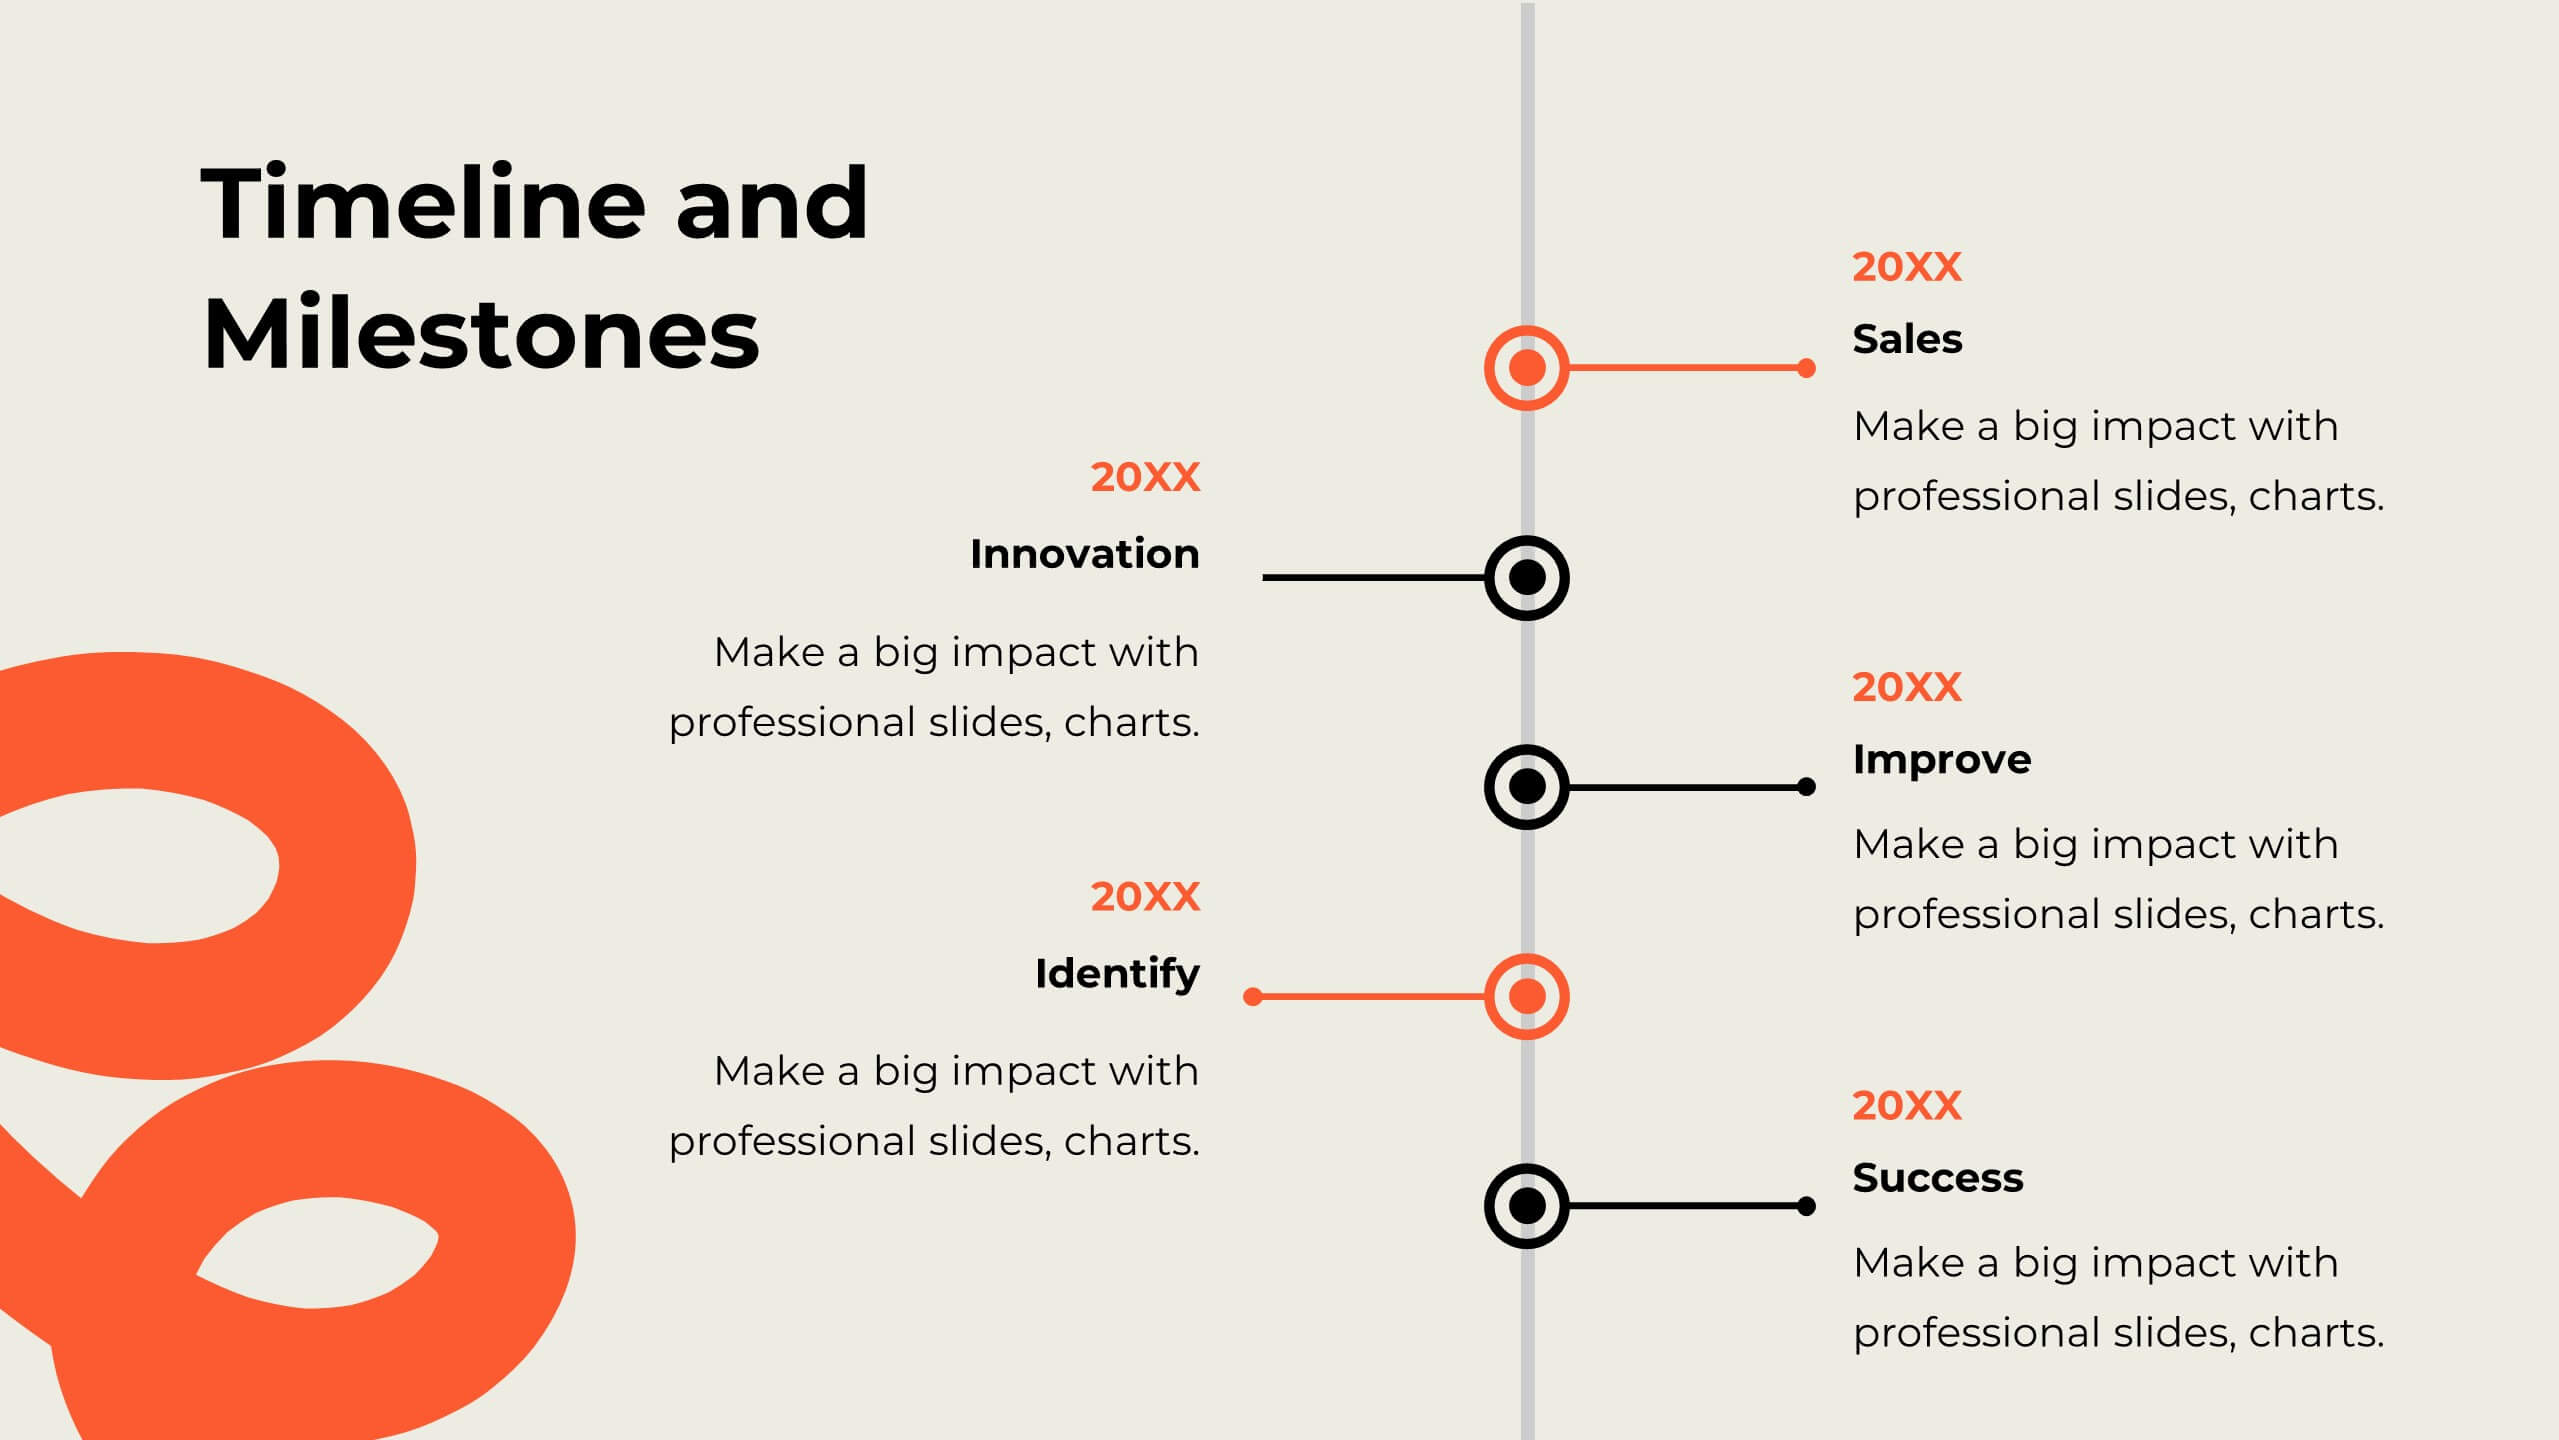
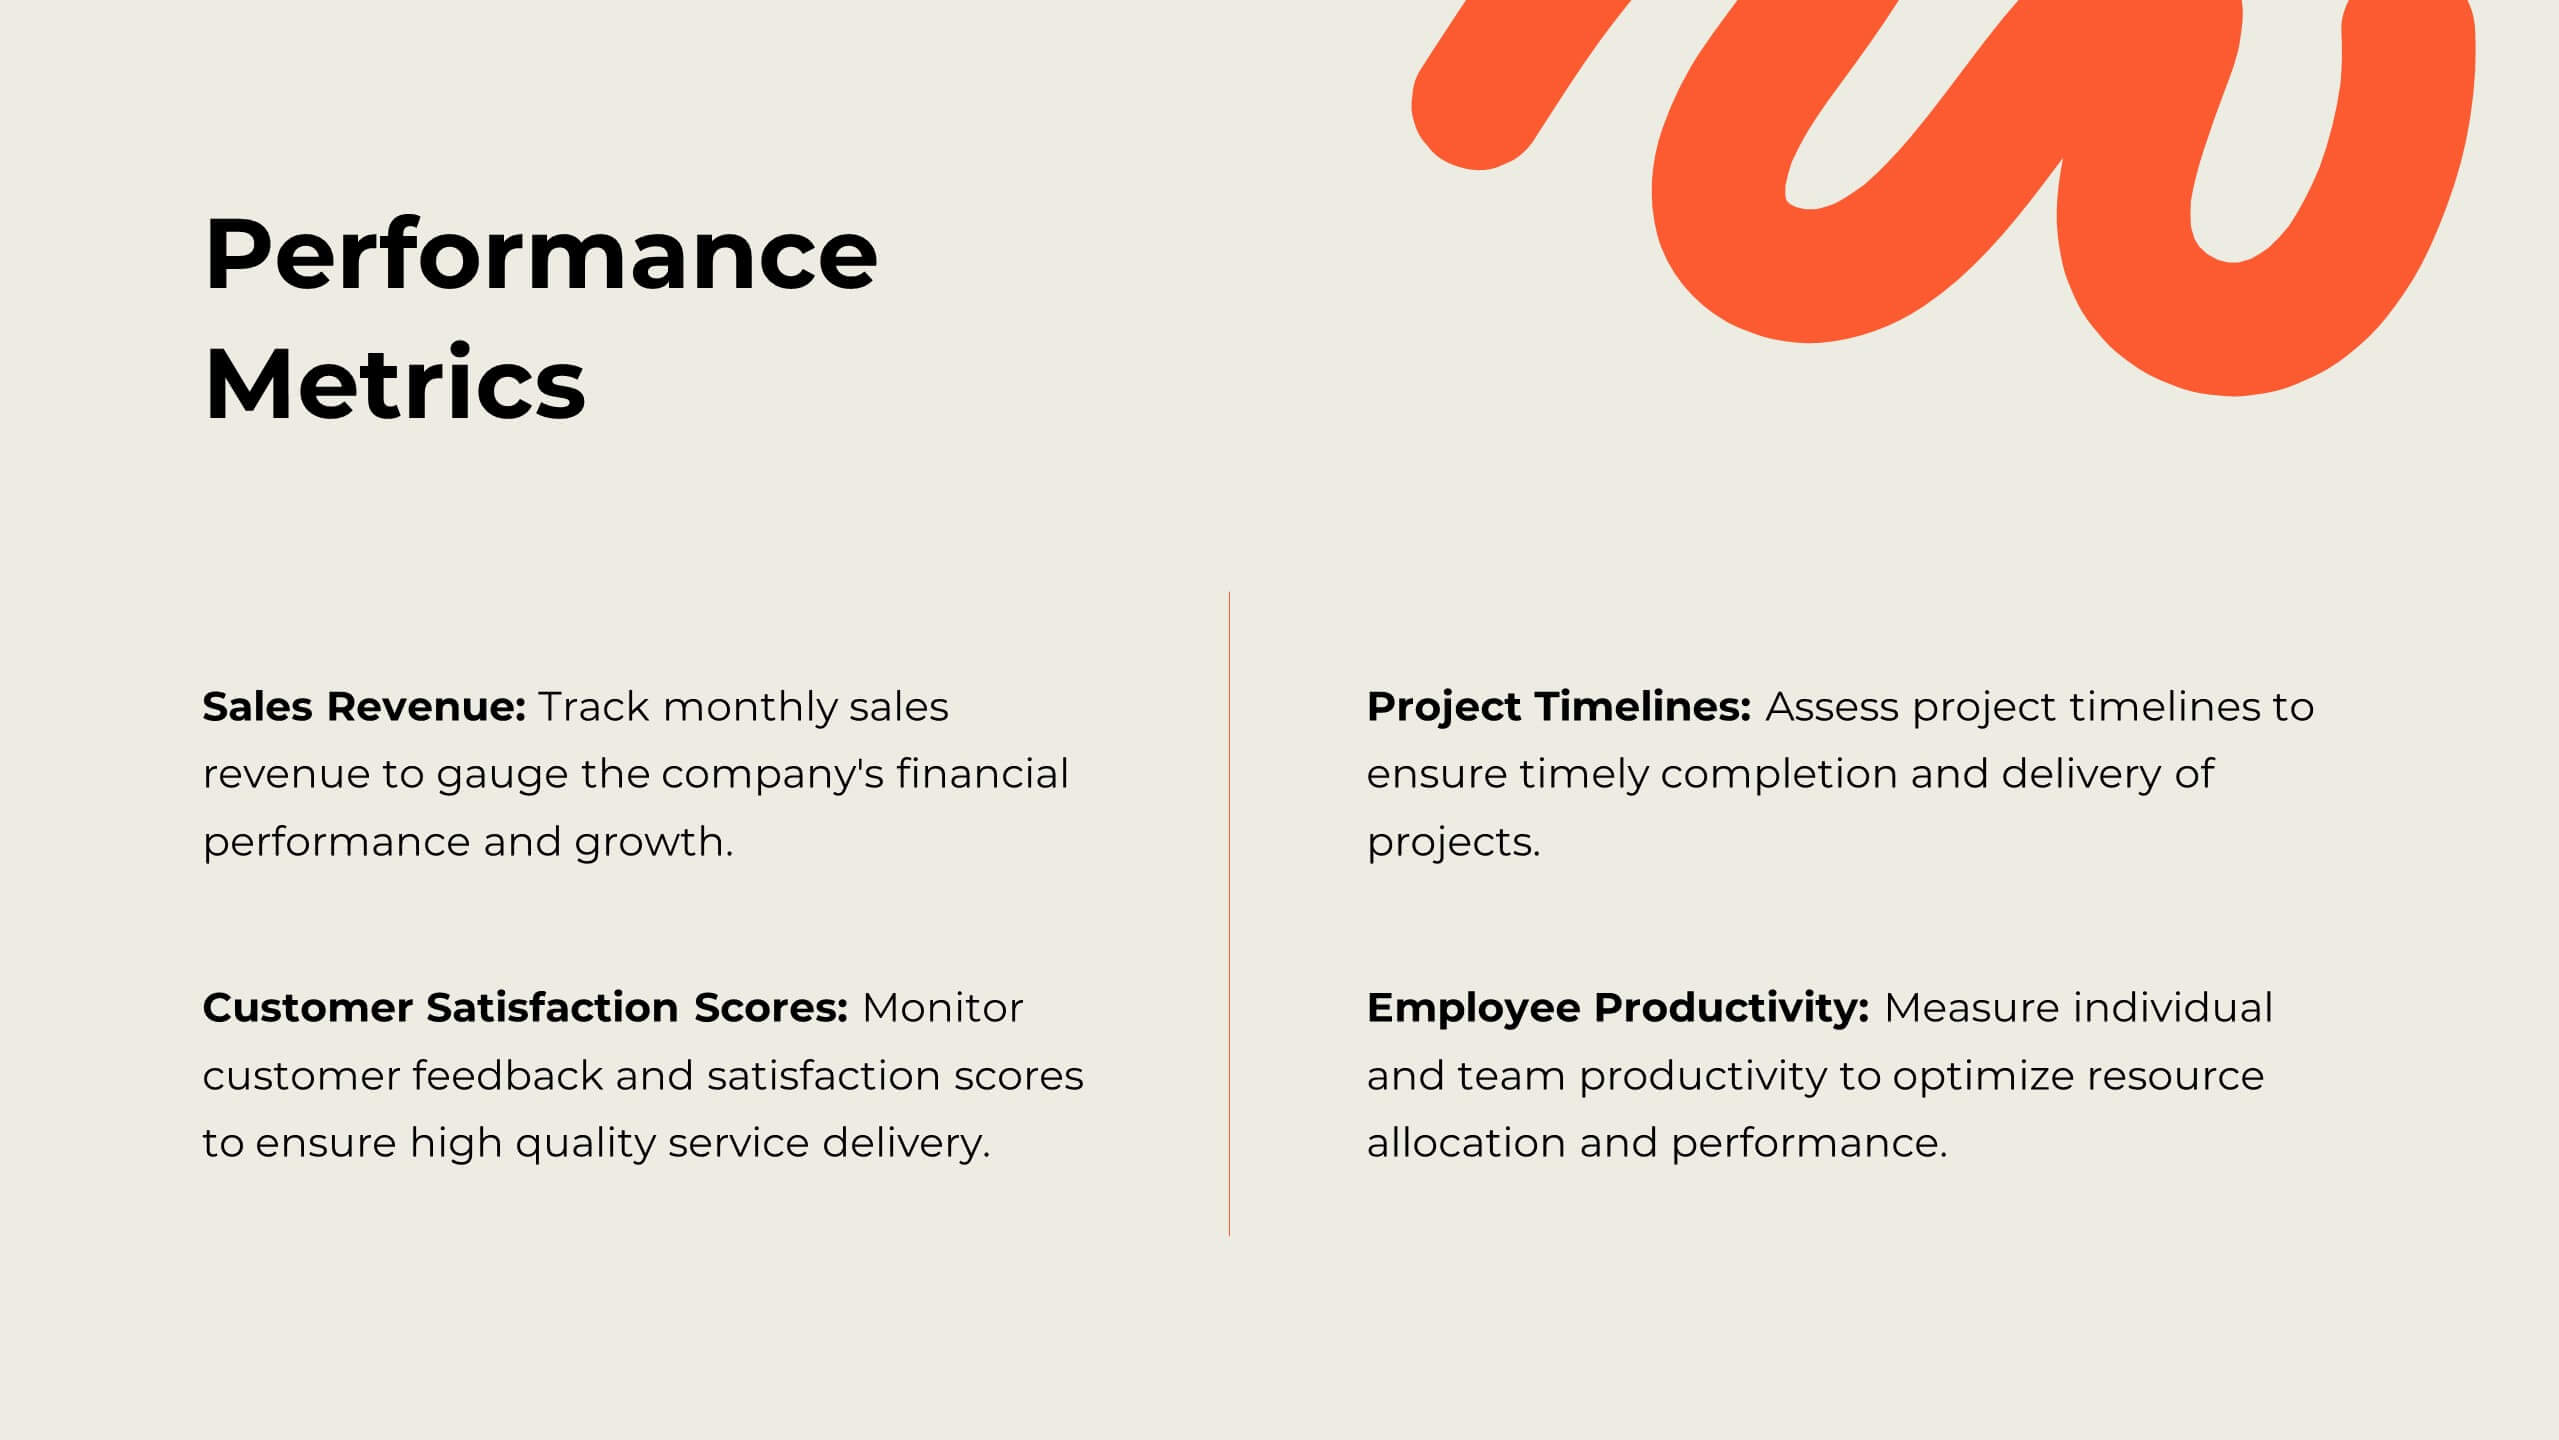
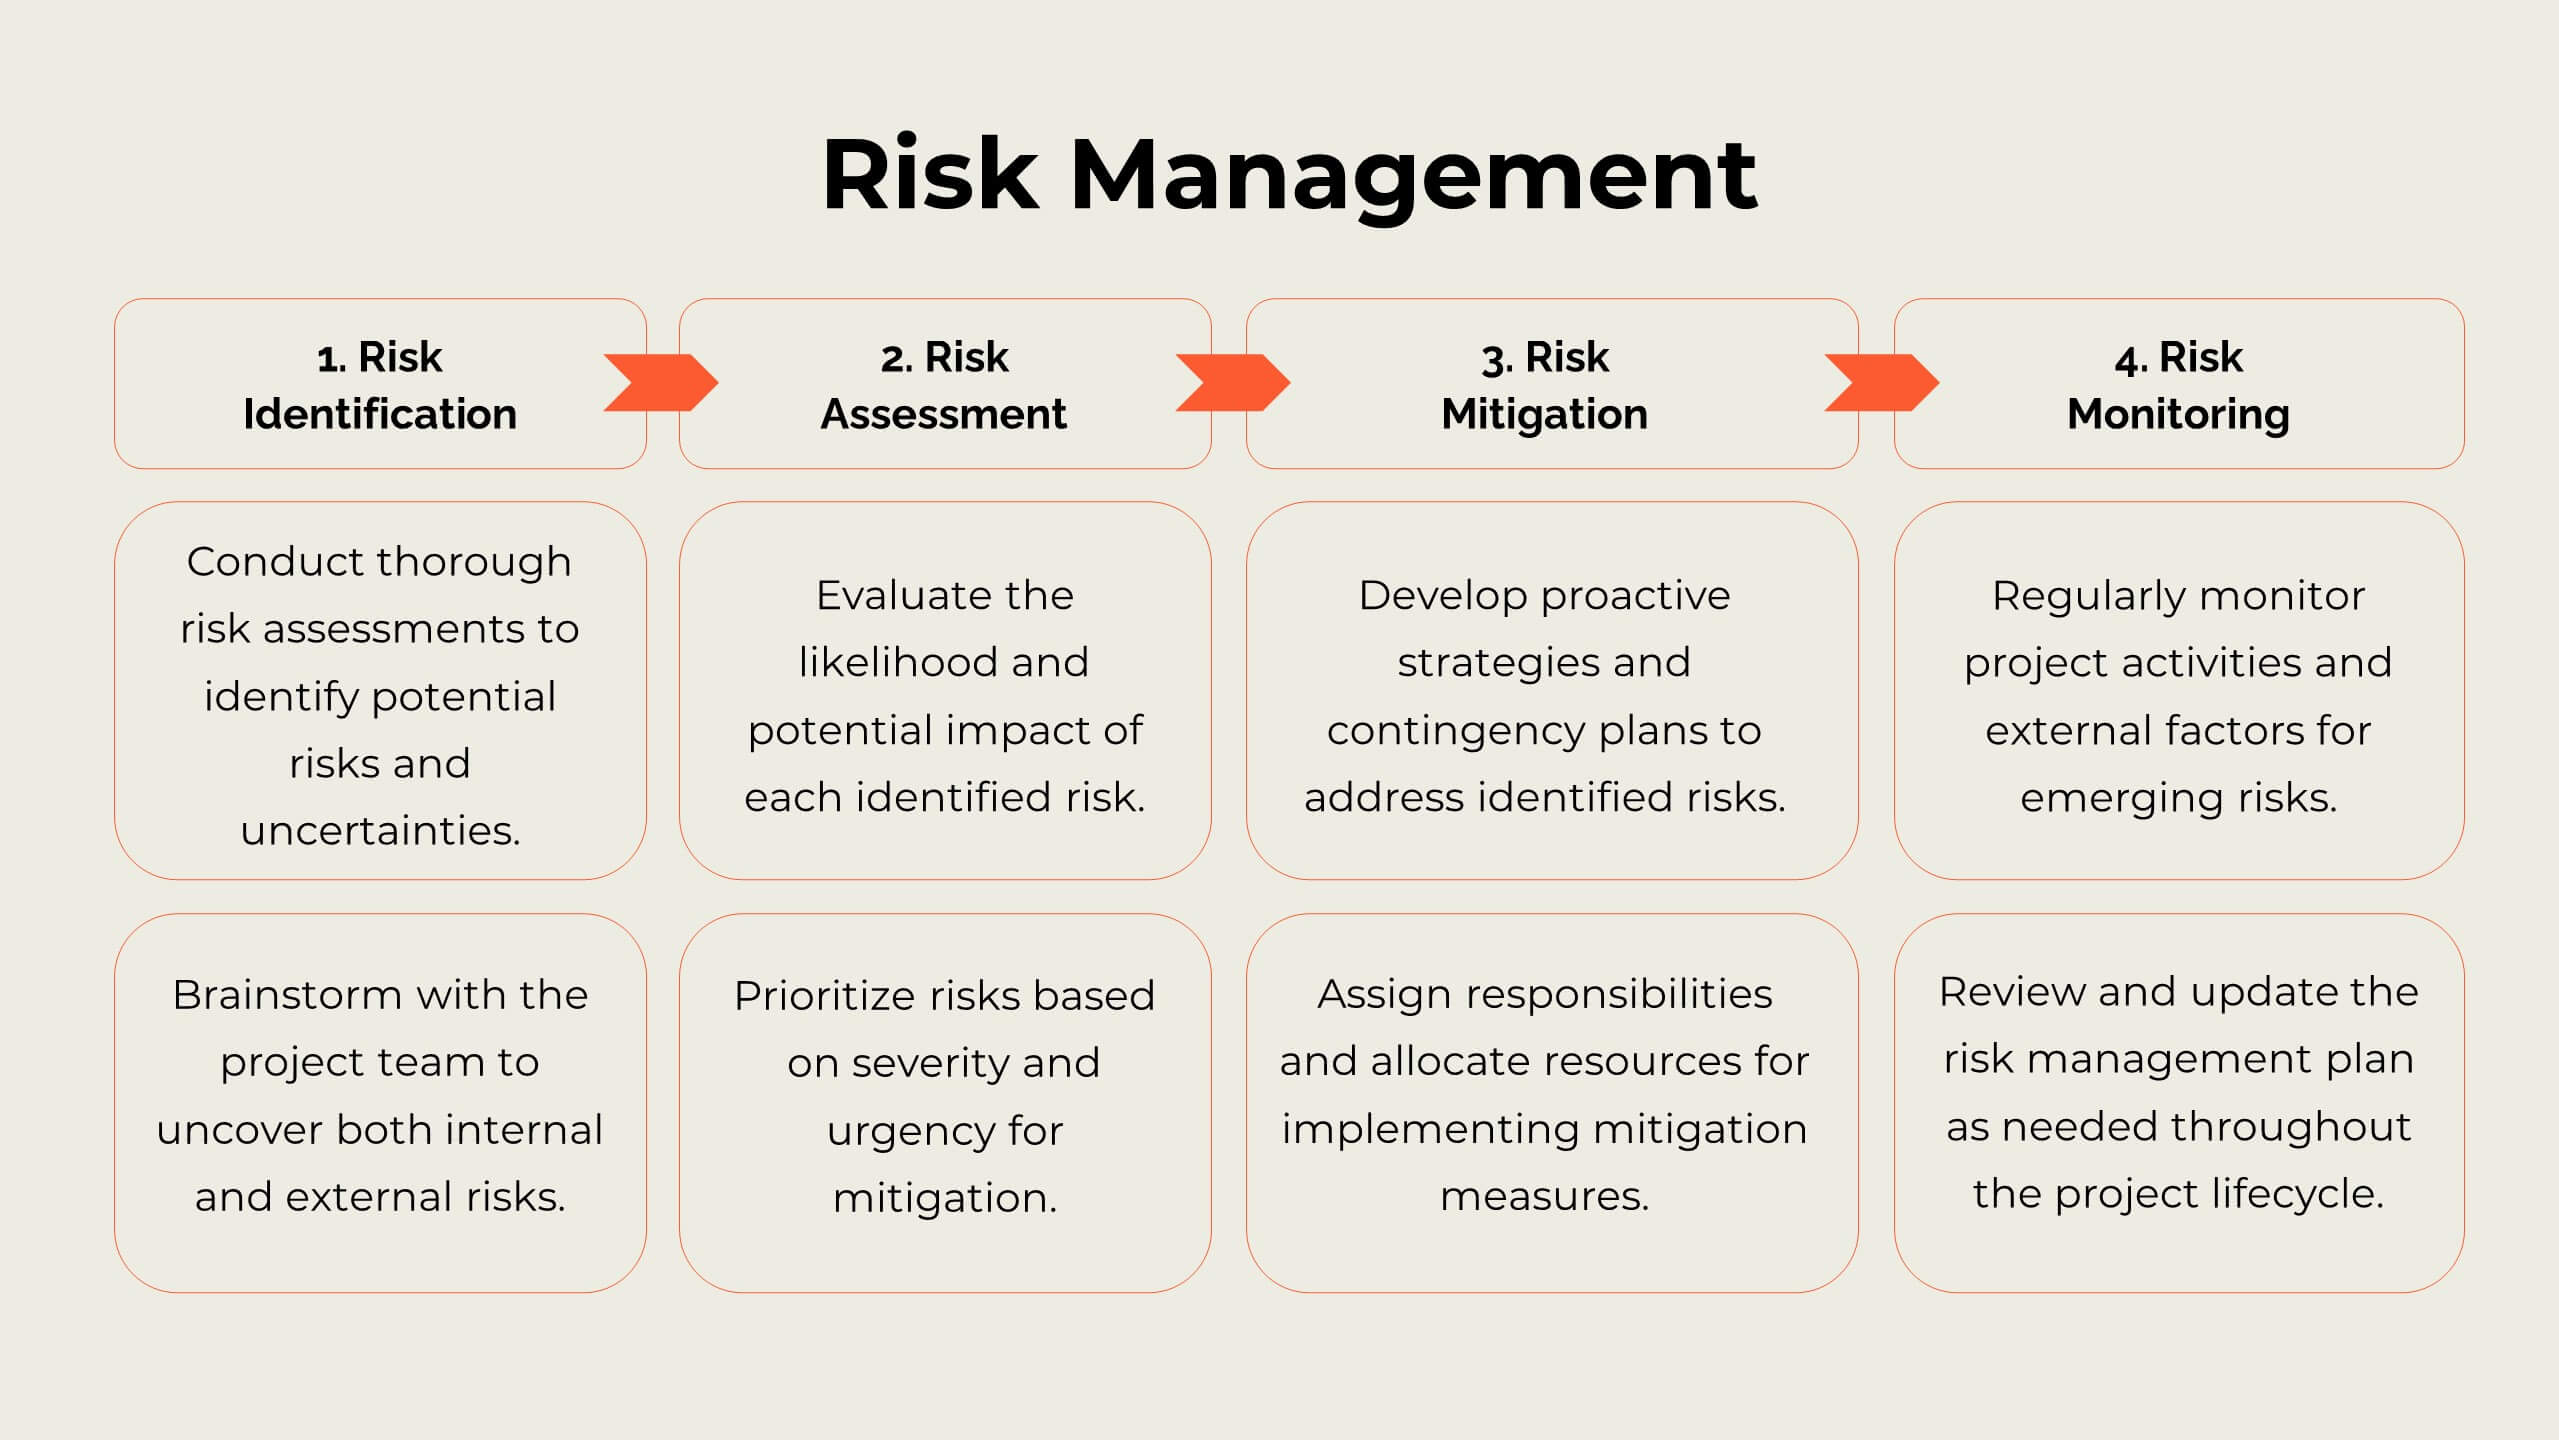
Revitalize your marketing efforts with this dynamic strategy plan template! Perfect for outlining objectives, competitive analysis, and target audience identification, it includes slides for SWOT analysis, resource allocation, and implementation plans. Engage stakeholders with vibrant visuals and comprehensive content. Compatible with PowerPoint, Keynote, and Google Slides for seamless presentations on any platform.


10 slides
Data-Driven Feedback Analysis Presentation
Gain deep insights into your business performance with the Data-Driven Feedback Analysis infographic. This dynamic visual presentation helps you track key metrics, analyze trends, and present findings with clarity. Fully customizable and compatible with PowerPoint, Keynote, and Google Slides.


5 slides
Business Ethics and Governance
Illustrate ethical processes and compliance values with this curved roadmap presentation. Designed around five connected stages—Process, Compliance, Technology, Oversight, and People—this layout helps visualize corporate governance and operational integrity. Each segment is color-coded and paired with icons for easy comprehension. Fully editable in PowerPoint, Keynote, and Google Slides.


6 slides
Economic Pyramid Infographic
Showcase economic structures with our Economic Pyramid Infographic, compatible with Powerpoint, Google Slides, and Keynote. This template is designed for economists, educators, and business professionals, providing a visual hierarchy of economic indicators or demographics. Each level of the pyramid represents a different segment, such as income brackets, consumer classes, or resource distribution. It's an ideal tool for presentations that require a clear depiction of economic stratification or market segmentation. Customizable and easy to understand, this infographic helps simplify complex economic data into digestible visual tiers for any audience.


5 slides
Next-Gen Networks and 5G Infrastructure Presentation
Build the future, one signal at a time. This engaging infographic presentation visually tracks the evolution of mobile network infrastructure, using a clean timeline layout with colorful tower icons and milestone markers. Perfect for tech educators, analysts, or engineers. Fully compatible with PowerPoint, Keynote, and Google Slides for seamless editing.


5 slides
Step-by-Step Flow Diagram Presentation
Bring clarity to every stage of your process with a clean, easy-to-follow visual path that guides your audience step by step. This presentation helps simplify workflows, instructions, and project milestones in a structured, approachable layout. Fully compatible with PowerPoint, Keynote, and Google Slides.


6 slides
Financial Trading and Stock Performance Presentation
Explore market dynamics with the "Financial Trading and Stock Performance" presentation template. Perfect for finance professionals, these slides offer a visual analysis of stock trends over the years. Featuring bar graphs and gauge charts for annual comparison, it's designed for impactful presentations. These templates are compatible with PowerPoint, Keynote, and Google Slides, enhancing their accessibility across different platforms.


4 slides
Project Proposal Executive Summary Presentation
Optimize your project presentations with the 'Project Proposal Executive Summary' template. Crafted to clearly showcase your project’s most crucial elements, this template uses visuals and concise text to highlight objectives and deliverables effectively. Ideal for professionals preparing proposals in PowerPoint, Keynote, or Google Slides.


2 slides
Creative Gratitude Slide Presentation
Express gratitude in style with this creative thank-you slide template! Featuring bold typography and modern geometric elements, this design adds a unique touch to your presentations. Ideal for business pitches, creative projects, and professional meetings. Fully customizable and compatible with PowerPoint, Keynote, and Google Slides for effortless personalization.


7 slides
Construction Jobs Infographic
Construction jobs refer to various roles and professions within the construction industry involved in planning, designing, building, and maintaining structures such as buildings, roads, bridges, dams, and other infrastructures. This infographic template sheds light on various career opportunities within the construction industry, offering a roadmap for aspiring professionals. Compatible with Powerpoint, Keynote, and Google Slides. With this infographic you're not just exploring careers; you're navigating a landscape of opportunities, ready to build a successful career in the dynamic world of construction.


6 slides
Overcoming Market Challenges Strategy Presentation
Tackle industry obstacles with clarity using this dynamic teamwork-themed visual. Featuring illustrated characters passing puzzle pieces along a circular process, this design is perfect for illustrating phased strategies, collaborative efforts, or key milestones. Great for strategic planning or team alignment presentations. Fully editable in PowerPoint, Keynote, and Google Slides.


7 slides
Performance Infographics Presentation Template
This Performance Infographic template was created with the intention of highlighting business and organizational performance in a visually appealing manner. You can create a stunning and captivating infographic that conveys your message effectively. This template was designed for professionals in organizations needing to share essential information about their organizations, goals and progress. This template is a high quality infographic presentation design made in 7 slides. This template can be used in any kind of business, school, or service and is compatible with powerpoint.


2 slides
Modern Business Title Slide Presentation
Step into the future of presentations with the "Modern Business Slide," designed to make your corporate message shine. This template features a sleek, minimalist layout with bold typography and a striking visual of a stylish office setting, perfect for making a professional impact. Ideal for any business presentation, it's compatible with PowerPoint, Keynote, and Google Slides, ensuring versatility across different platforms.


5 slides
Cryptocurrency Investment Infographics
Cryptocurrency Investment refers to the practice of buying, holding, or trading digital currencies as a form of investment. These infographic templates allow you to effectively present information about cryptocurrency investment, demystify the subject, and empower individuals to explore and navigate the world of digital currencies with confidence. Use these infographics to educate and inform individuals about the world of cryptocurrency investment. These aim to provide key information and insights to help people make informed decisions when it comes to investing in cryptocurrencies. Compatible with Powerpoint, Keynote, and Google Slides.