


Features
- 4 Unique slides
- Fully editable and easy to edit in Microsoft Powerpoint, Keynote and Google Slides
- 16:9 widescreen layout
- Clean and professional designs
- Export to JPG, PDF or send by email


Do you have any questions?
Recommend


6 slides
Patient Care & Treatment Presentation
Highlight the pillars of patient care with this modern, block-style layout. Each icon-embedded cube represents a different treatment or healthcare process, perfect for outlining procedures, services, or stages of medical support. Fully editable in PowerPoint, Keynote, and Google Slides—customize colors, icons, and labels with ease to suit your medical presentation needs.


4 slides
Blockchain and Cryptocurrency Market Analysis Presentation
Present complex blockchain structures and crypto market layers with clarity using the Blockchain and Cryptocurrency Market Analysis presentation template. Featuring a stacked cylinder diagram with four interactive data points, this layout is ideal for breaking down transaction flows, network layers, or decentralized finance (DeFi) ecosystems. Each title block offers space for concise key insights. Best suited for blockchain consultants, fintech startups, and crypto analysts. Fully compatible with PowerPoint, Keynote, and Google Slides.


6 slides
Workplace Culture and Office Environment Presentation
Highlight team values and workplace dynamics with this modern layout, featuring a central desk illustration flanked by six color-coded points. Perfect for showcasing employee engagement, office norms, or hybrid work strategies. The split design helps balance visual storytelling with concise content. Easily editable in PowerPoint, Keynote, or Google Slides to match your brand and message.


5 slides
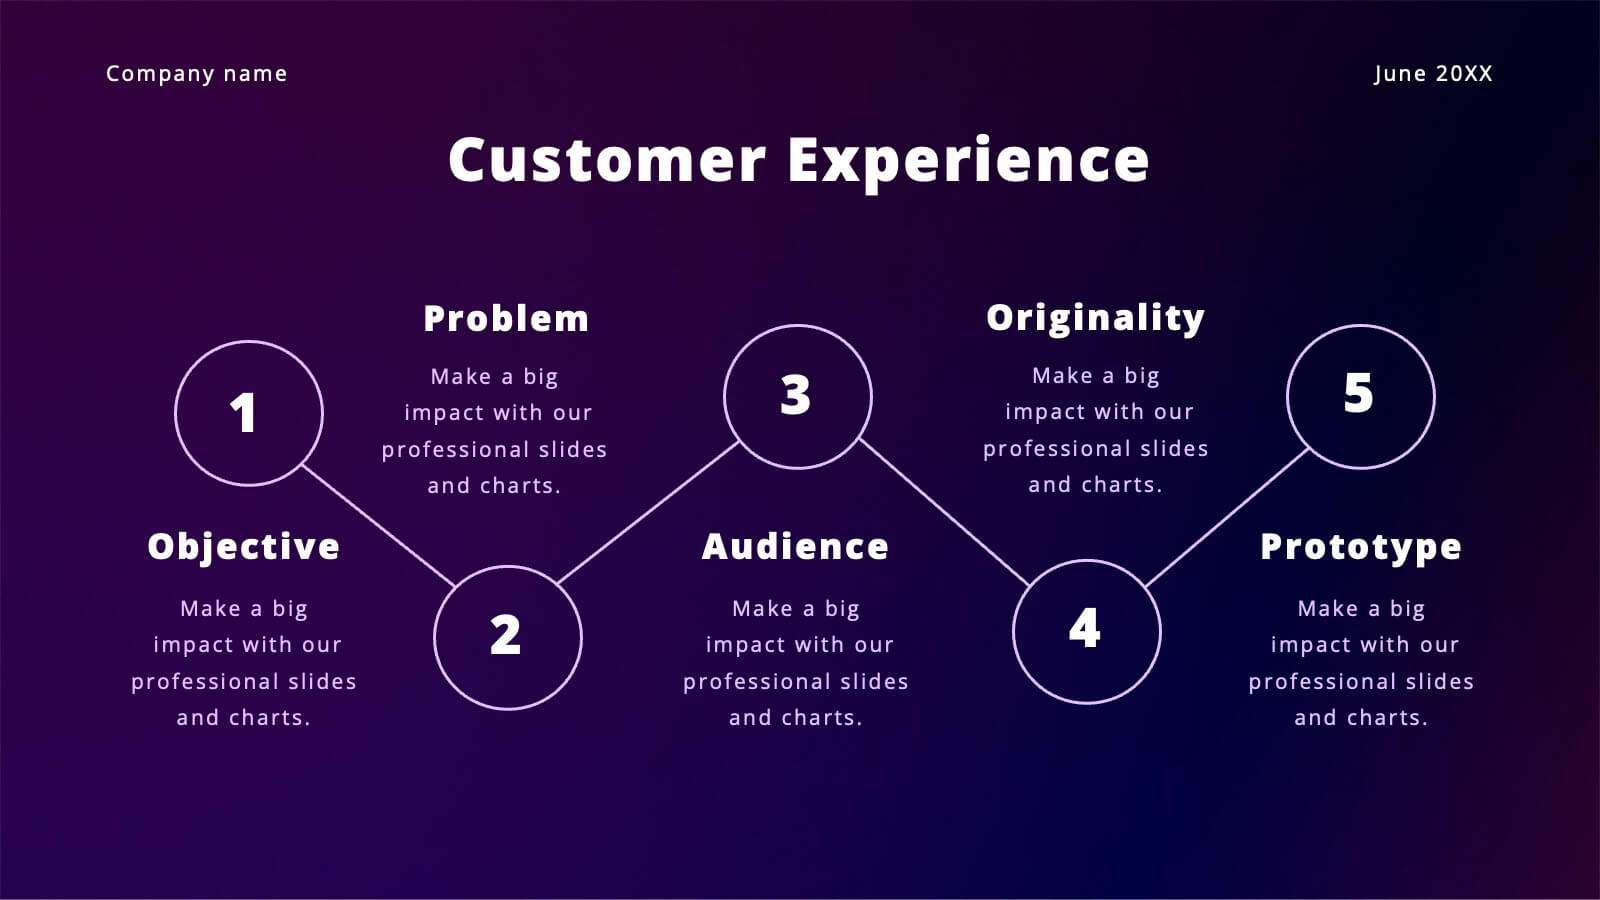
Product Marketing Slide Presentation
Spark interest instantly with a bold, circular layout that transforms product insights into a clean, memorable story. This presentation helps you explain features, audience needs, and value propositions in an organized, visual flow that keeps attention on what matters most. Fully customizable for PowerPoint, Keynote, and Google Slides.


20 slides
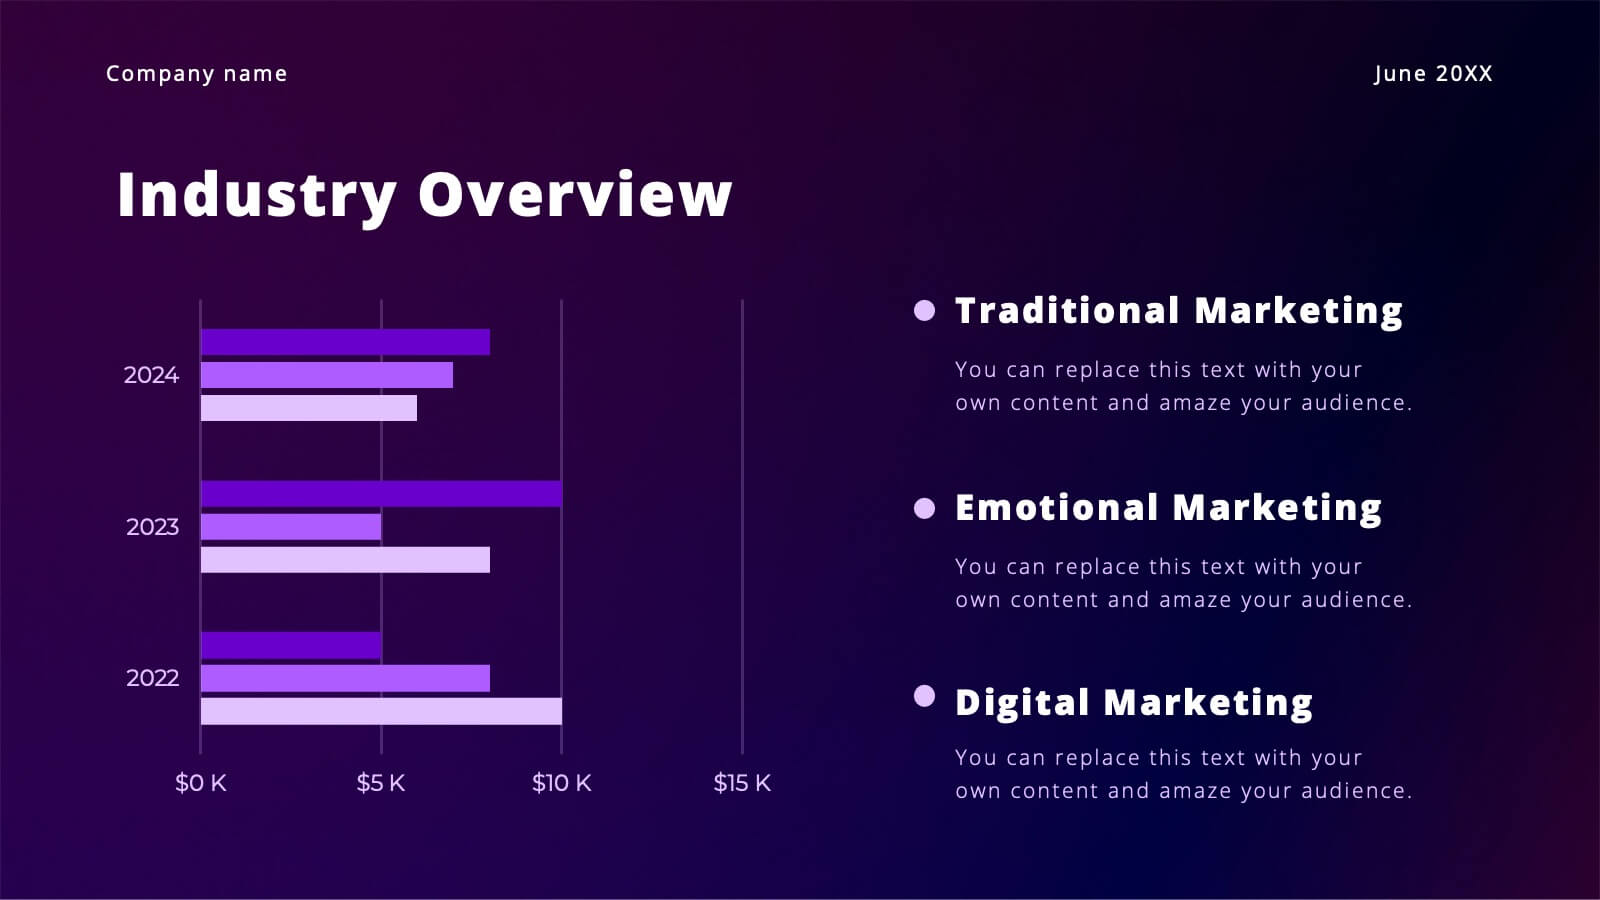
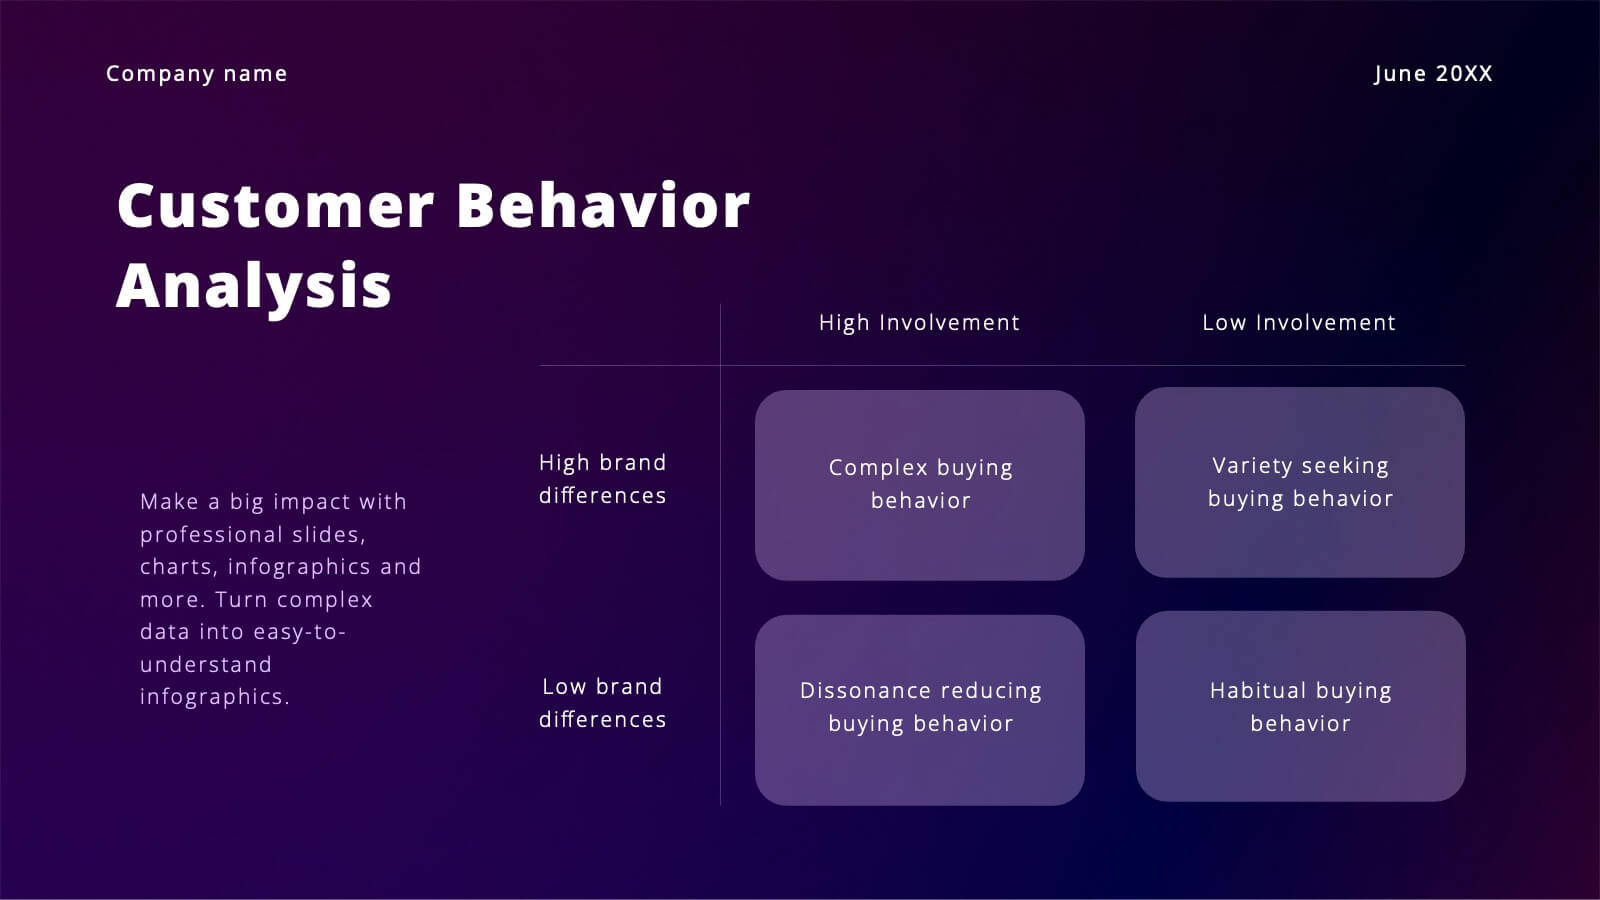
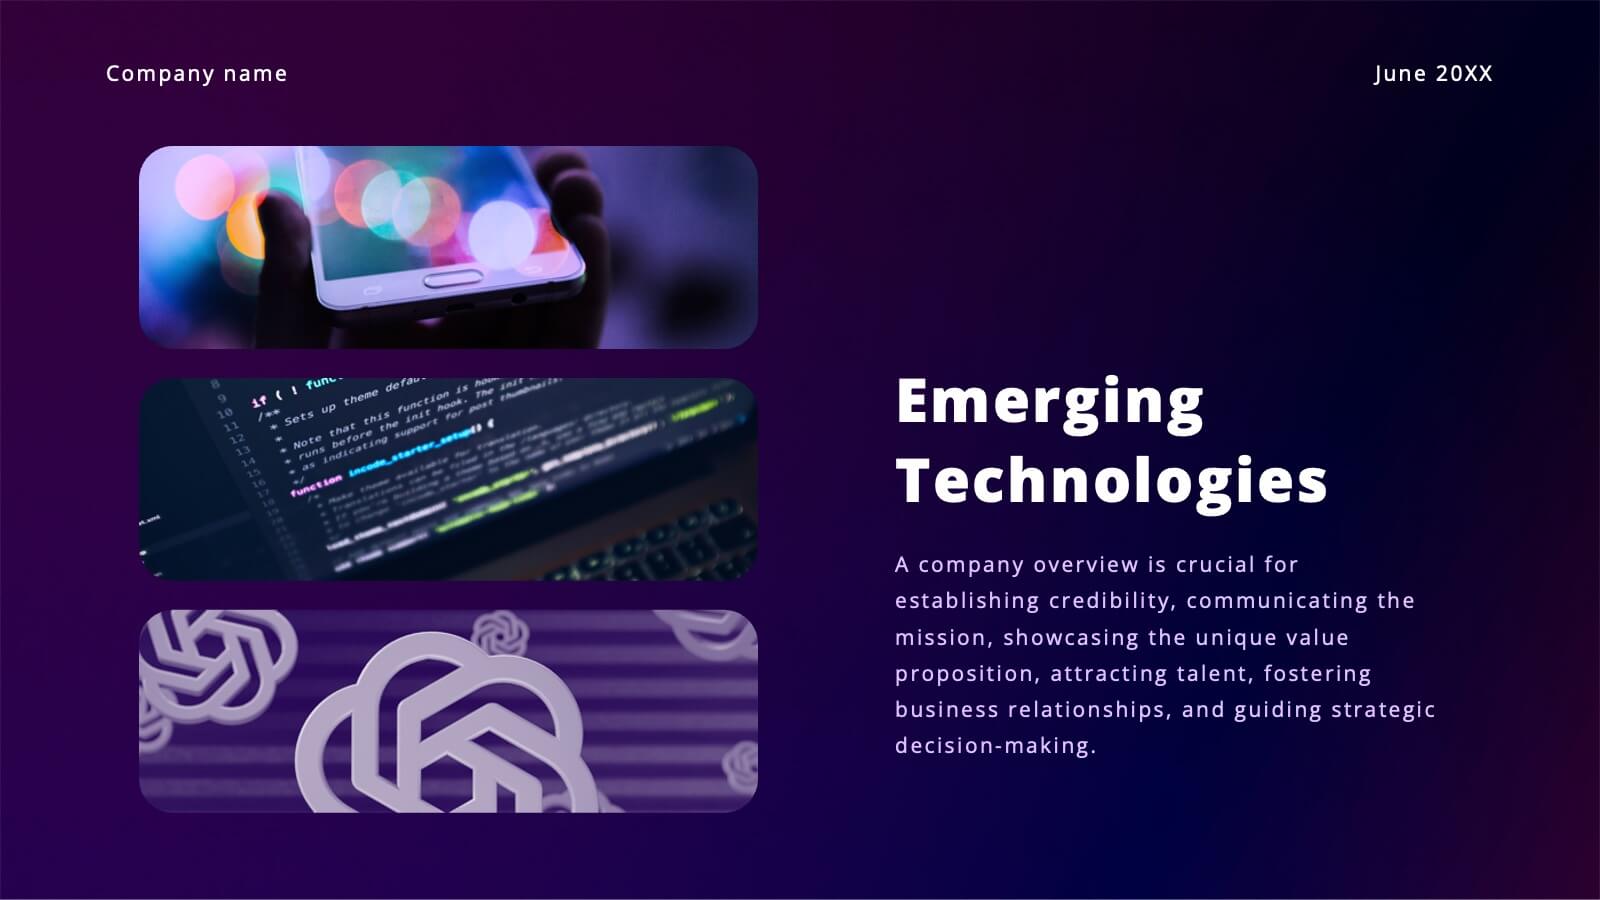
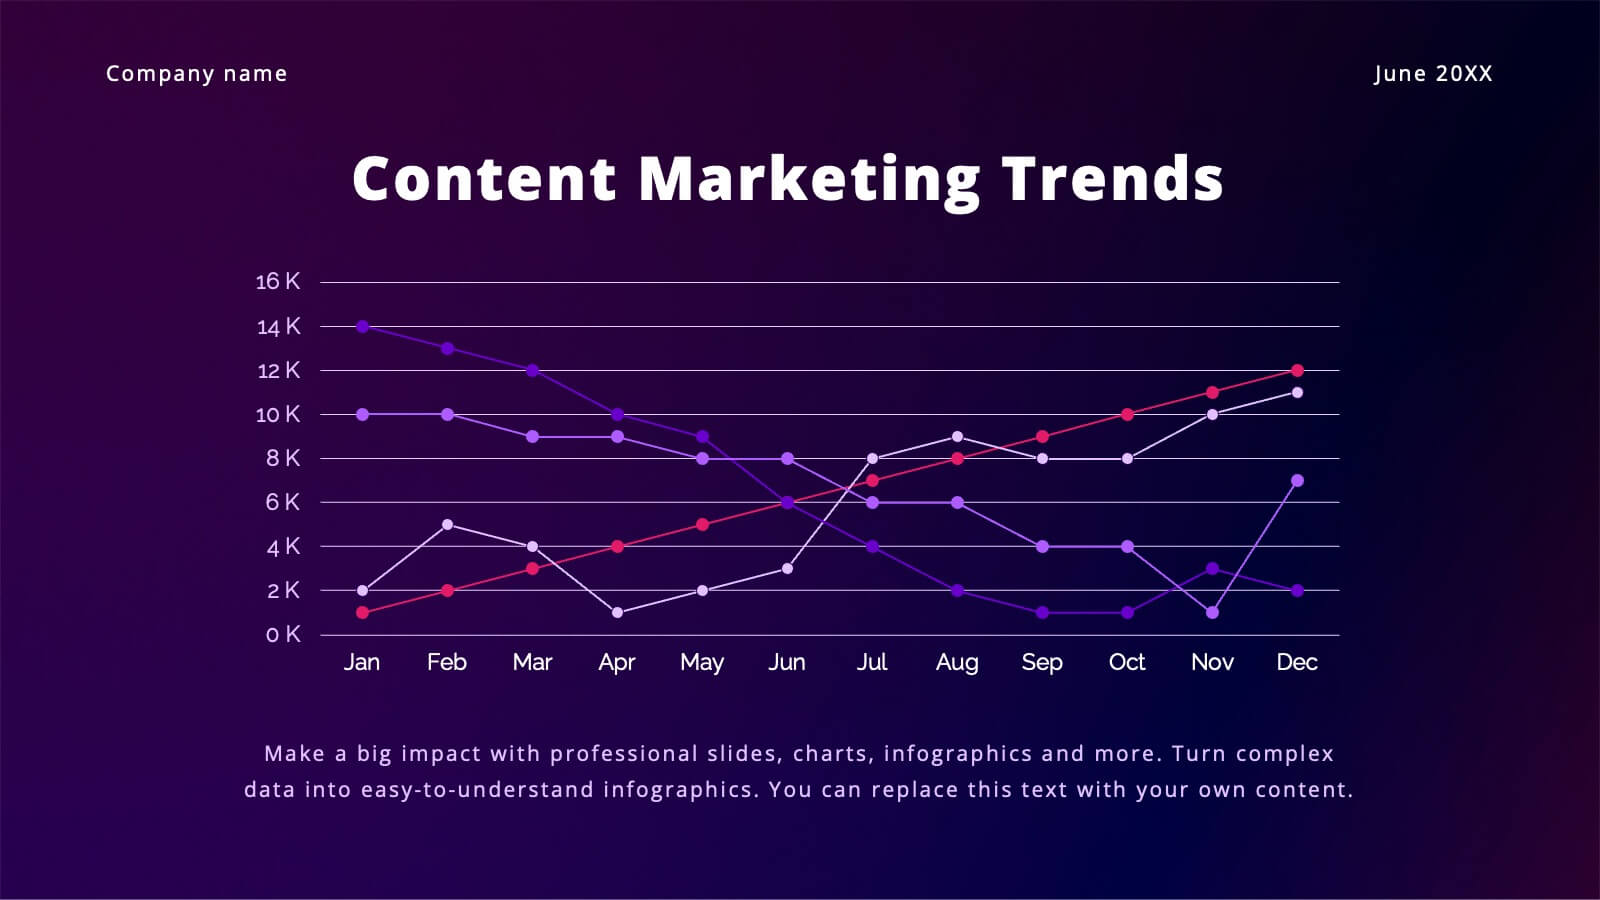
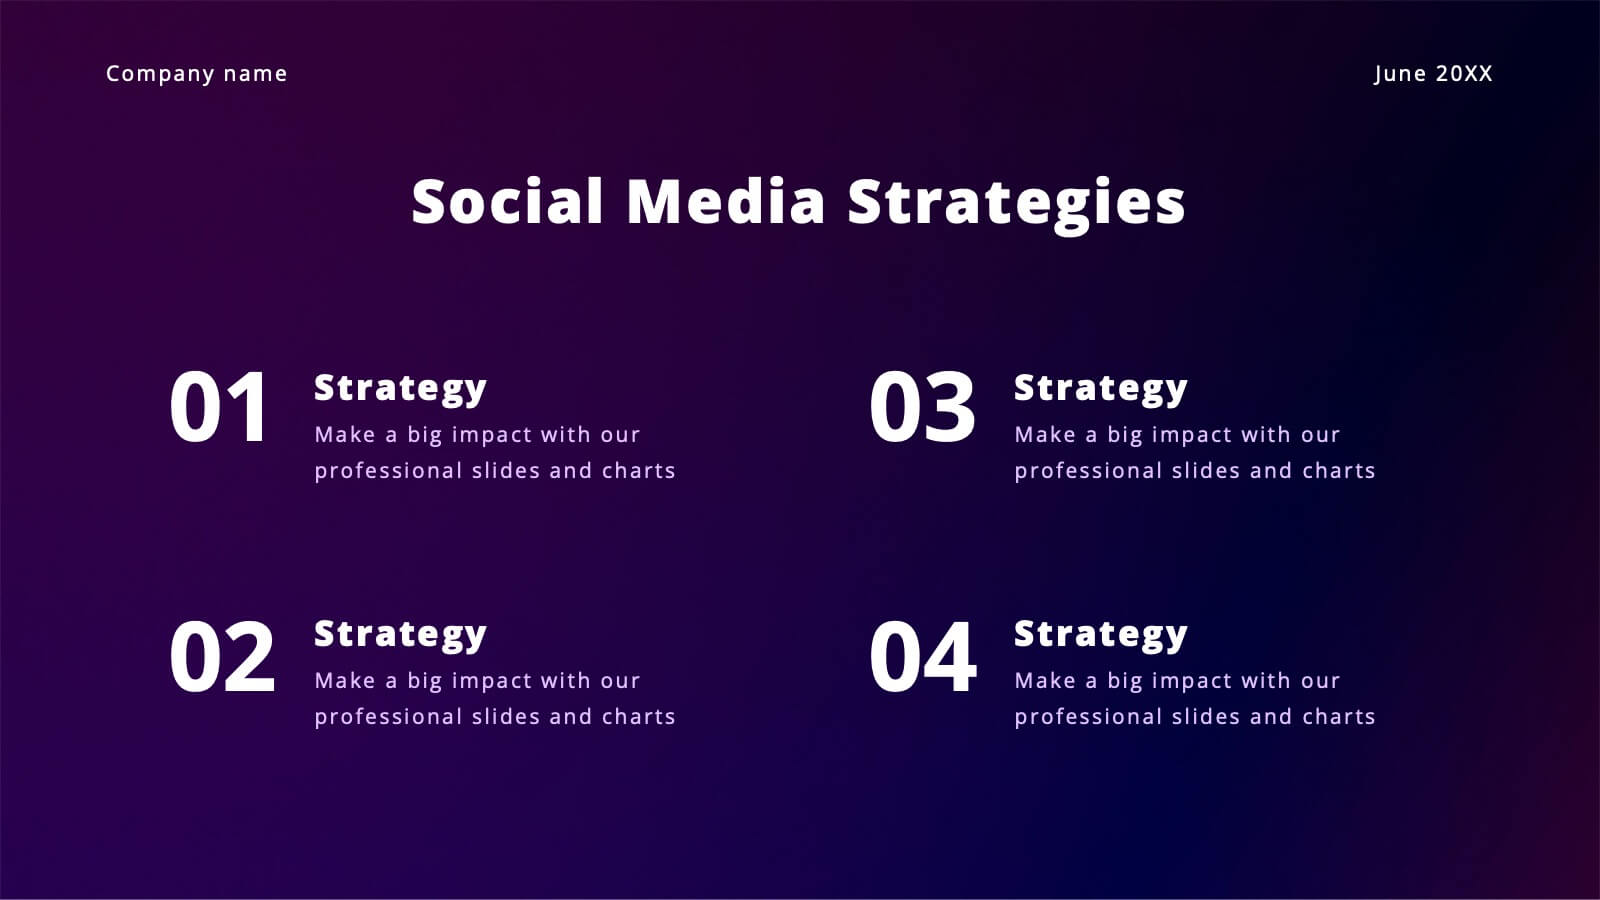
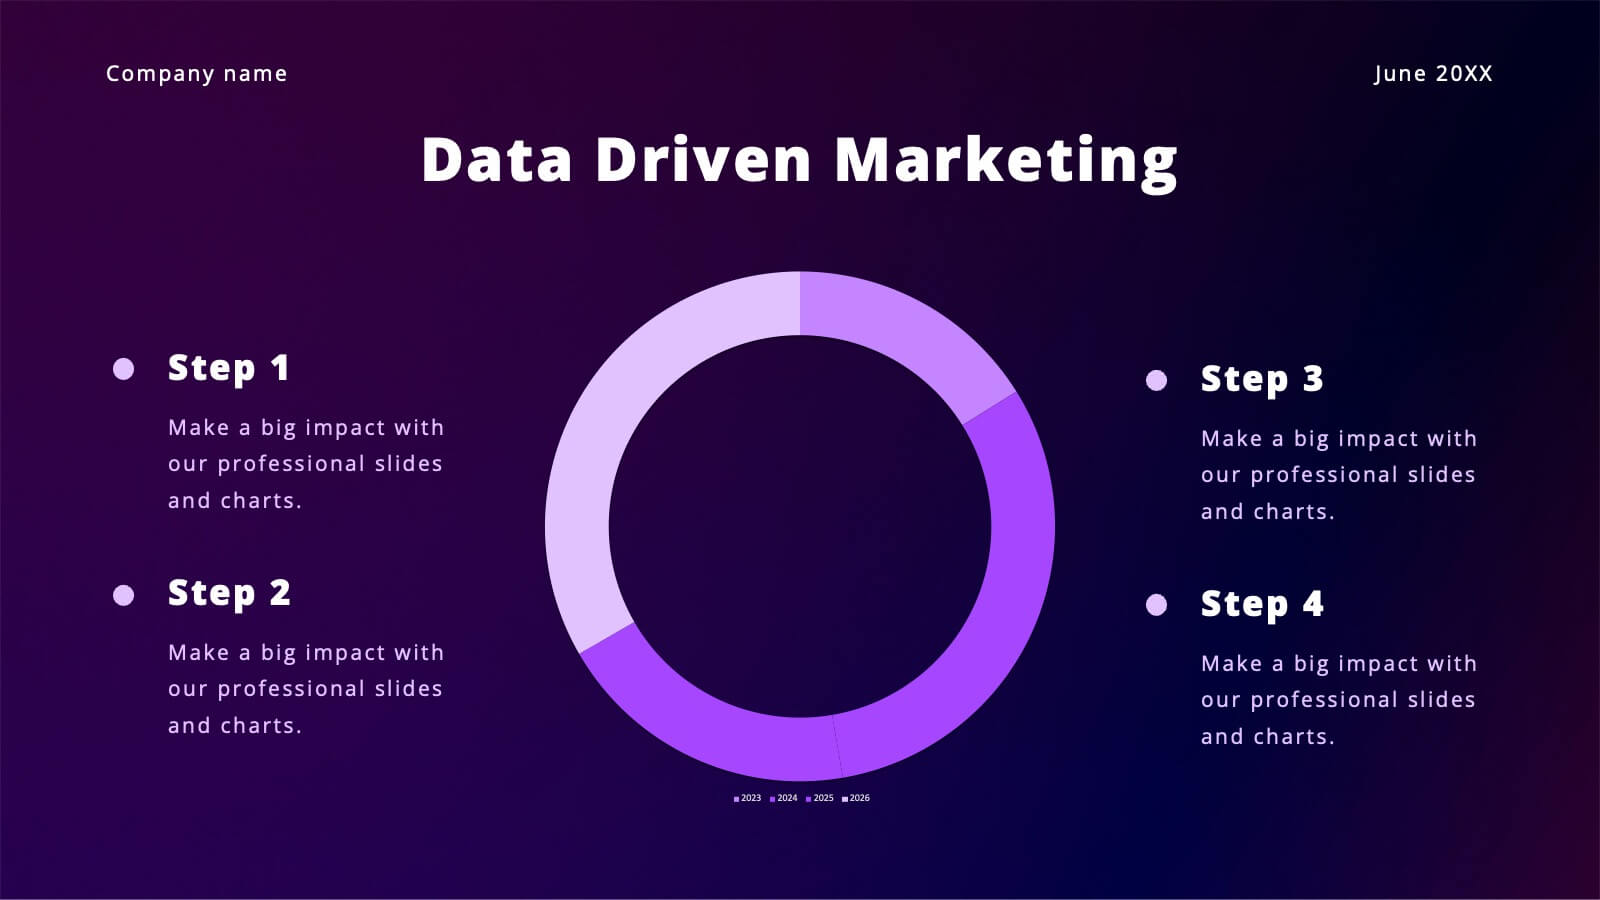
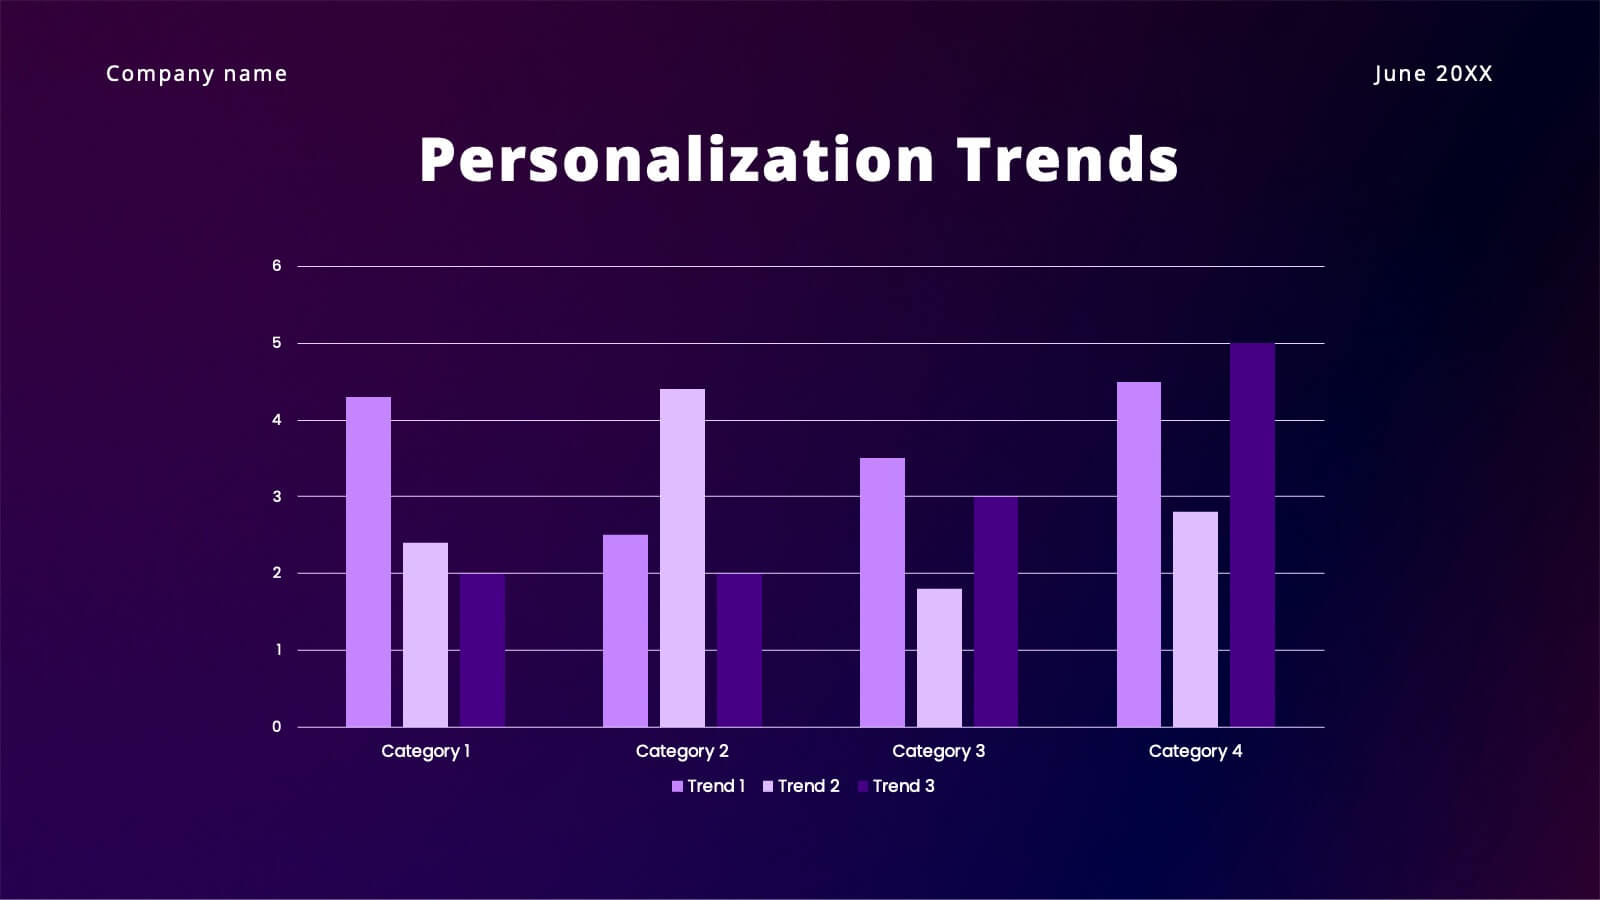
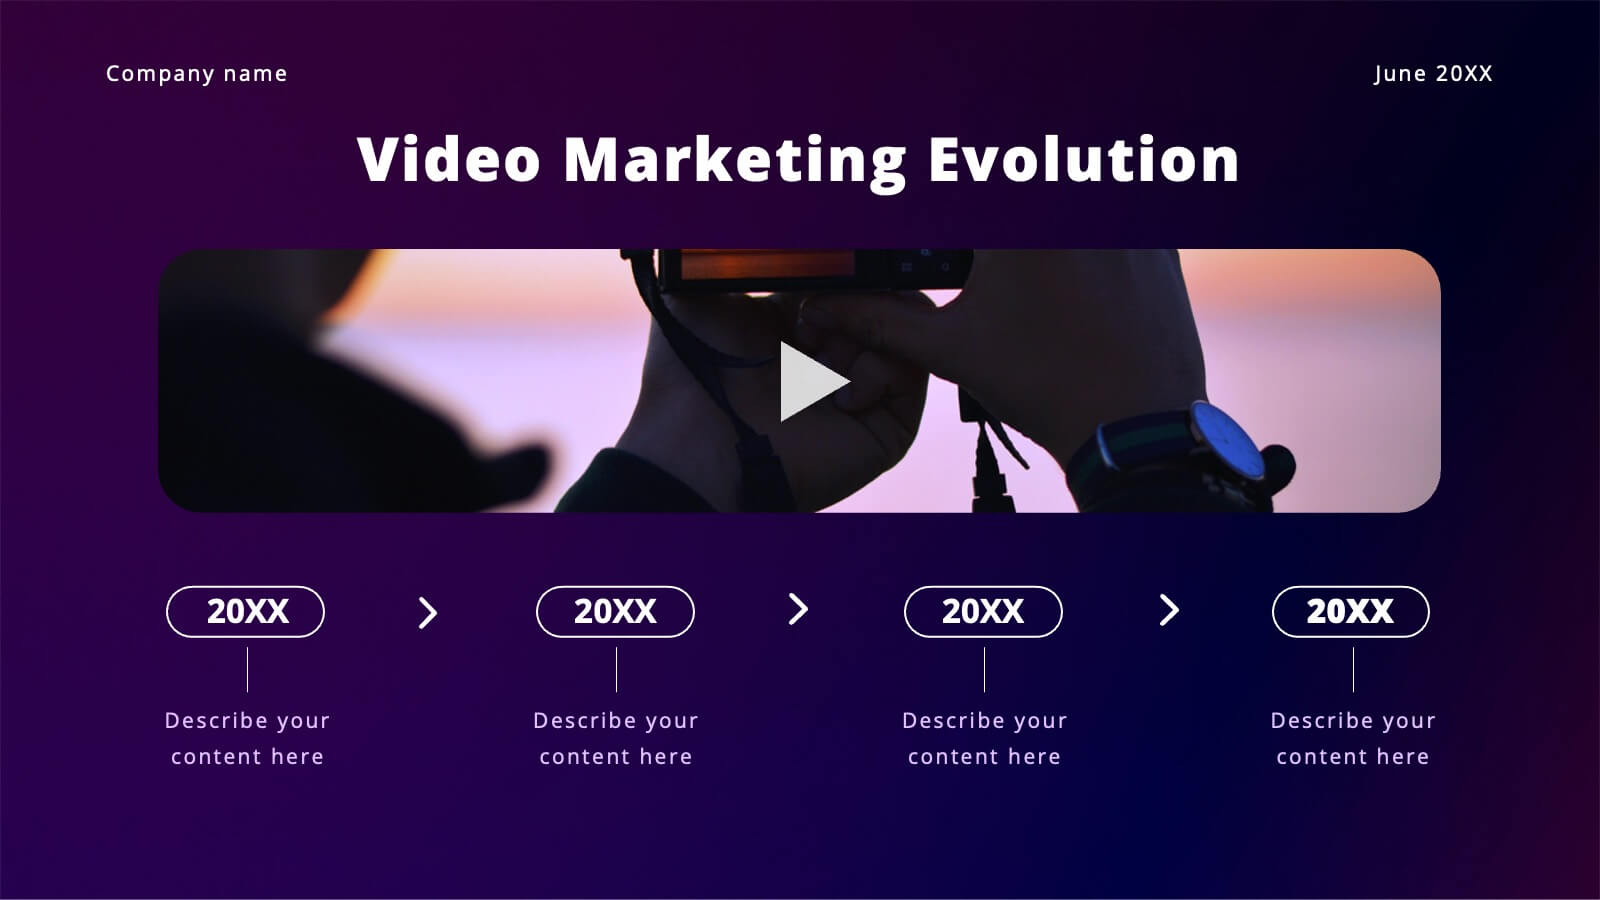
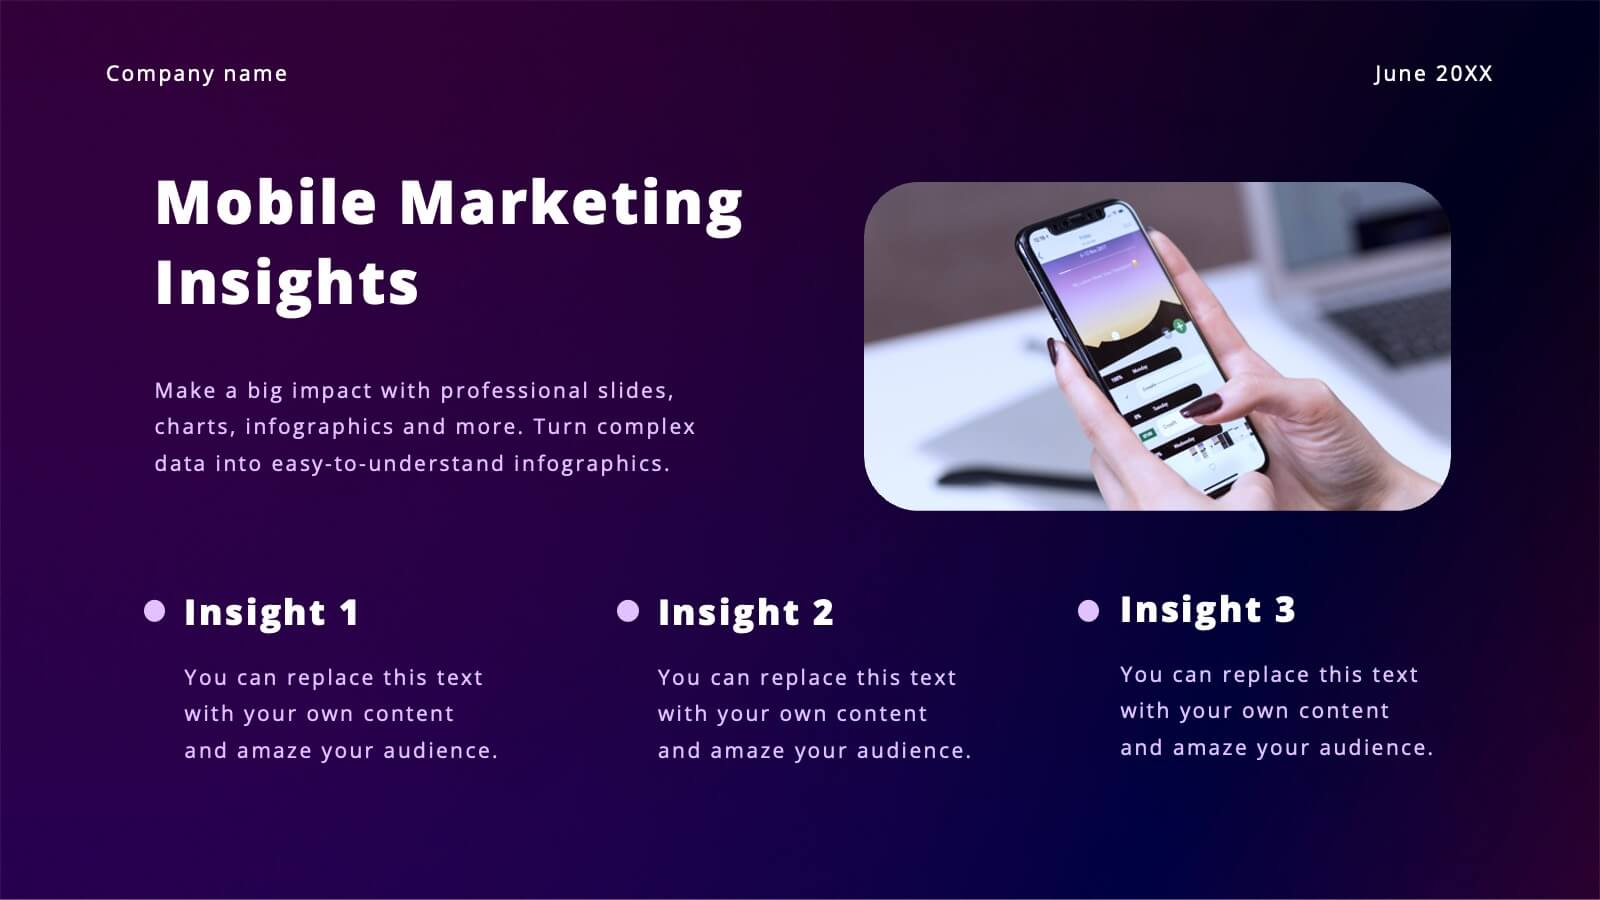
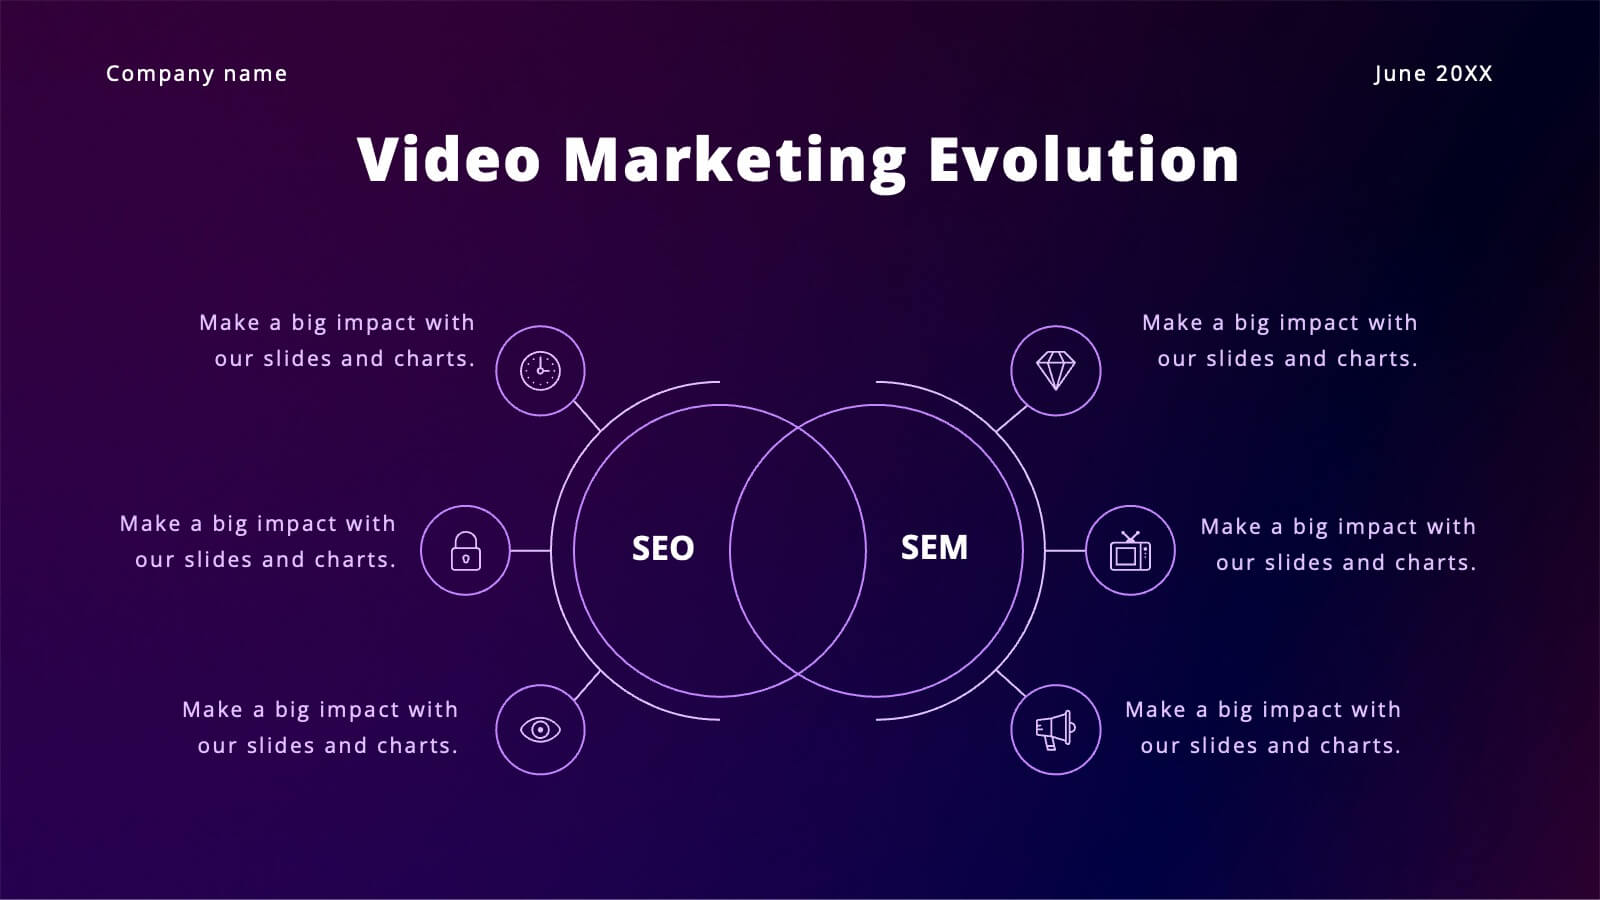
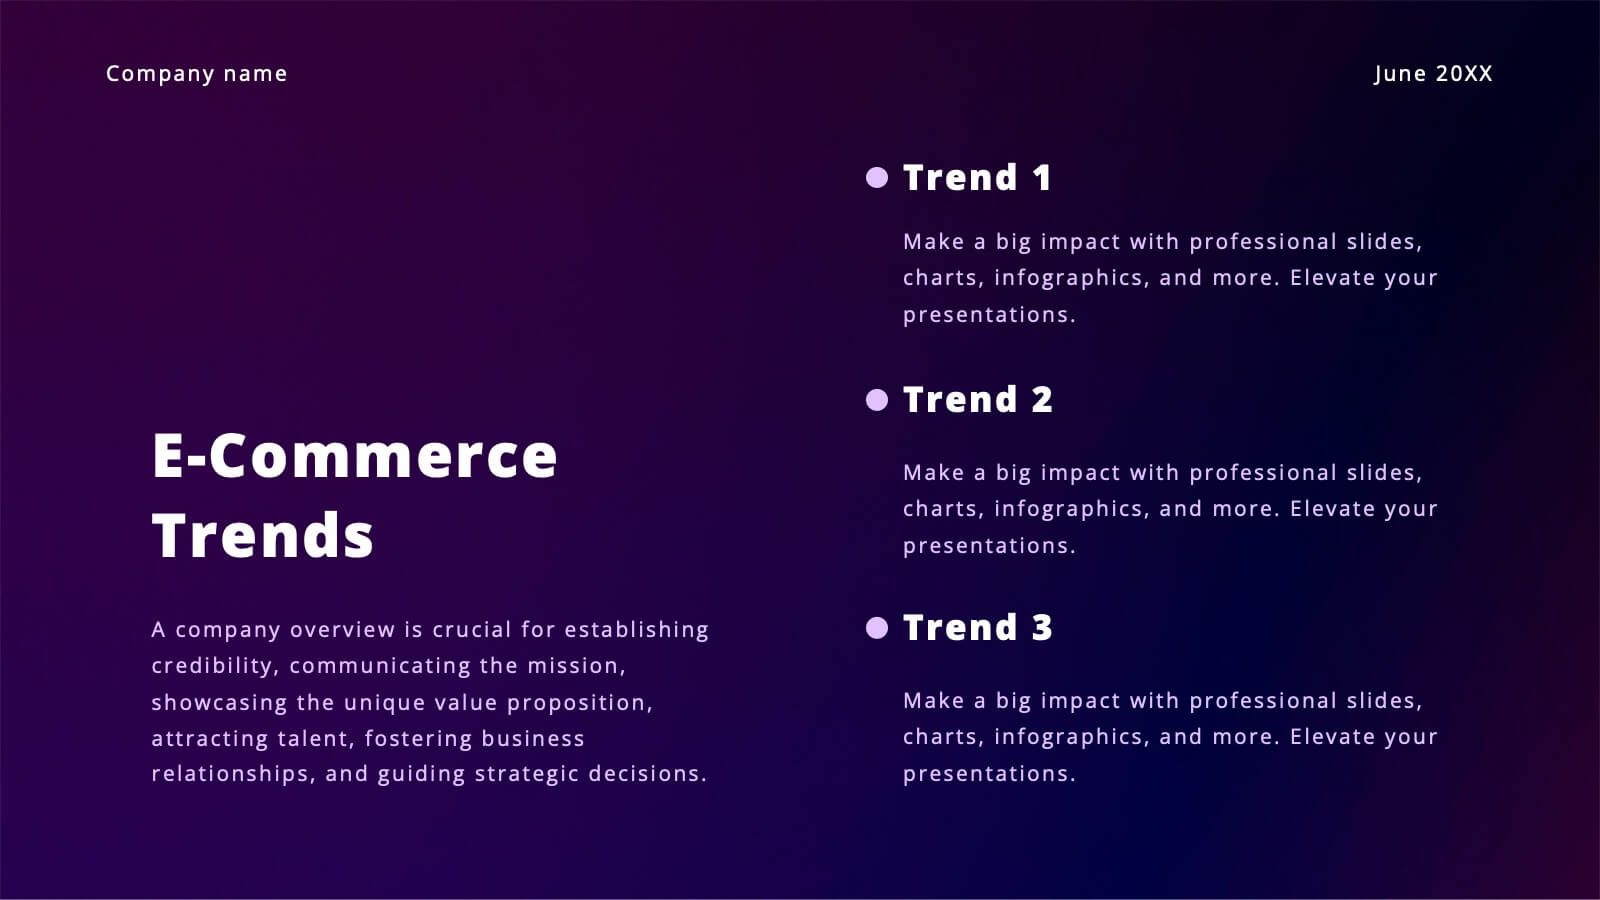
Vibrant Content Marketing Pitch Deck Presentation
Boost your marketing pitch with this vibrant deck! Covering industry overviews, customer behavior analysis, and emerging technologies, it’s designed to captivate your audience. Highlight social media strategies, data-driven marketing, and e-commerce trends effortlessly. Perfect for presenting a comprehensive marketing plan. Compatible with PowerPoint, Keynote, and Google Slides. Make your next pitch stand out!


5 slides
Framework Diagram Slide Presentation
Bring your ideas to life with a clean, modern layout designed to simplify complex steps and highlight key stages with clarity. This presentation guides your audience through a simple, connected framework, making it easy to explain processes, strategies, or workflows. Fully compatible with PowerPoint, Keynote, and Google Slides.


6 slides
Data Science and AI Big Data Presentation
Transform complex data concepts into engaging visuals with the Data Science and AI Big Data Presentation. This fully editable template highlights key areas such as machine learning, predictive analytics, automation, and data-driven decision-making. Perfect for data analysts, AI specialists, and business leaders, it’s available for PowerPoint, Keynote, and Google Slides, ensuring a modern and structured presentation.


19 slides
Kinetic Sales Forecast Presentation
Forecast your sales with style using this vibrant template! Perfect for detailing company overview, sales process, team, and strategy. Includes sections for case studies, pricing, and future opportunities. Ideal for sales teams to impress stakeholders. Compatible with PowerPoint, Keynote, and Google Slides.


12 slides
Cloud-Based Digital Transformation Presentation
Illustrate your path to digital evolution with this multi-cloud infographic layout. Perfect for visualizing service integrations, SaaS environments, or migration strategies, this slide highlights five key areas of transformation using cloud-shaped icons and a central connectivity hub. Fully customizable in PowerPoint, Keynote, and Google Slides.


12 slides
Leadership Development and Growth
Highlight leadership skills with this dynamic radar chart template, ideal for tracking individual or team competencies across six core areas. Use this layout to visualize progress in communication, strategy, vision, influence, adaptability, and accountability. Great for HR reviews, training evaluations, or performance dashboards. Fully editable in PowerPoint, Keynote, and Google Slides.


4 slides
3-Step Action Plan Next Steps Presentation
Turn your next big idea into a clear, achievable plan with this structured, goal-focused layout. Designed to visualize progress through three defined stages, it’s perfect for strategic planning, project timelines, or team roadmaps. Fully compatible with PowerPoint, Keynote, and Google Slides for smooth editing and professional presentation delivery.


4 slides
Classroom Learning Presentation
Break down learning objectives or teaching concepts with this Classroom Learning Presentation. Featuring a visual of a presenter pointing to a board, the layout includes three content areas labeled A, B, and C—perfect for organizing lesson points or training steps. Ideal for educators, trainers, and instructional designers. Fully customizable and compatible with PowerPoint, Keynote, and Google Slides.


6 slides
Startup Investors Pitch Deck Presentation
Inspire confidence and spark investor interest with the Startup Investor Pitch Deck Presentation. Featuring a creative visual of a rocket launching from a piggy bank, this slide is ideal for illustrating funding momentum, business growth, or financial milestones. Each section allows space to highlight critical investment points such as traction, market opportunity, financials, and team highlights. Fully customizable in PowerPoint, Keynote, or Google Slides, this pitch-ready layout is perfect for entrepreneurs, startup founders, and innovation teams aiming to deliver a memorable and professional presentation.


6 slides
Lean Six Sigma Workflow Steps Presentation
Present the DMAIC cycle with clarity using this Lean Six Sigma workflow template. Each step—Define, Measure, Analyze, Improve, Control—is highlighted with sleek visuals and editable content blocks. Ideal for operations teams, quality experts, and consultants. Customize seamlessly in PowerPoint, Keynote, or Google Slides to fit your process presentations.


5 slides
Collaborative Learning Techniques Overview Presentation
Highlight team-based education methods with the Collaborative Learning Techniques Overview Presentation. This layout is perfect for mapping out peer-led discussions, group projects, or cooperative learning strategies using a visual 4-step flow. The clean, screen-themed icons make it ideal for educators, trainers, or eLearning creators. Fully editable in Canva, PowerPoint, Keynote, and Google Slides.


4 slides
Core Company Value Mapping Presentation
Spotlight your business strengths with the Core Company Value Mapping Presentation. This slide design helps you break down and compare key value drivers using a structured visual format—ideal for internal strategy discussions, executive briefings, or stakeholder updates. Highlight metrics, priorities, or departments with side-by-side percentage comparisons and icon indicators. Fully editable in PowerPoint, Keynote, and Google Slides. A must-have for operations teams, consultants, and leadership presentations.


7 slides
Startup Business Infographic
A startup business refers to a newly established company or entrepreneurial venture, typically characterized by its innovative business model, product, or service. Our startup business infographic, is a dynamic visual template guide that illuminates the exciting journey of entrepreneurship and the strategic steps involved in building a successful startup. Fully customizable and compatible with Powerpoint, Keynote, and Google Slides. This infographic is a versatile and informative tool that celebrates the entrepreneurial spirit and guides aspiring startups on the path to success.