


Features
- 5 Unique slides
- Fully editable and easy to edit in Microsoft Powerpoint, Keynote and Google Slides
- 16:9 widescreen layout
- Clean and professional designs
- Export to JPG, PDF or send by email


Do you have any questions?
Recommend


5 slides
Survey Findings and Summary Report Presentation
Present survey data clearly with this layered, step-style layout. Each section is color-coded with matching icons for quick insight into key findings. Ideal for summarizing feedback, analytics, or market research. Fully editable in Canva, PowerPoint, or Google Slides—perfect for making data-driven presentations engaging and easy to follow.


5 slides
Business Strategy Decision Tree Presentation
Streamline your strategic decisions with this Business Strategy Decision Tree template. Designed to visually map out options, outcomes, and key choices, this slide is perfect for business analysts, consultants, and executives. Featuring hierarchical branching with clear icons and customizable sections, it helps illustrate strategic planning, problem-solving, and risk assessment. Fully compatible with PowerPoint, Keynote, and Google Slides for seamless presentation integration.


5 slides
Renewable Natural Energy Resources Infographics
Renewable natural energy resources, also known as renewable energy sources, are energy sources that are replenished naturally and sustainably. These vertical infographics serve as educational tools to promote awareness and understanding of renewable energy sources. They can be used in presentations, workshops, educational materials, or sustainability initiatives to inspire individuals, organizations, and communities to embrace and invest in renewable energy for a greener and more sustainable future. They are fully customizable and compatible with Powerpoint, Keynote, and Google Slides.


10 slides
Brainstorming and Creative Idea Generation Presentation
Unlock Brainstorming and Creative Idea Generation with this visually engaging template designed to help teams capture, refine, and present ideas effectively. Featuring gear-themed graphics, color-coded sections, and structured placeholders, this template is ideal for workshops, innovation meetings, and design thinking sessions. Fully customizable and compatible with PowerPoint, Keynote, and Google Slides, ensuring seamless integration into your workflow.


21 slides
Thistlewood Strategic Planning Report Presentation
This comprehensive template is ideal for strategic planning, featuring slides for market analysis, SWOT evaluation, growth opportunities, and resource allocation. Showcase timelines, milestones, risk management, and communication strategies. Fully customizable, it’s perfect for delivering professional insights. Compatible with PowerPoint, Keynote, and Google Slides.


5 slides
Water Usage and Resource Efficiency Presentation
Convey environmental impact clearly with the Water Usage and Resource Efficiency Presentation. This clean, drop-shaped infographic design visualizes resource distribution in four balanced sections—ideal for sustainability, conservation, or utility reports. Fully editable in Canva, PowerPoint, Keynote, and Google Slides to customize data and align with your brand or project.


7 slides
Digital Marketing Infographic
Digital marketing refers to the use of digital channels, such as the internet, social media, search engines, email, and mobile devices, to promote products, services, and brands. This infographic showcases key concepts and strategies in the field of digital marketing. It is designed to help businesses and marketers effectively communicate and educate their audience about the various aspects of digital marketing. This template can be used to cover a wide range of digital marketing topics, including social media marketing, search engine optimization, content marketing, email marketing, paid advertising, analytics, and more.


6 slides
Effective Leadership Decision-Making Presentation
Enhance decision-making clarity with this Effective Leadership Decision-Making template. Designed for managers, executives, and strategists, this slide visually represents decision paths, prioritization, and leadership impact. Featuring color-coded options and engaging graphics, it helps illustrate the influence of choices on business outcomes. Fully compatible with PowerPoint, Keynote, and Google Slides, making it a seamless addition to your presentations.


22 slides
Runestone Scientific Research Presentation
The Scientific Research Presentation Template offers 22 clean and professional slides to present your research findings effectively. Cover key areas like objectives, methodology, data analysis, key findings, and future directions. Perfect for academic or professional settings, it's fully customizable and compatible with PowerPoint, Keynote, and Google Slides.


10 slides
Business Risk Management Framework Presentation
Elevate your risk analysis with the "Business Risk Management Framework" template, offering a dynamic and customizable approach to effectively present and evaluate risk data. It features various risk gauges and icons for visual representation, ensuring key insights are easily understandable. This template facilitates comprehensive risk analysis presentations and is compatible with PowerPoint, Keynote, and Google Slides.


5 slides
Timeline Road Infographics
Timelines are important tools for organizing and presenting information chronologically. This timeline infographic is designed to help ensure that all your tasks are completed on time, and that the project stays on track. This is perfect for identifying potential issues that may arise during a project, so that they can be addressed before they become major problems. This template consists of a road or a horizontal line, with markers or milestones placed at specific intervals. Each marker represents a significant event or achievement, and is accompanied by a short description, date or time frame.


26 slides
Corporate Social Responsibility (CSR) Presentation
Reinforce your commitment to positive impact with our Corporate Social Responsibility (CSR) presentation template, compatible with PowerPoint, Keynote, and Google Slides. This template is expertly crafted for businesses and organizations looking to present their CSR initiatives, environmental efforts, and community engagements. It features a professional yet inviting design with green accents to symbolize the commitment to sustainability. The template offers a variety of slide types to cover all aspects of your CSR strategy. Use 'process infographics' to outline your sustainable practices, 'mind map infographics' to explore the impact of your activities, and 'chart slides' to present your social and environmental achievements quantitatively. Our CSR template is not just for presentations; it's a statement of your organization's values and dedication to making a difference. Download it now to communicate your CSR goals and actions with clarity and inspire your stakeholders to join you in driving change for a better world.


7 slides
Project Summary Infographic
This collection of project summary slides is designed to streamline the presentation of project outcomes and statuses effectively. The slides feature a variety of layouts tailored to emphasize critical data and conclusions, making them an ideal choice for project managers and teams who need to report on progress and results. Each slide is crafted with a clear focus on visual hierarchy, which helps in directing the viewer's attention to the most important information. Use of bullet points, charts, and infographics enhances the viewer's understanding by breaking down complex data into easy-to-digest visuals. Color coding is effectively utilized to differentiate between themes or topics, which aids in quick comprehension. These slides are versatile enough to be used in various scenarios, such as end-of-project presentations, stakeholder updates, or team meetings. They provide a professional and polished way to showcase project achievements, timelines, and future steps. Overall, these summary slides are a valuable tool for anyone looking to present project information clearly and concisely, ensuring that key points are communicated effectively and are memorable.

20 slides
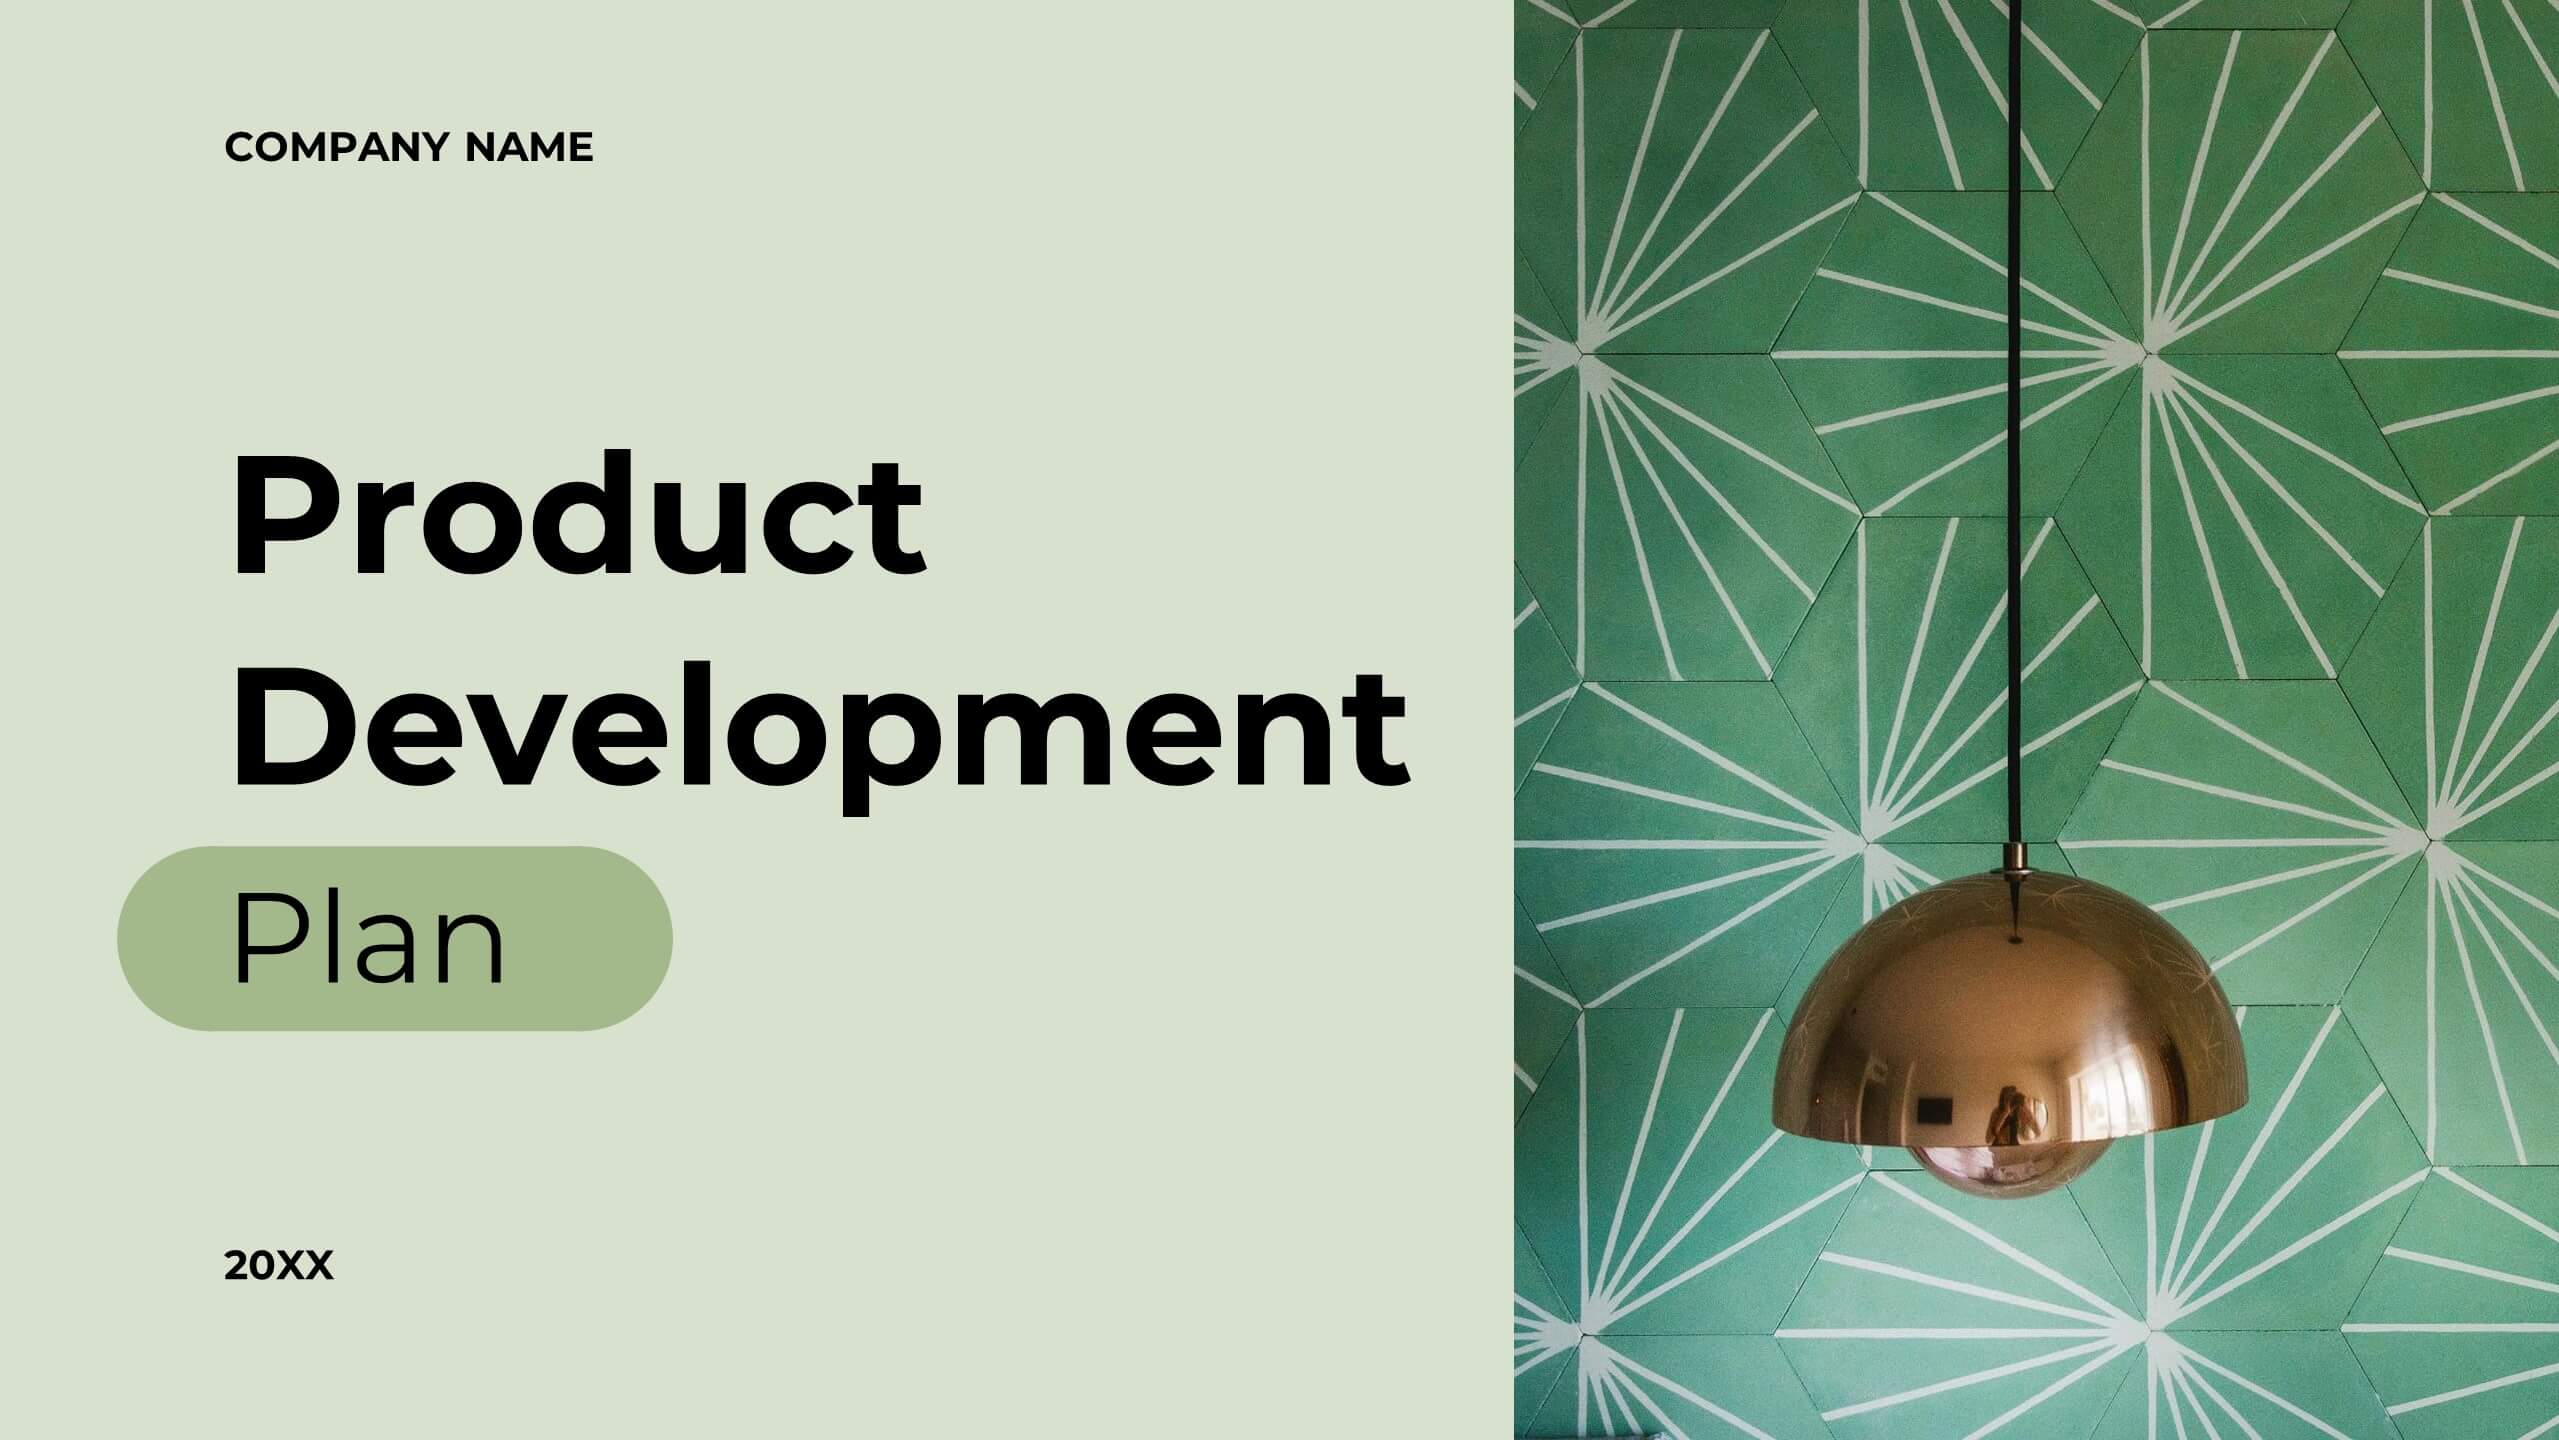
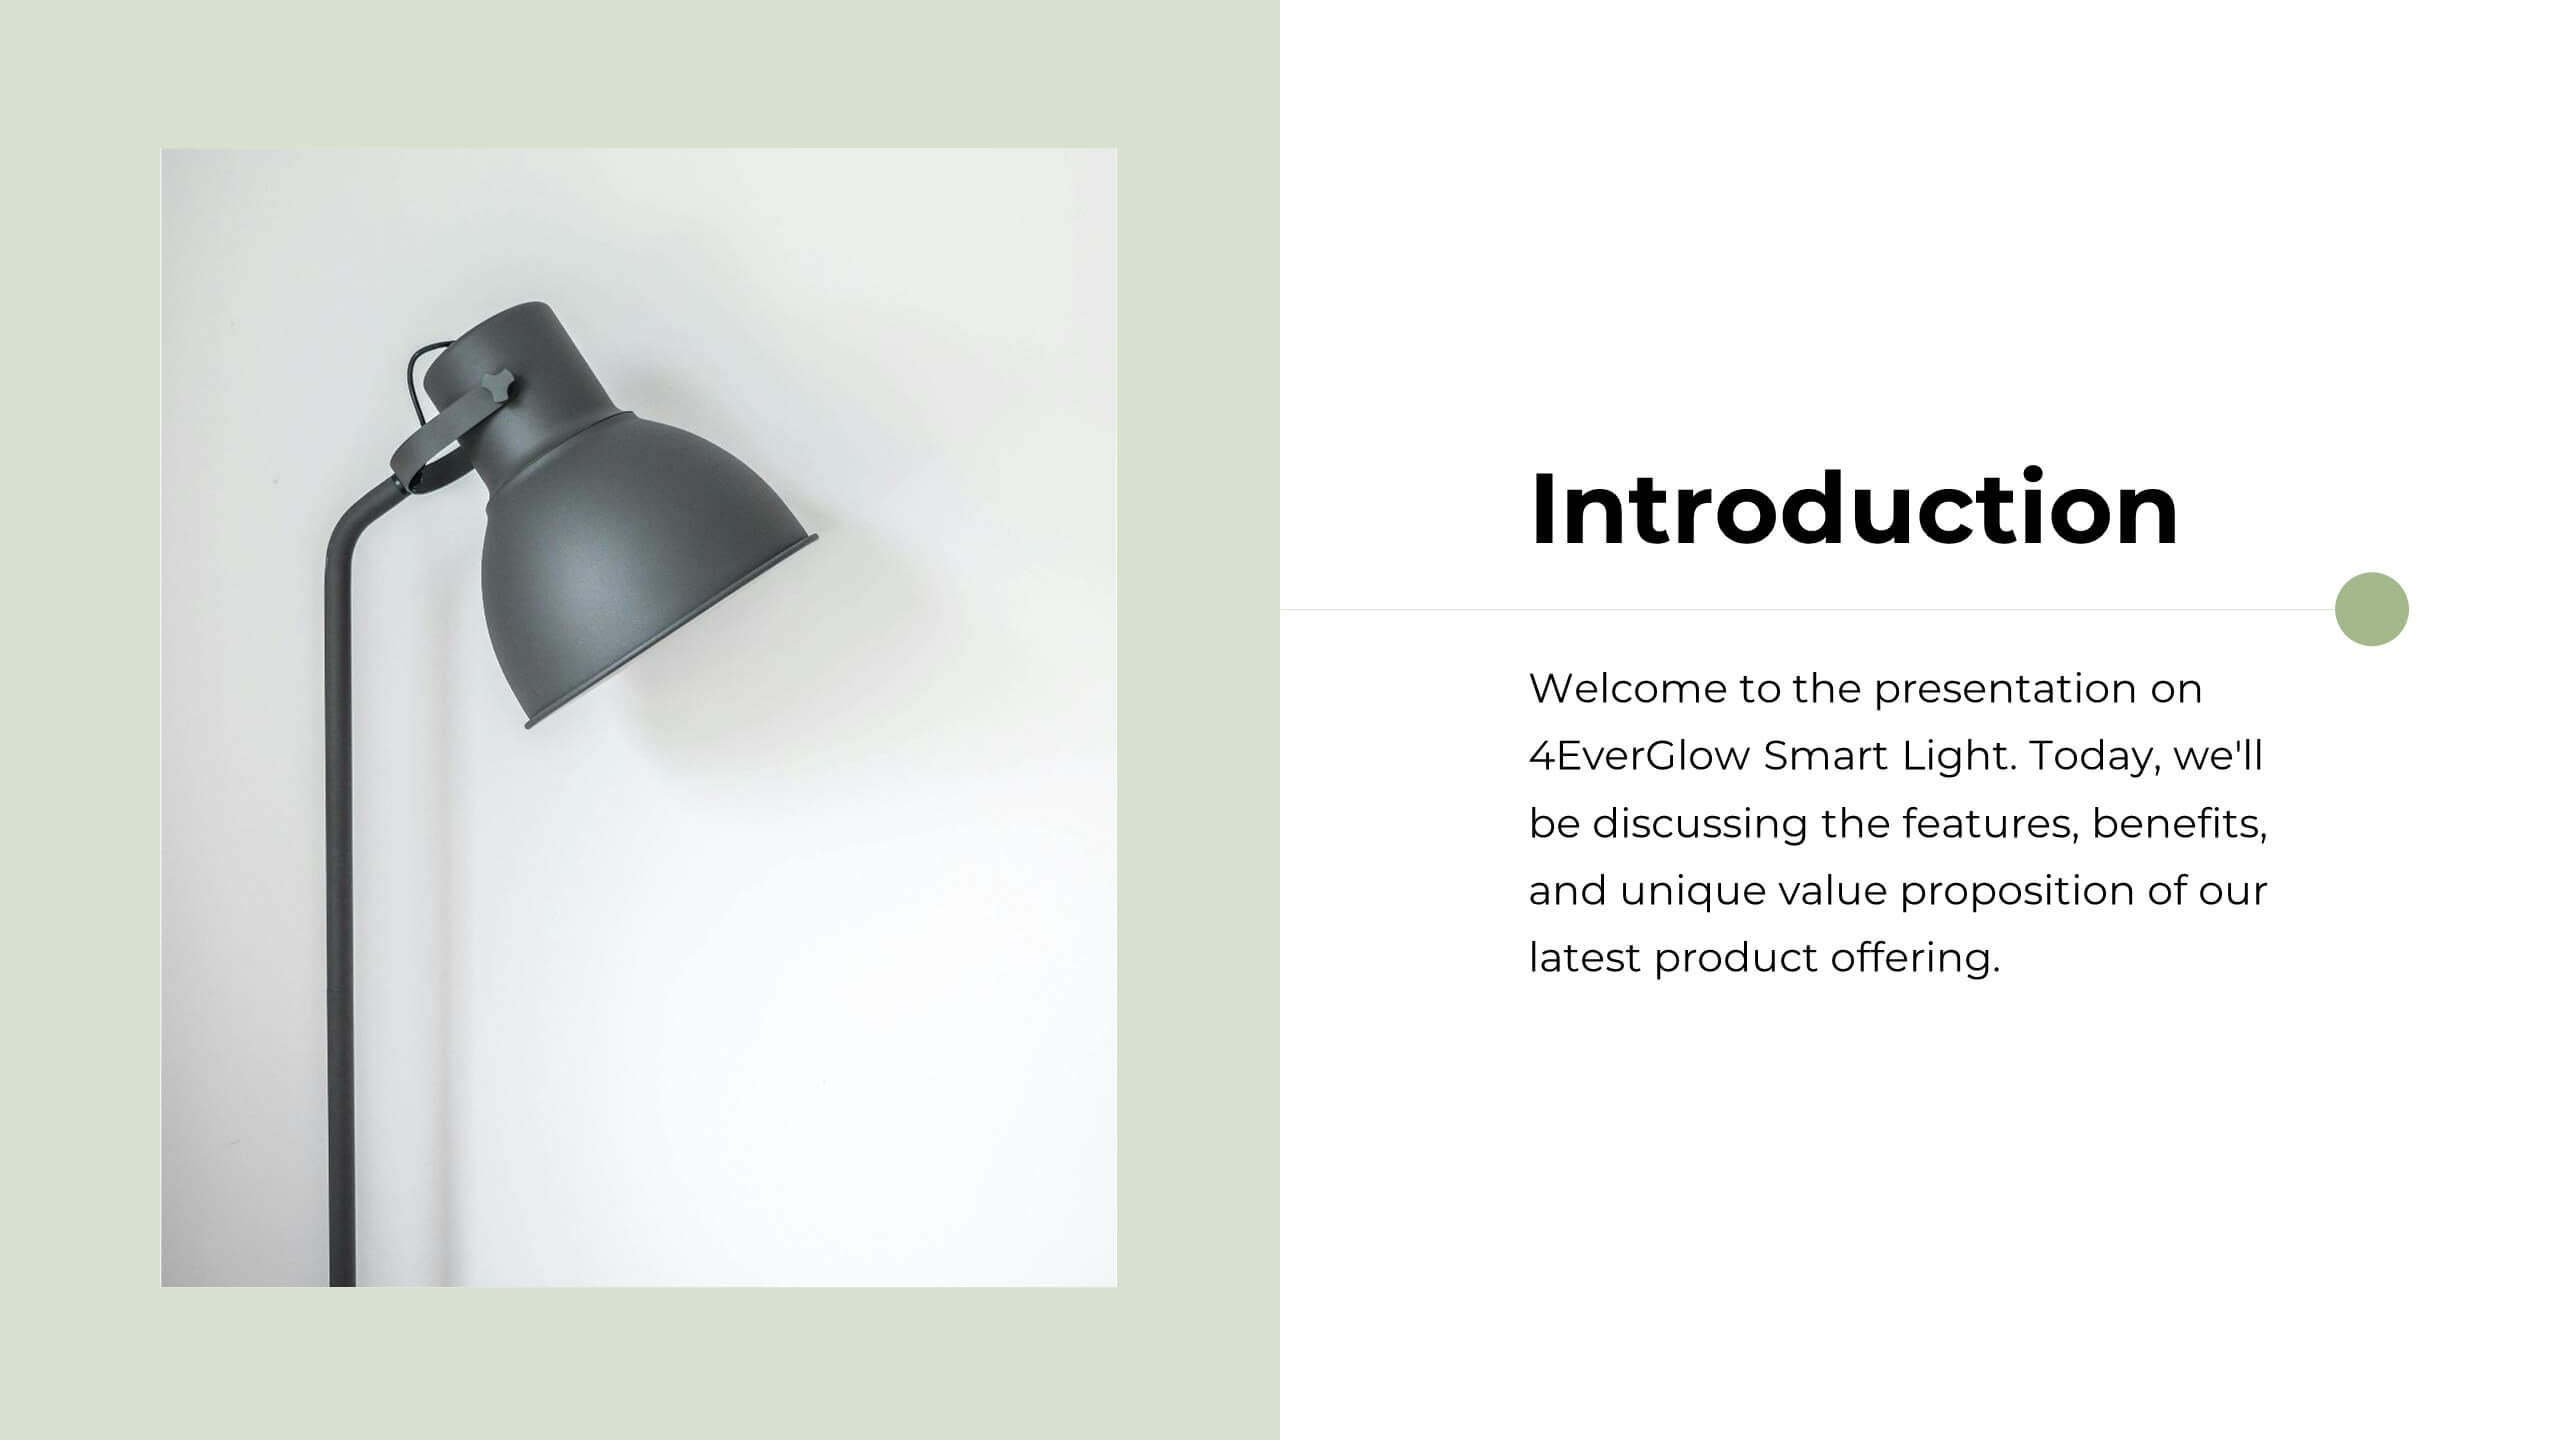
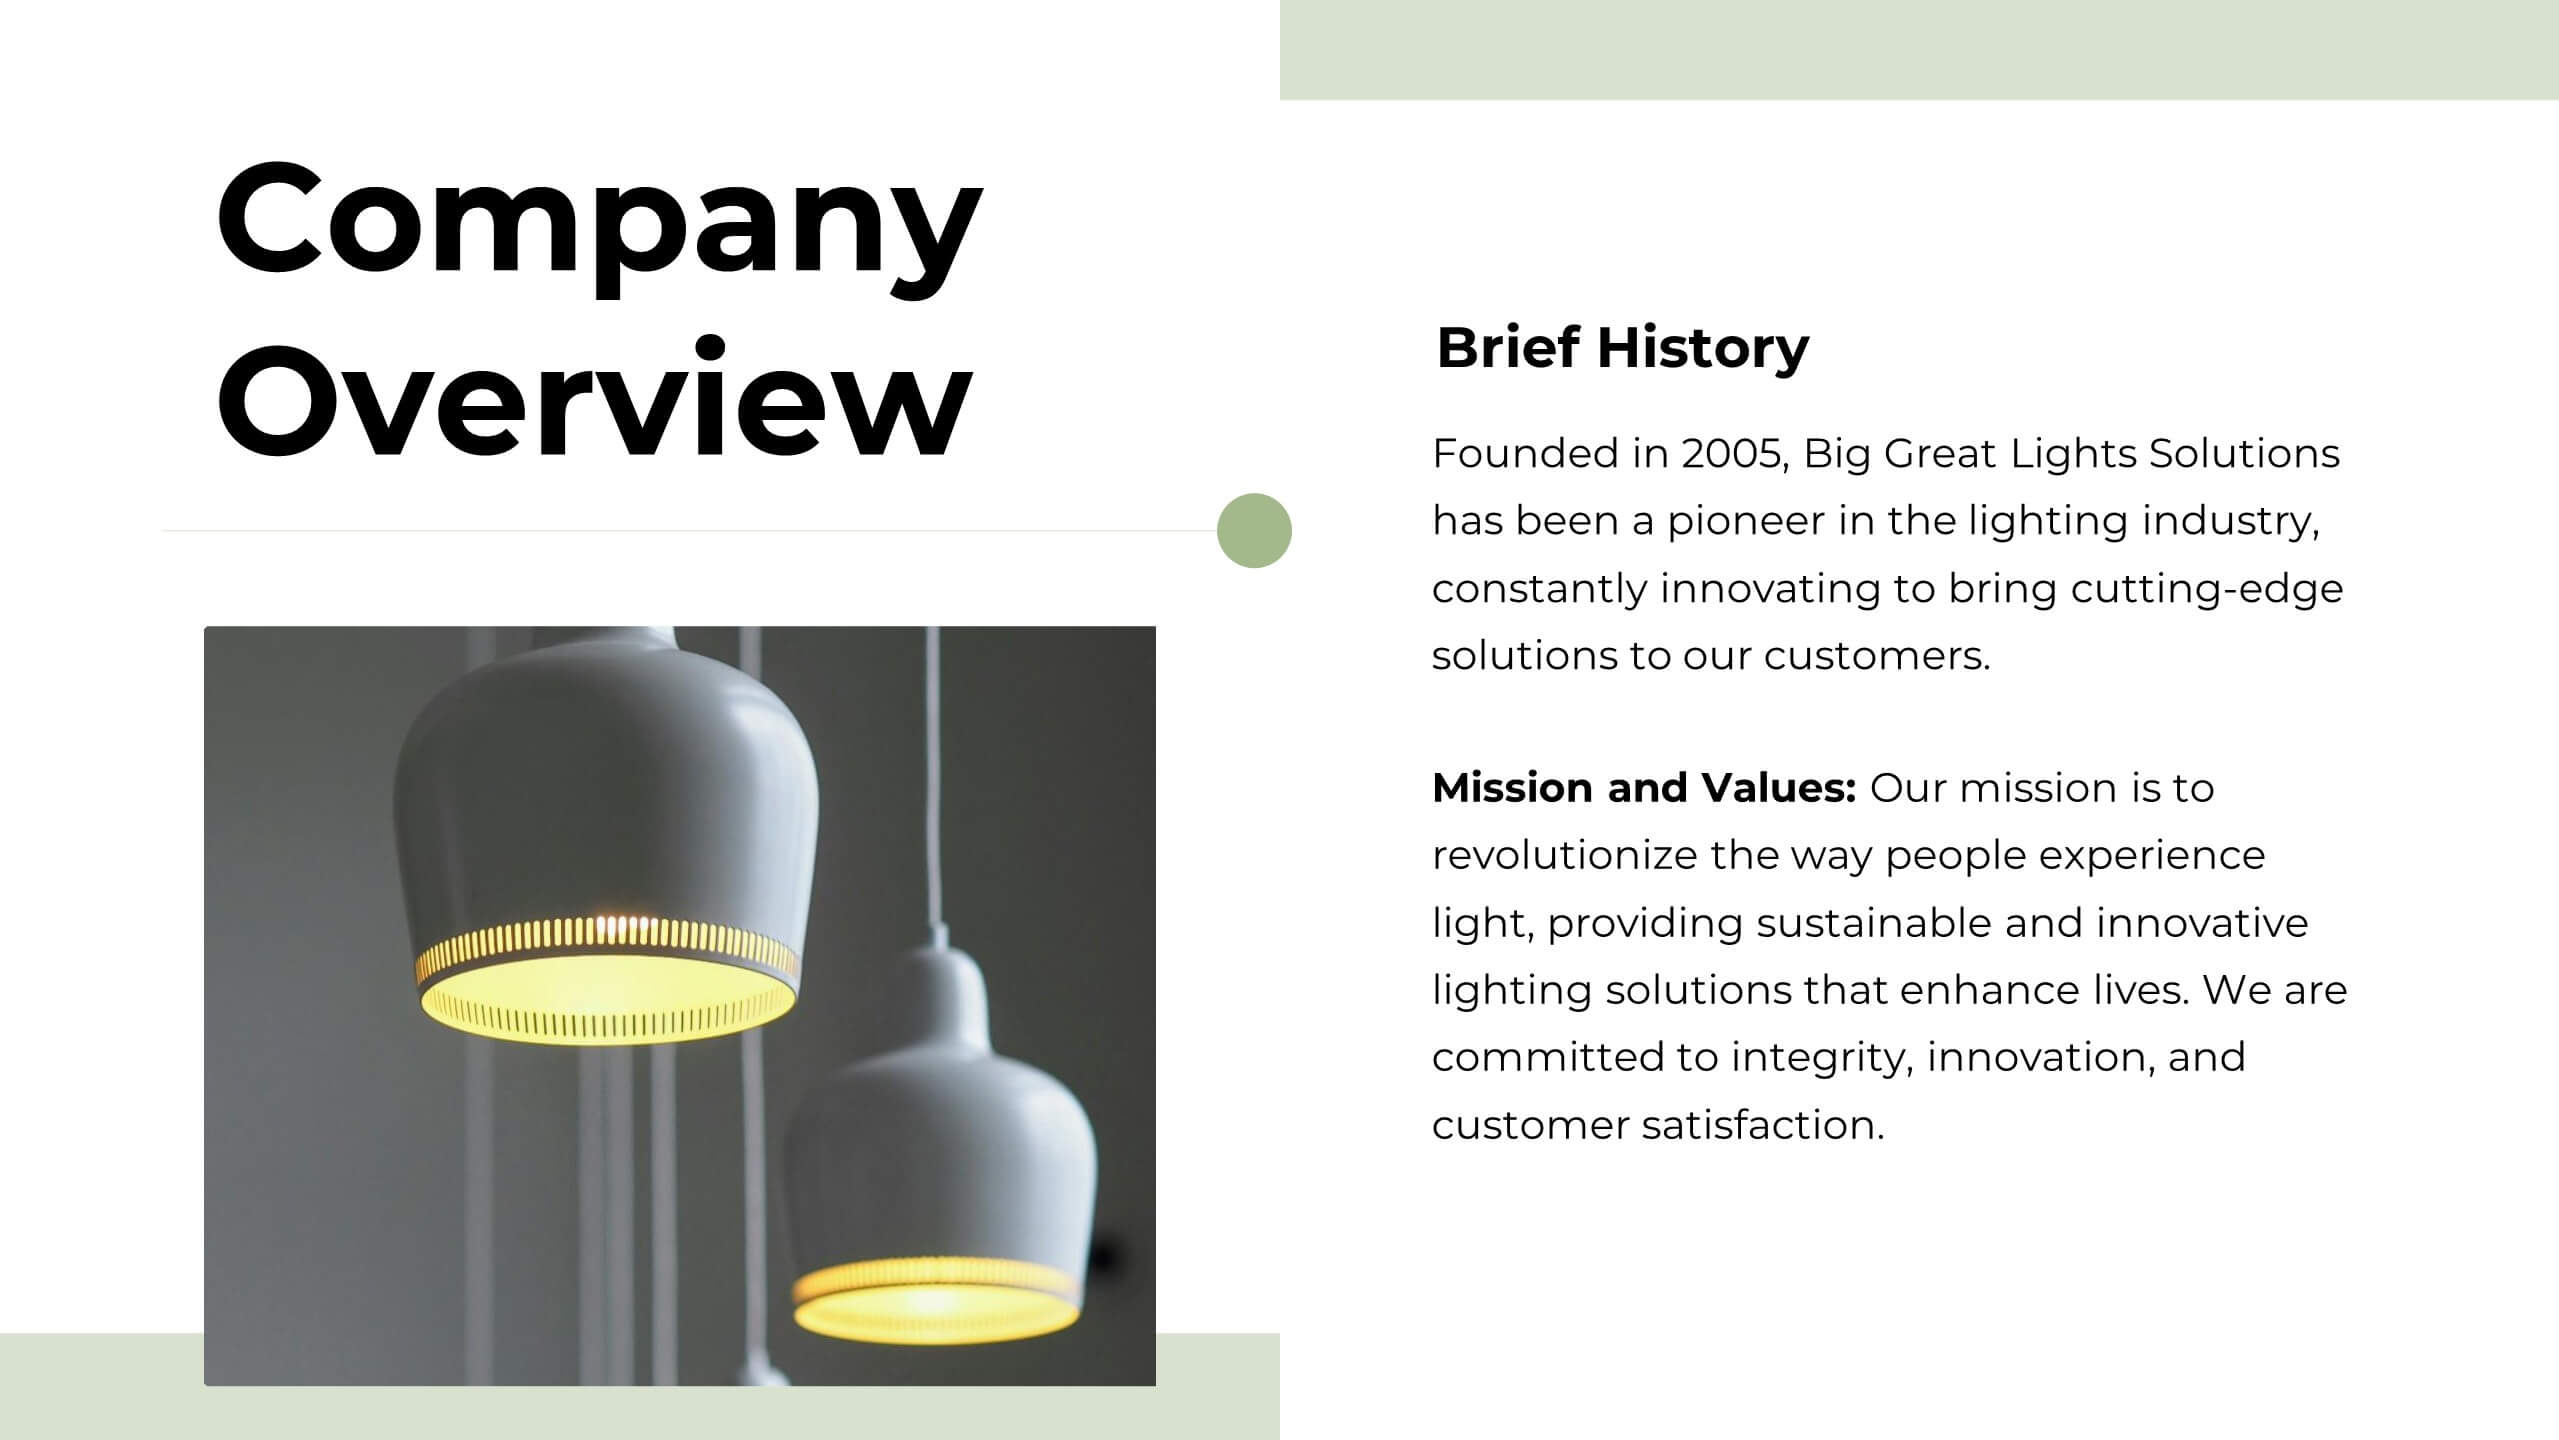
Glint Product Launch Presentation
Develop your product with confidence using this detailed product development plan template! Perfect for outlining features, market analysis, and competitive advantages. Ensure your team's efforts are aligned and maximize the impact of your product launch. Compatible with PowerPoint, Keynote, and Google Slides, it’s your ideal companion for successful product development.


6 slides
Executive Summary of Findings Presentation
Summarize your key insights with clarity using this Executive Summary of Findings slide. Designed with a centered target icon and surrounding data points, it’s ideal for spotlighting major conclusions. Fully editable in PowerPoint, Keynote, and Google Slides.


20 slides
Stratoshade Project Proposal Presentation
Present a comprehensive project proposal with this template, featuring sections for introduction, objectives, methodology, deliverables, budget breakdown, and client testimonials. Clearly outline goals, timeline, pricing, and risk mitigation strategies. Perfect for PowerPoint, Keynote, and Google Slides, ensuring a polished and professional presentation for project pitches.


7 slides
E-Learning Tools Infographic Presentation
E-learning refers to any type of learning that occurs through electronic devices, and offers numerous benefits, including flexibility, cost-effectiveness, continuous learning, and environmental friendliness. This E-Learning Template is designed to make your online training and educational material more engaging and effective. The template is fully customizable and compatible with presentation software such as Powerpoint, Keynote, and Google Slides. This template is a powerful tool for anyone who wants to create engaging and effective online training and educational material!