


Features
- 8 Unique slides
- Fully editable and easy to edit in Microsoft Powerpoint, Keynote and Google Slides
- 16:9 widescreen layout
- Clean and professional designs
- Export to JPG, PDF or send by email


Do you have any questions?
Recommend


5 slides
Organ Structure Breakdown Slide Presentation
Bring your anatomy data to life with this clear and engaging organ breakdown slide. Designed to visually map out key organ functions or statistics, this layout makes complex info feel simple. Whether you're teaching biology or sharing medical research, it's editable and works with PowerPoint, Keynote, and Google Slides.


10 slides
Business Scaling Strategy Presentation
Achieve rapid growth with the Business Scaling Strategy Diagram. This professional template helps you visualize key steps, strategic phases, and milestones for scaling a business effectively. Designed for entrepreneurs, executives, and consultants, this slide ensures a clear and structured presentation of your expansion strategy. Fully customizable and compatible with PowerPoint, Keynote, and Google Slides.


6 slides
Financial Report Summary Presentation
Showcase key financial highlights with the Financial Report Summary slide. Featuring a central moneybag icon surrounded by currency symbols, this layout is ideal for presenting up to five critical financial insights or revenue sources. Each label is paired with editable titles and descriptions to keep your content clear and relevant. Fully compatible with PowerPoint, Keynote, and Google Slides for effortless customization.


7 slides
Oceania Map Infographic Presentation Template
The Oceania Map is a geographical region comprising Australasia, Melanesia, Micronesia and Polynesia. The largest landmass of Oceania is Australia. Oceania's borders differ slightly from country to country, but its boundaries are mostly defined by the waters surrounding its many islands. This Oceania map template is the first step to creating an engaging and informative map. It features the entire continent, surrounding islands, and sub-regions. The white background makes it easy to fill out with your colorful content. This template is suitable for school projects or business presentations.


5 slides
Stakeholder Expectations and Influence Matrix Presentation
Visualize your stakeholder dynamics with the Stakeholder Expectations and Influence Matrix Presentation. This slide uses a four-quadrant model—Monitor, Keep Informed, Keep Satisfied, Manage Closely—to map influence versus interest. Perfect for strategic planning, stakeholder communication, and project alignment. Editable in PowerPoint, Keynote, and Google Slides.


7 slides
Time Management Infographic Presentation Template
Time management skills are important in all aspects of life, not just work. Mastering time management allows you to get everything that you want out of your day. This time management template is the perfect tool to help you stay productive. Keep track of tasks, create a schedule and organize time where you need it most. Use this template to build a database of your weekly tasks, daily activities and recurring tasks that can be easily structured in a clock view. This time management template Is compatible with Powerpoint, Keynote, and Google Slides, so you can use it on any device.


5 slides
Level-Based Authority Chart Presentation
Display organizational hierarchy with clarity using this level-based authority chart. The pyramid layout highlights reporting tiers, perfect for showcasing leadership roles, department levels, or team structures. Fully customizable in Canva, PowerPoint, or Google Slides—ideal for managers, HR professionals, and business consultants looking to present structured authority in a clean format.


5 slides
Pandemic Prevention and Treatment Options Infographics
Pandemic Prevention is the proactive measures taken to reduce the risk of the spread and impact of infectious diseases on a global scale. These infographic templates are designed to communicate the essential information about pandemic prevention and treatment options. It provides a visually appealing and easy-to-understand overview of key concepts, preventive measures, and treatment options. Use this template to educate and empower your audience with the knowledge needed to navigate pandemics effectively and contribute to public health and safety. This template is perfect for healthcare professionals, educators, and organizations looking to share valuable information.

22 slides
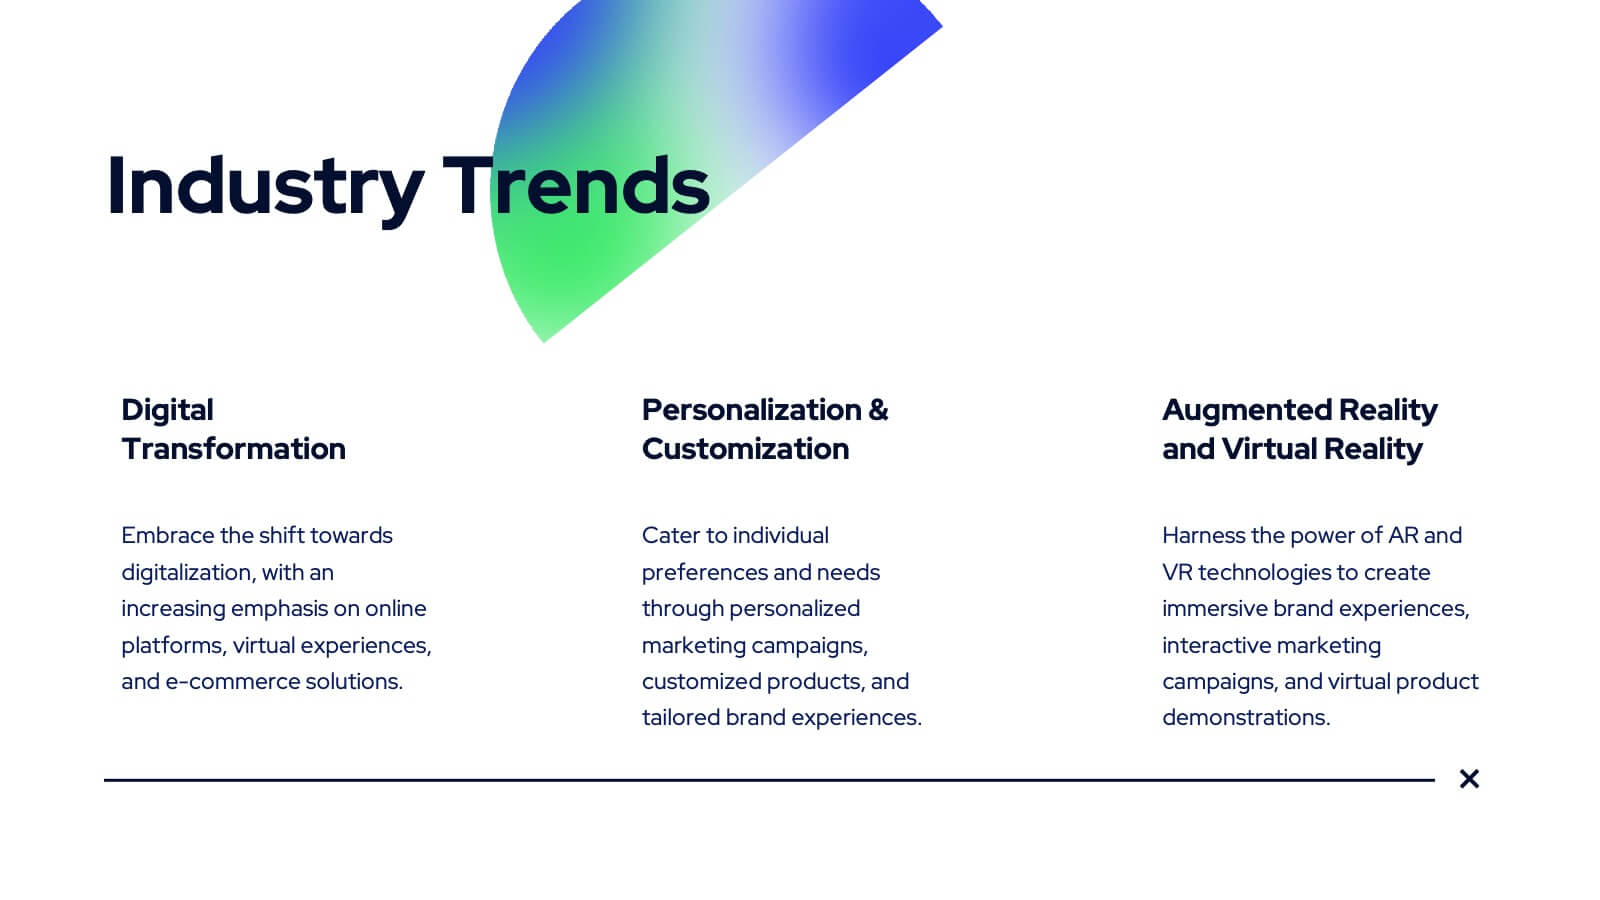
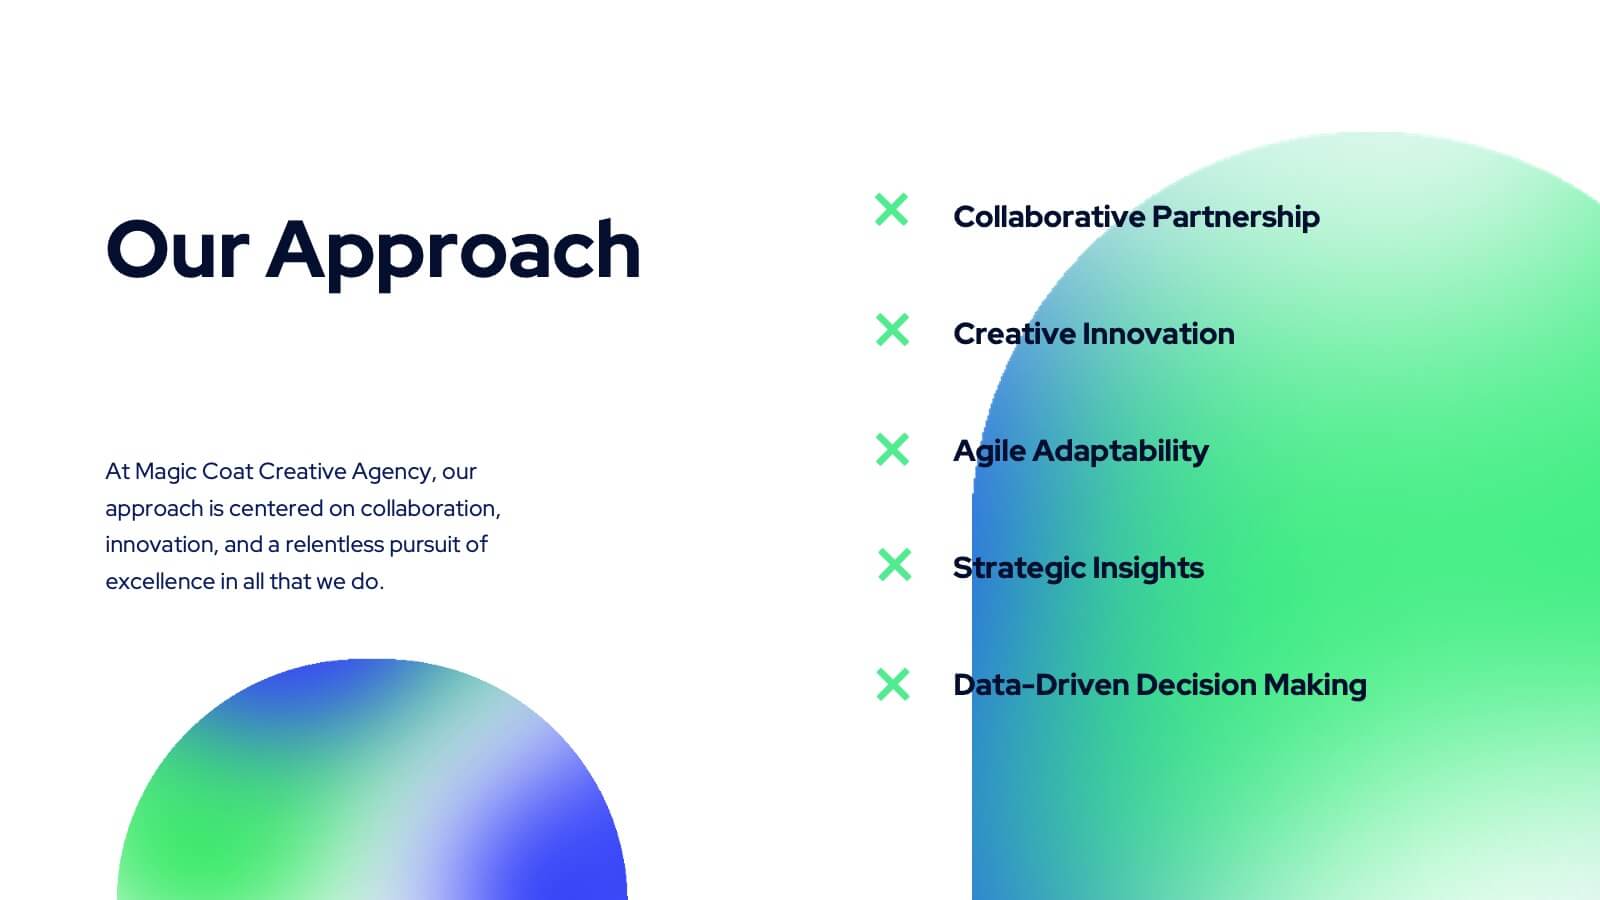
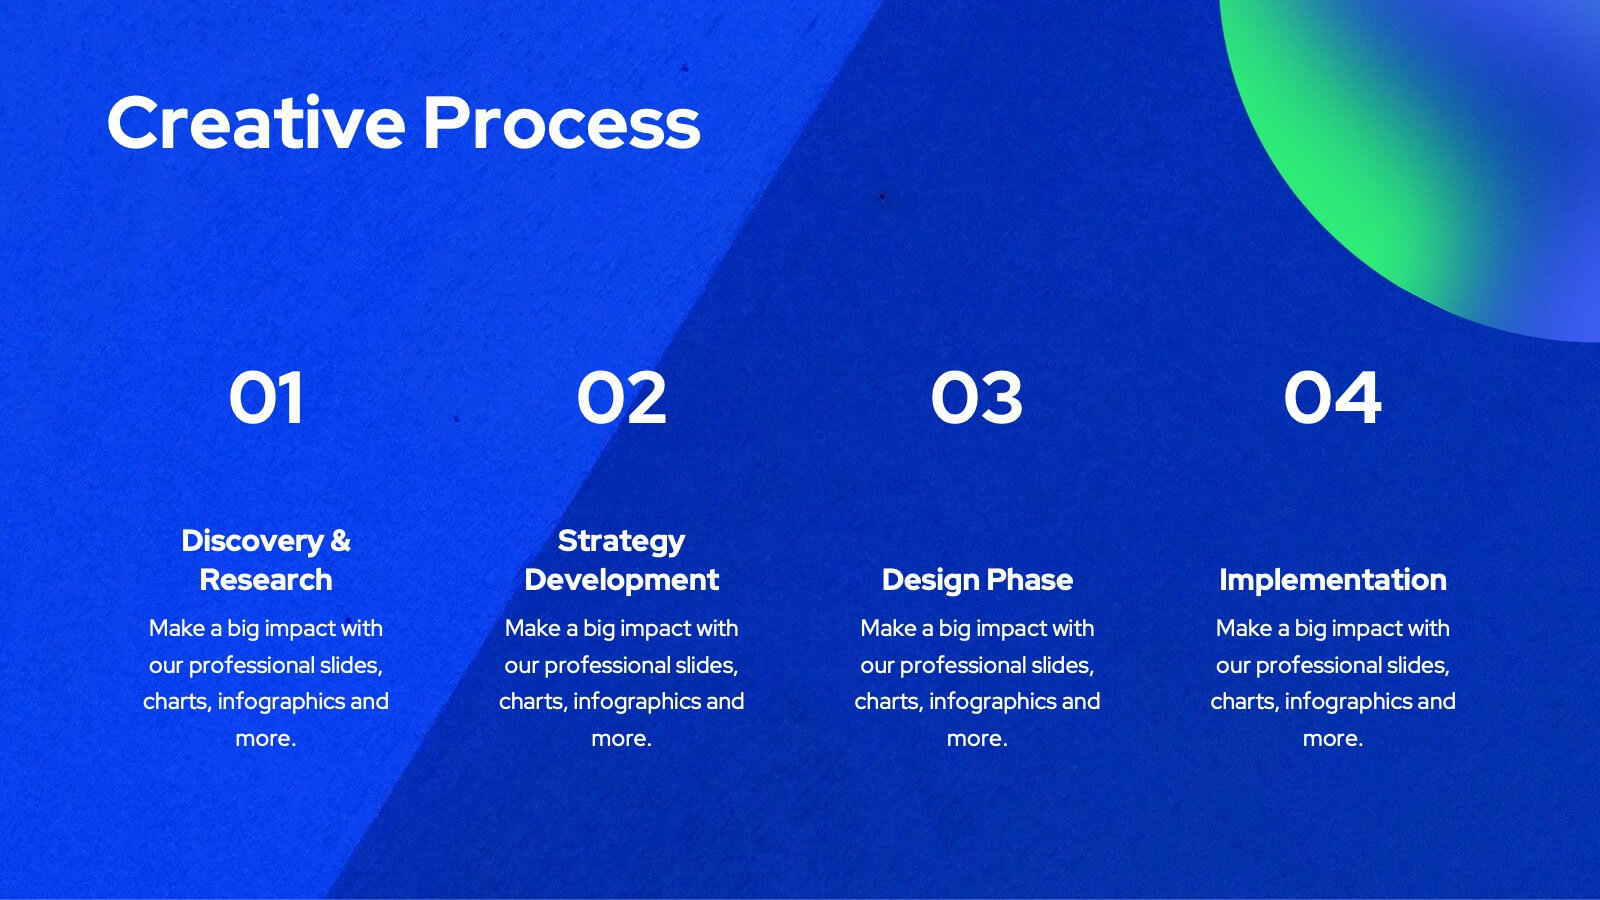
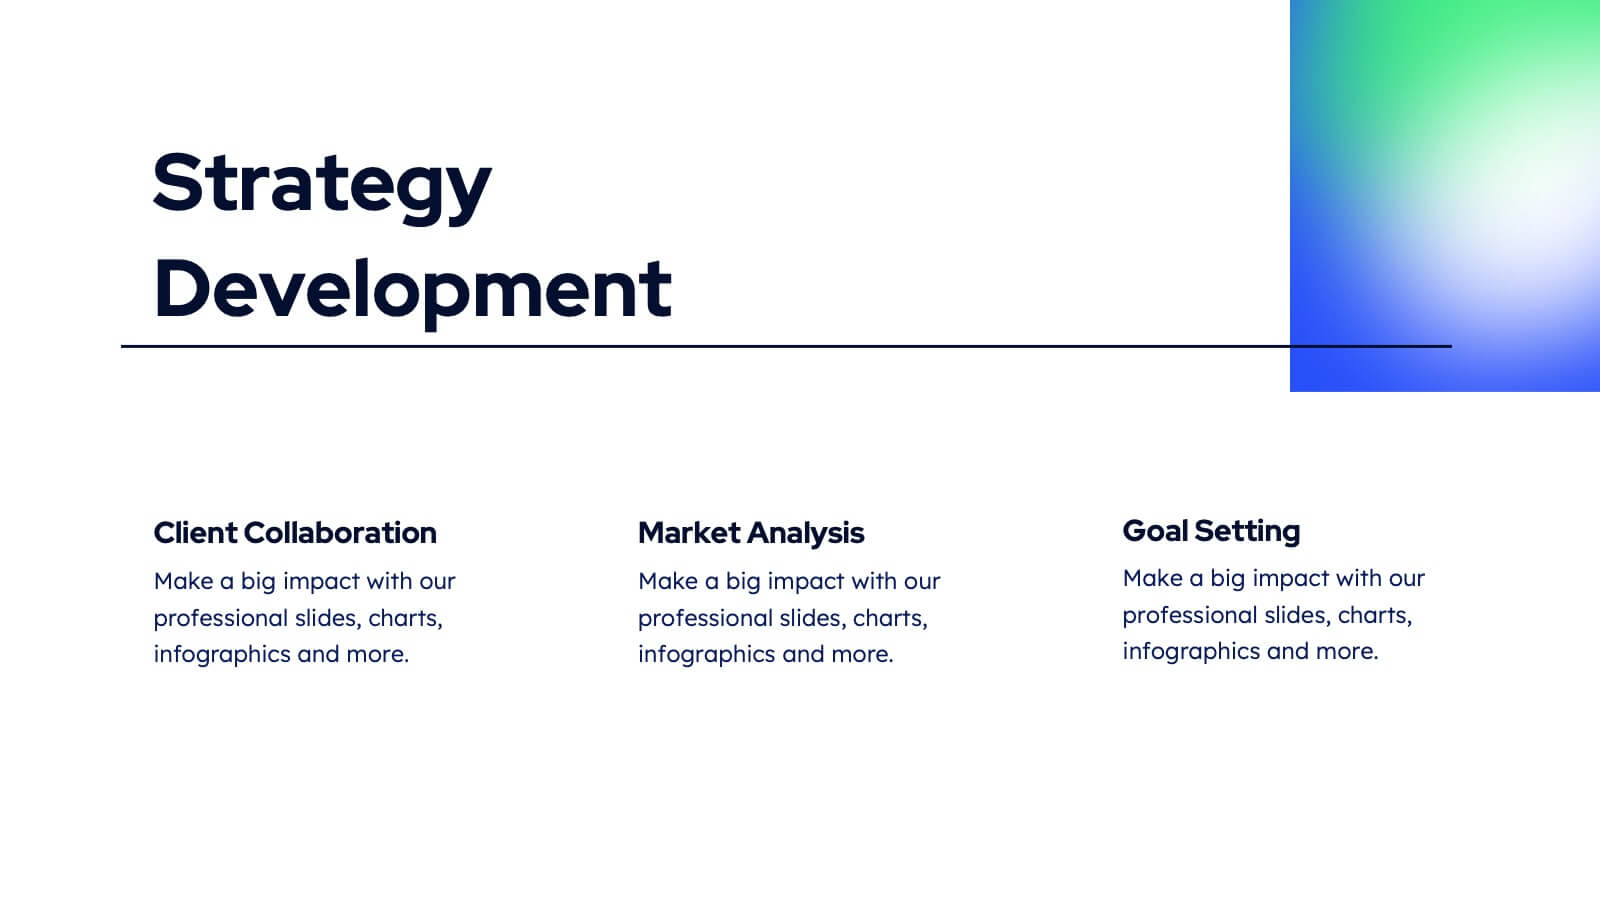
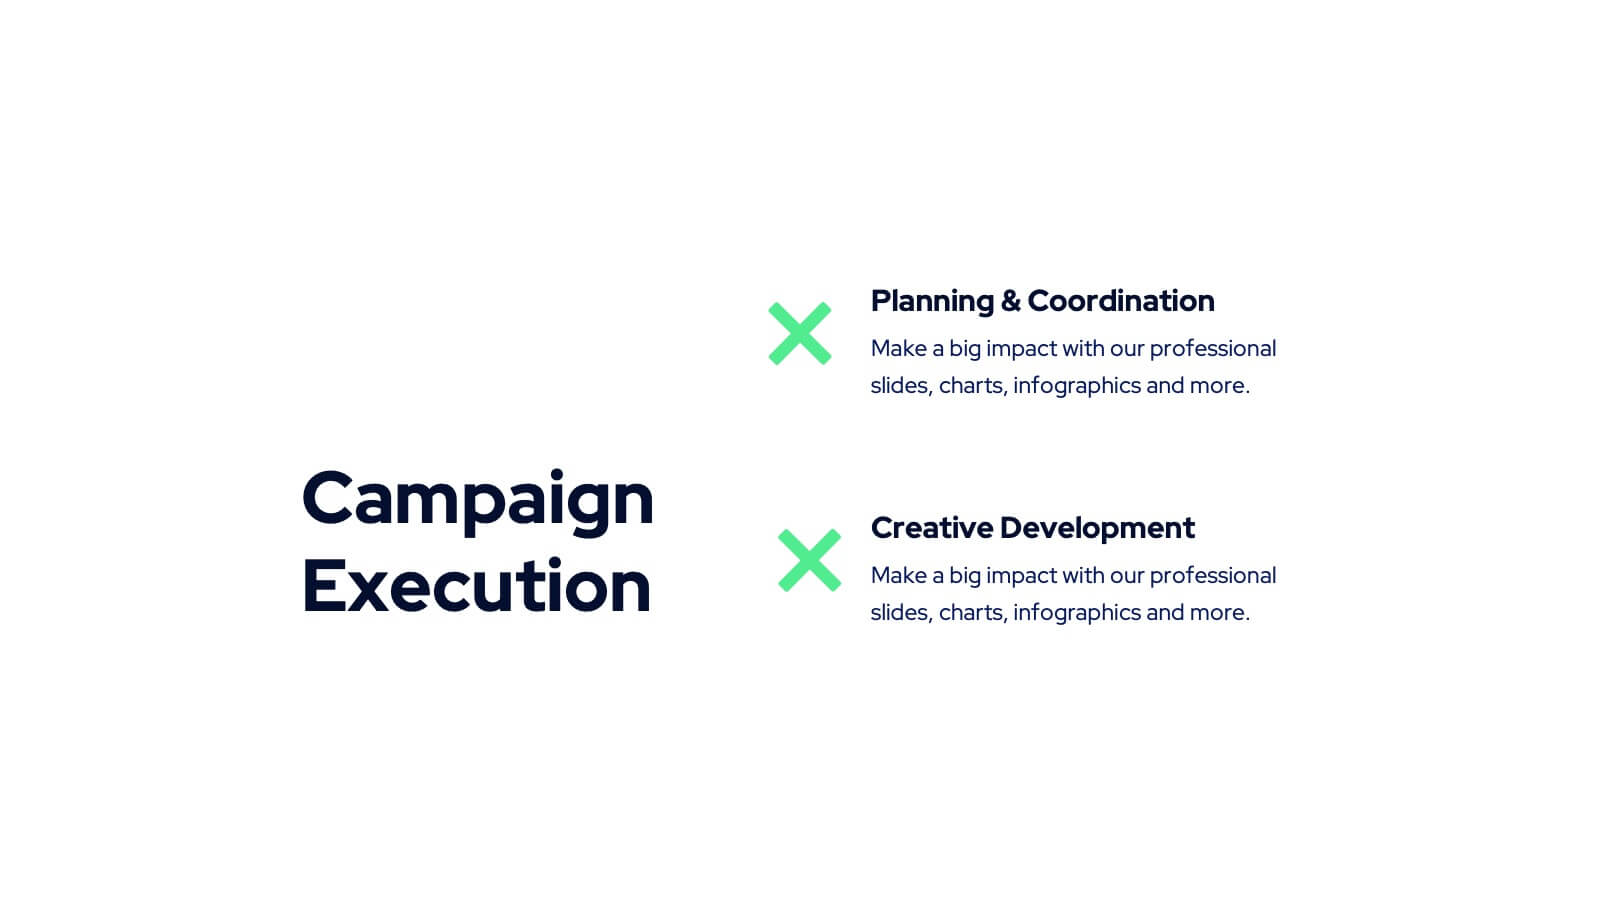
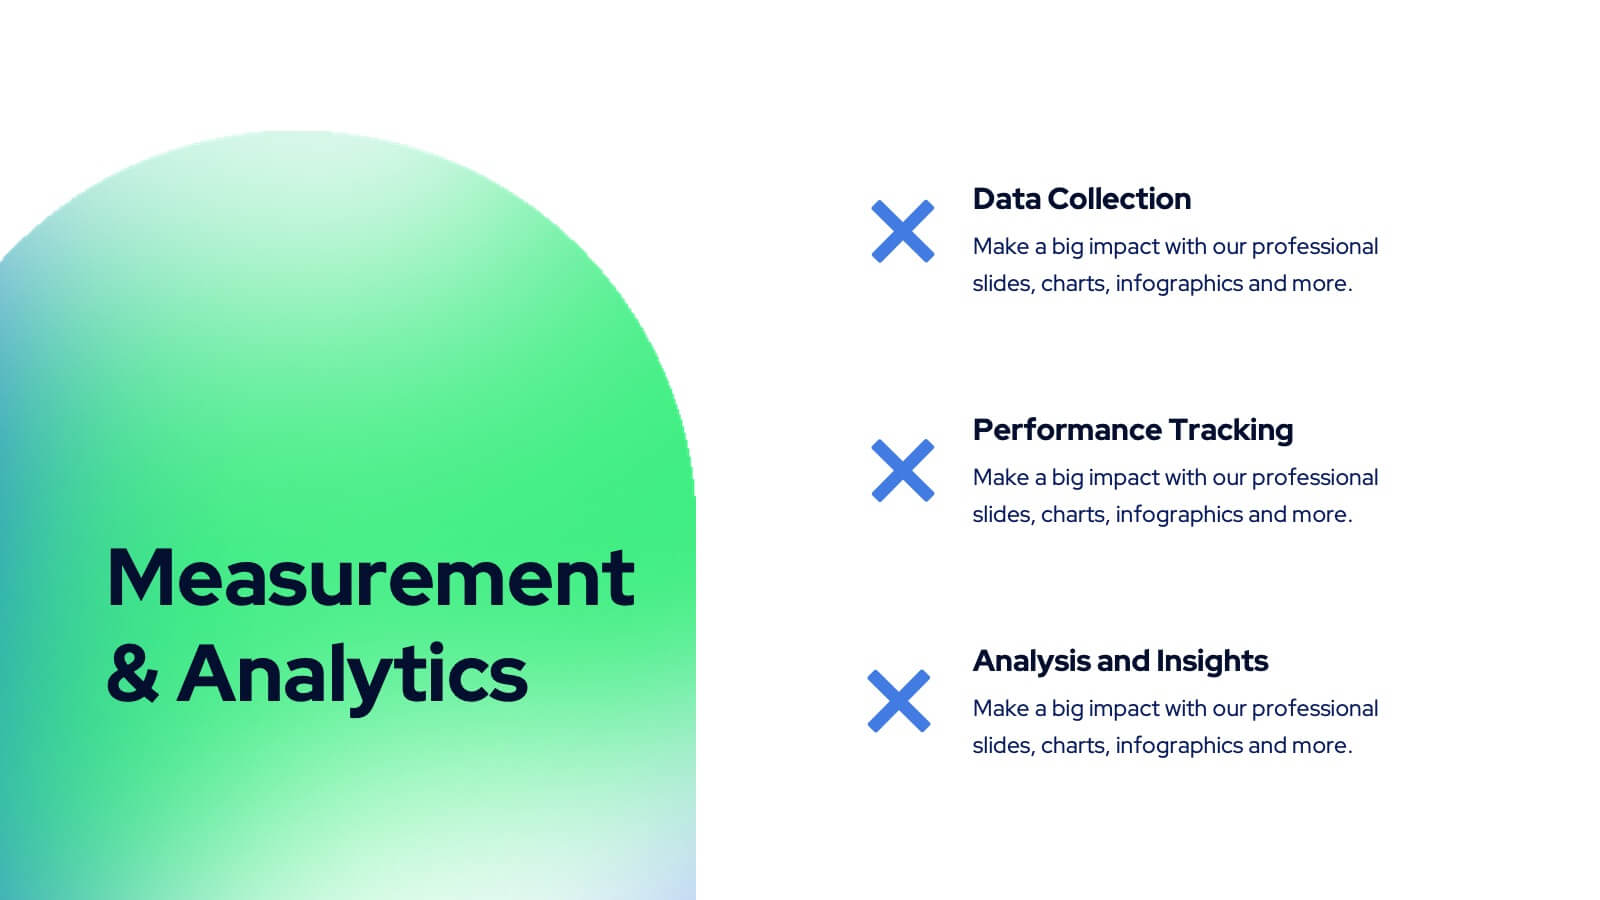
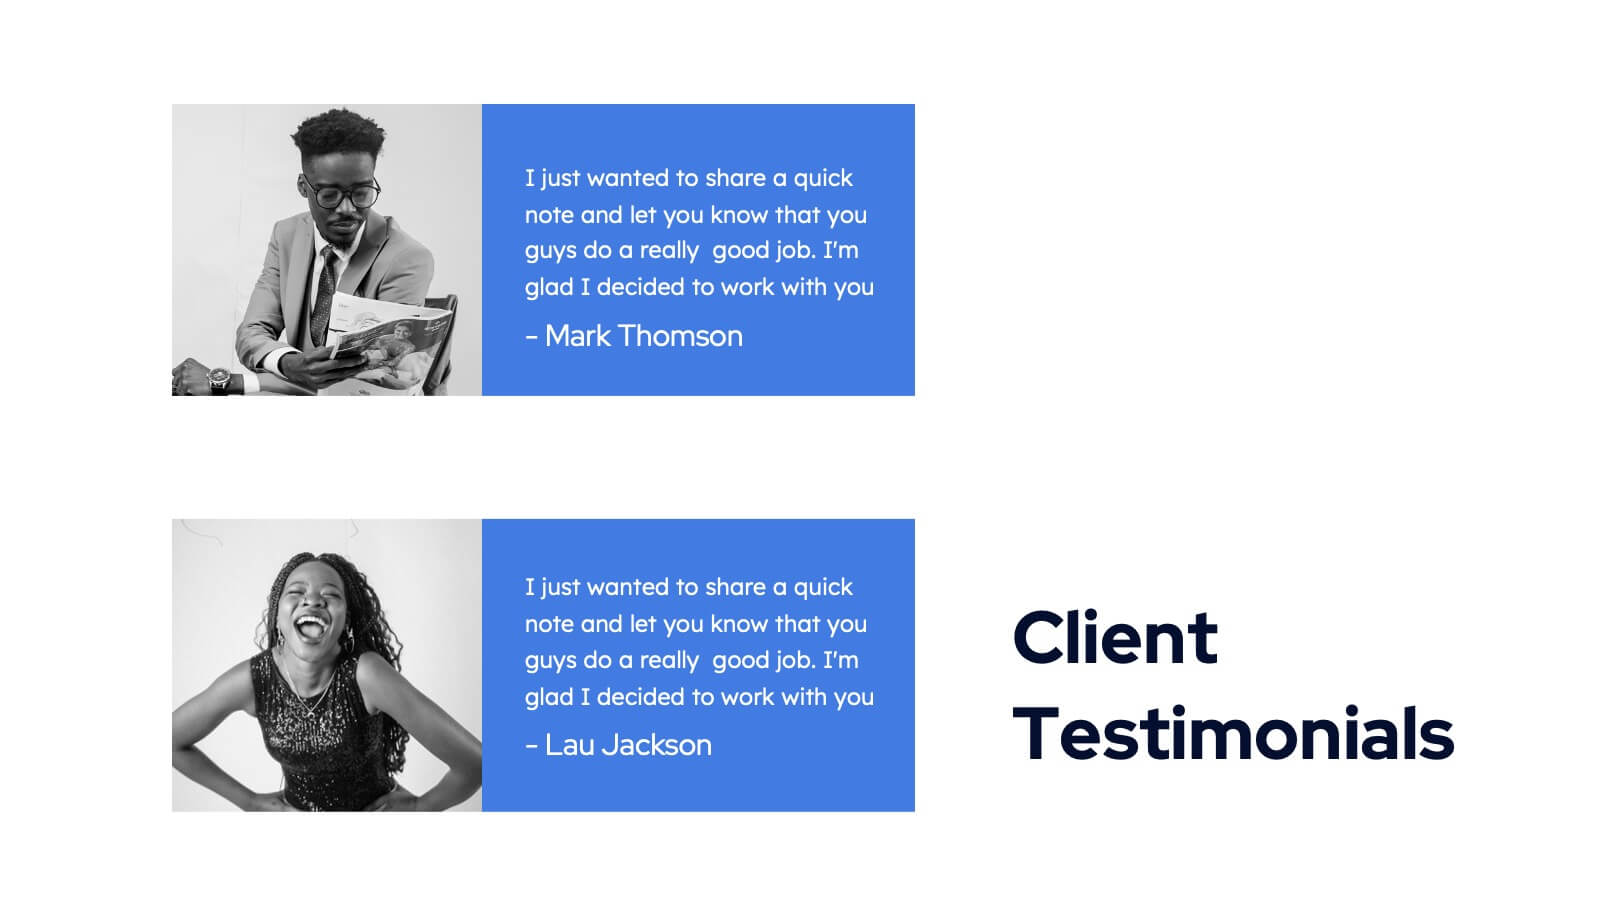
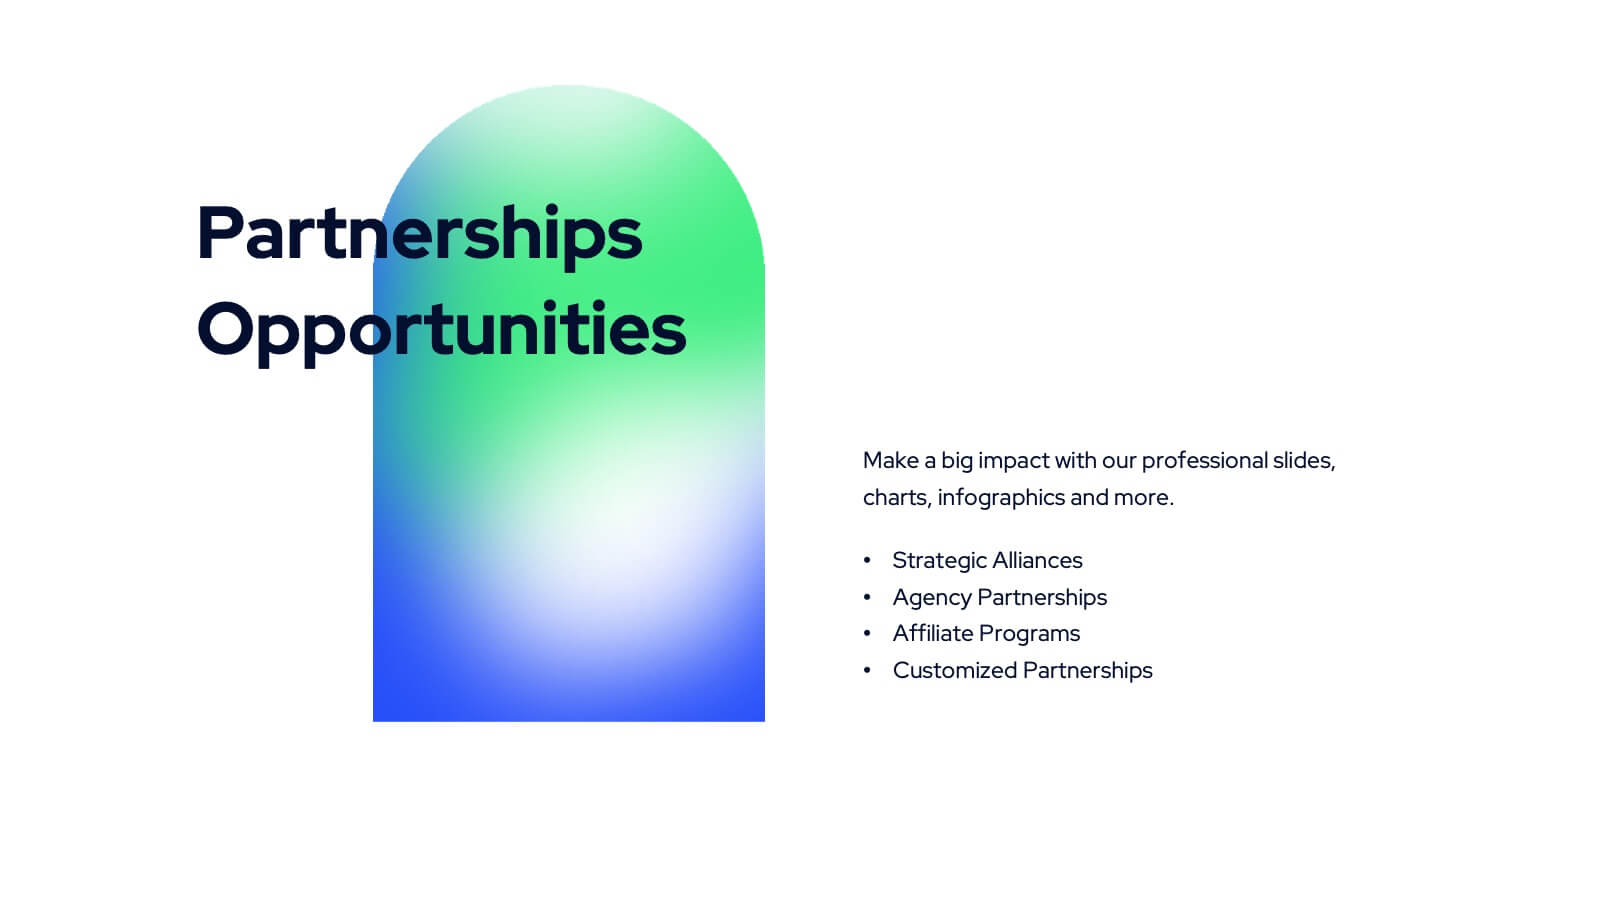
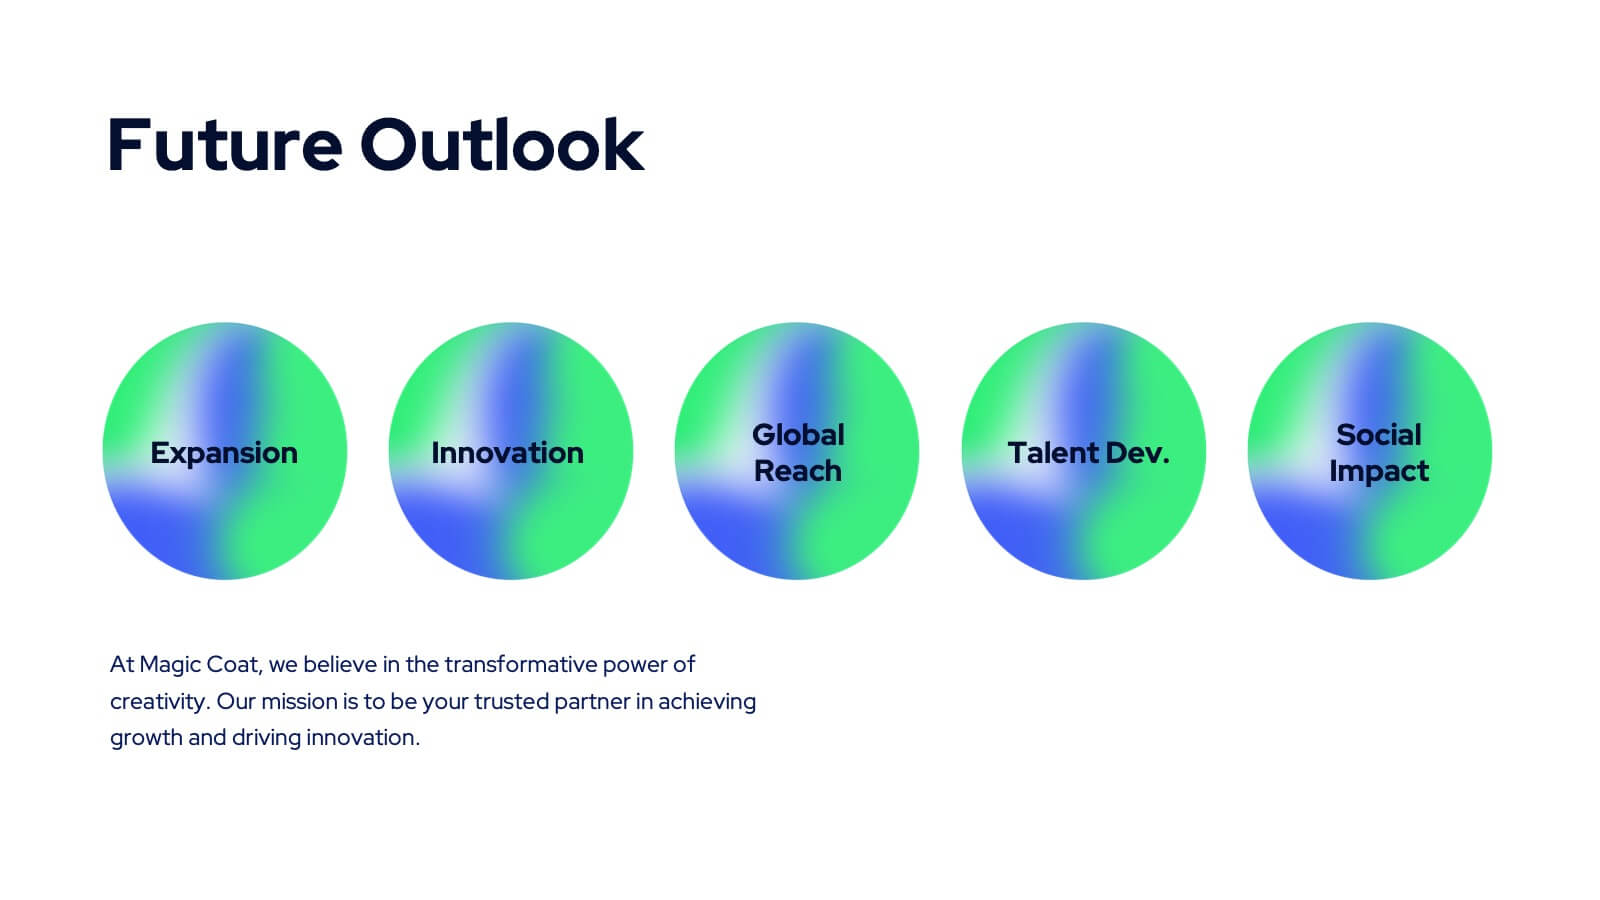
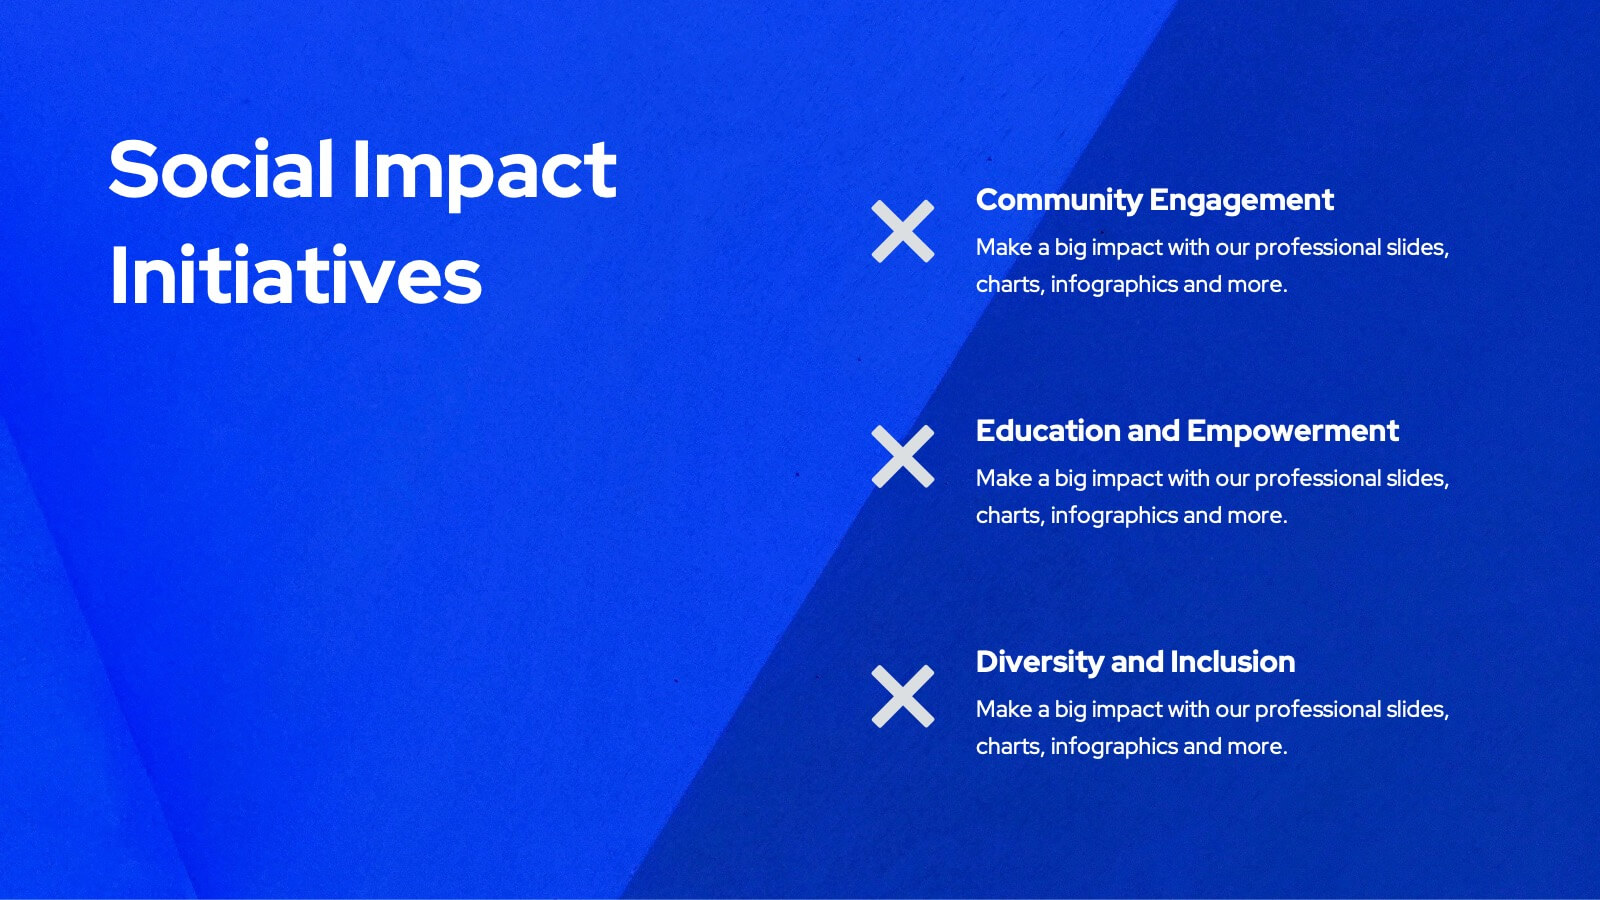
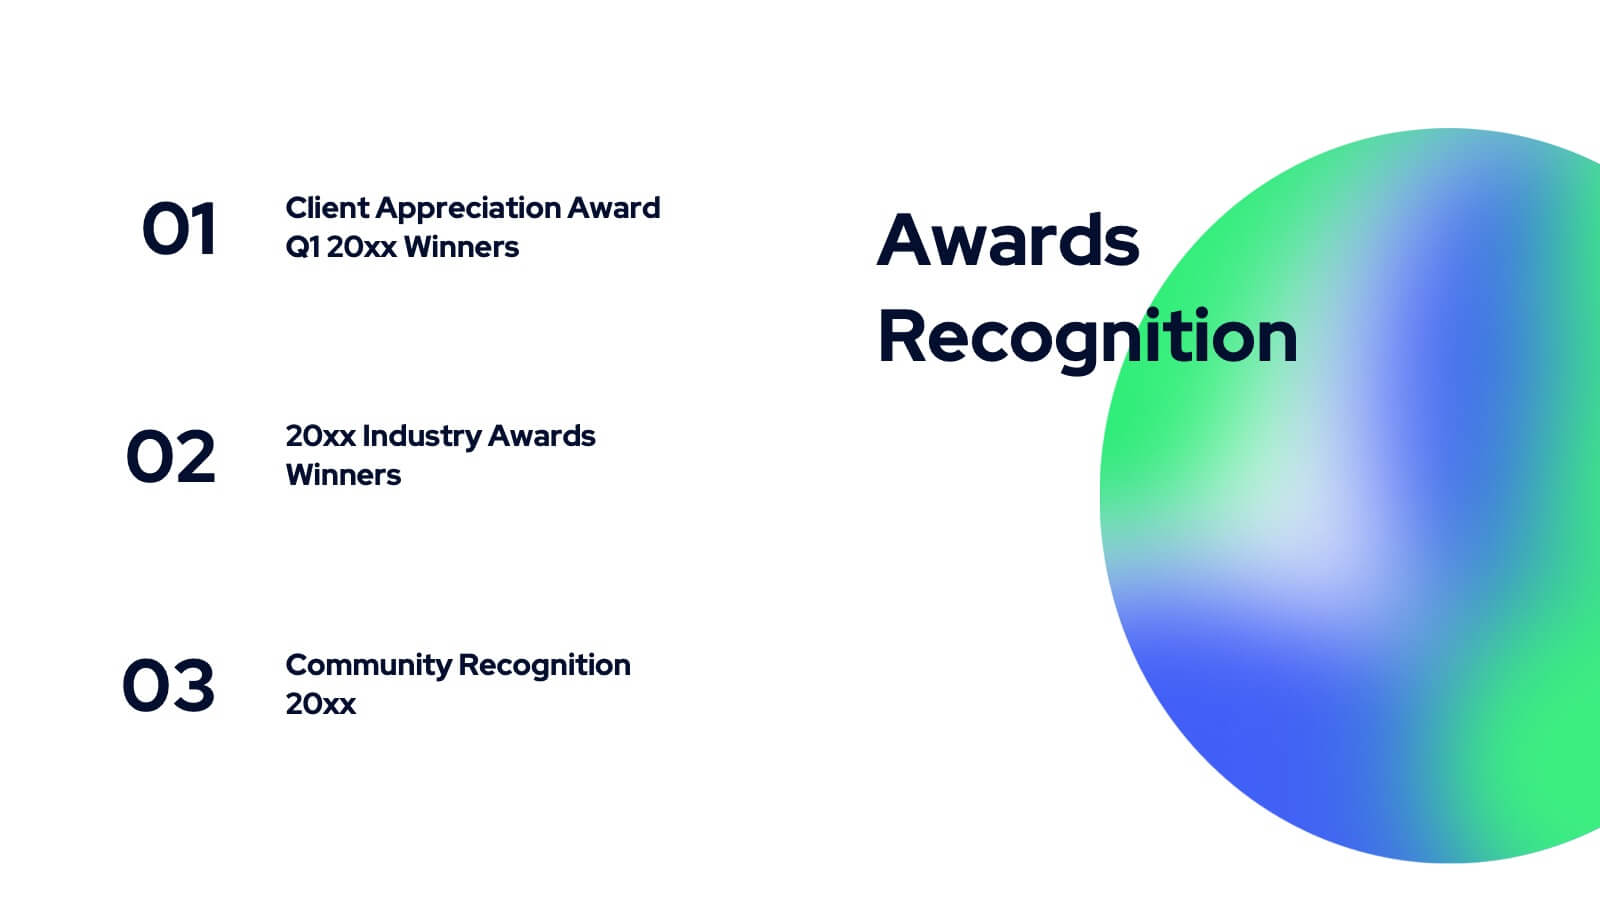
Tanzanite Full-Service Agency Project Plan Presentation
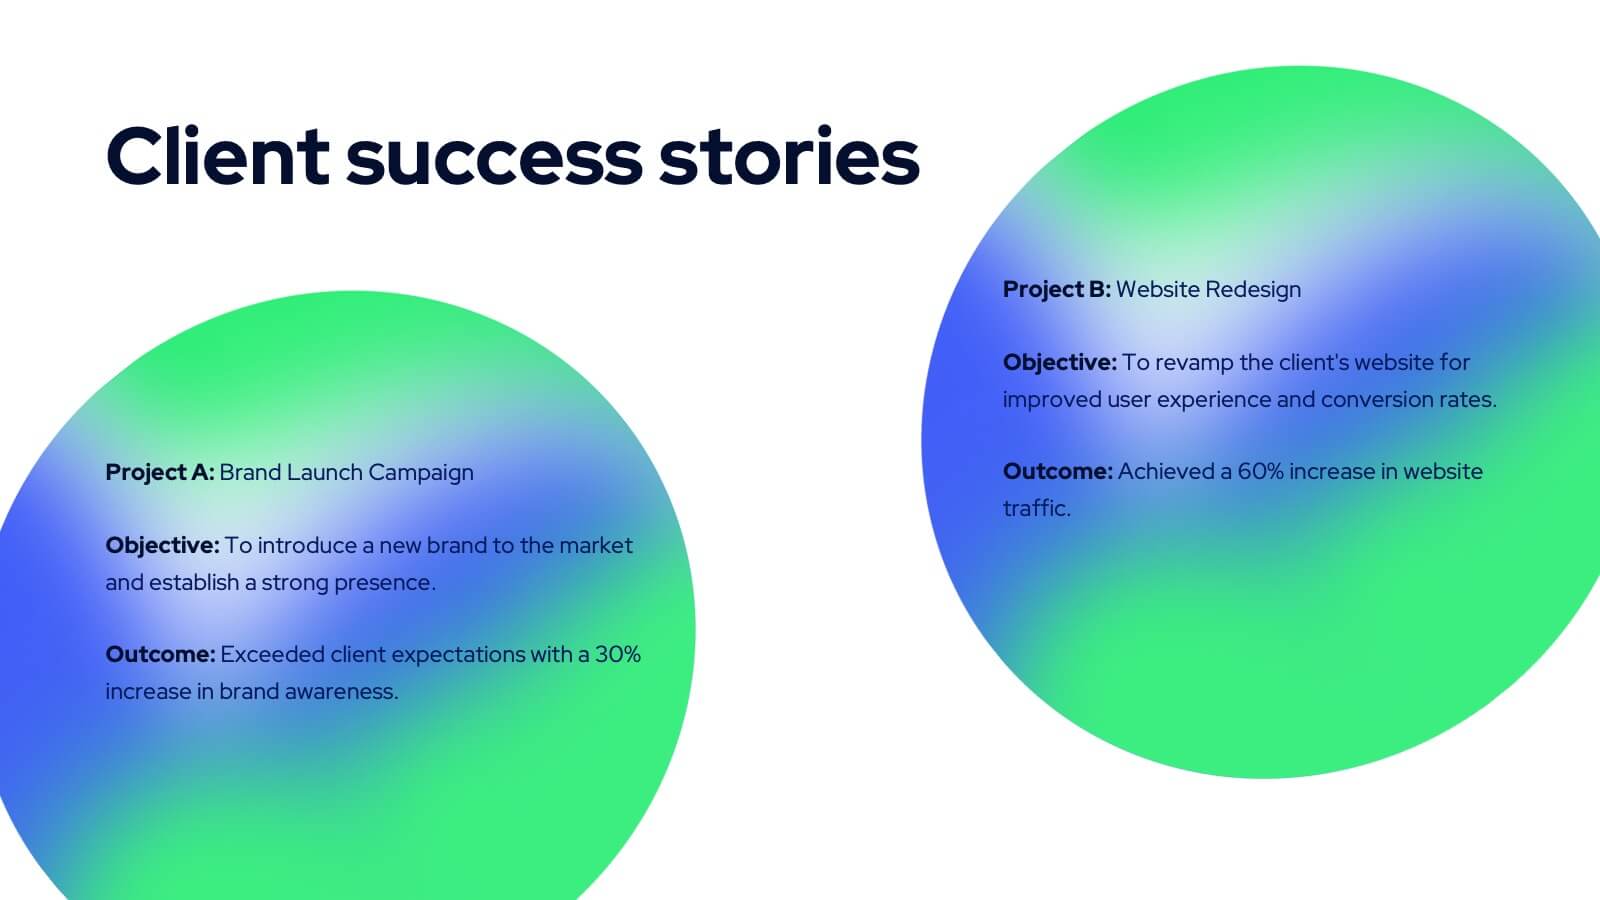
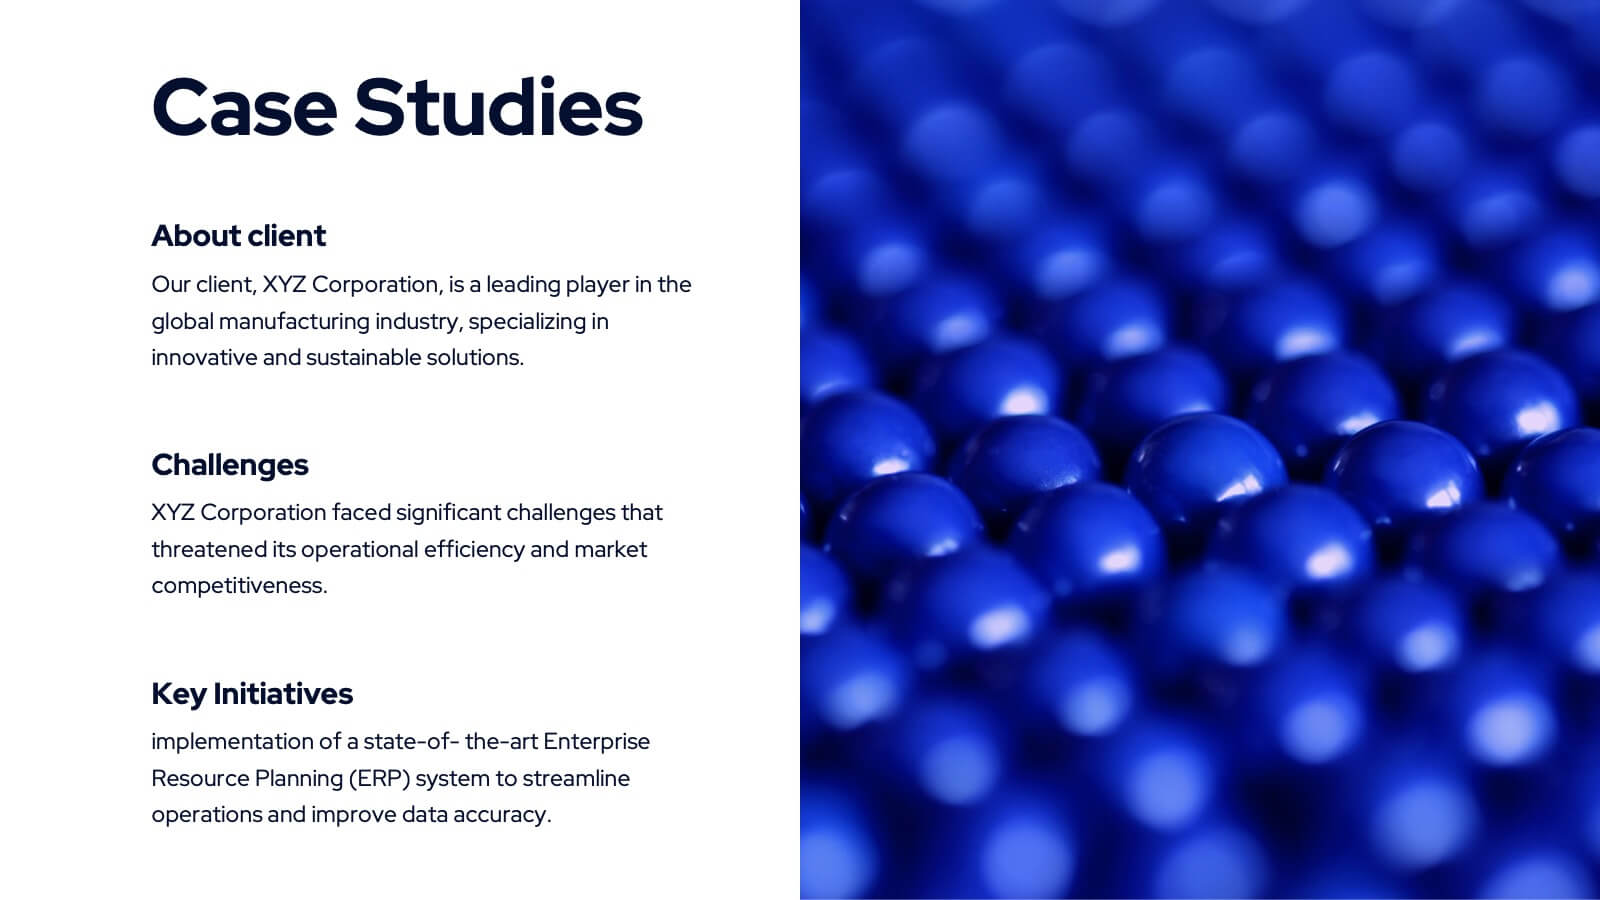
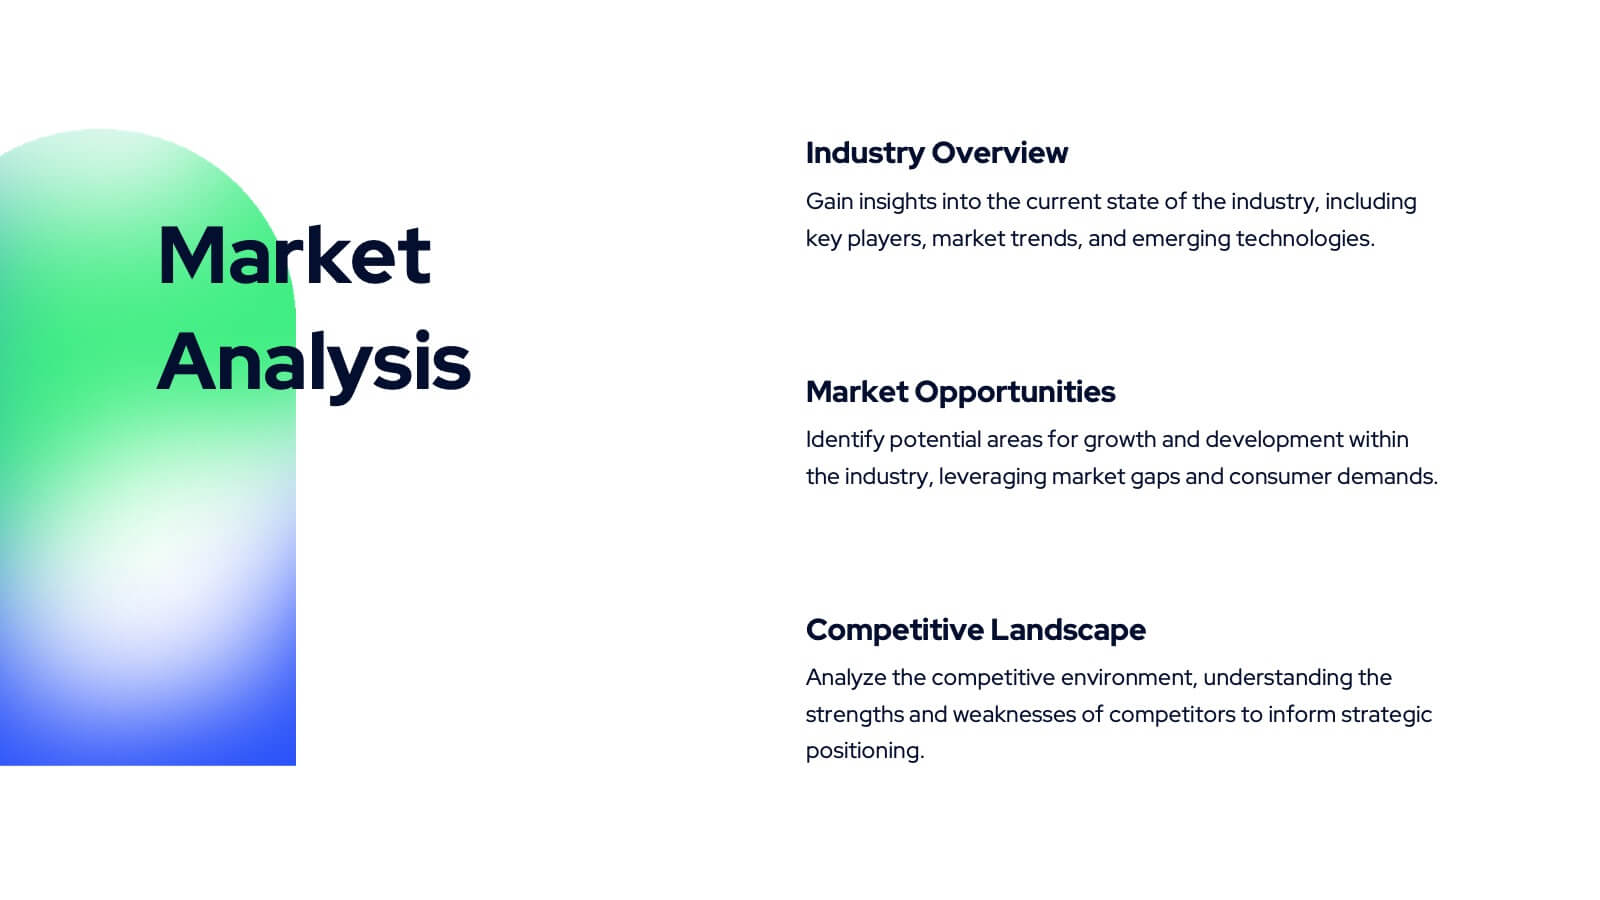
Showcase your agency's strengths with this bold and modern portfolio presentation template! From client success stories and case studies to market analysis and strategy development, this template highlights your expertise and approach. Perfect for agencies looking to present their services, creative processes, and partnerships. Compatible with PowerPoint, Keynote, and Google Slides, making it easy to impress any audience.


3 slides
Financial Planning and Budget Forecast Presentation
Present your financial goals with clarity using the Financial Planning and Budget Forecast Presentation. This modern, minimalist layout helps you break down percentage allocations, forecast future spending, and visualize budget insights with eye-catching graphics. Perfect for finance teams, startups, and consultants. Fully customizable in PowerPoint, Google Slides, Keynote, and Canva.


2 slides
Elegant Title Slide Design Presentation
Dress your presentation in sophistication with the "Elegant Title Slide," where simplicity meets style. This template elegantly frames your opening remarks in a polished and refined layout, highlighted by a chic, contemporary office backdrop. Perfect for any business aiming to impress, it's fully compatible with PowerPoint, Keynote, and Google Slides. Elevate your presentation game with this seamlessly designed slide.


5 slides
Scrum Workflow Roles & Sprints Presentation
Simplify your agile presentations with this Scrum Workflow Roles & Sprints Template. Designed to visualize sprint cycles, team roles, and process flow, this layout makes Scrum methodology easy to grasp. Ideal for product managers and agile teams. Fully editable in PowerPoint, Keynote, and Google Slides for seamless customization.


5 slides
Health Benefits Infographics
Health Benefits refer to the positive effects that certain practices, behaviors, or conditions have on a person's physical, mental, and emotional well-being. These informative infographic templates are an effective tool to educate and motivate individuals to prioritize their health and make informed lifestyle choices. Its visually appealing design, concise information, and emphasis on positive outcomes will engage and inspire readers to take action towards a healthier and happier life. This template is designed to present key information in an appealing and concise manner, making it suitable for presentations, websites, social media posts, and educational materials.


4 slides
Types of Insurance Policies Comparison Presentation
Highlight key differences between insurance policies using this shield-themed comparison slide. With space for six categories and clear icon-label pairs, it’s perfect for showcasing coverage types or plan tiers. Fully editable in PowerPoint, Keynote, and Google Slides—ideal for agents, brokers, or internal training on policy features.


6 slides
Corporate Sustainability Management Presentation
Step into the future of business with our Corporate Sustainability Management Presentation template. Perfect for strategists seeking to integrate eco-friendly practices, this template facilitates effective communication of sustainability goals and initiatives. It’s a powerful tool for illustrating how environmental strategies can be interwoven with business objectives to foster long-term growth. Tailored for presentations on PowerPoint, Keynote, and Google Slides, it helps leaders inspire action and commitment to sustainability across their organizations.


10 slides
4 Stages of Strategic Execution Process Presentation
Clarify your strategy with the 4 Stages of Strategic Execution Process Presentation. This visually layered circle layout walks your audience through each key stage of execution—ideal for planning, operations, and team alignment. Each step is color-coded and fully editable, ensuring your message stays focused. Compatible with PowerPoint, Keynote, Google Slides, and Canva.


5 slides
Technological Advances in Manufacturing Infographics
Manufacturing refers to the process of converting raw materials or components into finished products on a large scale. These infographic templates provide an overview of how technology has transformed the manufacturing industry. This allows you to showcase the significant advancements and their impact on various aspects of manufacturing processes. This template serves as a valuable resource for professionals, educators, students and anyone interested in understanding the evolving landscape of manufacturing technology. Completely customizable and compatible with Powerpoint, Keynote, and Google Slides.