


Features
- 6 Unique slides
- Fully editable and easy to edit in Microsoft Powerpoint, Keynote and Google Slides
- 16:9 widescreen layout
- Clean and professional designs
- Export to JPG, PDF or send by email


Do you have any questions?
Recommend


4 slides
Economic Trends and Analysis of North America Map Presentation
Present key regional insights with this North America economic analysis map. Compare up to four locations using percentage stats and customizable titles. Ideal for showcasing market trends, financial metrics, or growth data. Fully editable in PowerPoint, Keynote, and Google Slides—perfect for economic forecasts, business reports, or strategy meetings.


8 slides
End of Presentation Thank You Slide
Wrap up your presentation with a bold, memorable finish using a vibrant layout that instantly grabs attention. This slide gives you space to share final notes, highlight next steps, or leave a lasting impression with clean, modern design. Fully editable and compatible with PowerPoint, Keynote, and Google Slides.


4 slides
Top Cryptocurrency Market Trends Presentation
Bring financial insights to life with a modern, data-focused layout designed to showcase the latest movements, growth, and innovations in digital assets. Ideal for analysts and entrepreneurs, it turns trends into clear visuals for any audience. Fully compatible with PowerPoint, Keynote, and Google Slides for easy customization and professional results.


5 slides
Alcohol Effects Infographics
Alcohol can have various effects on the body and mind, depending on the amount consumed, the individual's tolerance, and other factors. These unique vertical Infographics provide information about the physical, psychological, and social effects of alcohol use. They are designed to educate people about the risks of drinking too much and the consequences of alcohol abuse. To help you present your data these include statistics, illustrations, and other visual aids to help your audience understand the impact of alcohol on their health. By providing information about the effects of alcohol, this helps people make informed decisions about alcohol use.


4 slides
Sales Conversion with AIDA Stages Presentation
This modern presentation breaks down the AIDA model—Attention, Interest, Desire, and Action—using clean 3D cube visuals. Perfect for sales teams and marketers aiming to explain conversion funnels clearly. Fully customizable in Canva, making it easy to adapt to any brand or campaign strategy. Ideal for pitch decks and workshops.


21 slides
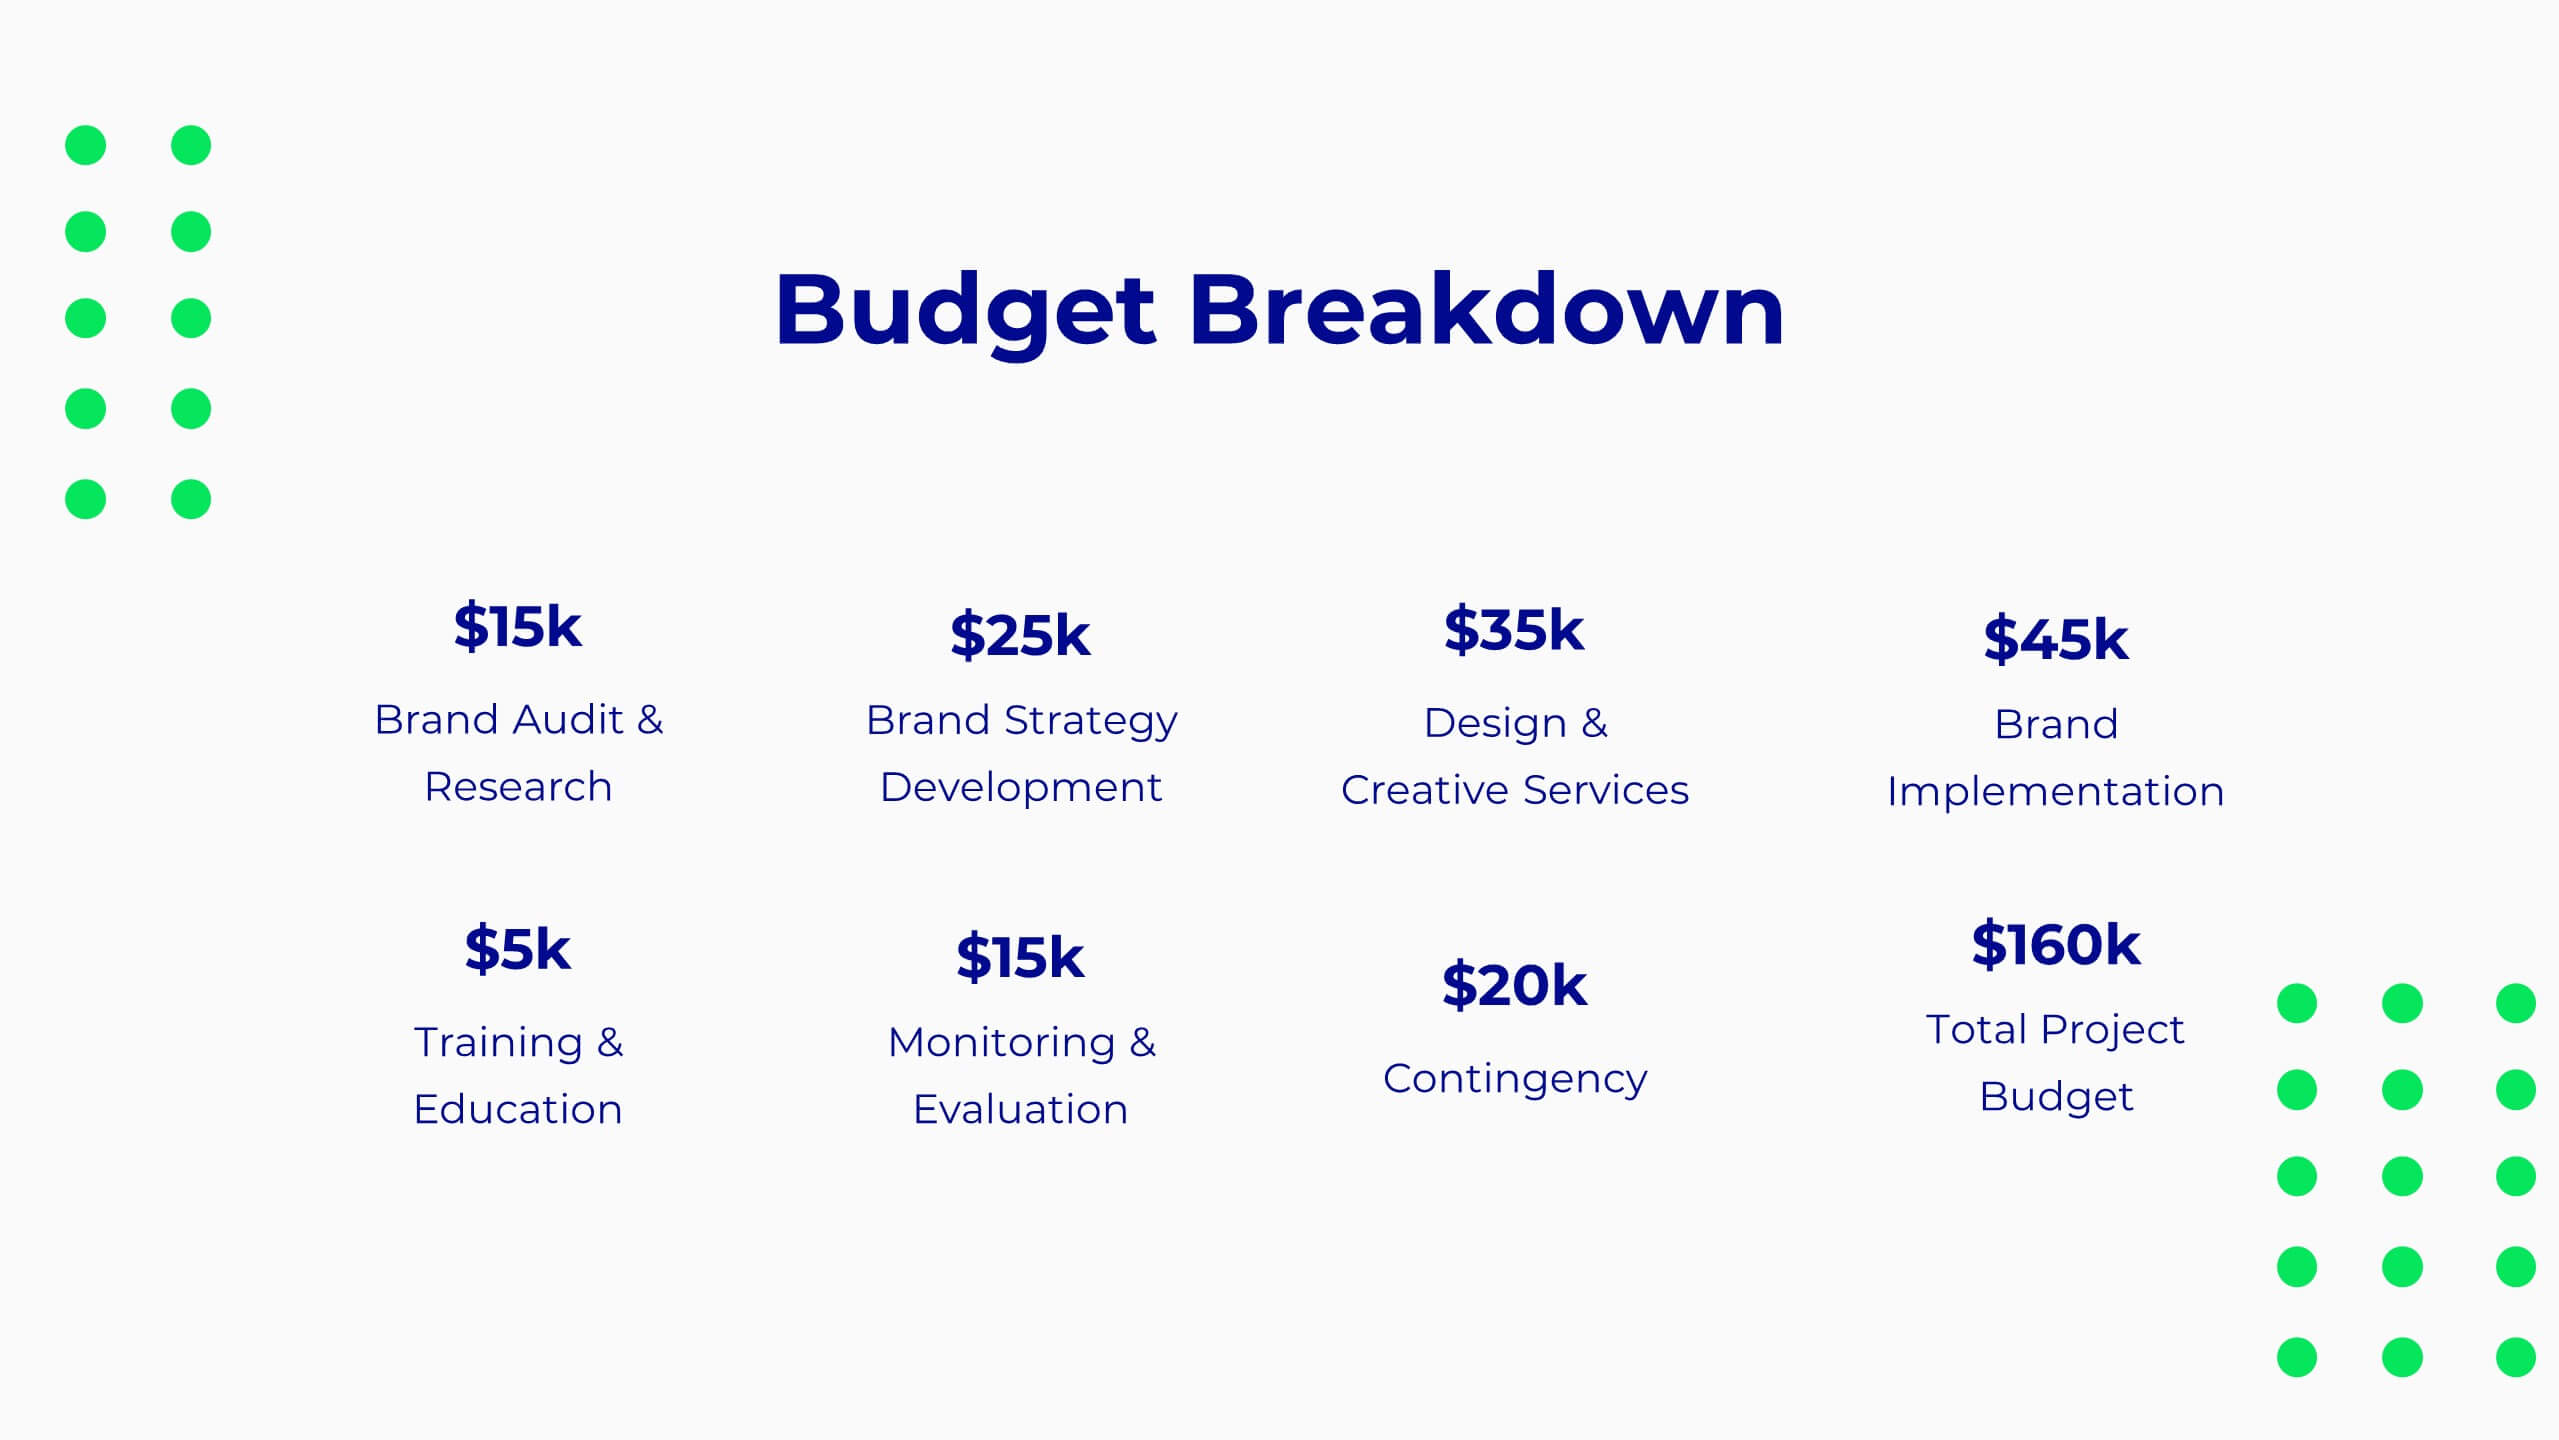
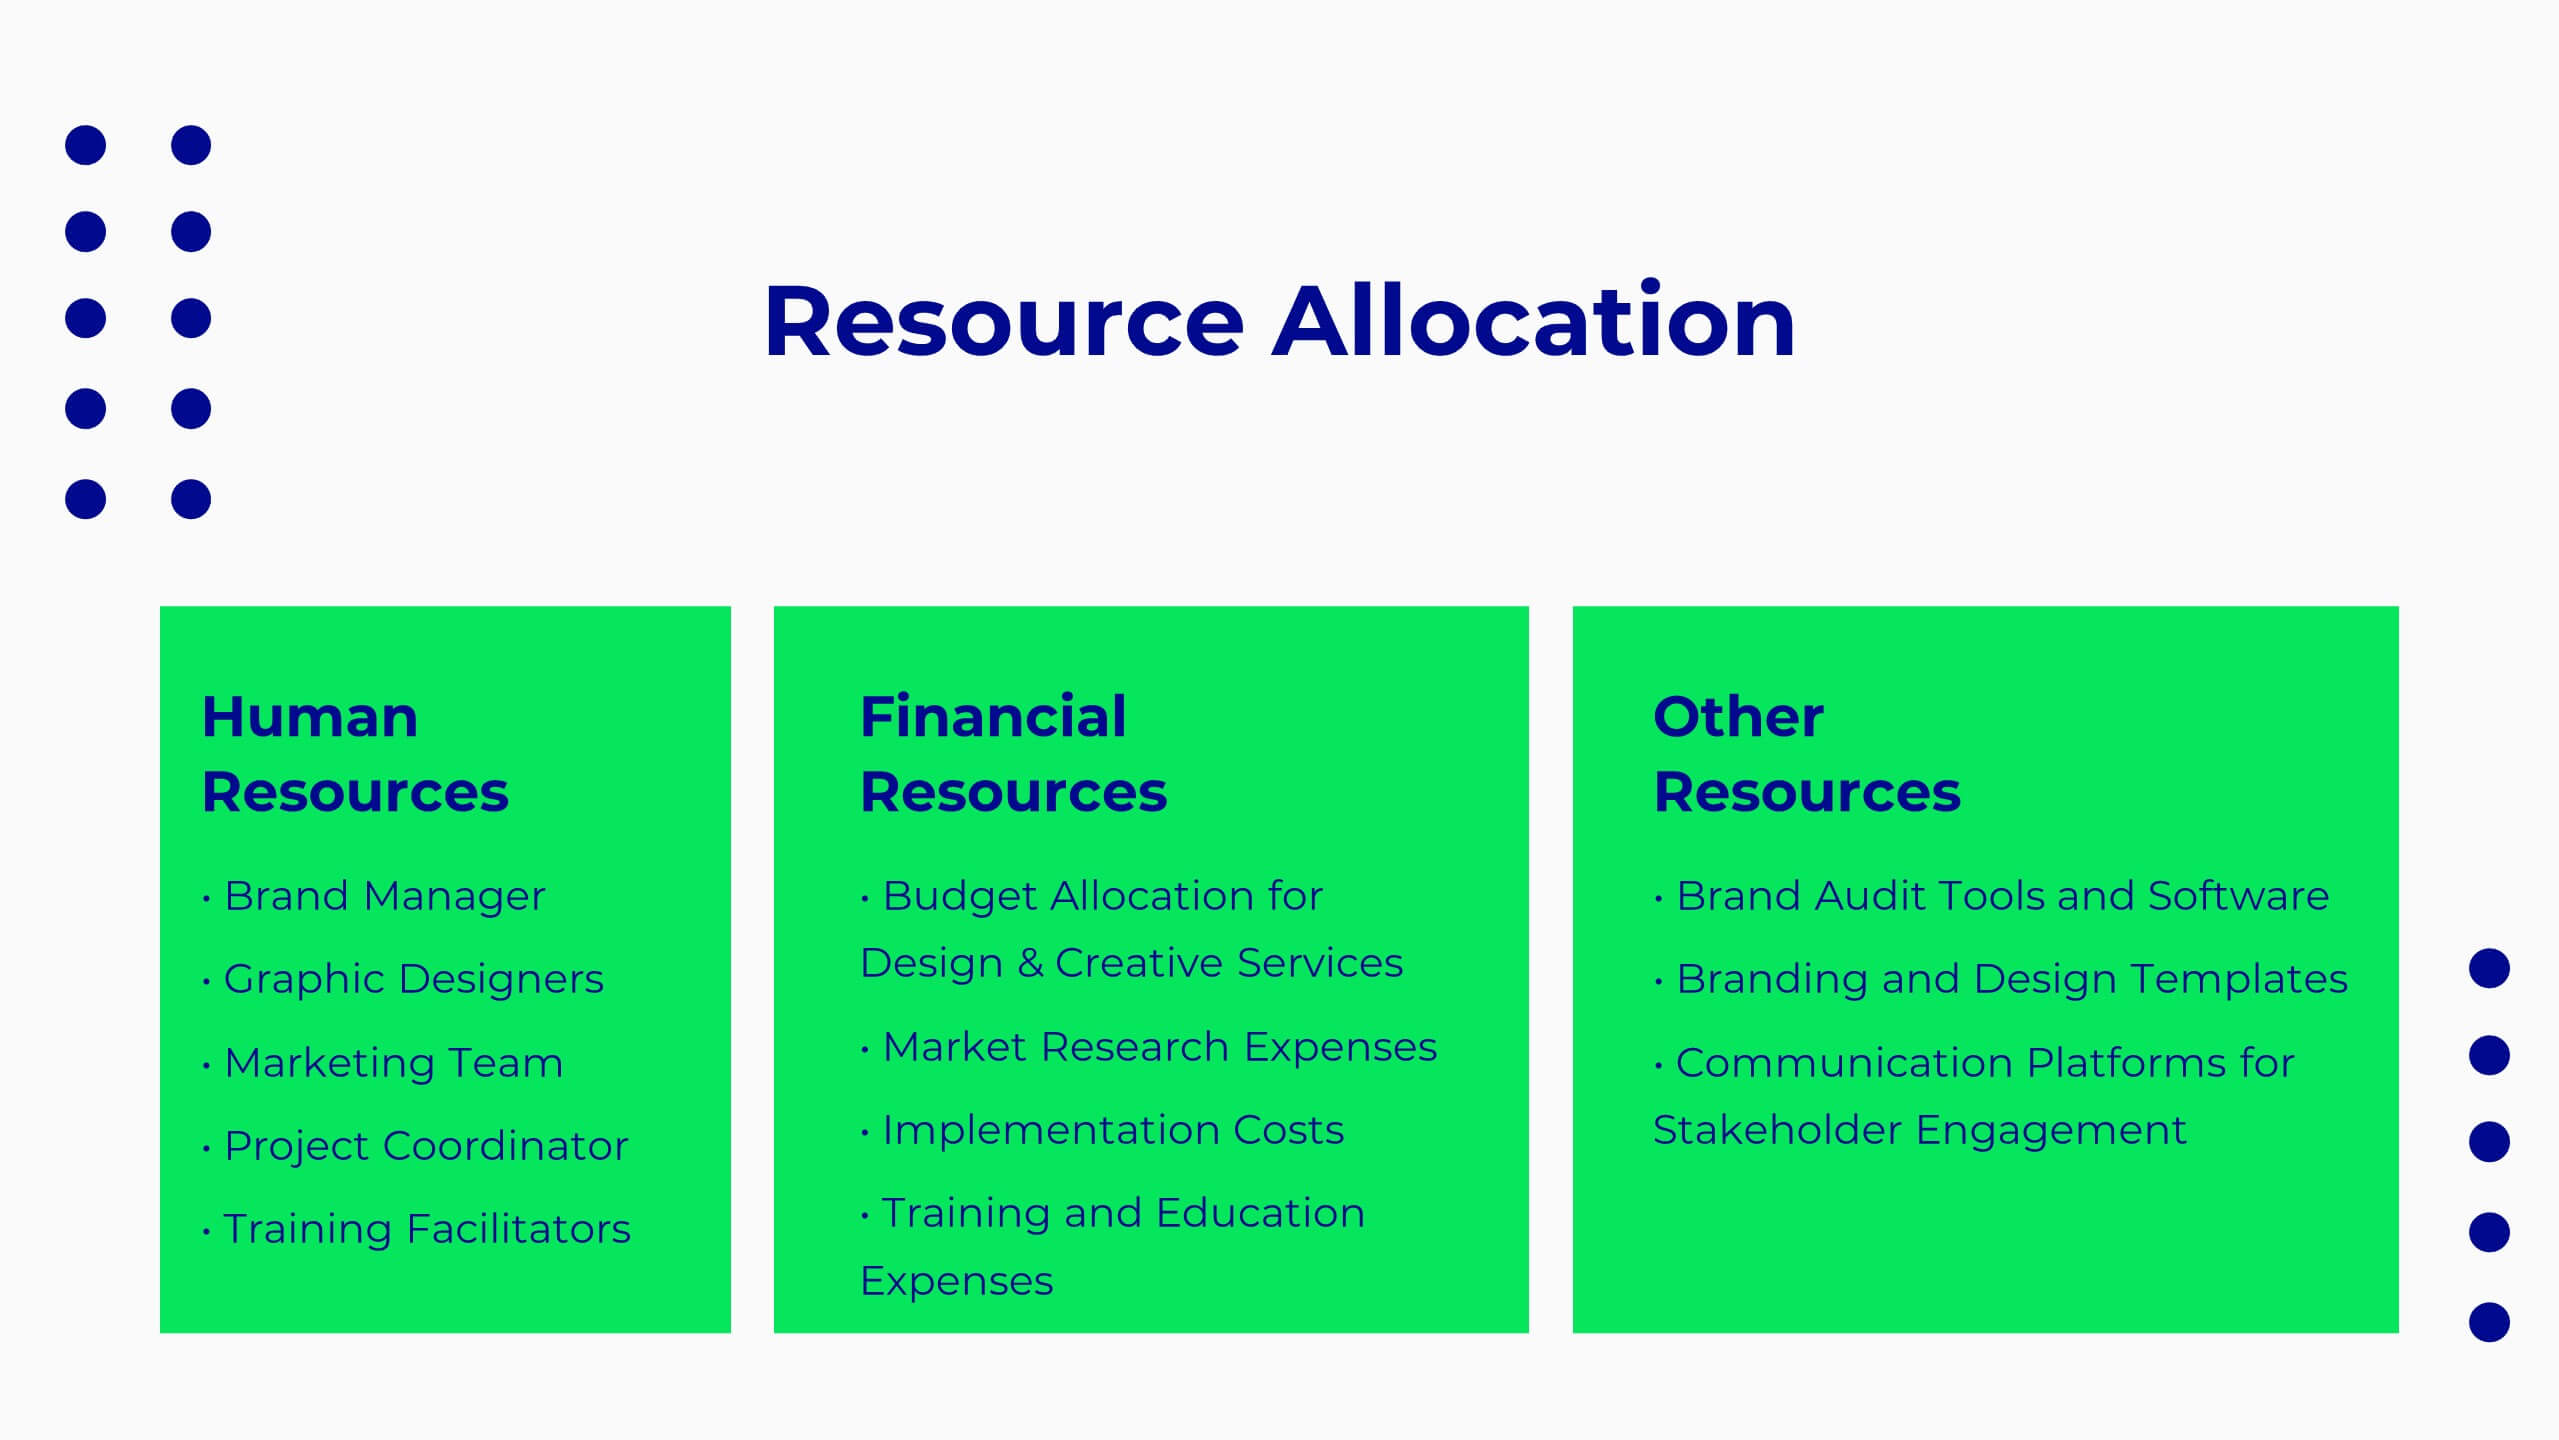
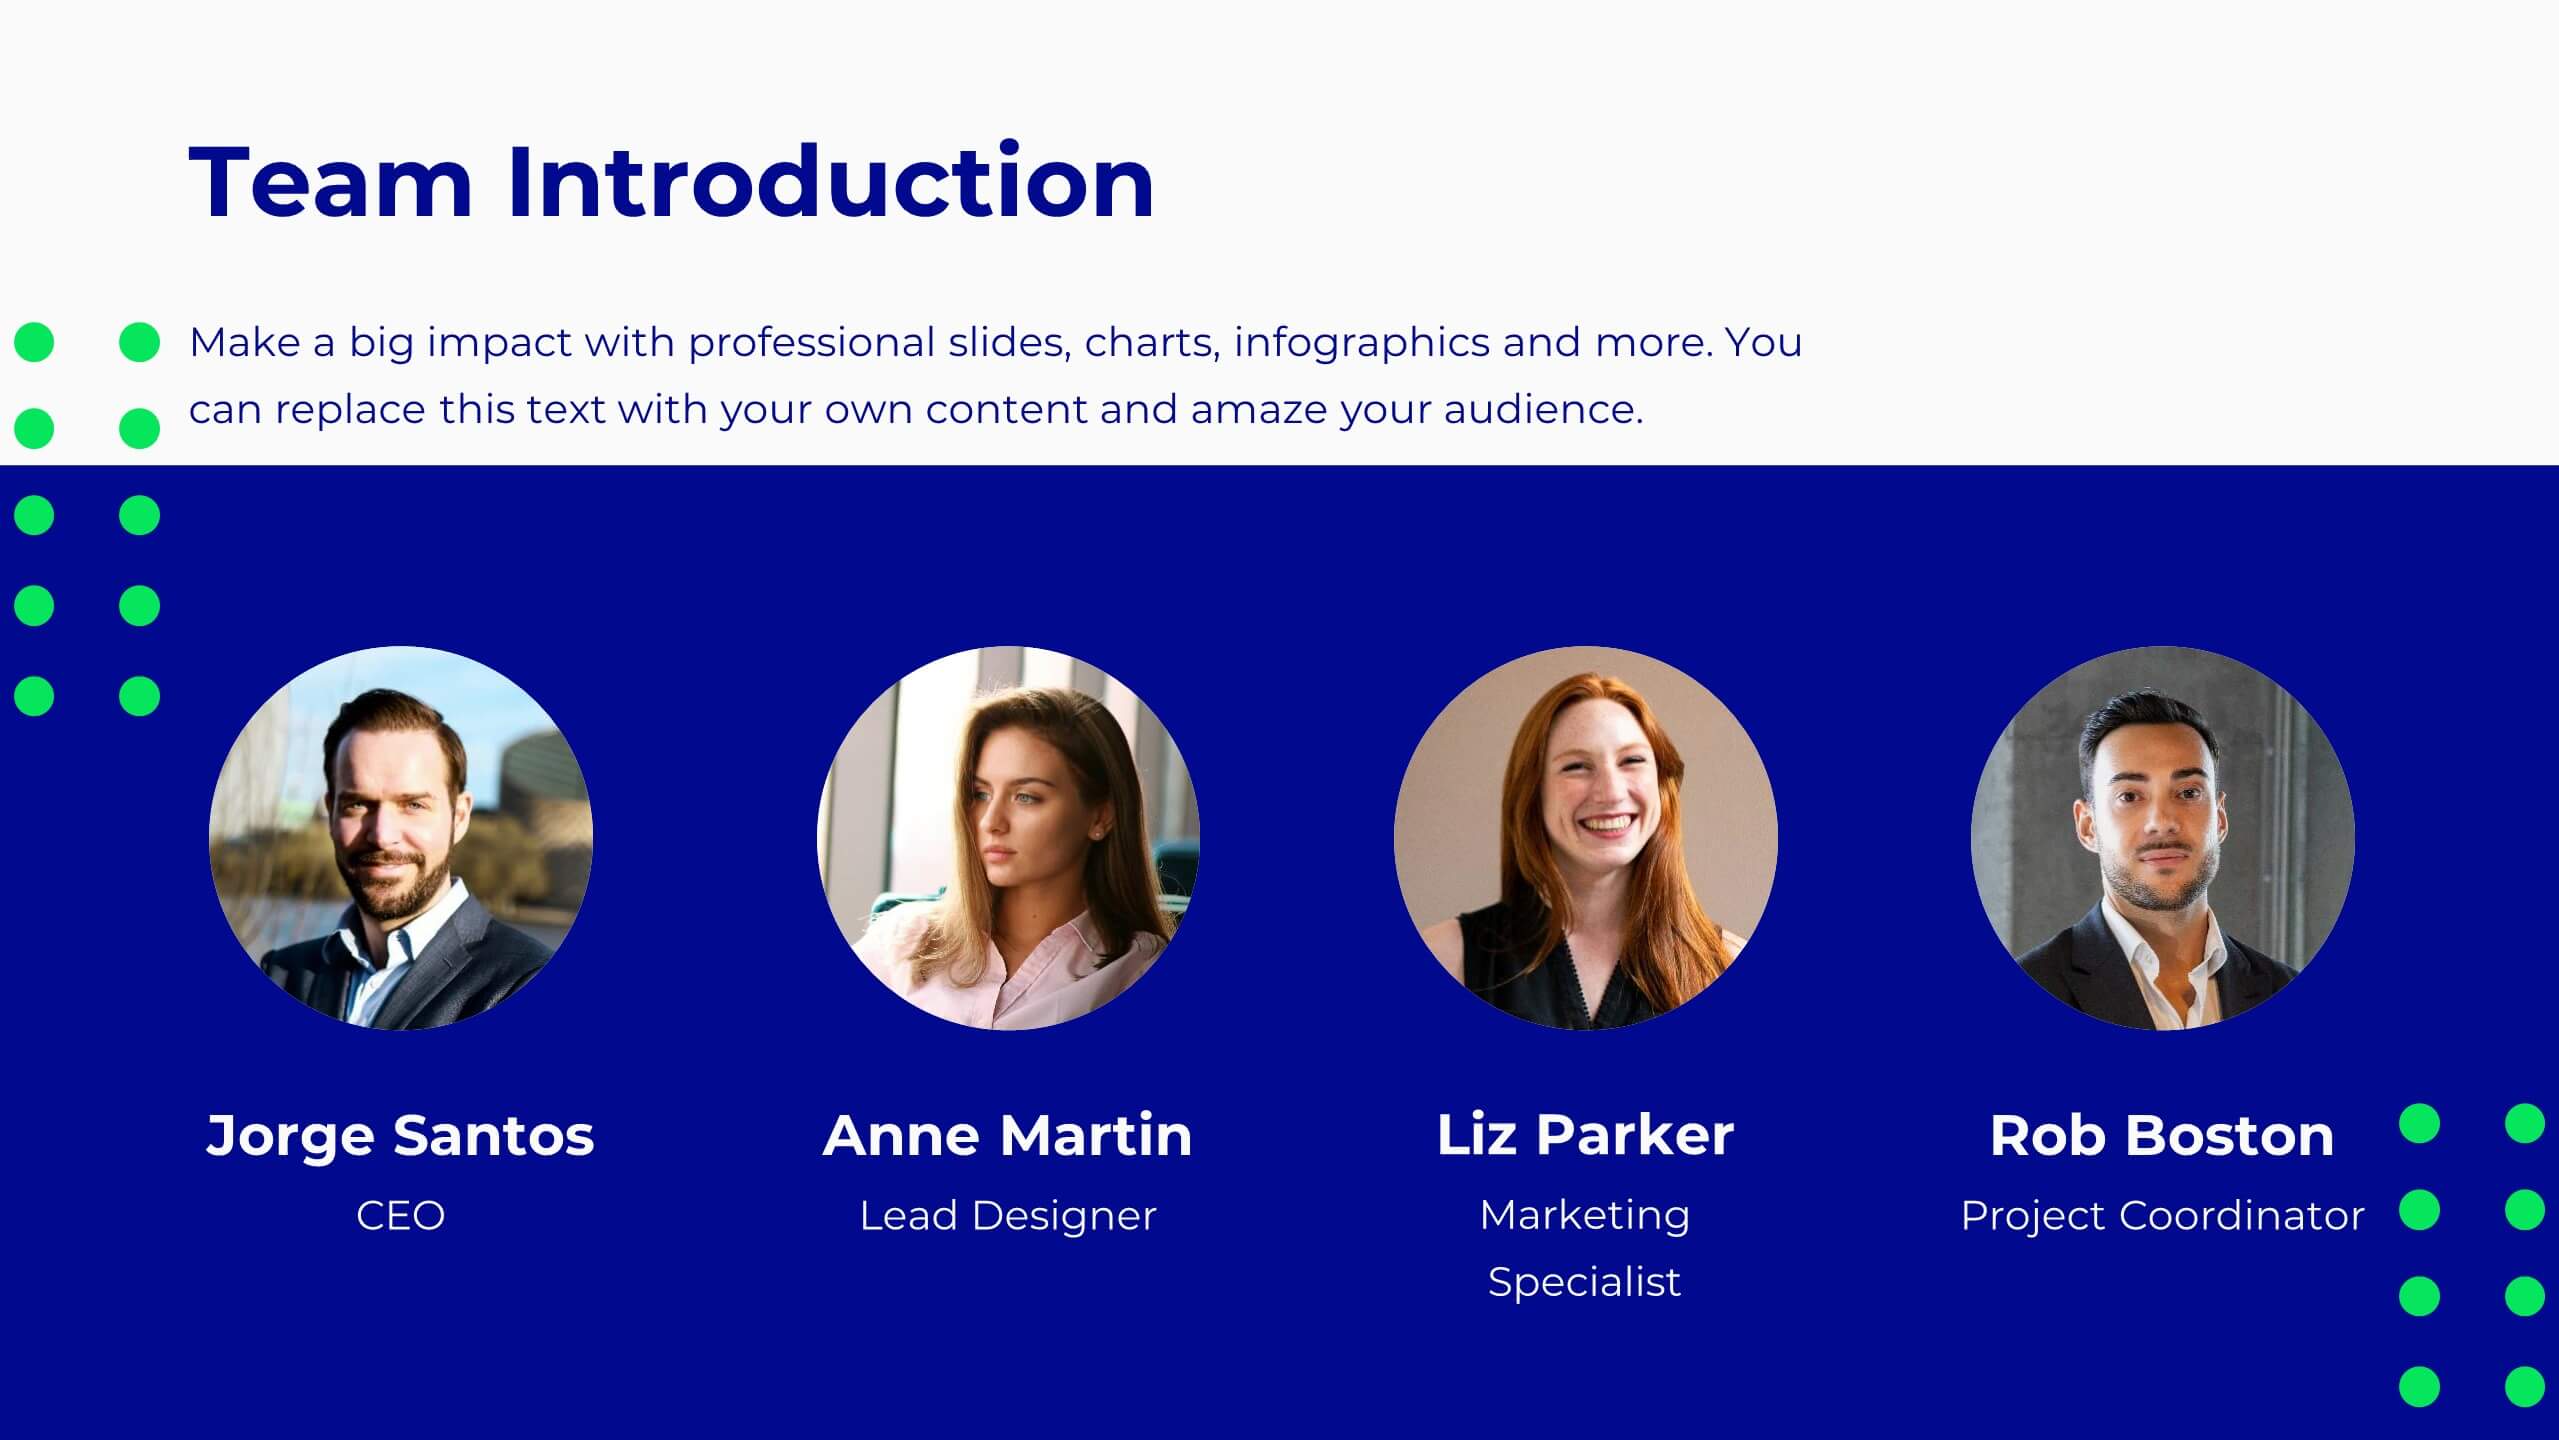
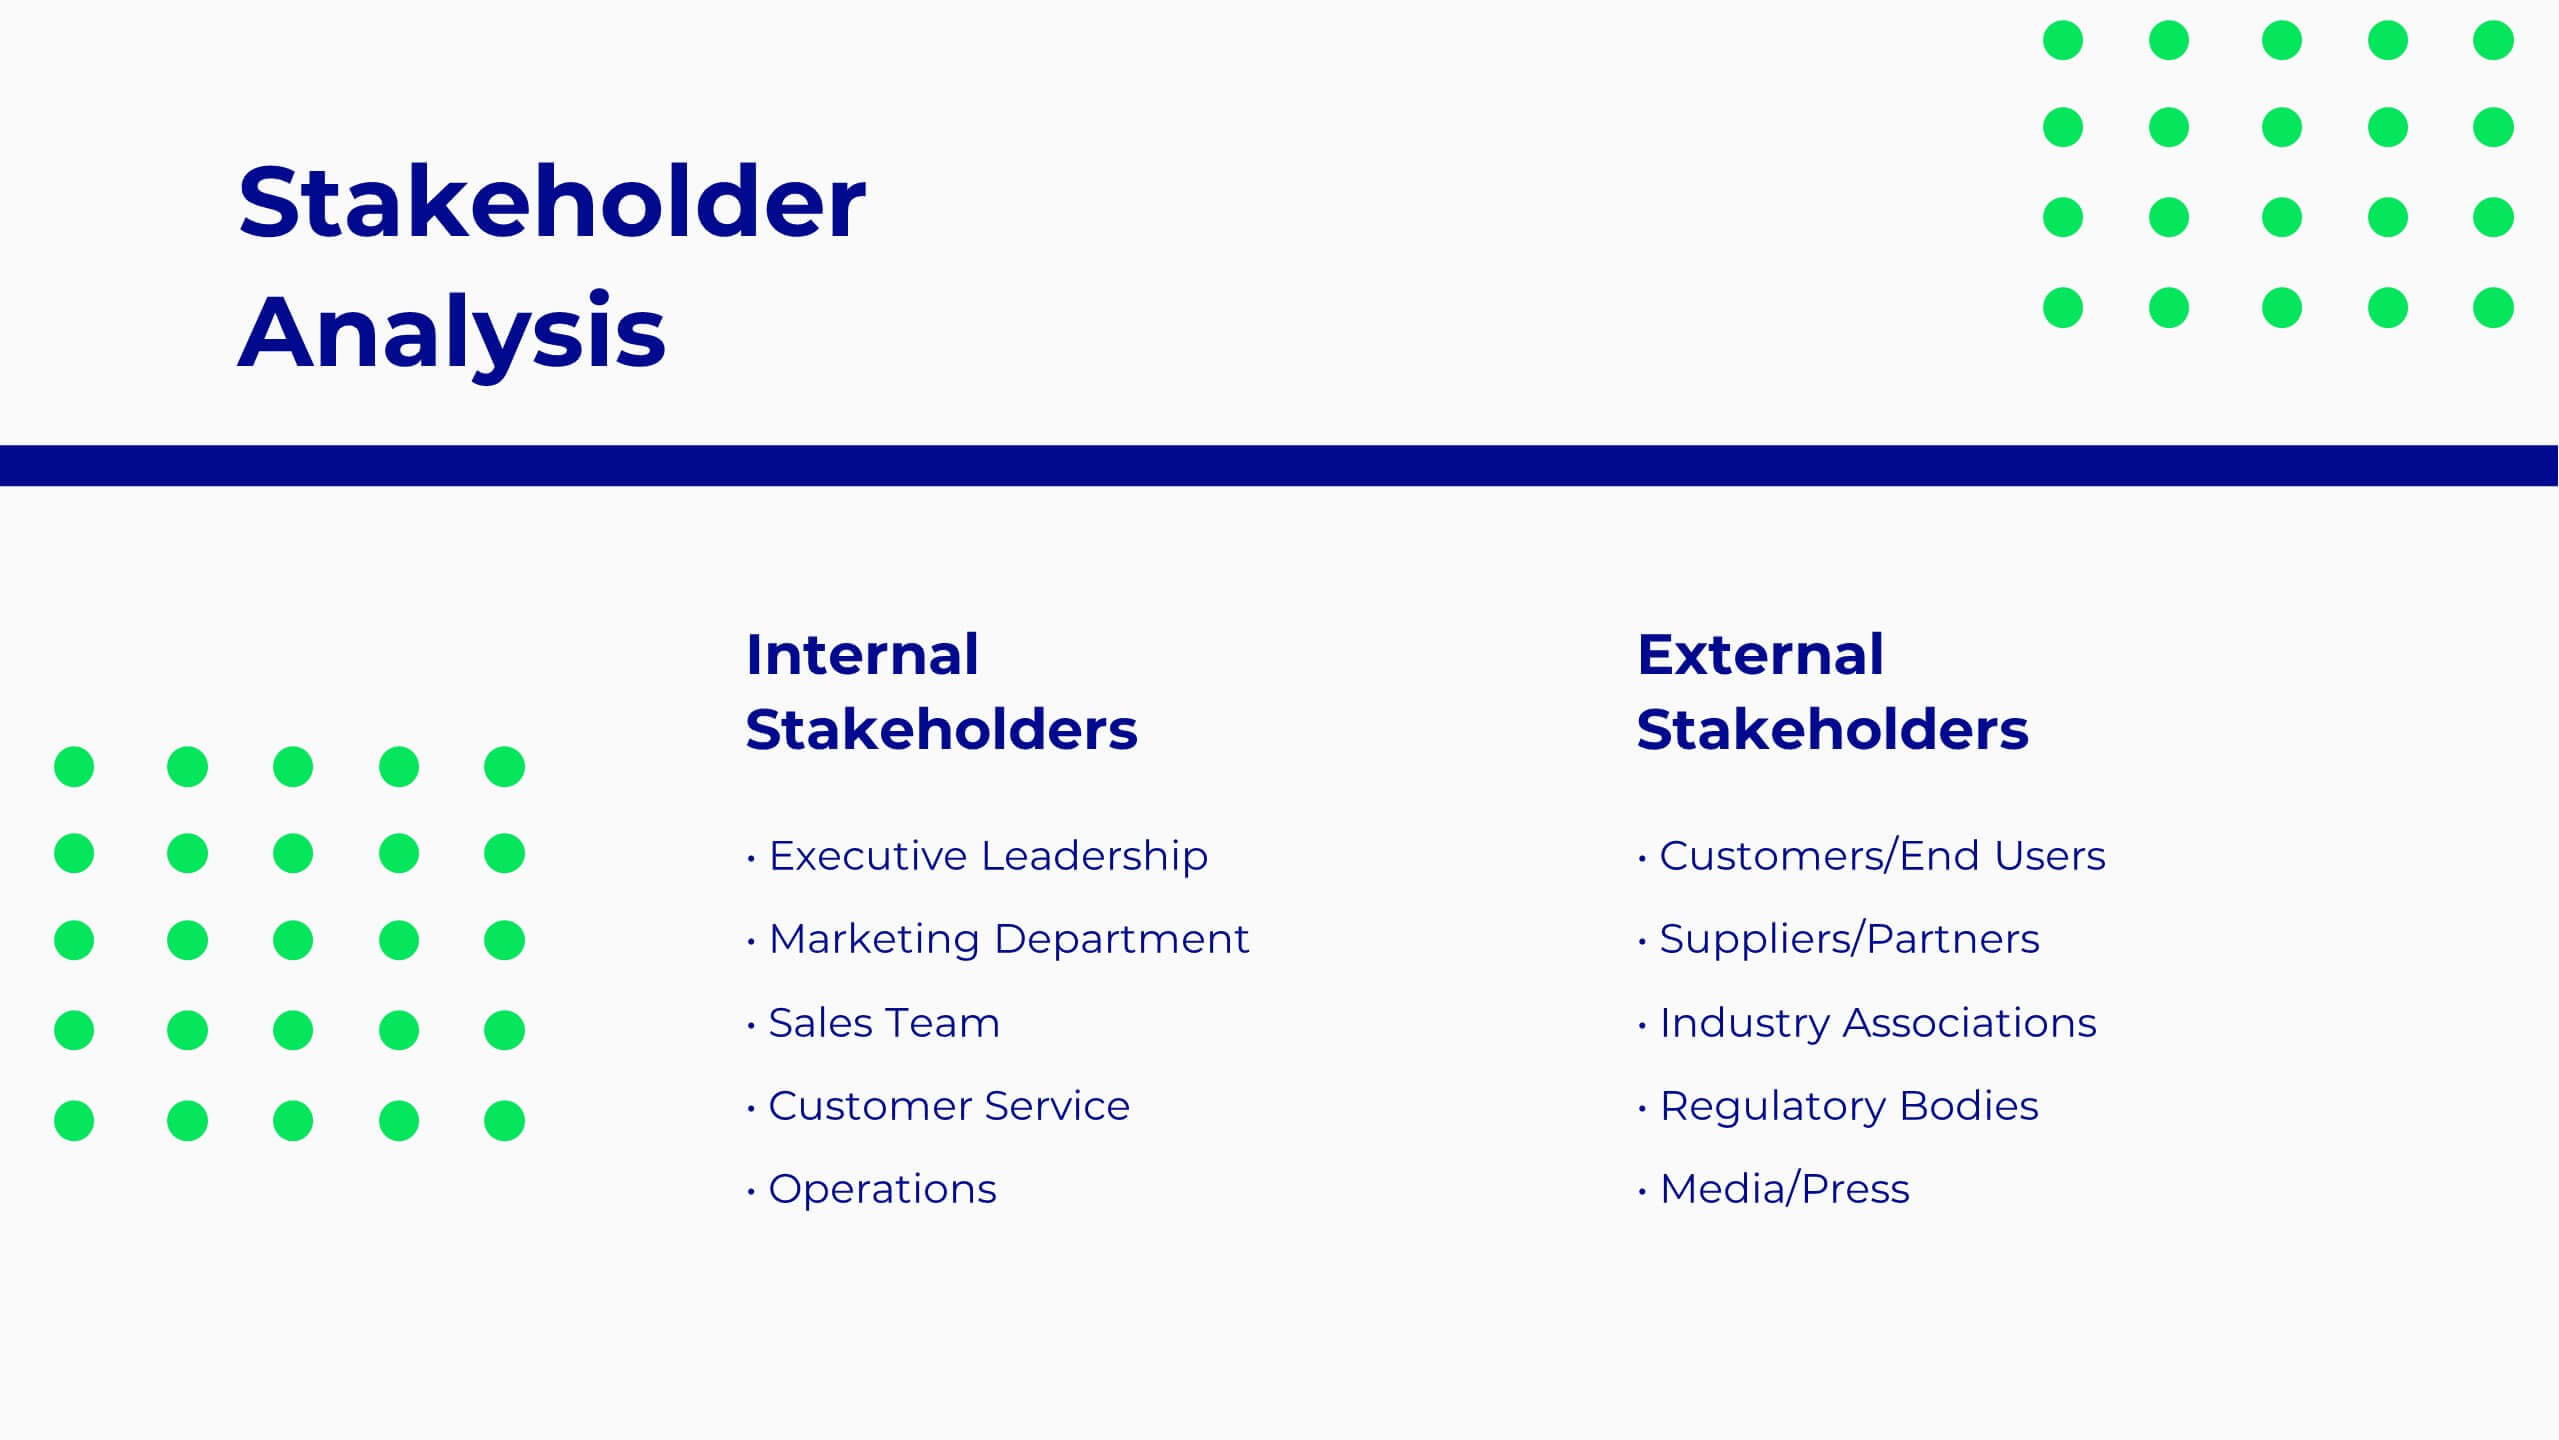
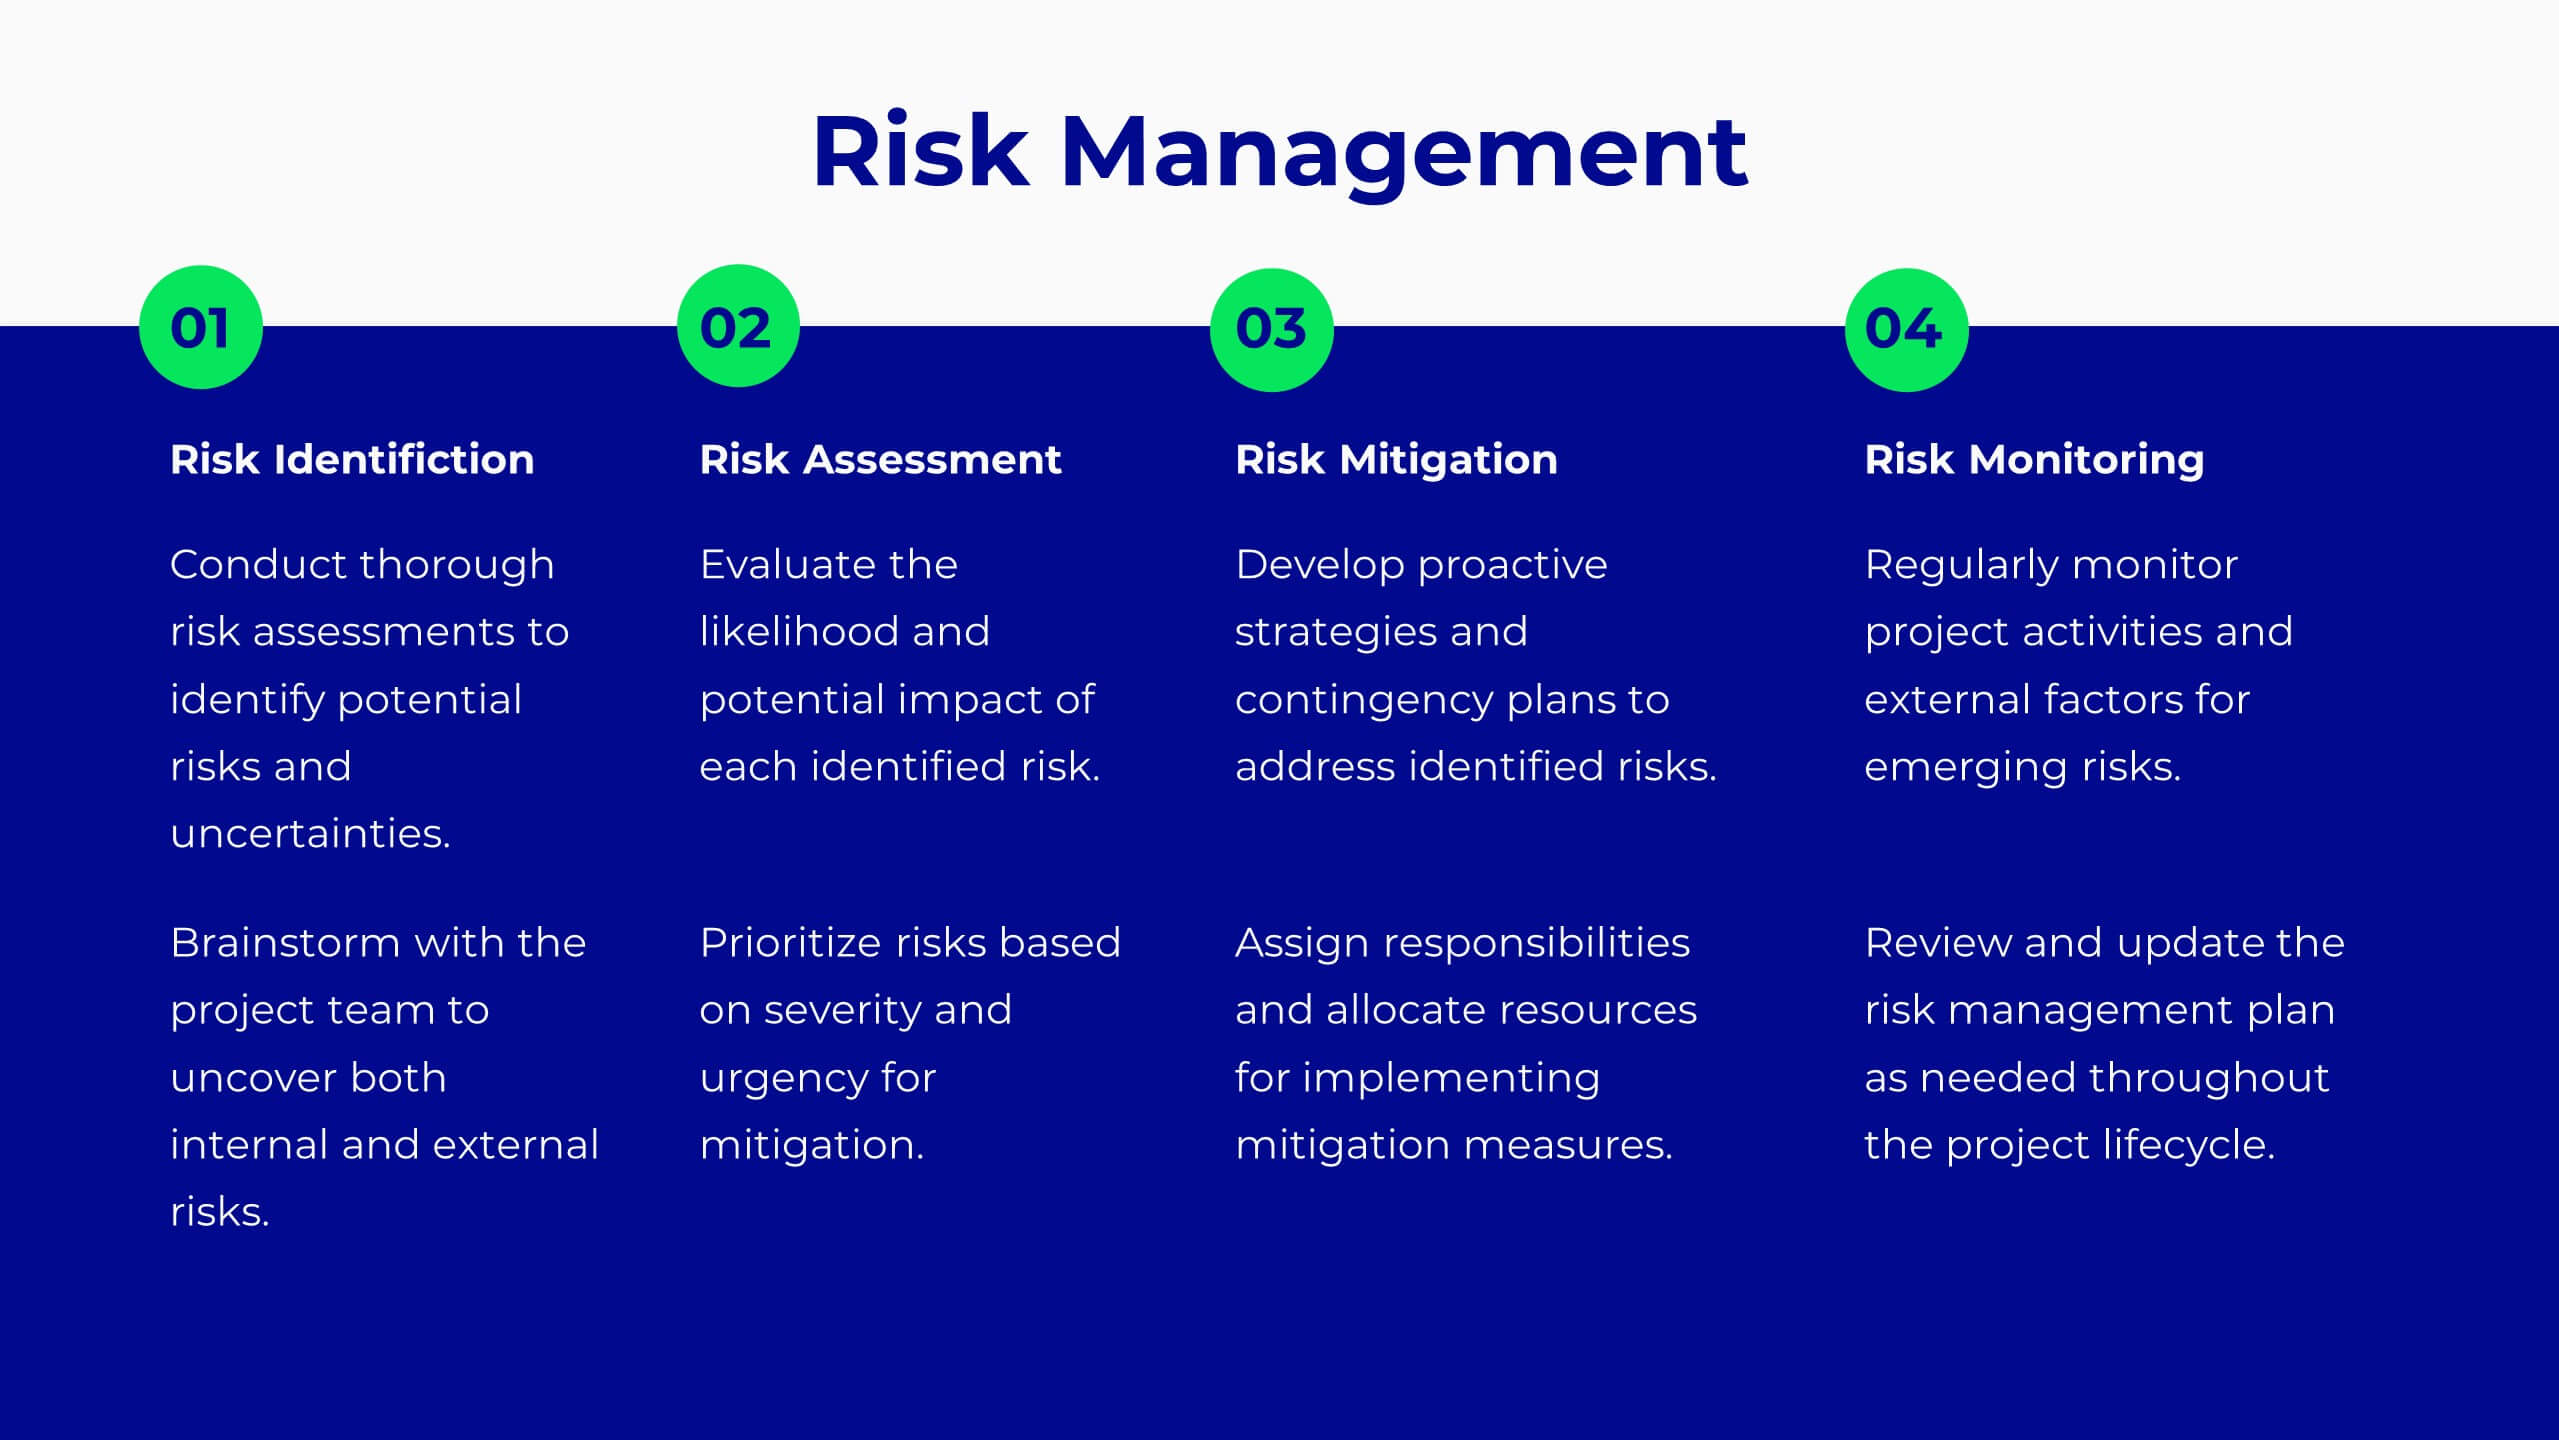
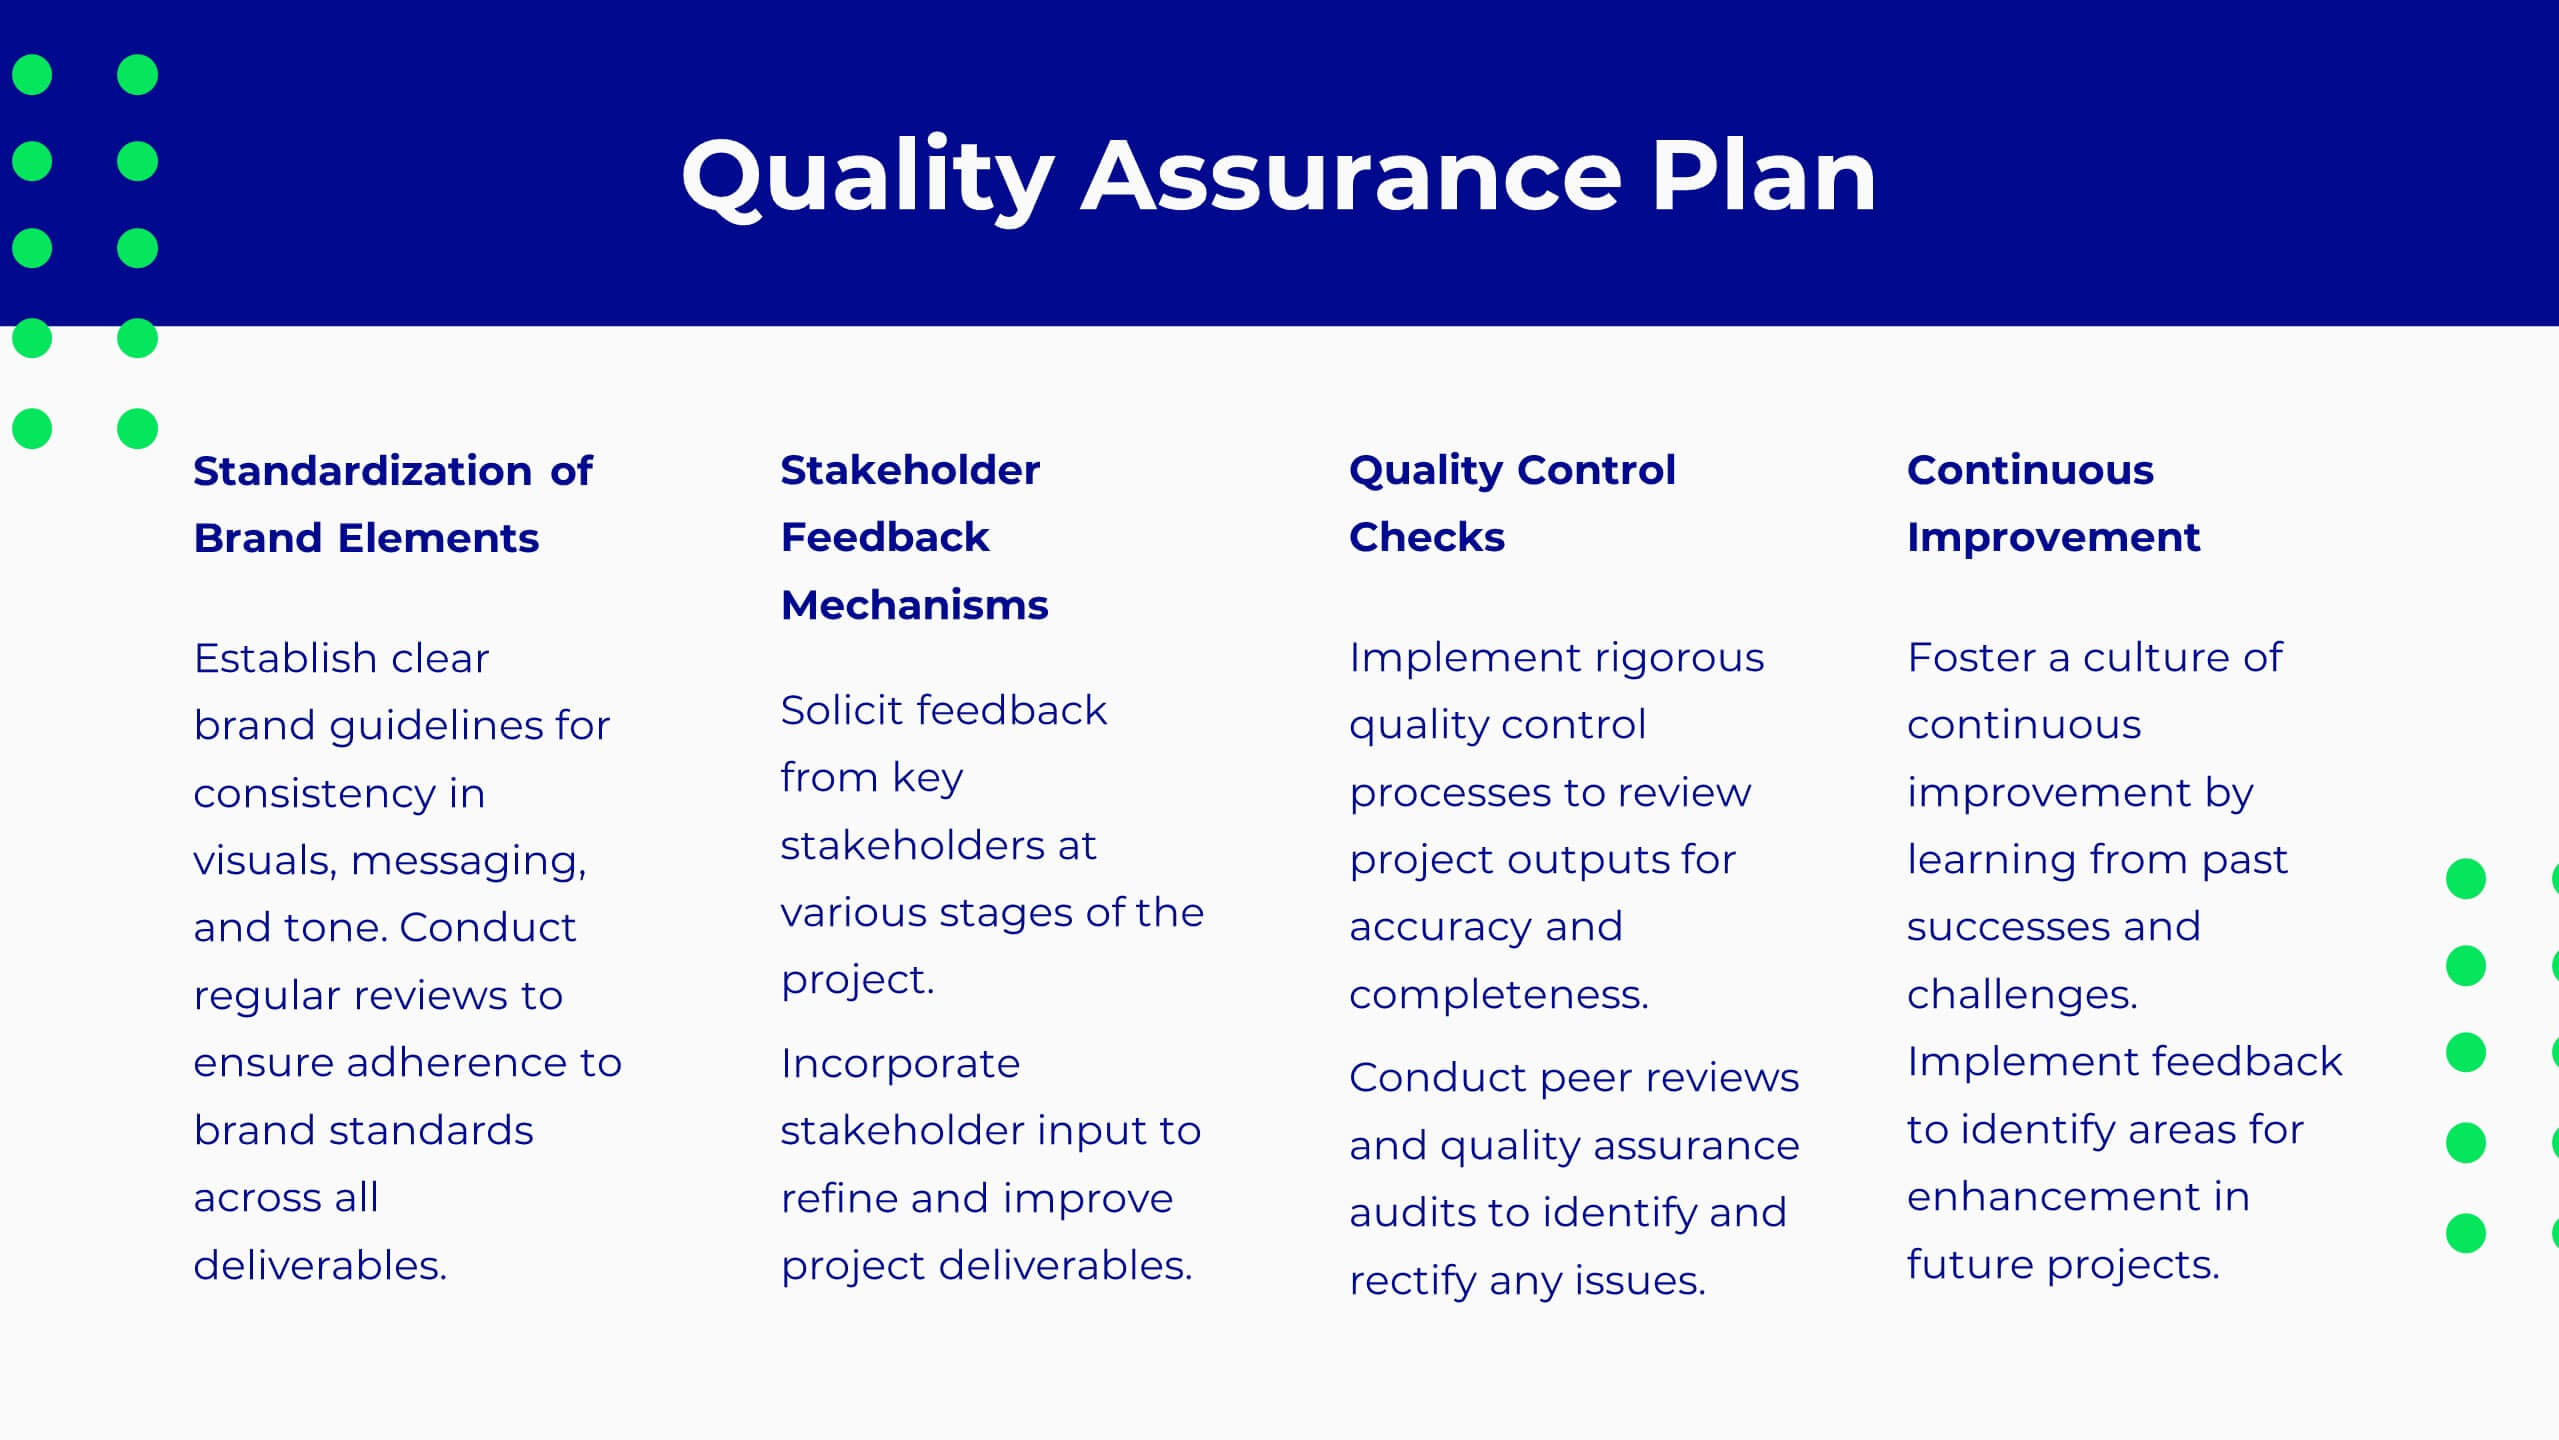
Pulse Project Milestones Report Presentation
Present project milestones effectively with this sleek, professional template. Cover project overview, timeline, and budget. Perfect for defining objectives, scope of work, and resource allocation. Highlight team introductions and stakeholder analysis. Ensure quality with risk management and assurance plans. Compatible with PowerPoint, Keynote, and Google Slides. Elevate your presentations today!


6 slides
Team Leadership and Management
Foster stronger collaboration with this team-focused circular diagram. Designed to showcase six key areas of team leadership, this template is perfect for outlining communication, goal-setting, delegation, performance, feedback, and development strategies. Ideal for managers, trainers, and HR professionals. Fully customizable in PowerPoint, Keynote, and Google Slides.


6 slides
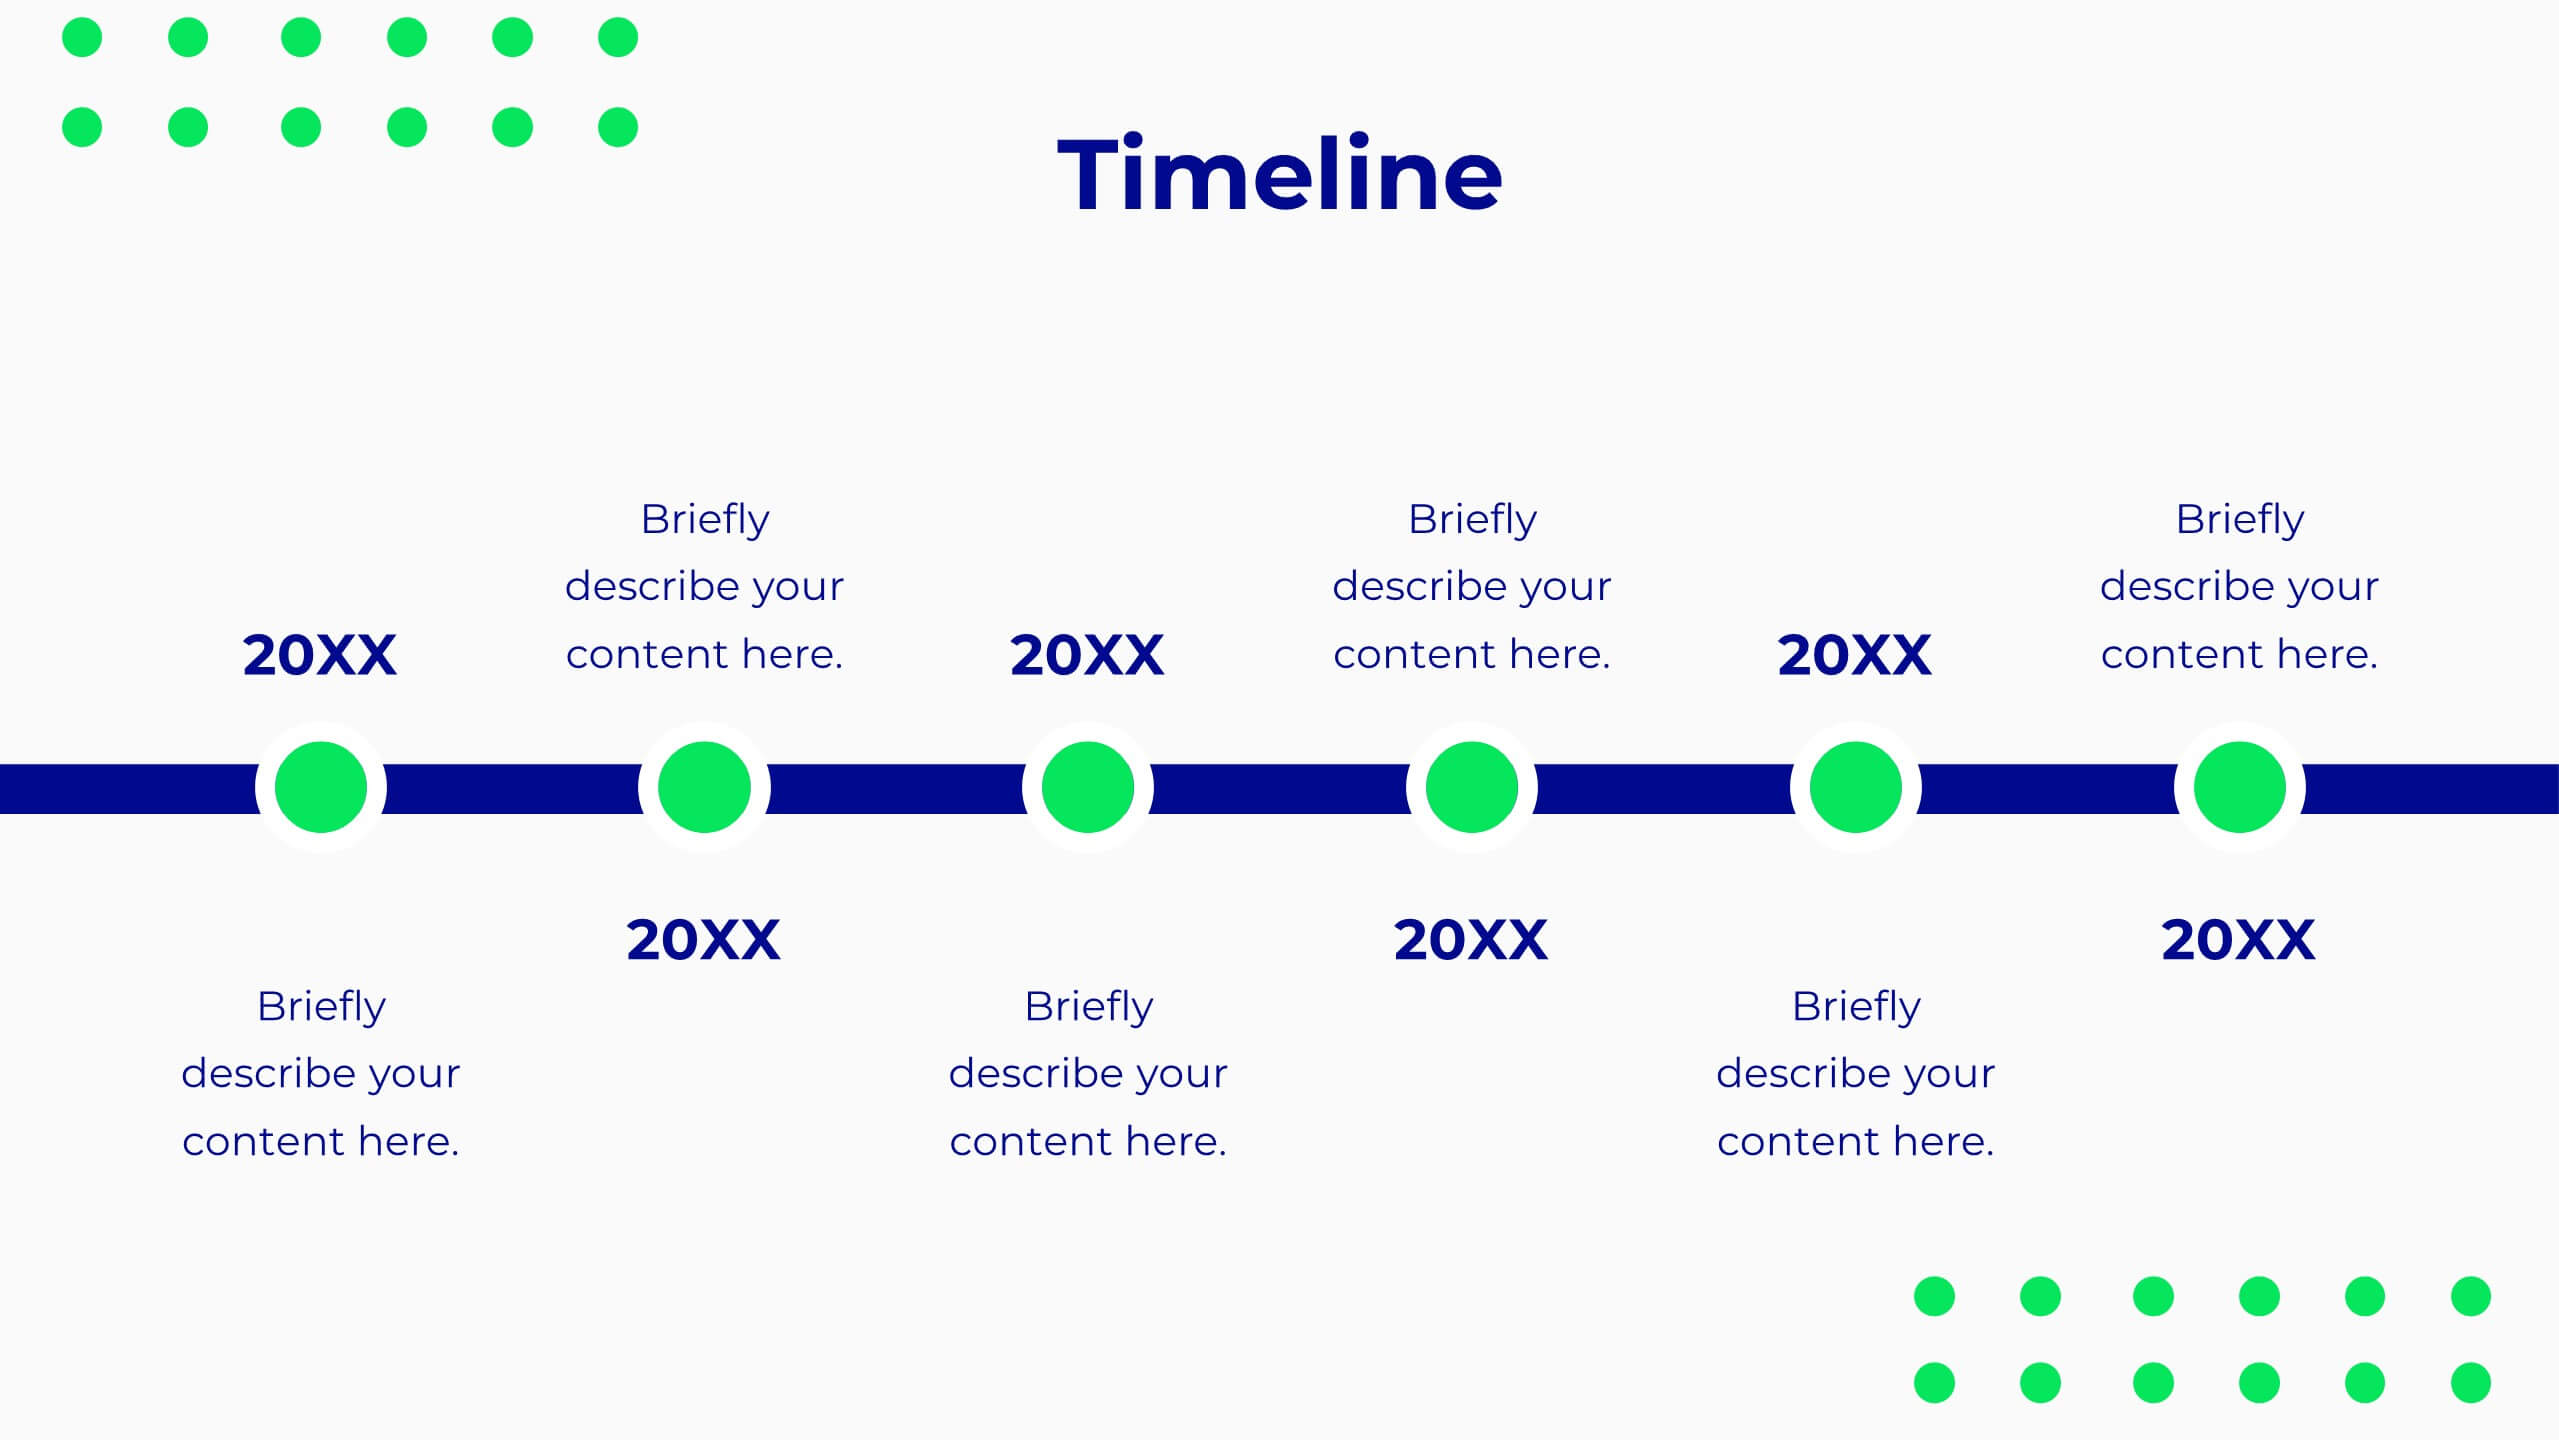
Company Heritage and Legacy Timeline Presentation
Chronicle your business milestones with this modern timeline presentation. Featuring a horizontal layout with photo placeholders and color-coded markers, this design helps visually map your company’s history. Perfect for brand storytelling, anniversaries, or executive reports. Fully customizable in PowerPoint, Keynote, and Google Slides for seamless editing and branding.


5 slides
Workout Importance Infographics
Energize your audience with our dynamic workout importance infographics template. Bathed in the motivating shades of cream, blue, and orange, this collection is a powerhouse of fitness inspiration, perfect for personal trainers, fitness bloggers, health educators, and gym establishments. Compatible with Powerpoint, Keynote, and Google Slides. Its creative, fitness-oriented design showcases compelling graphics, icons, and image placeholders that vividly illustrate exercise routines, health stats, and motivational quotes. It's not just an infographic; it's your ally in promoting a healthy lifestyle, emphasizing the transformative power of physical activity.


6 slides
External Business Factors PESTEL Model Presentation
Present your strategic analysis with clarity using this External Business Factors PESTEL Model Presentation. Designed to break down Political, Economic, Social, Technological, Environmental, and Legal influences, this layout helps convey complex macro-environmental insights in a simple, color-coded visual format. Ideal for consultants, business analysts, and corporate strategists. Fully editable in PowerPoint, Keynote, and Google Slides.


4 slides
To-Do Lists and Task Management Presentation
Stay organized and boost productivity with the To-Do Lists and Task Management Presentation. This sleek layout features vertical note-style columns that are perfect for displaying tasks, priorities, or checklists in a structured format. Ideal for project timelines, personal goals, or team deliverables. Each list area includes customizable titles, checkmarks, and space for key points. Fully editable in PowerPoint, Keynote, and Google Slides—perfect for visual task tracking across presentations.


7 slides
Job Objective Infographic Presentation
A Job Objective is an introduction that summarizes an individual's career goals and objectives. This Template is designed to create a visual experience with a focus of solving your objectives, showcasing your expertise and individuality. Use this infographic to help you visually communicate your knowledge and skills with a powerful presentation. Highlight your experience, skills and key achievements. You can edit the graphics, photos, data and text in this template so that it fits your needs perfectly. All you have to do is just download this template in PowerPoint, Keynote, or Google Slides.


7 slides
Agile Circle Methodology Infographic Presentation
Agile Methodology is a flexible and adaptive approach to project management that values customer satisfaction, teamwork, and continuous improvement. Our Agile Methodology template is perfect for academic or work presentation projects. This template is super easy to use and works with Powerpoint, Keynote, and Google Slides. It has a minimal design with, bright colors that will keep your audience engaged. With this template, you can learn all about Agile Methodology in a way that is visually appealing. Use this template to see how you and your team work more efficiently and effectively.


4 slides
Products Comparison Table Presentation
Make your decision-making story instantly clear with a bold visual that balances options in a clean, modern way. This presentation helps you compare features, weigh benefits, and highlight key differences using simple graphics and intuitive labeling. Fully compatible with PowerPoint, Keynote, and Google Slides.


10 slides
Project Responsibility Chart Presentation
Streamline your project management with our Project Responsibility Chart template. Designed to clarify roles and tasks across your team, this color-coded chart ensures transparency and efficiency. Ideal for project leads to assign duties clearly and effectively. The template supports PowerPoint, Keynote, and Google Slides, making it versatile for any team environment.


5 slides
Technology Comparison Infographics
When comparing technologies, it's important to consider various factors that can impact their performance, usability, and suitability for specific purposes. These vertical infographics can be used in various contexts, including product evaluations, technology assessments, investment decisions, and educational presentations. It helps simplify complex information and facilitates the understanding of technology options, enabling individuals and organizations to make well-informed choices that align with their goals and requirements. Compatible with Powerpoint, Keynote, and Google Slides.


6 slides
Big Data Analytics Presentation
The "Big Data Analytics Presentation" template is expertly designed to visualize global data analytics strategies across different regions. The map highlights key areas in distinct colors, drawing attention to where data initiatives are being implemented or where significant market trends are observed. Each region on the map corresponds to specific titles that can be customized to represent various analytical focuses such as market penetration, user demographics, or revenue growth. Accompanying the map are percentage circles that quantify planning, execution, and success rates, making this template invaluable for analysts, data scientists, and corporate strategists who need to present complex data in an easily digestible format. This visual tool is perfect for enhancing presentations, strategic meetings, and reports with a clear, concise, and visually engaging representation of data-driven insights.