


Features
- 10 Unique Slides
- Fully editable and easy to edit in Microsoft Powerpoint, Keynote and Google Slides
- 16:9 widescreen layout
- Clean and professional designs
- Export to JPG, PDF or send by email


Do you have any questions?
Recommend


5 slides
Big Data Analytics Slide Presentation
Bring your insights to life with a clean, modern slide that transforms complex information into a simple visual journey. This layout helps you explain key data points, trends, and analytical steps with clarity and ease, making your message instantly understandable. Compatible with PowerPoint, Keynote, and Google Slides.


10 slides
Project Launch in 4 Structured Phases Presentation
Present your roadmap with clarity using this four-phase launch diagram. Designed for planning, strategy, or product rollout presentations, each step is illustrated in a 3D layered format with editable text sections. Fully customizable in PowerPoint, Keynote, and Google Slides—ideal for project managers and teams outlining sequential development or launches.


7 slides
Master Six Sigma Infographic Presentation
Six Sigma is a methodology used by organizations to improve their business processes and eliminate defects. Use this template to explore the key concepts of Six Sigma and how it can be applied in different industries. This templates include helpful illustrations, charts and tips which allow you to present information in a clear and concise way that makes it easy for your audience to understand and take notes. This template has been made using modern fonts, appealing color combinations and simple layouts. The clean and simple design is compatible with Powerpoint, Keynote and Google Slides.


4 slides
Team and Department Setup Structure Presentation
Organize your team with clarity using the Team and Department Setup Structure Presentation. This template is perfect for showcasing internal team hierarchies, departmental layouts, or functional groupings in a clean and professional layout. Each slide is fully customizable, allowing you to edit icons, titles, and structure to suit your organization. Compatible with Canva, PowerPoint, Keynote, and Google Slides.


5 slides
Risk Mitigation Strategies
Visualize your risk response plan with this layered diagram that highlights five strategic levels of mitigation. Each tier features bold directional arrows guiding the viewer from risk source to solution, perfect for decision-makers, auditors, or risk managers. Fully editable and easy to adapt to any industry. Compatible with PowerPoint, Keynote, and Google Slides.


6 slides
Executive Summary Marketing Infographic
An executive summary is a concise overview of a longer document, report, or proposal, designed to provide readers with a quick understanding of the main points and key takeaways. This infographic template provides a concise and visually appealing overview of a marketing plan, campaign, or strategy. This condenses key information into a format that is easy to understand and presents the most important highlights for decision-makers. This template is a valuable tool to quickly convey the main points and benefits of a document, allowing readers to make informed decisions about whether to delve deeper into the details.


7 slides
Company Profile Infographic
This collection of company profile templates is designed to meet the diverse needs of various businesses, providing an efficient and polished method for presenting a company's identity, accomplishments, and offerings. Each template is meticulously crafted to cater to different professional contexts, making them suitable for annual reports, investment summaries, or internal briefings. Structured for clarity, these templates enable businesses to effectively communicate essential details such as company history, objectives, and the breadth of services or products offered. They are also equipped to showcase crucial statistics like employee numbers, significant achievements, and organizational hierarchy, enhancing the overall presentation. The design blends modern aesthetics with functionality, incorporating a professional color palette and clean layout that holds viewer interest and enhances readability. Customization is straightforward, allowing for easy adjustments in colors, fonts, and design elements to align with specific brand identities. Ideal for corporations looking to convey their market stance and engage potential clients, investors, or prospective employees, these templates serve as a vital tool in creating impactful and informative company profiles.


7 slides
RACI Matrix Process Infographic Presentation
A RACI matrix is a project management tool that is used to clarify and define roles and responsibilities for project tasks and deliverables. Use this template to help you quickly create RACI charts for your next project. Made up of strategic box with shapes, colors, numeric value and text boxes that can be edited easily. This Template is a multipurpose slide as it can be used to present data visually, build a discussion on the topic and influence your audience to take action. Save time and energy with this infographic template, compatible with Powerpoint, Keynote and Google Slides.


5 slides
RACI Role Assignment Matrix Overview Presentation
Clarify team responsibilities with the RACI Role Assignment Matrix Overview Presentation. This professional template helps define who is Responsible, Accountable, Consulted, and Informed across key project tasks. Perfect for streamlining communication, reducing overlap, and improving accountability. Fully editable in PowerPoint, Canva, and Google Slides.


21 slides
Design Creative Concept Presentation
Enhance your creative presentations with this Creative Concept template. It features slides for objectives, color palettes, typography options, and prototyping steps. Ideal for designers and creative teams, this template supports PowerPoint, Keynote, and Google Slides, facilitating a comprehensive and engaging presentation of creative projects.


6 slides
Domestic Statistics Infographic
Domestic statistics typically refers to numerical data and information related to a specific country's internal affairs, activities, and demographics. This infographics can be an effective way to present important data and trends related to a specific country or region. This template is designed with a balance between design aesthetics and data accuracy. By presenting the information in a visually engaging manner, you can effectively communicate key insights to your target audience. Compatible with Powerpoint, Keynote, and Google Slides. This ensures that your infographic is accessible by providing alternative text for images and using high-contrast colors.


7 slides
Progressive Growth Infographic
The Progressive Growth Infographic visually represents the stages of growth and development in a specific context, such as a business, project, or personal development. It is designed to convey the idea of progression, whether it be in revenue, skills, product development, or any area of improvement over time. This type of infographic is beneficial for illustrating a timeline of success, the step-by-step process of advancing through different stages, or the evolution of a concept from inception to maturity. It can be used in business presentations to investors or team members, educational materials for teaching growth concepts, or marketing materials to show company progress. The creative representation of growth using elements like plants, gears, or charts helps to engage viewers and make the concept of progression more tangible and relatable.


21 slides
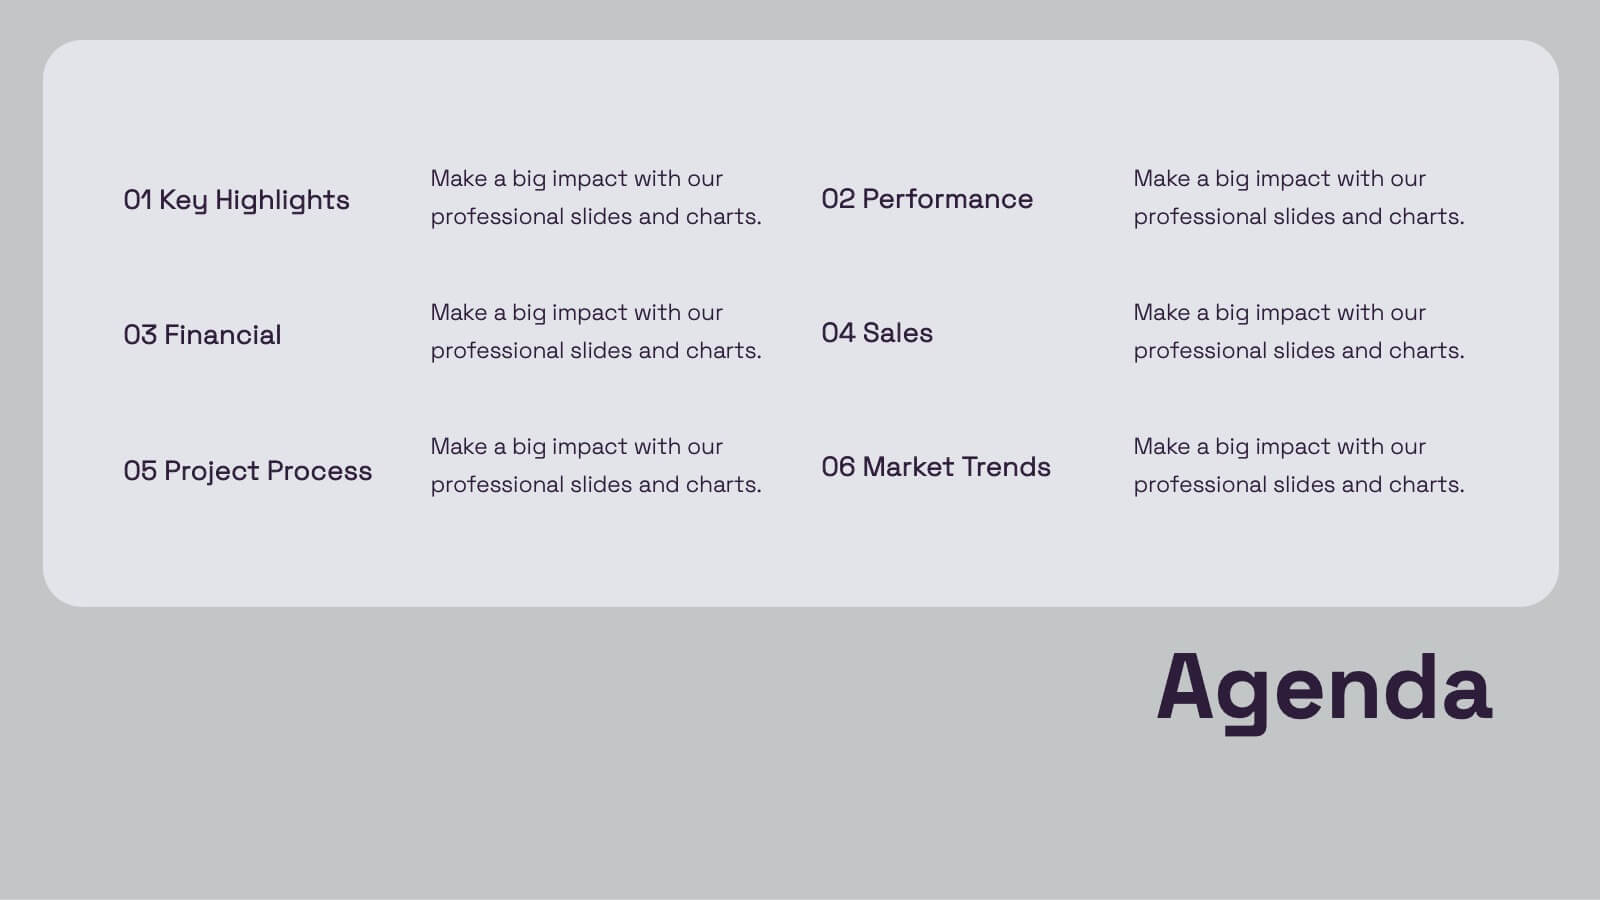
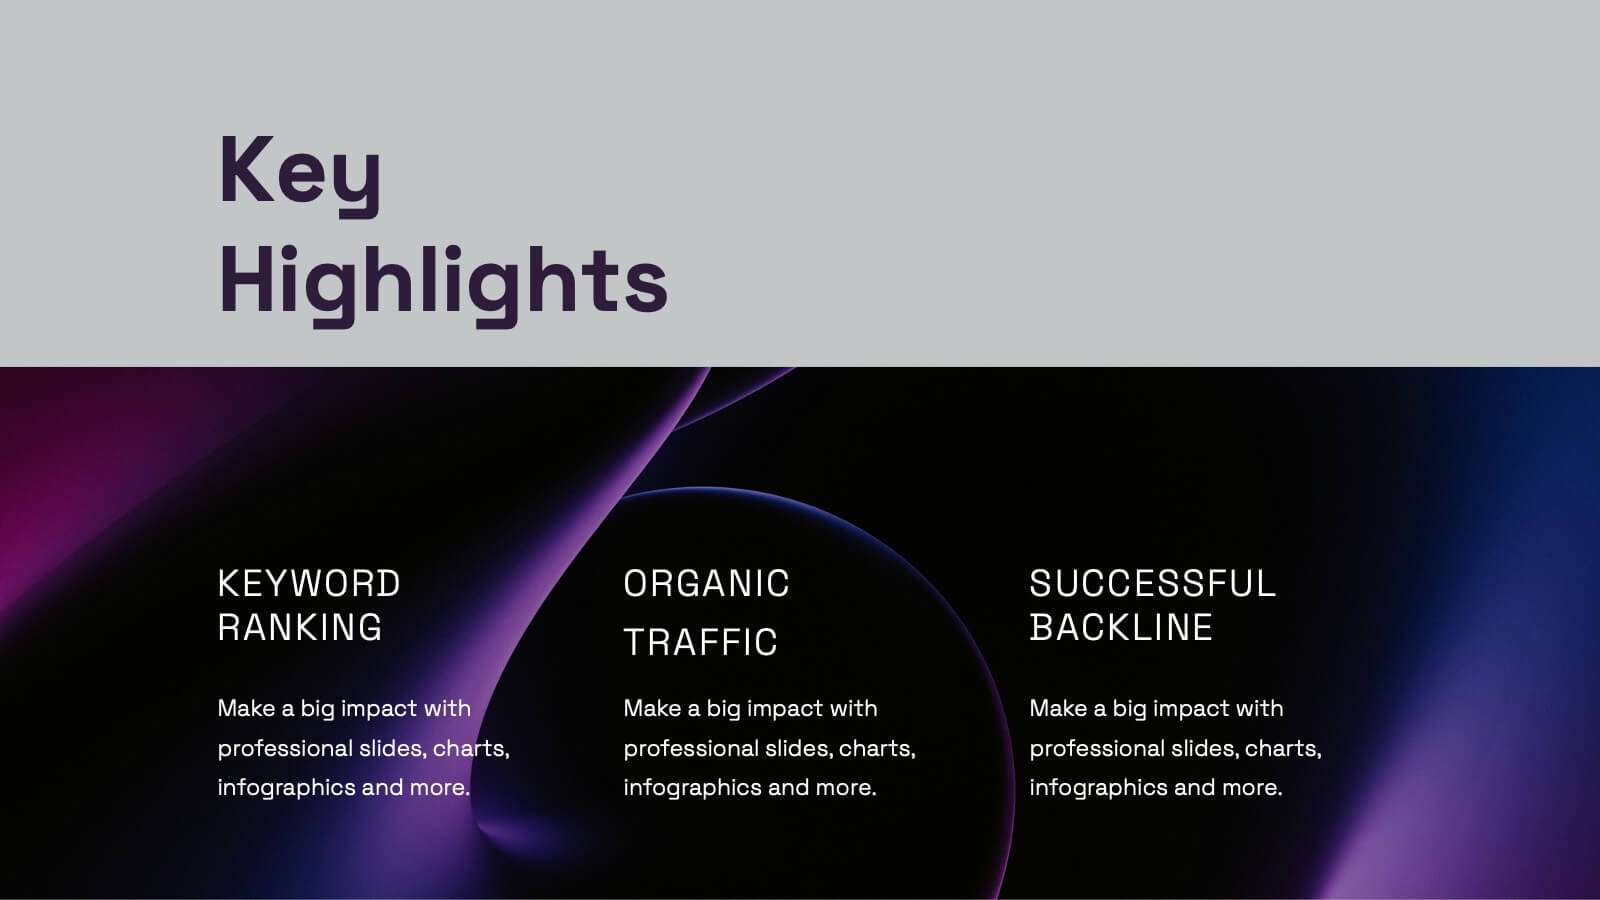
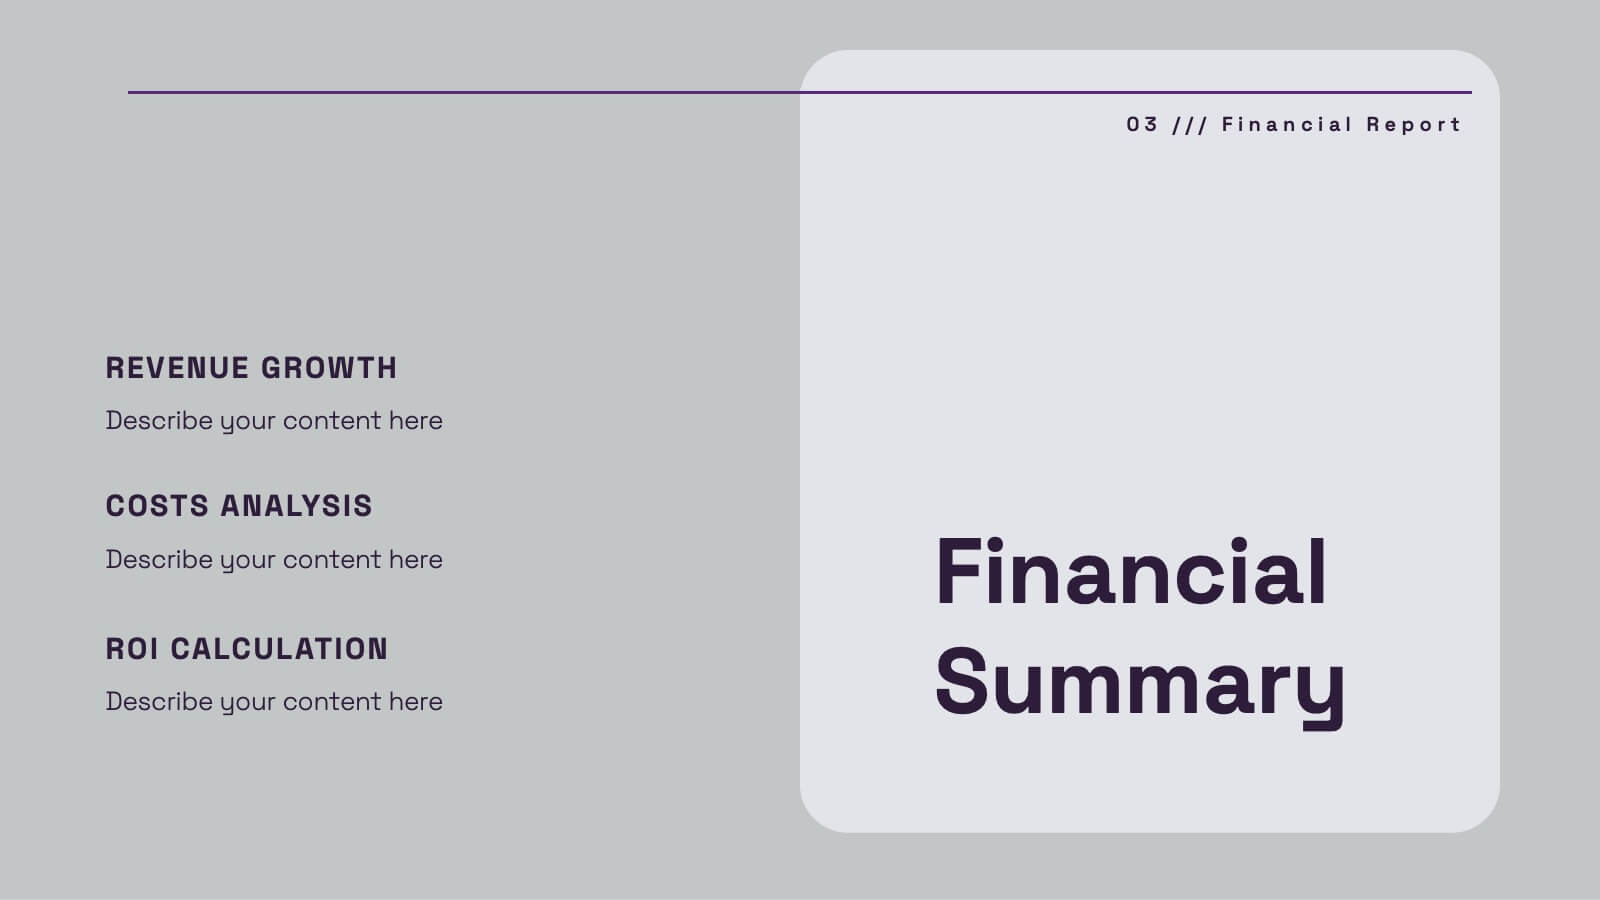
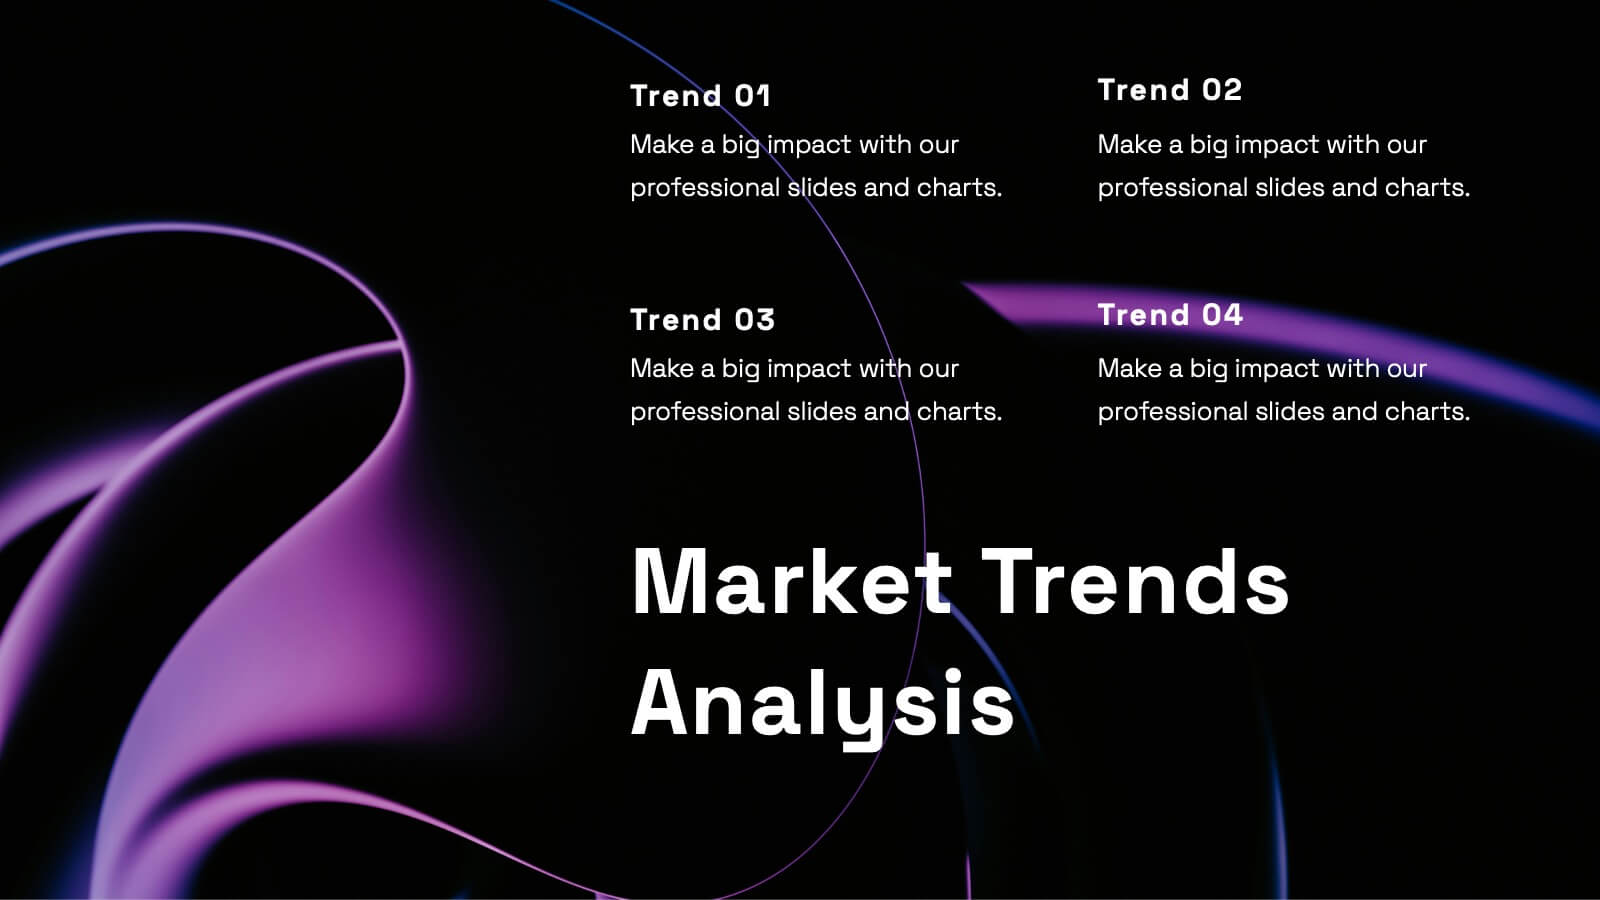
Uplift Financial Report Presentation
Present your financial or business report with this sleek and modern presentation template! It includes essential sections such as performance metrics, financial summaries, project progress, and market trends analysis, ensuring a comprehensive overview. Whether you're discussing key achievements or competitor insights, this template is perfect for delivering a professional and polished report. Compatible with PowerPoint, Keynote, and Google Slides for easy use and customization.


6 slides
Targeted Segment Analysis and Mapping Presentation
Highlight your market focus with the Targeted Segment Analysis and Mapping Presentation. This circular layout is perfect for breaking down five audience segments, using subtle icons and visual emphasis for clarity. Ideal for marketers, strategists, and business analysts presenting niche targeting. Fully editable in Canva, PowerPoint, Keynote, and Google Slides.


8 slides
Green Business Practices Presentation
Present your sustainability initiatives with clarity and impact using this eco-conscious template. Featuring a circular flow design with leaf and water drop icons, it's perfect for outlining environmentally friendly processes, corporate responsibility goals, or ESG reporting. The layout is fully customizable and color-coded to emphasize each step clearly. Ideal for green startups, CSR teams, and sustainability consultants. Works seamlessly with PowerPoint, Keynote, and Google Slides.


6 slides
Workforce Development Strategy Presentation
Enhance your workforce development strategies with our "Workforce Development Strategy Presentation" template. This infographic effectively displays essential workforce statistics and initiatives, organizing data into visually distinct segments for clarity. It covers various demographics and departmental roles, color-coded to differentiate data points like gender distribution and participation rates. Ideal for HR professionals and corporate trainers, this template supports strategic decisions in talent management and training. It simplifies complex information, making it accessible for all stakeholders. Compatible with PowerPoint, Keynote, and Google Slides, this template is essential for delivering impactful and strategic human resource presentations.


23 slides
Orbit Corporate Strategy Report Presentation
Elevate your strategic planning and reporting with a sleek and dynamic template that exudes professionalism and clarity! This Strategy Report template is designed to empower your organization’s vision, highlighting the core elements that drive success. From a powerful agenda slide that sets the tone to a detailed team update, this template ensures every aspect of your business is showcased with precision. The design is streamlined yet impactful, perfect for conveying key achievements, current projects, and future goals. Performance metrics, departmental goals, and training & development sections are laid out to emphasize your organization’s strengths and areas of focus. The template also includes slides dedicated to employee recognition, process improvement, and cross-functional collaboration, ensuring all facets of your business are covered. With a clean, modern aesthetic, this template is perfect for executives and team leaders alike, and is compatible with PowerPoint, Keynote, and Google Slides. Get ready to make your strategy presentations unforgettable!