


Features
- 4 Unique slides
- Fully editable and easy to edit in Microsoft Powerpoint, Keynote and Google Slides
- 16:9 widescreen layout
- Clean and professional designs
- Export to JPG, PDF or send by email


Do you have any questions?
Recommend


27 slides
Aqua Brand Strategy Report Presentation
Make waves with this fresh, aqua-inspired presentation template, perfect for delivering a standout brand strategy report! Designed to help you showcase your brand's vision, market positioning, and strategic goals, it features a clean, modern layout that grabs attention. Compatible with PowerPoint, Keynote, and Google Slides for effortless customization.


4 slides
Strategic Gap Planning Template Presentation
Visually map the journey from current state to strategic goals with this puzzle-themed gap analysis template. Ideal for identifying key disconnects, setting priorities, and aligning teams. Fully editable and designed for clarity, this presentation works in PowerPoint, Keynote, and Google Slides—perfect for planning sessions, roadmaps, and executive briefings.


4 slides
Current Project Health and Status Report Presentation
Track progress with clarity using the Current Project Health and Status Report presentation slide. Featuring a modern clipboard layout with checkboxes and project tools like a pencil, magnifier, and ruler, this slide is perfect for highlighting task completion, pending issues, and project milestones. Ideal for weekly updates, stakeholder reviews, or status dashboards. Fully editable in PowerPoint, Keynote, and Google Slides.


8 slides
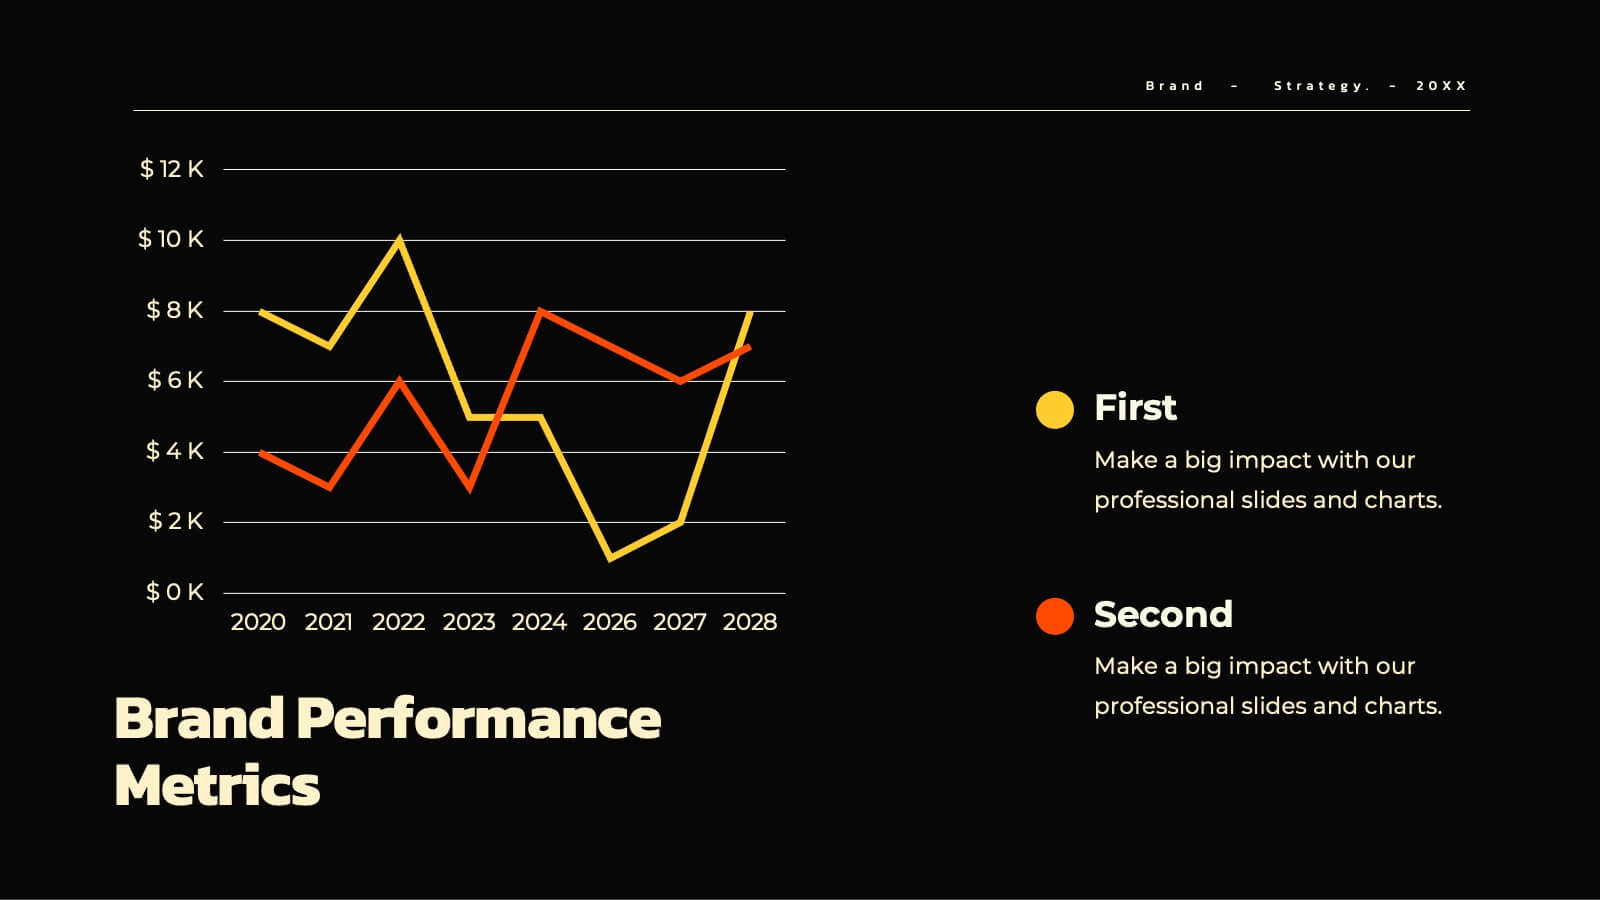
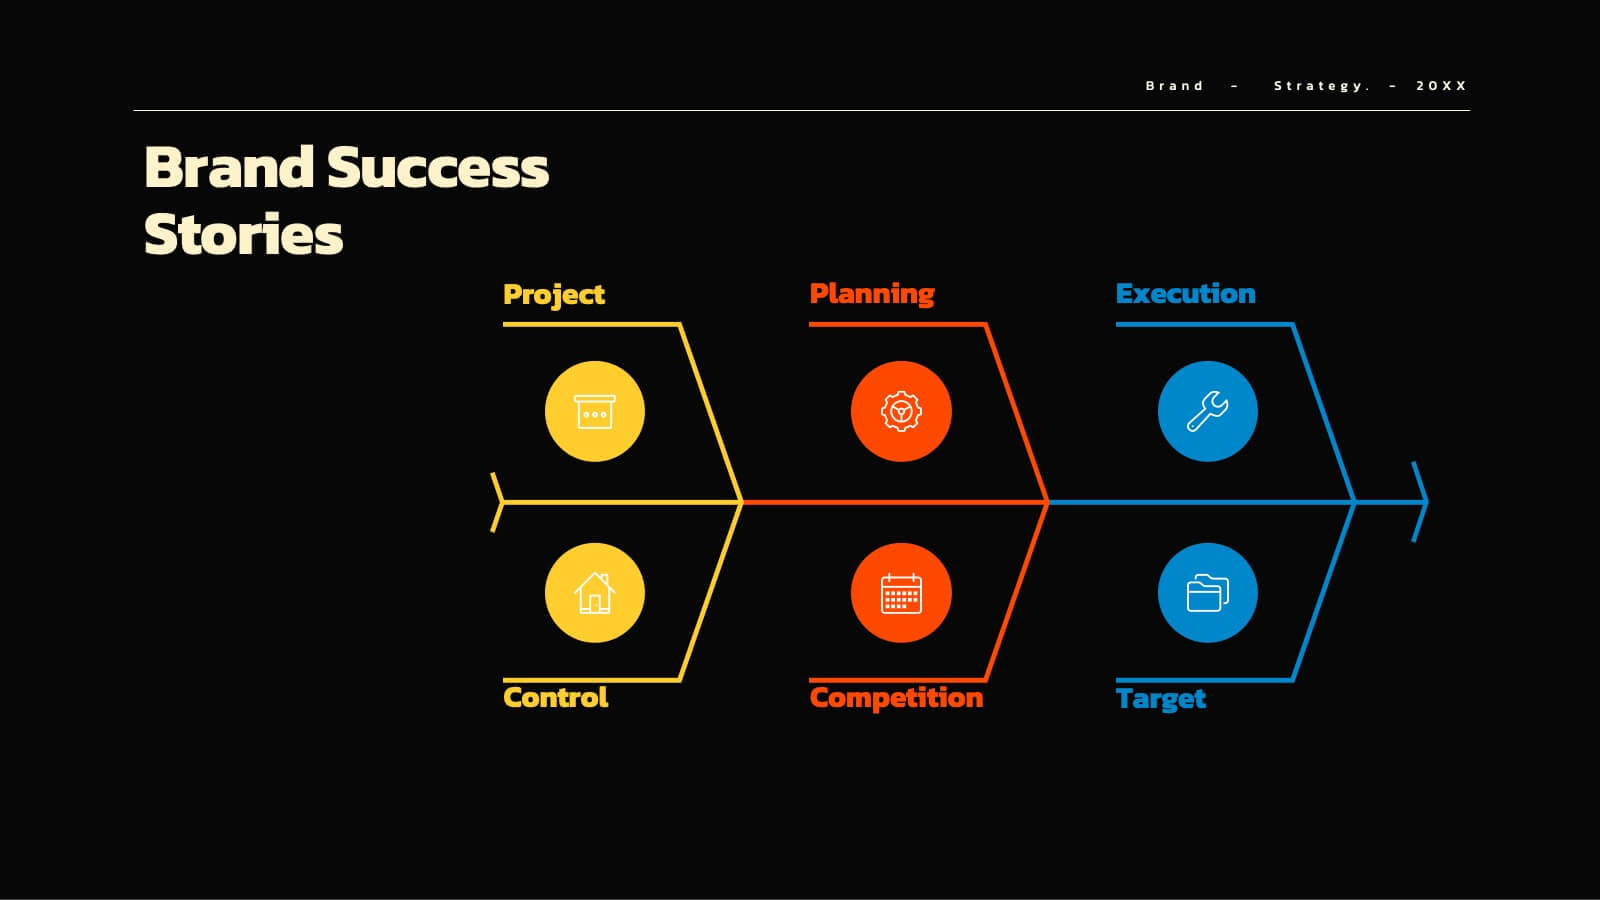
Business Growth Strategies Presentation
Take your vision from concept to expansion with a sleek, modern presentation designed to highlight progress and future potential. Ideal for showcasing goals, performance metrics, and market strategies, it keeps your ideas structured and engaging. Fully compatible with PowerPoint, Keynote, and Google Slides for effortless customization and presentation delivery.


6 slides
Iceberg Visualization Business Concept Presentation
Make your message stand out with a bold visual that reveals what lies above and below the surface. This presentation uses a clear iceberg structure to help explain business concepts, hidden insights, and layered ideas with ease. Perfect for strategy, planning, and analysis. Compatible with PowerPoint, Keynote, and Google Slides.


5 slides
Strategic Planning with Concentric Circles
Draw your audience in with a visual that’s as focused as your message! This strategic concentric circles template helps you map out layered priorities, interconnected goals, or phased strategies in a clean, compelling way. Fully customizable and compatible with PowerPoint, Keynote, and Google Slides for seamless presentation design.
3 slides
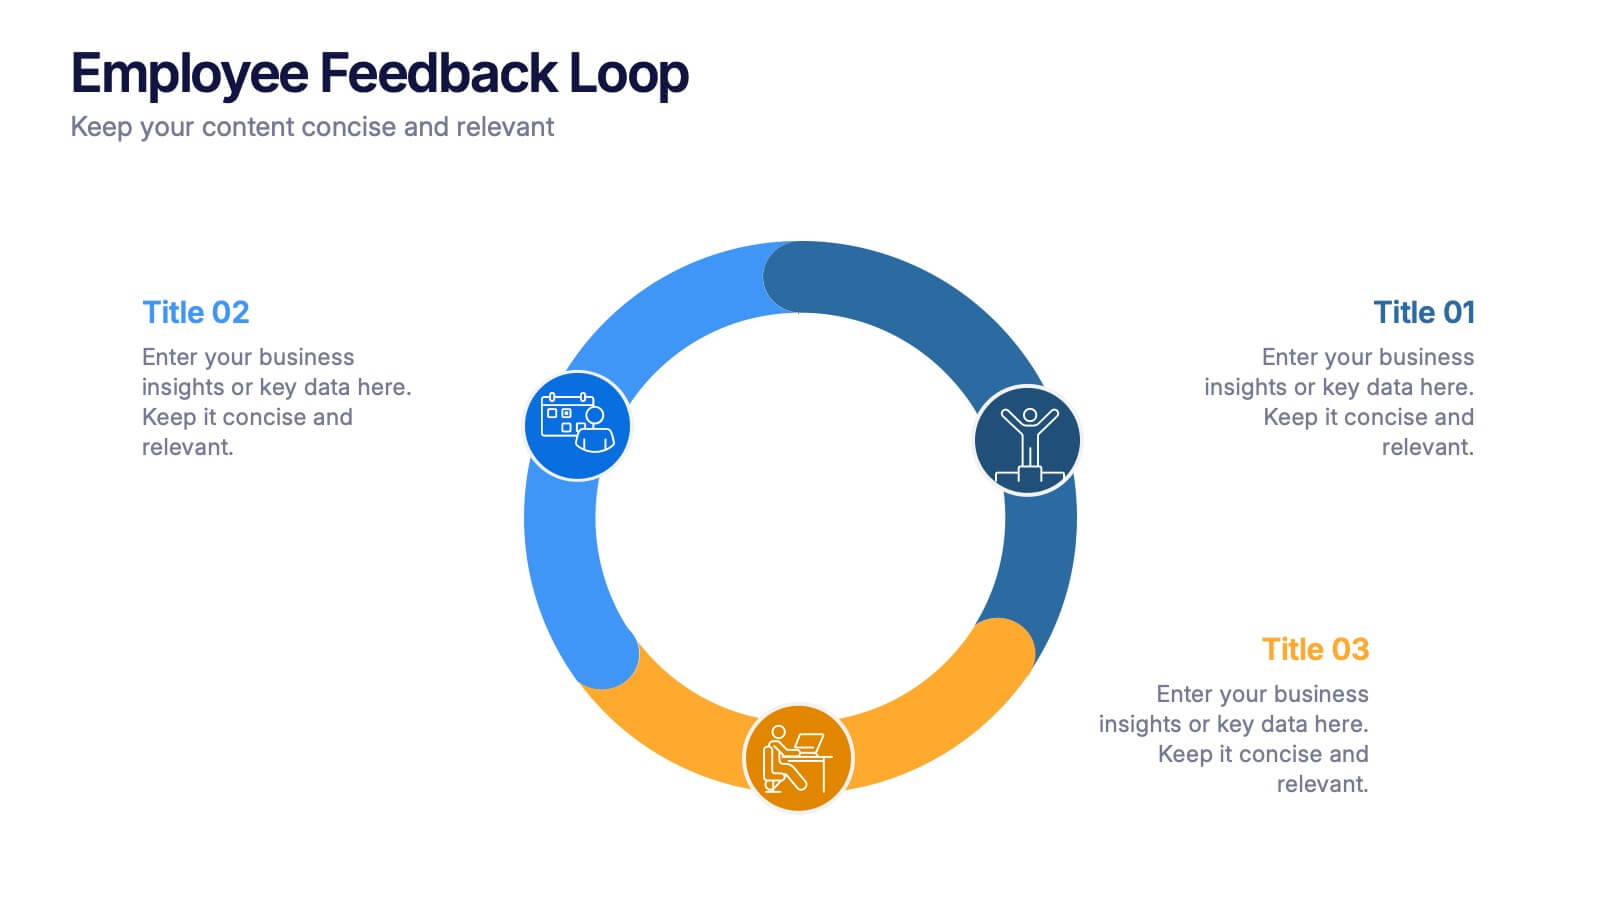
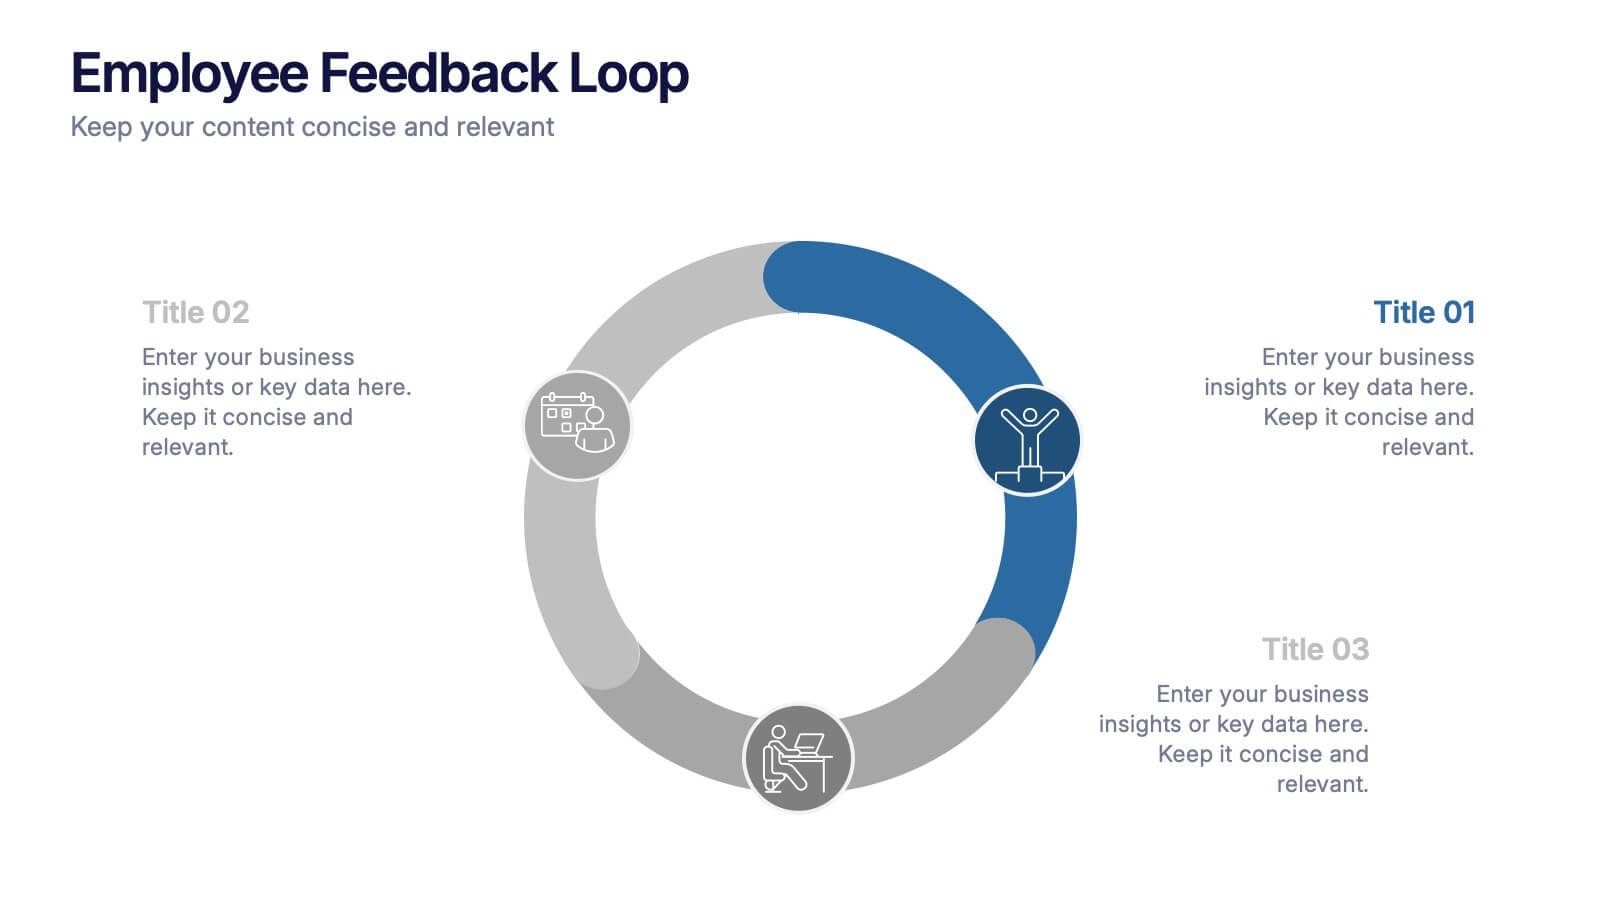
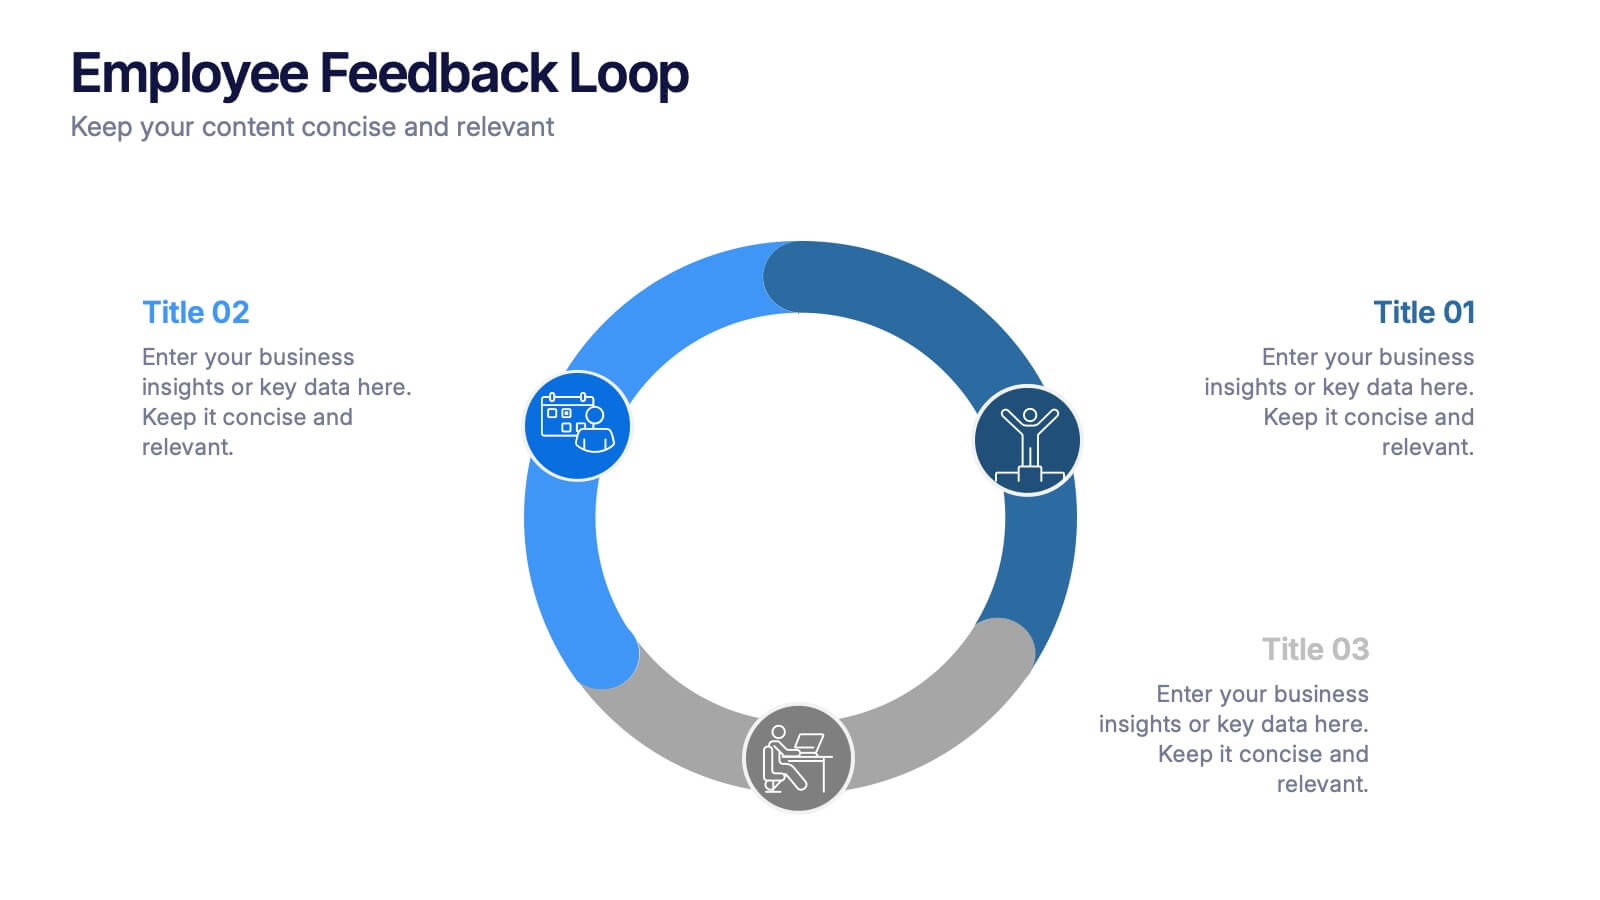
Employee Feedback Loop Presentation
Keep your team connected and continuously improving with this engaging presentation design. Ideal for showcasing communication strategies, feedback cycles, and performance insights, it helps visualize the process of collecting and acting on employee input. Fully customizable and compatible with PowerPoint, Keynote, and Google Slides for effortless, professional presentations.


7 slides
Root Cause Diagram
Root Cause Analysis, is a structured approach used to identify the fundamental reason or core issue underlying a problem, incident, or undesired outcome within a system. This infographic template is designed to guide you through the investigative journey of identifying the fundamental causes that lie at the core of complex issues. Compatible with Powerpoint, Keynote, and Google Slides. This introduces the concept of root cause analysis, illustrating its importance in problem-solving and decision-making. This infographic showcases how each level digs deeper into the underlying issues, starting to reaching the fundamental causes.


4 slides
Preventative Healthcare Strategies Presentation
Present medical insights with clarity using this syringe-themed slide layout designed for preventative healthcare strategies. Ideal for showcasing public health plans, vaccination drives, or early intervention tactics. Fully editable in PowerPoint, Keynote, and Google Slides, this modern visual aids healthcare professionals in delivering data-driven, concise messages with professional impact.


3 slides
Break Even Financial Model Presentation
Bring your financial story to life with this sleek and professional presentation design. Ideal for illustrating profit margins, cost recovery, or growth potential, it helps visualize when investments start to pay off. Fully customizable and compatible with PowerPoint, Keynote, and Google Slides for effortless editing and impactful presentations.


20 slides
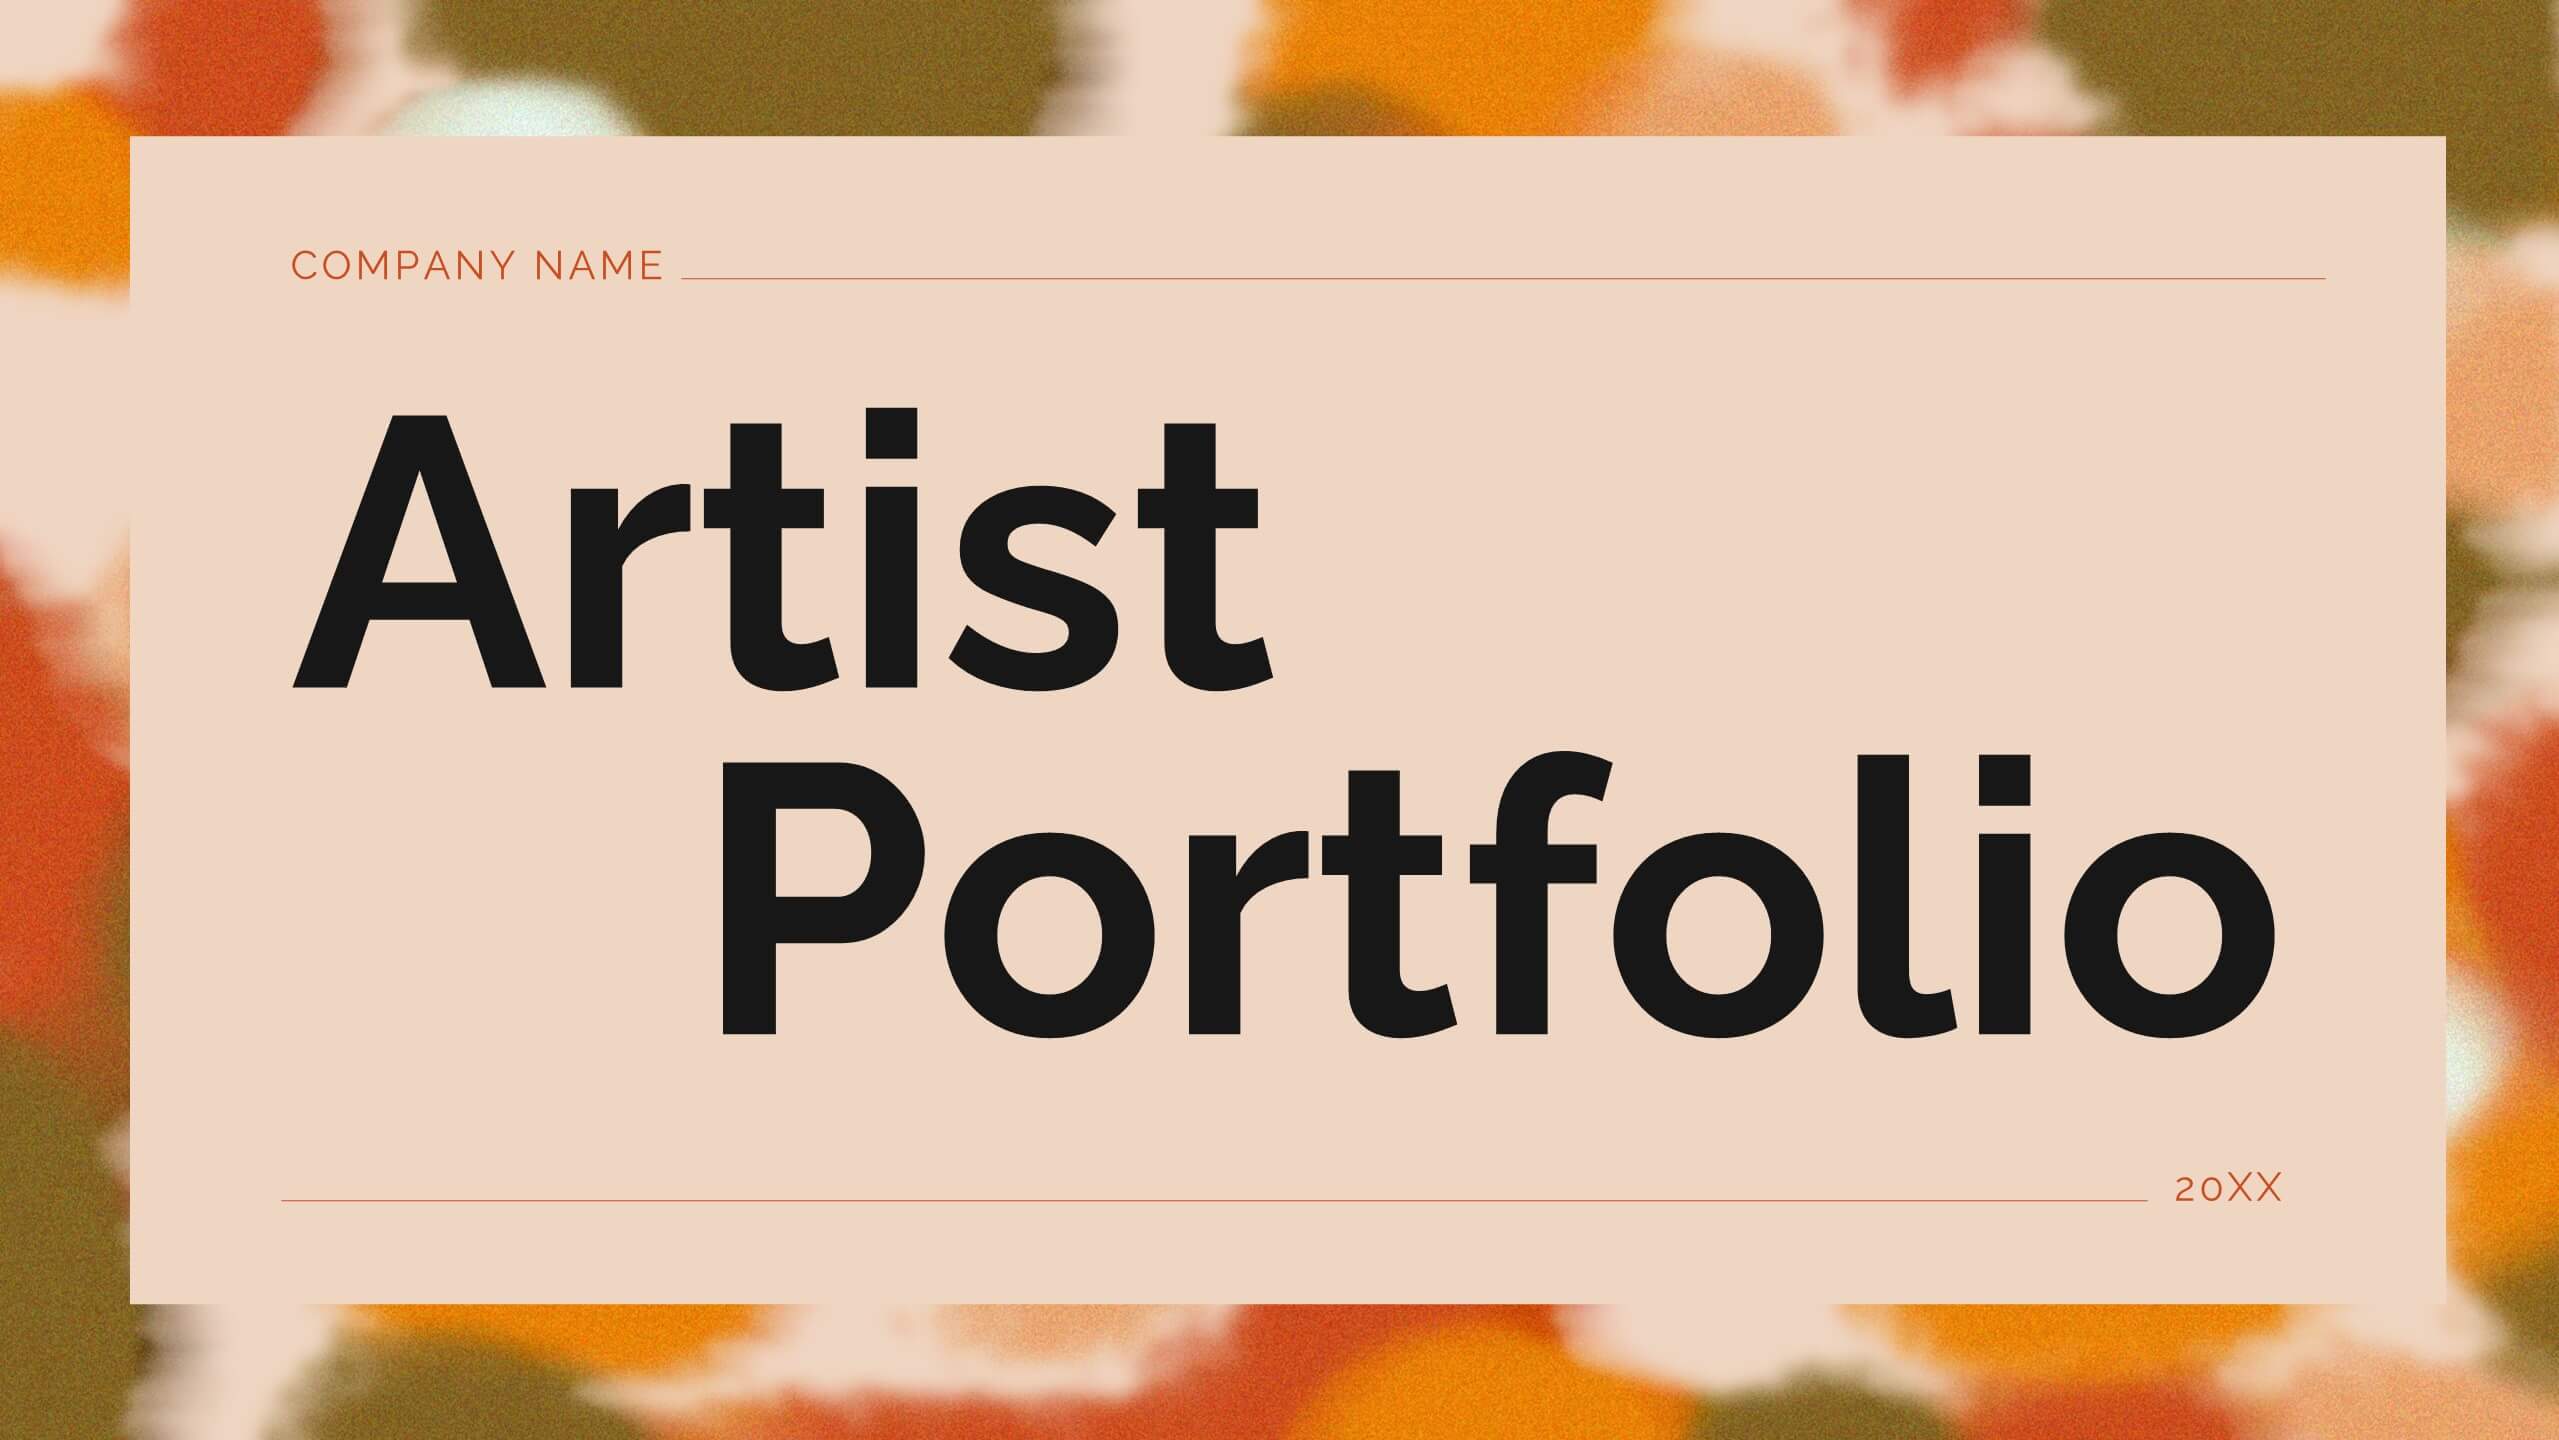
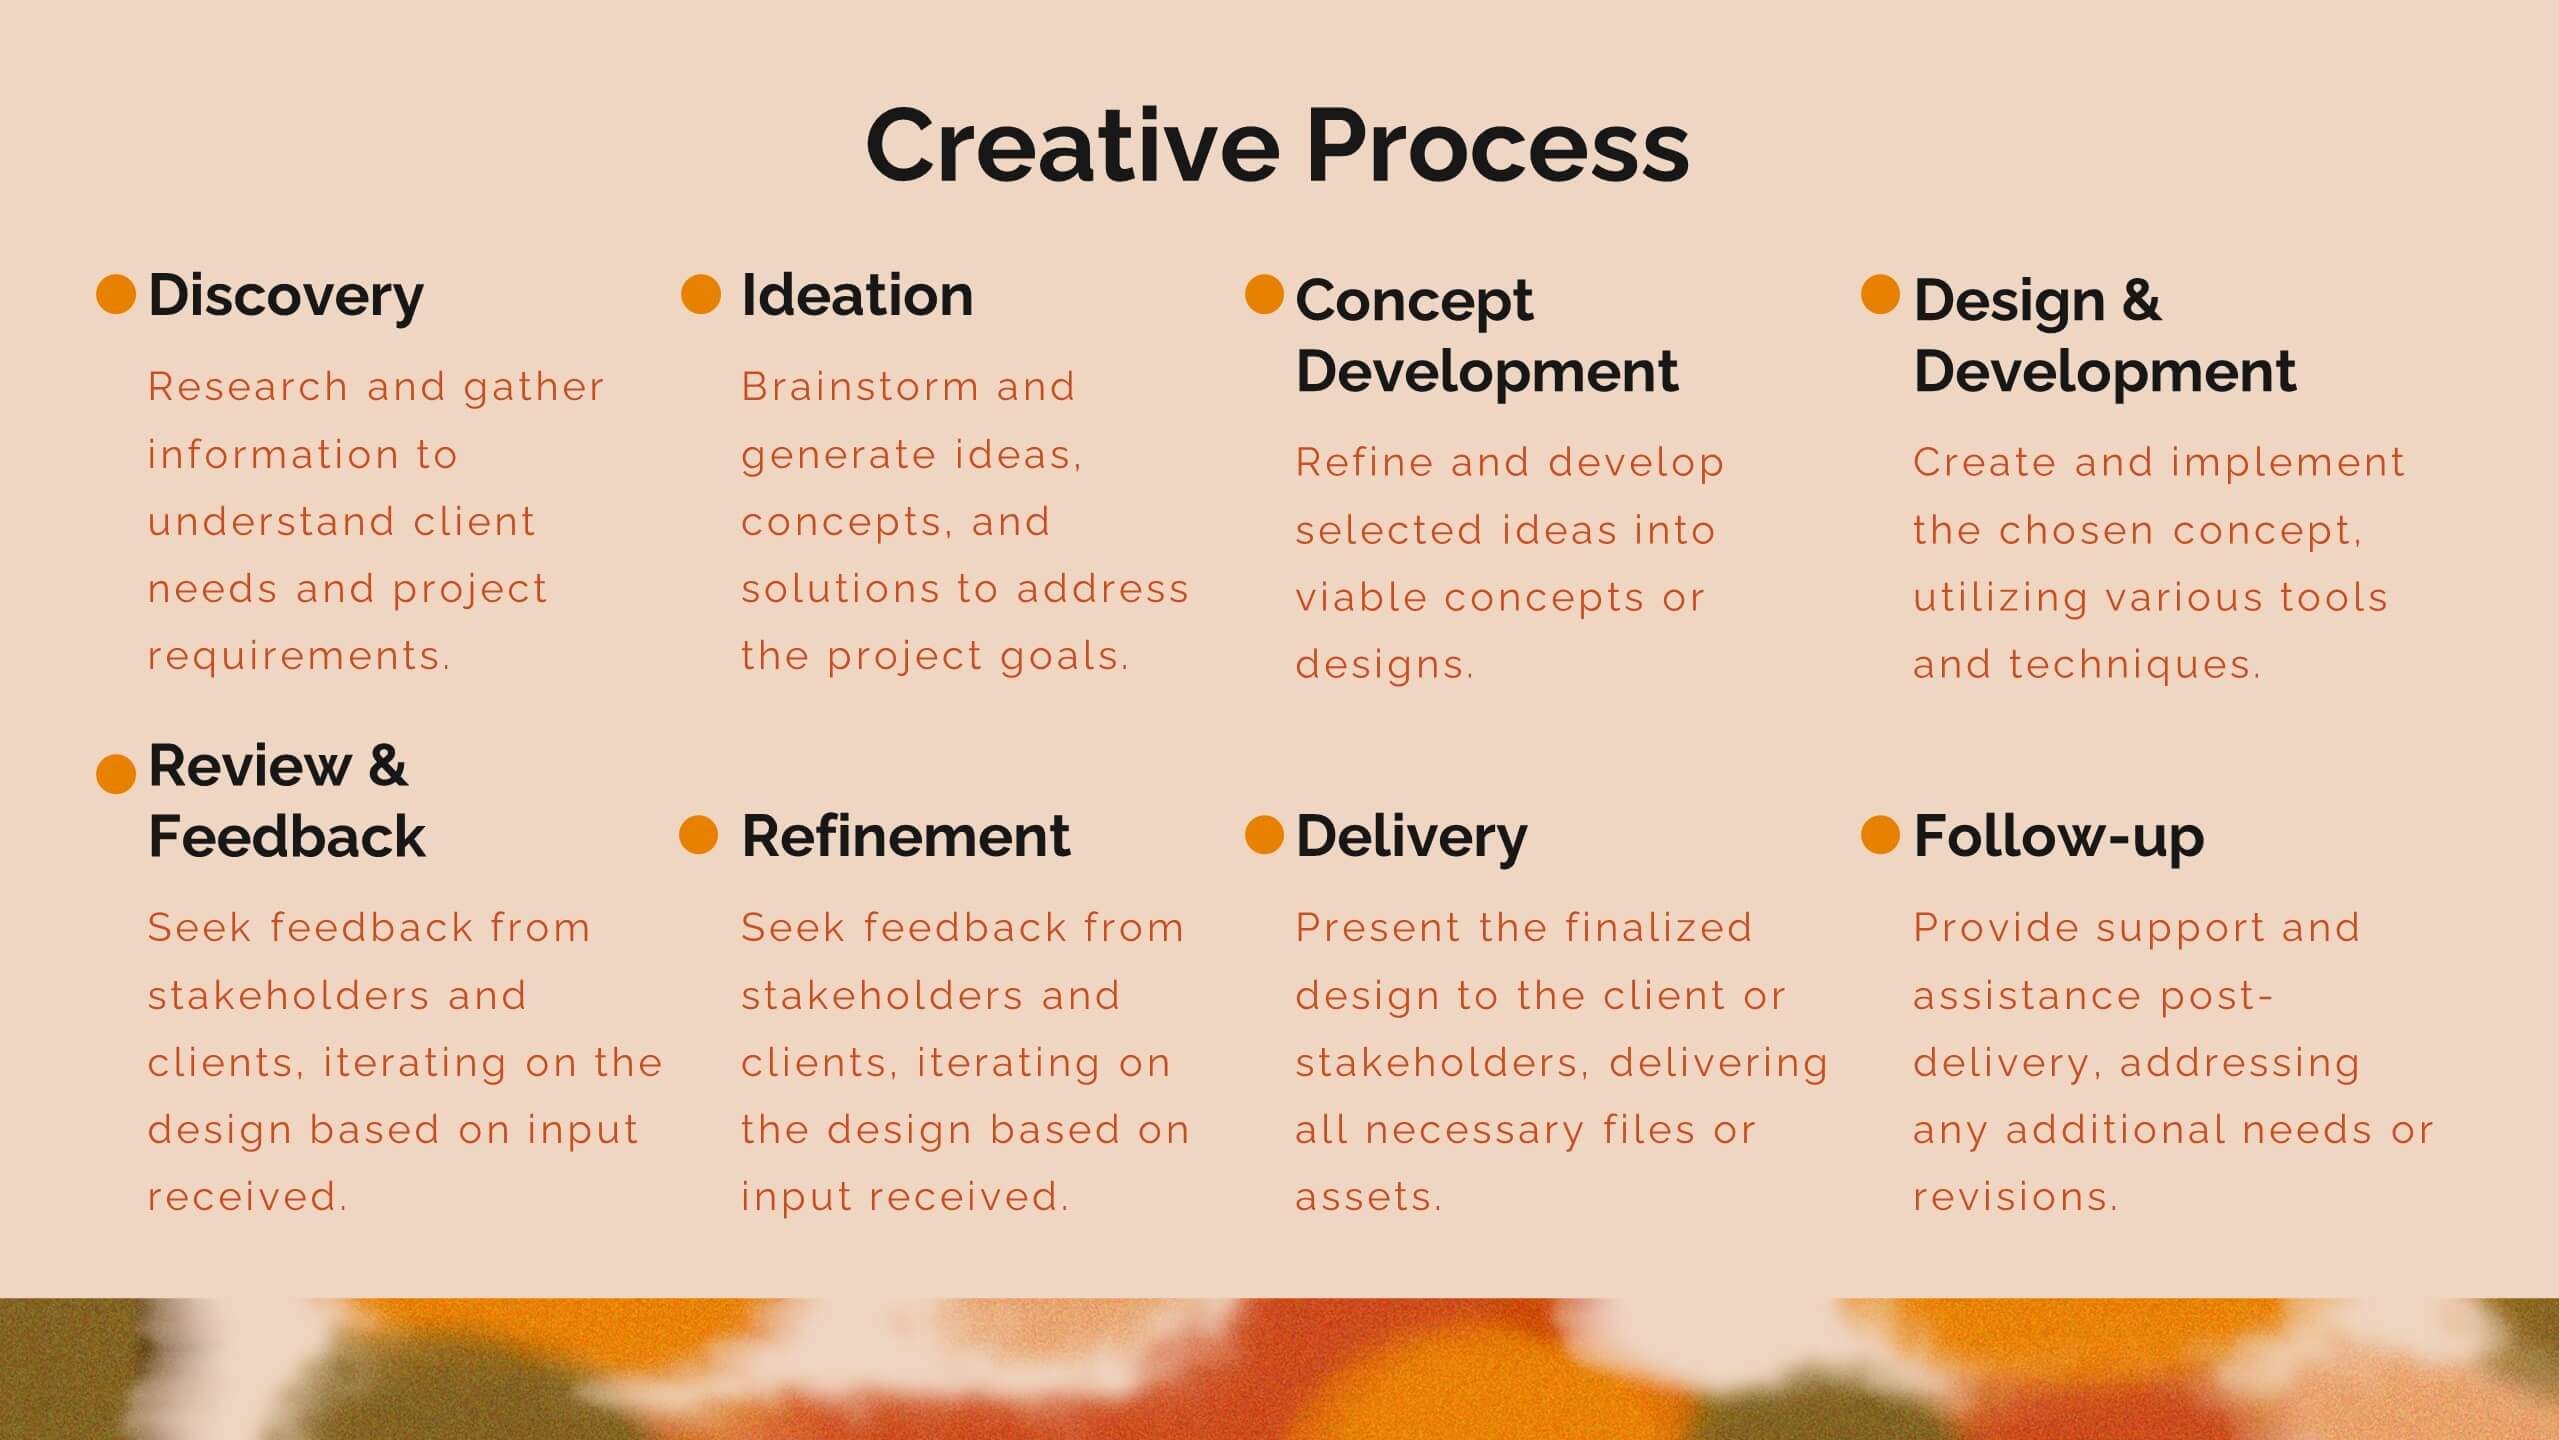
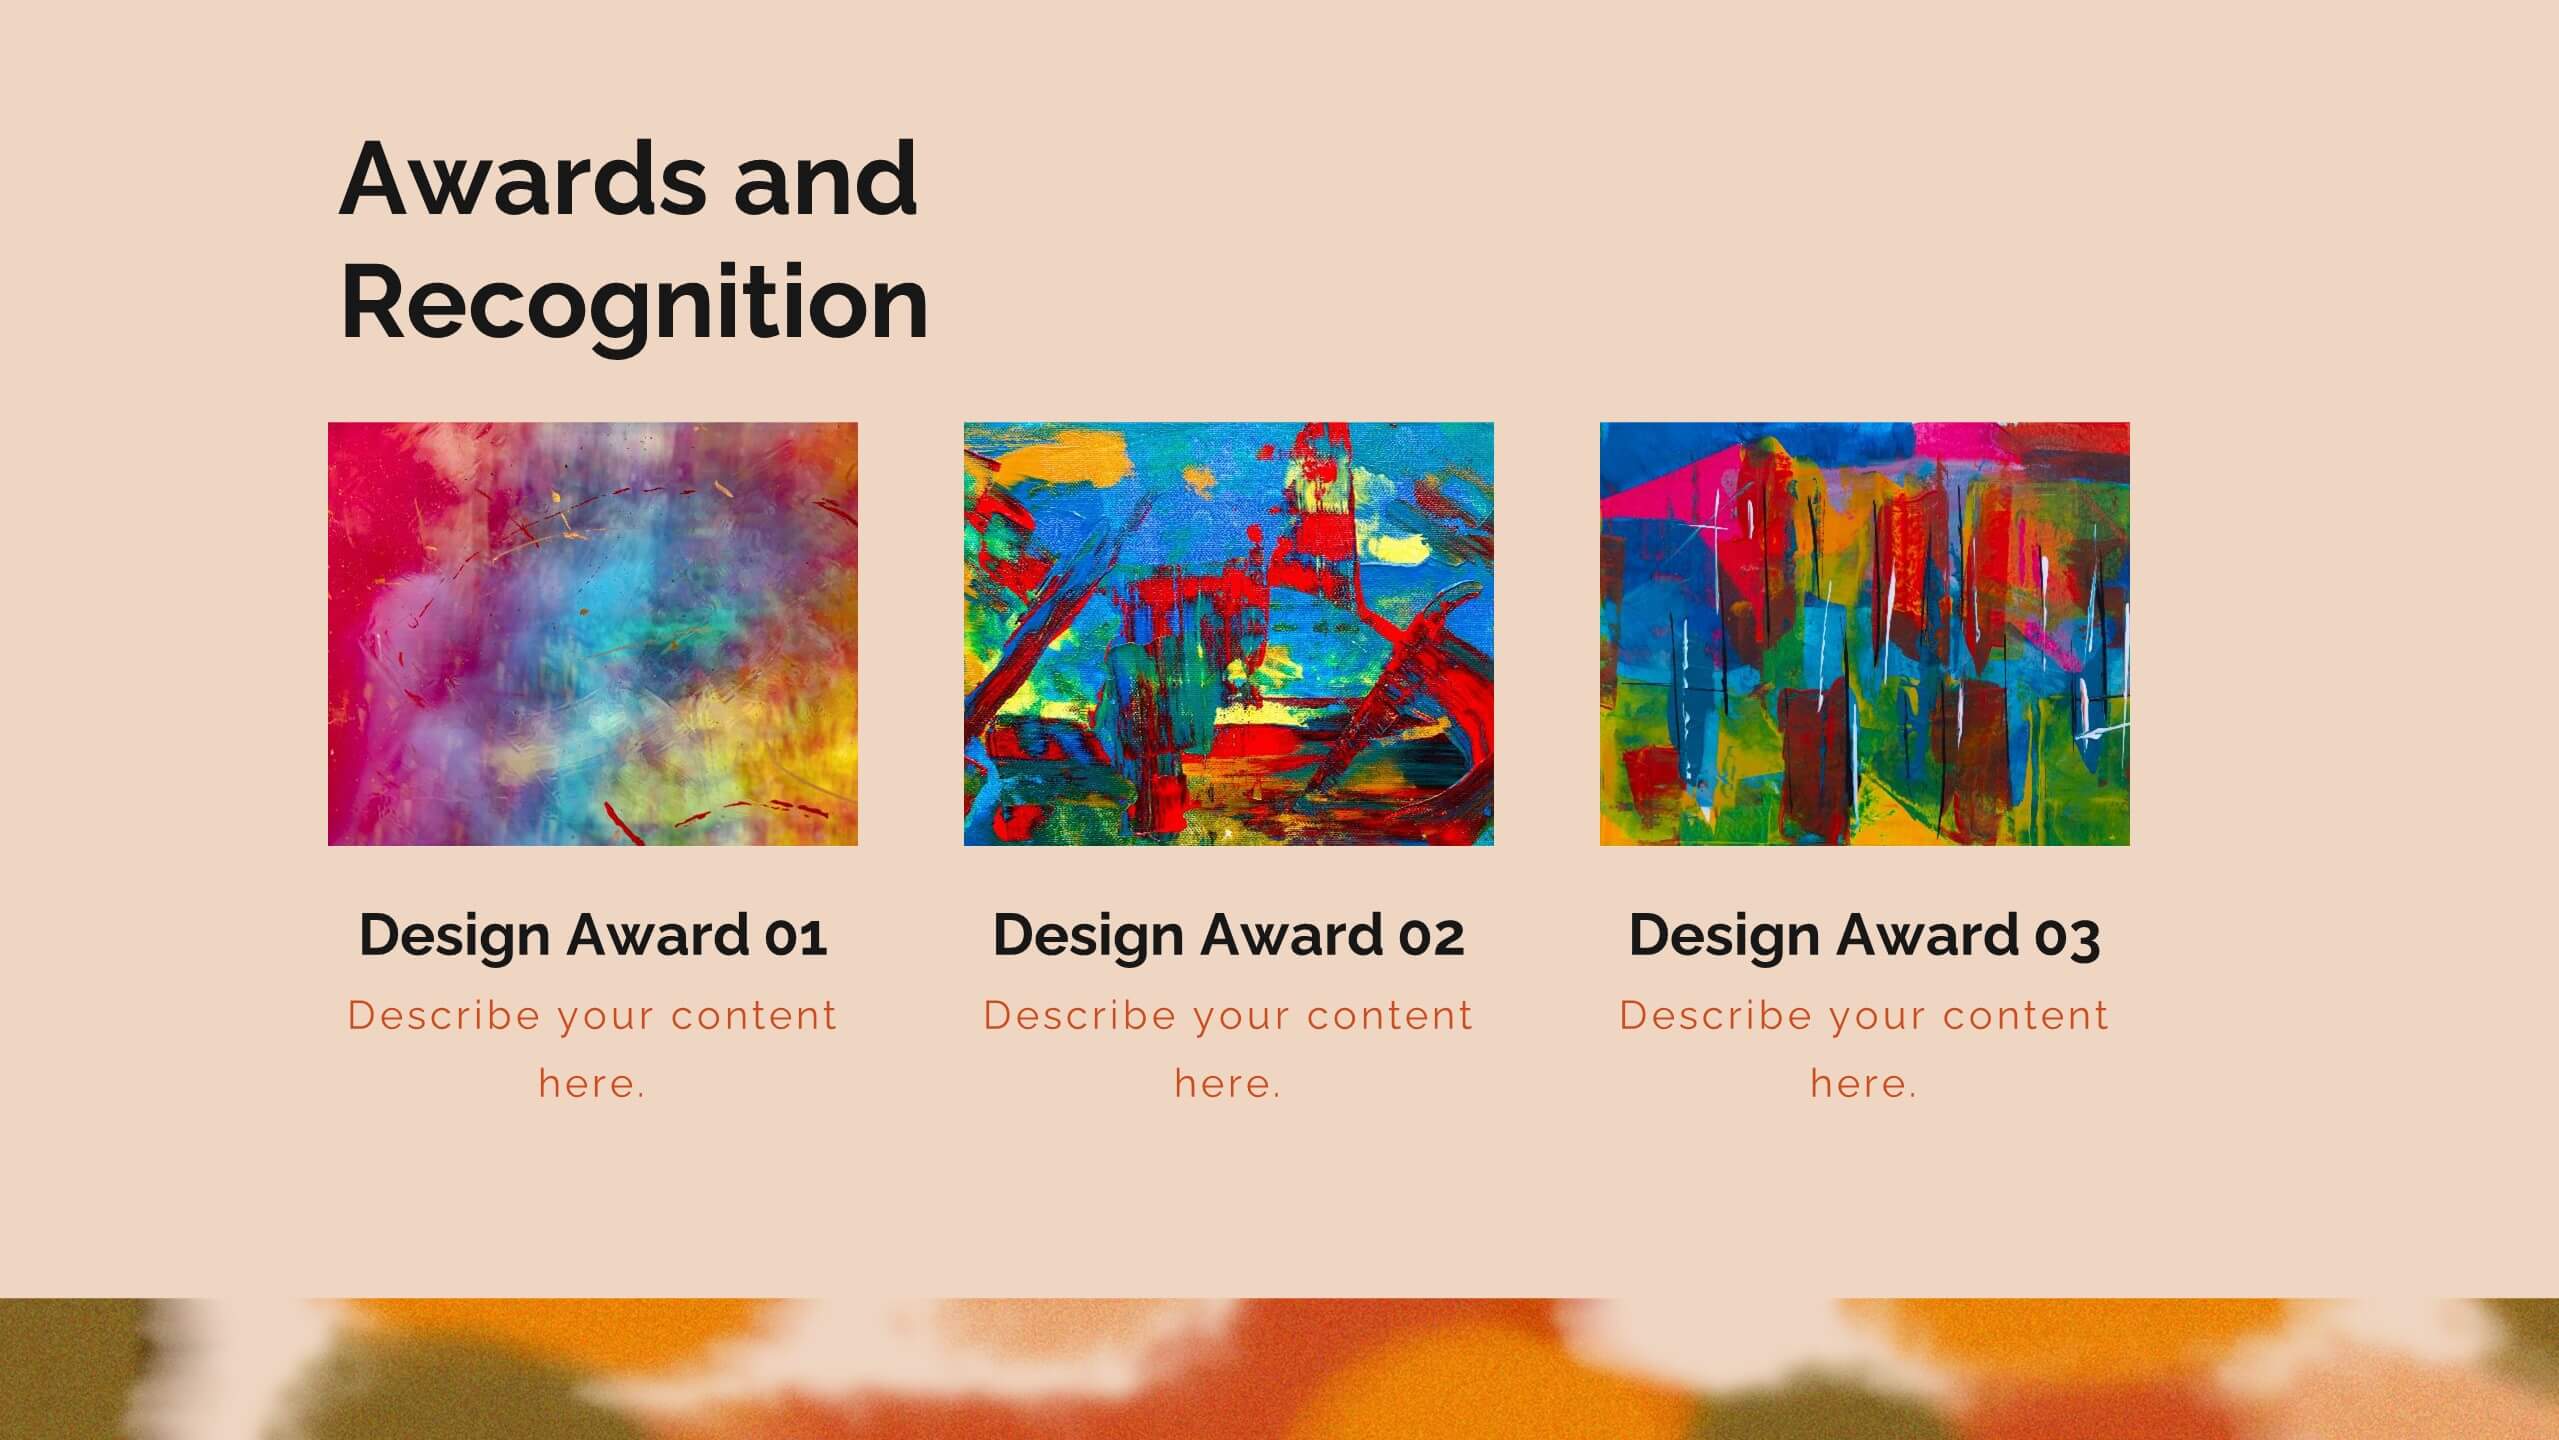
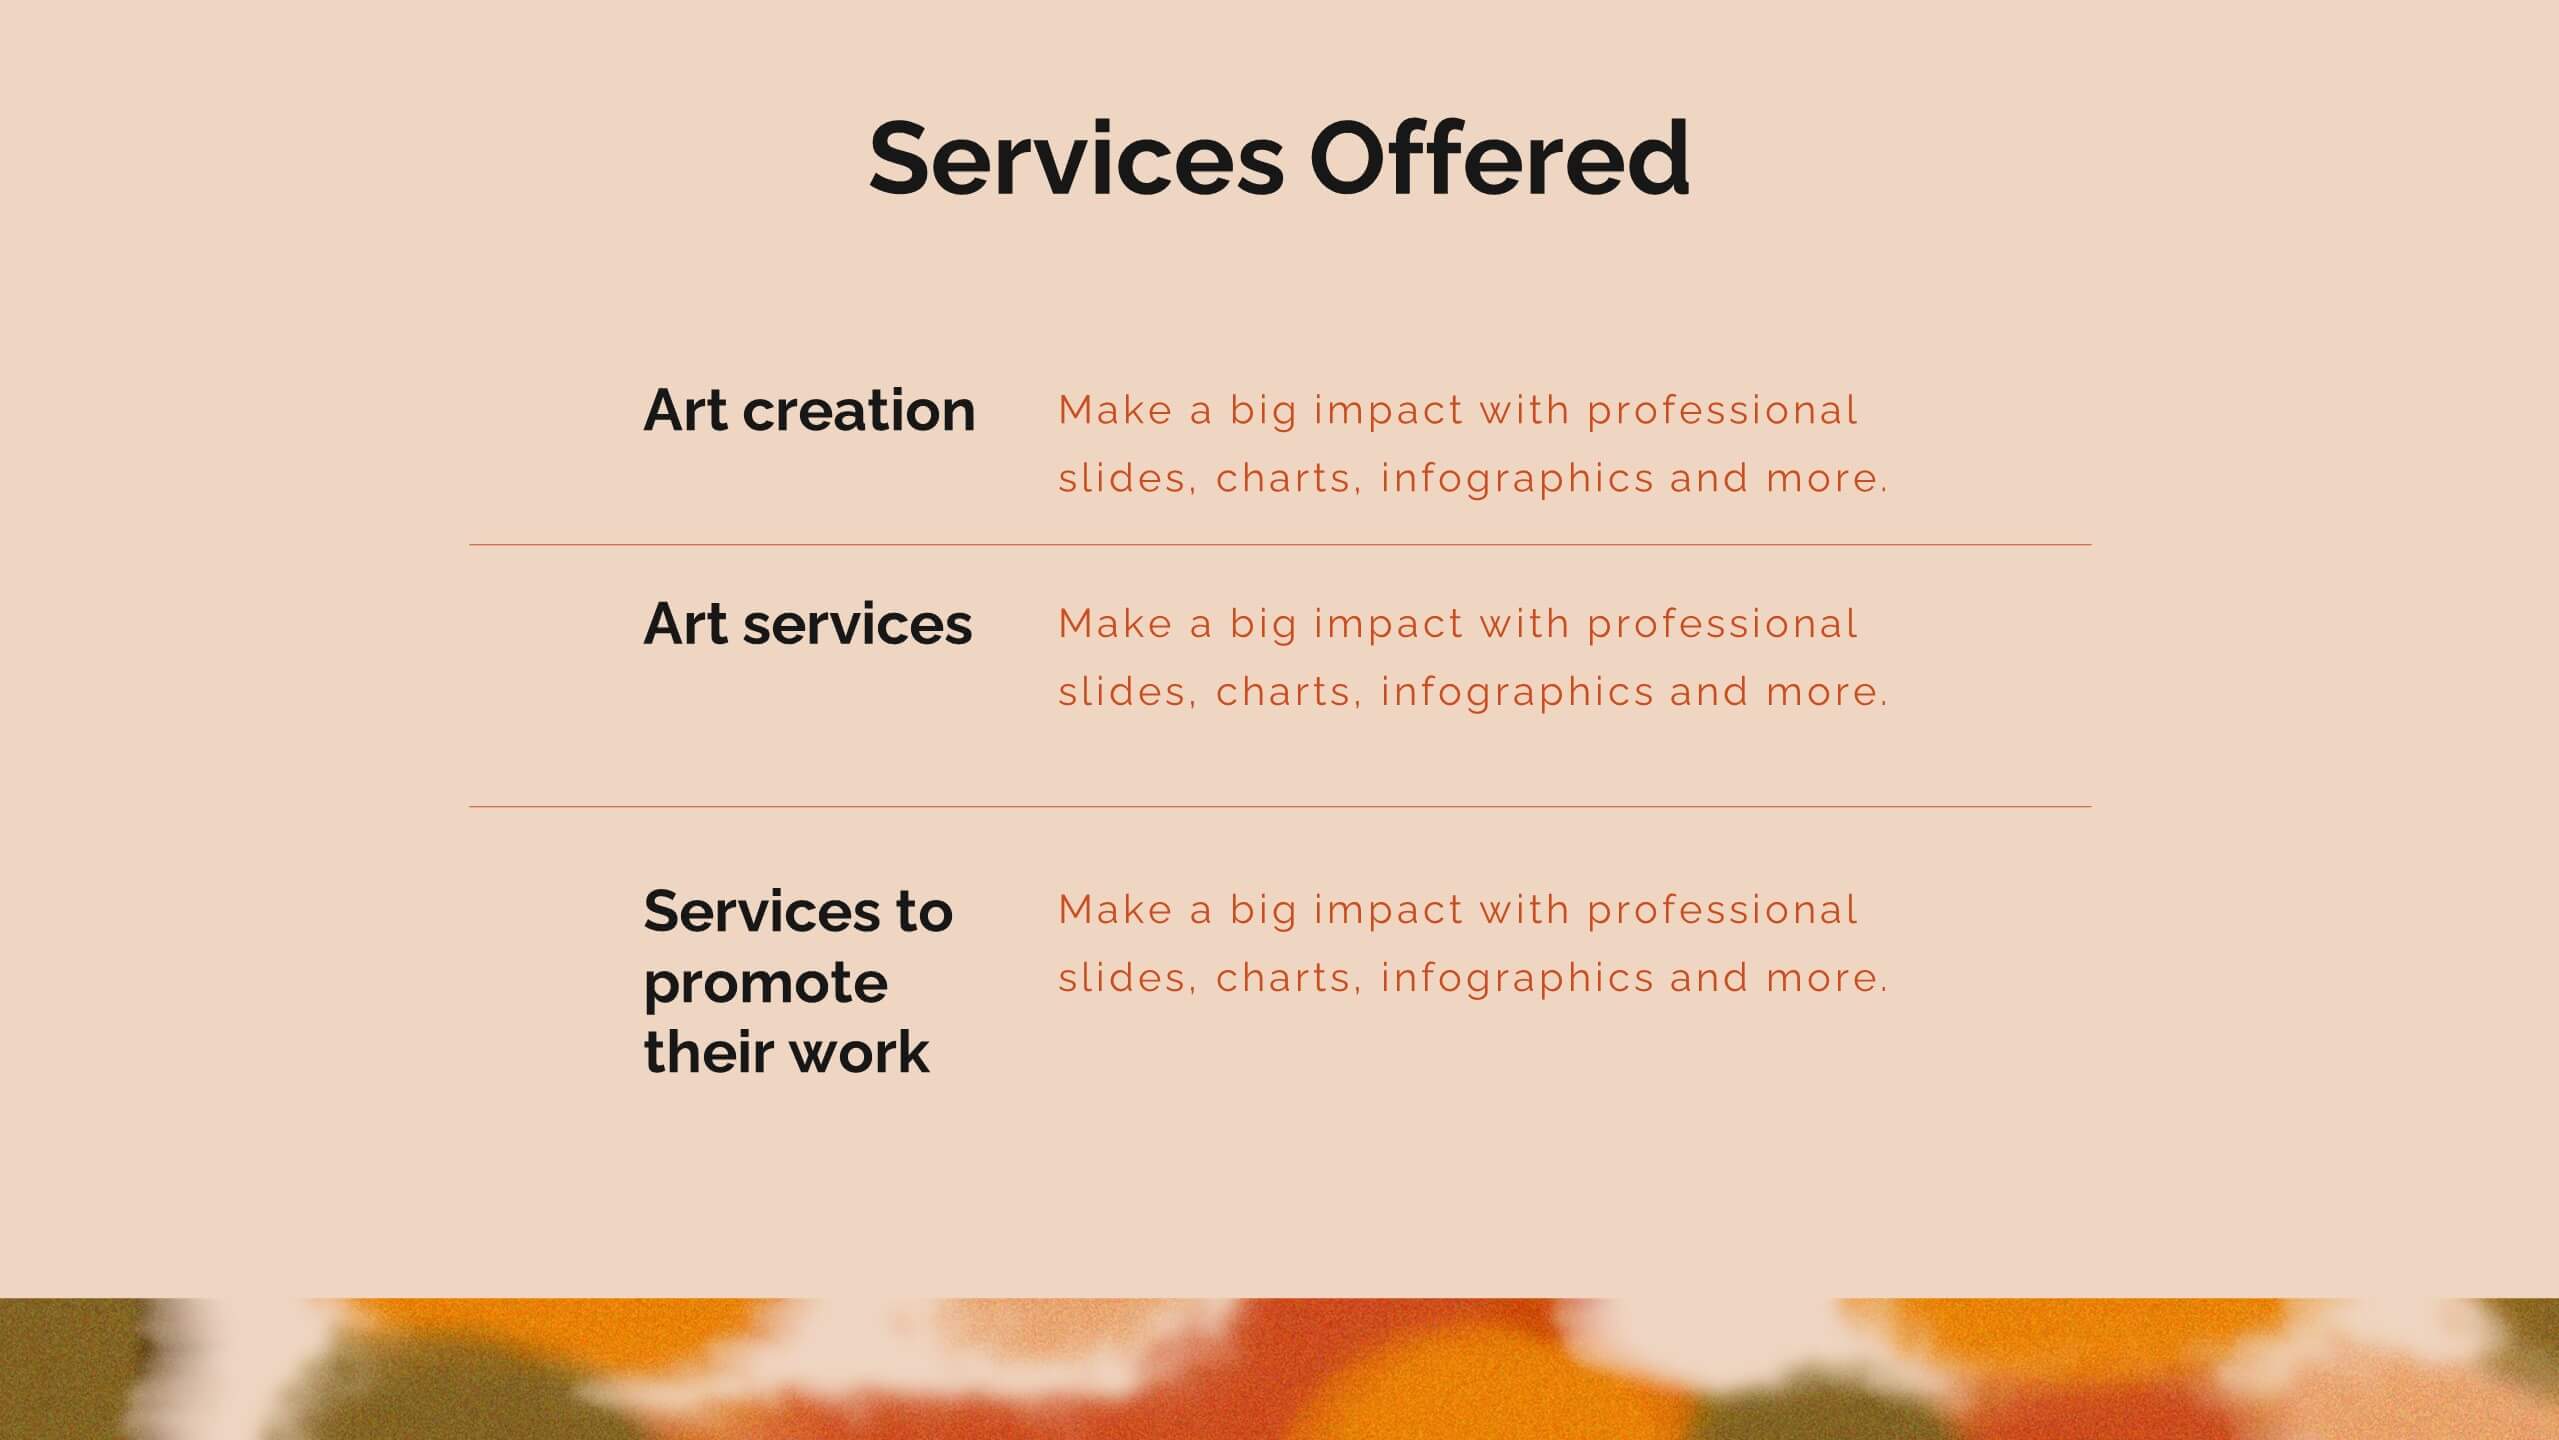
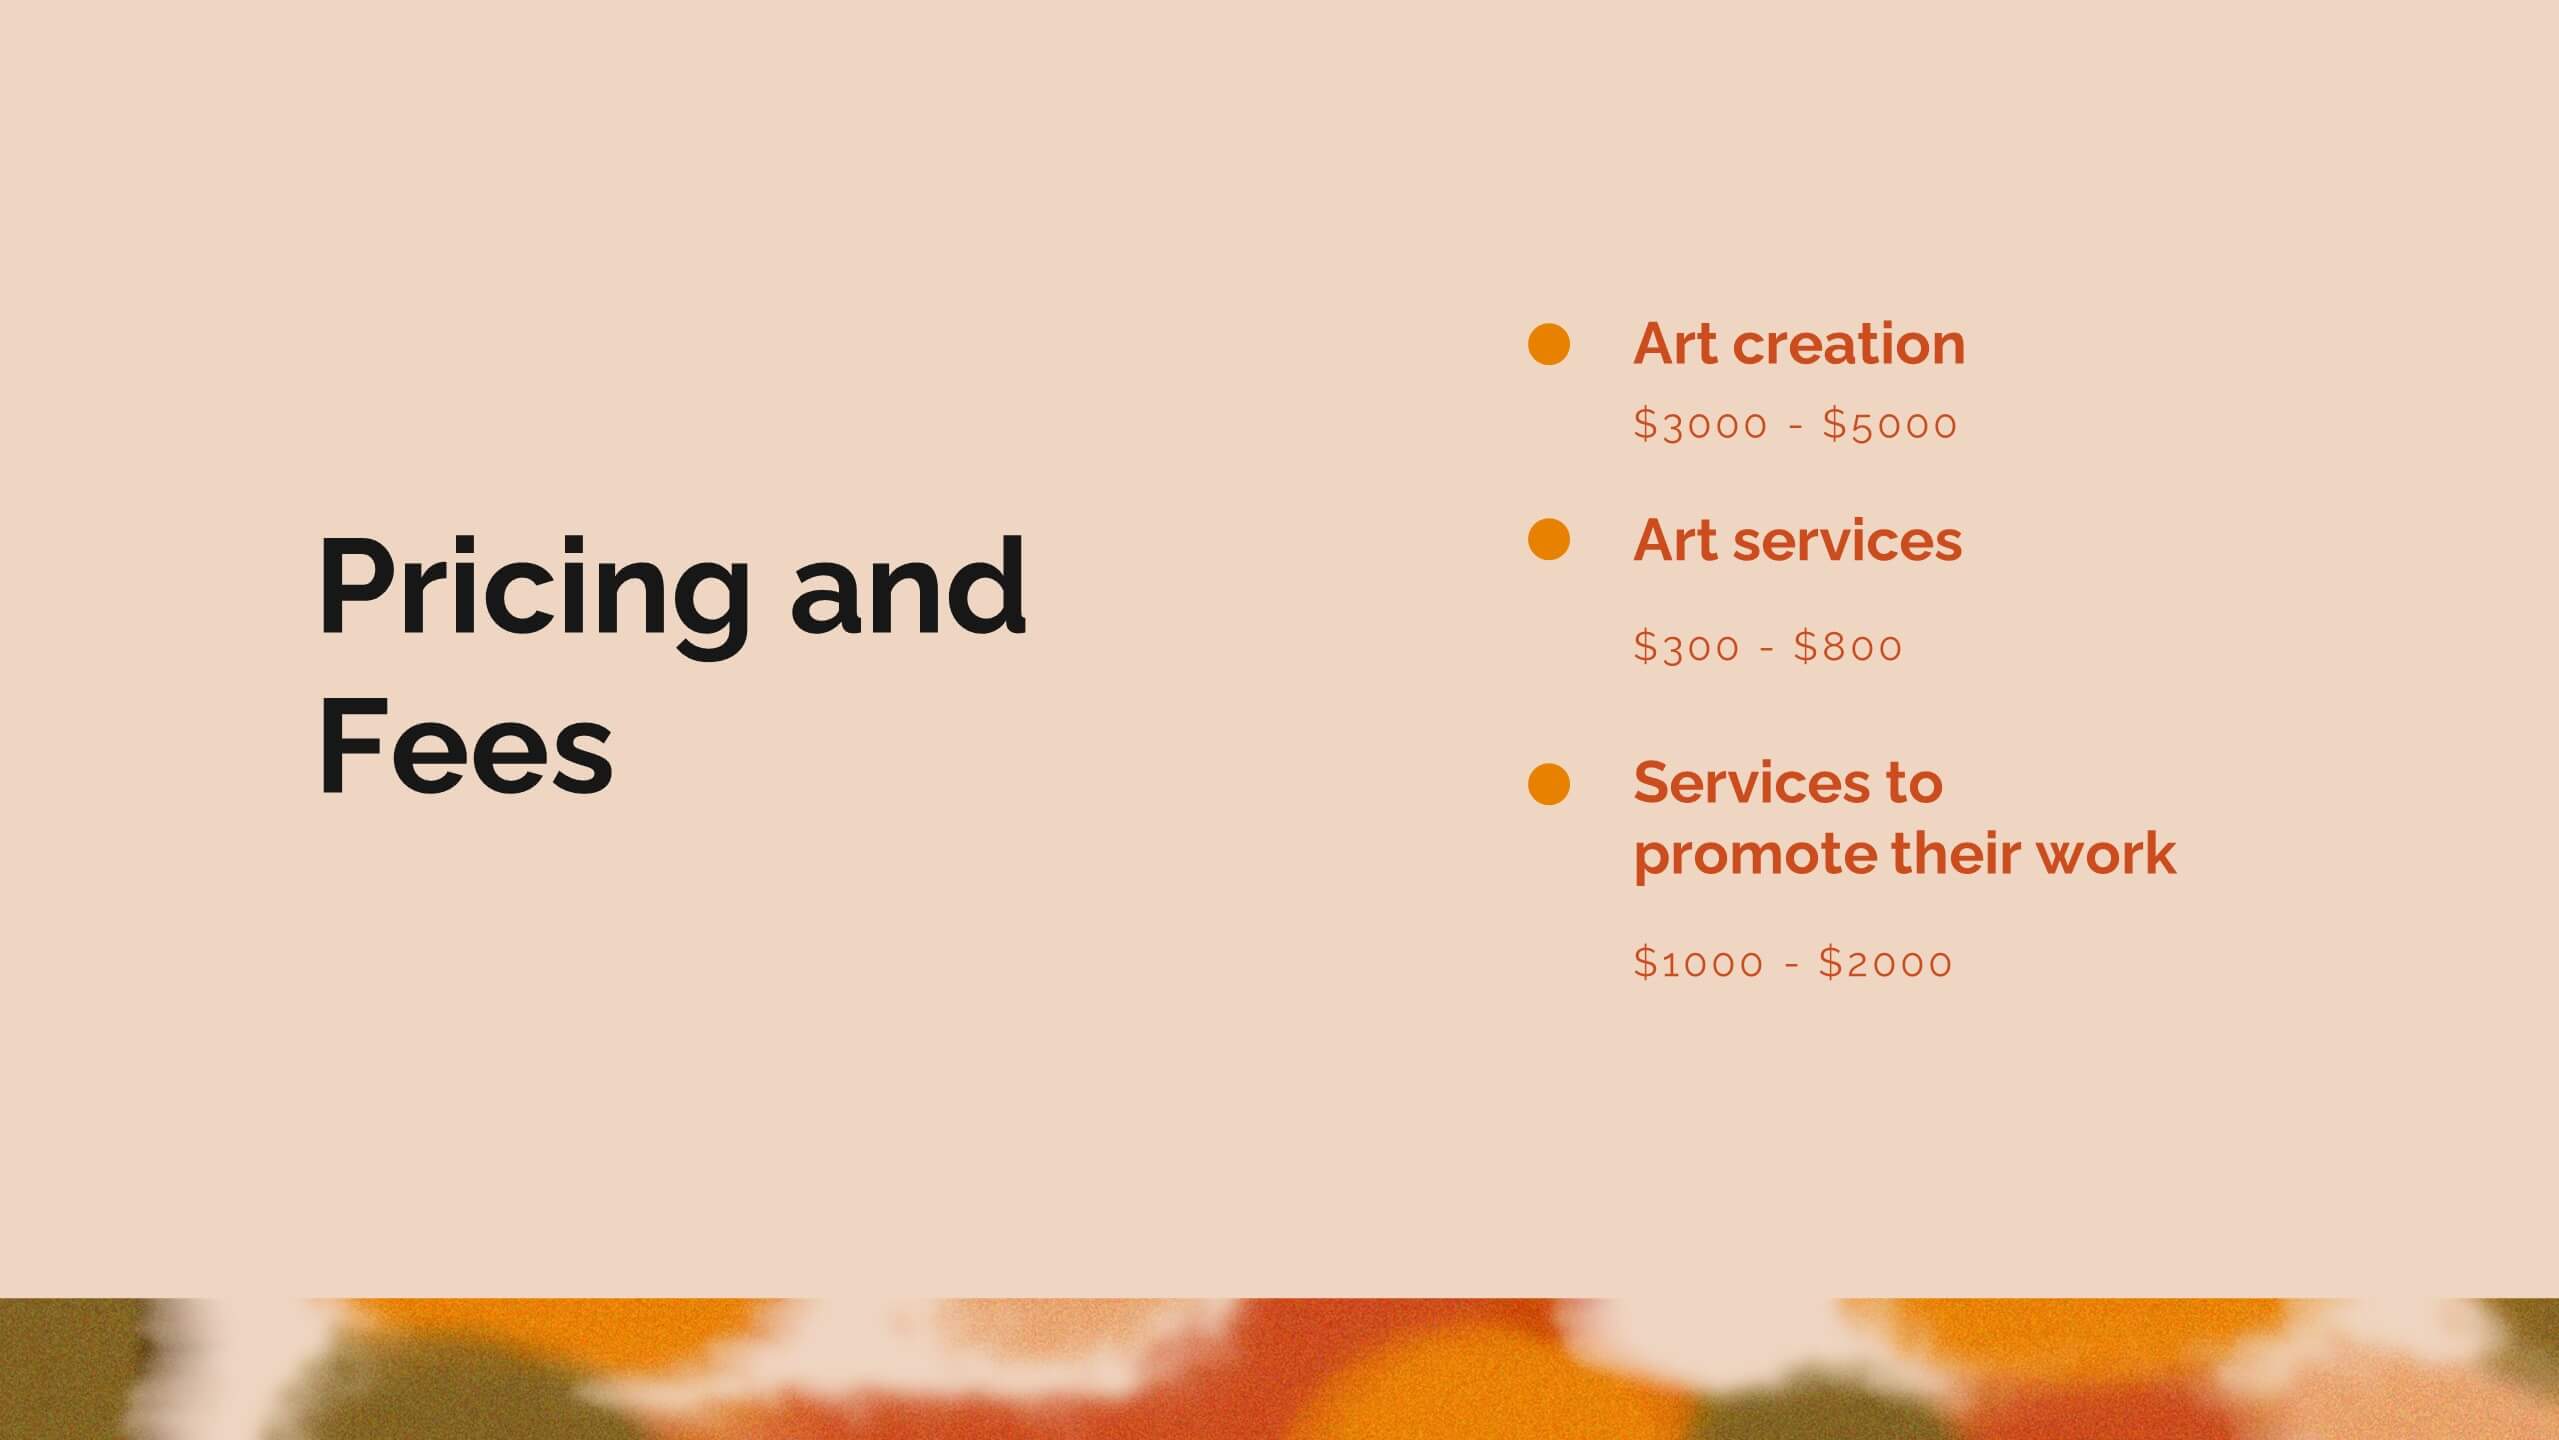
Zenith Artist Portfolio Presentation
Showcase your artistic journey with this captivating portfolio template! Perfect for presenting your projects, creative process, and client testimonials. Ideal for artists aiming to highlight their work and achievements. Compatible with PowerPoint, Keynote, and Google Slides, this template ensures your portfolio is visually stunning and professionally presented. Make your art stand out!


24 slides
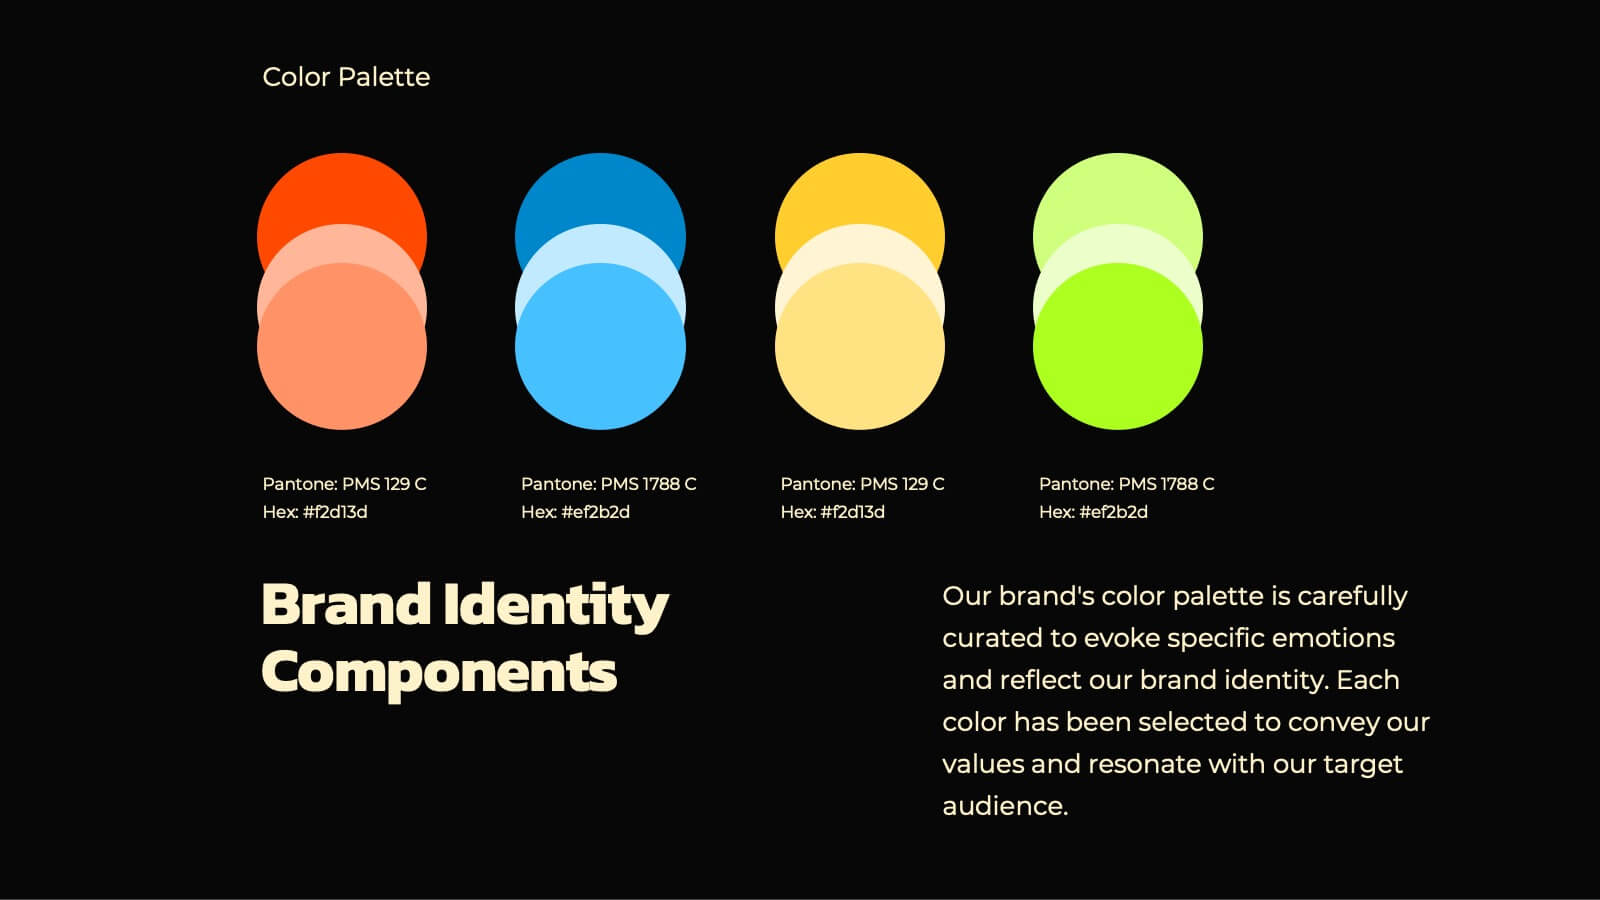
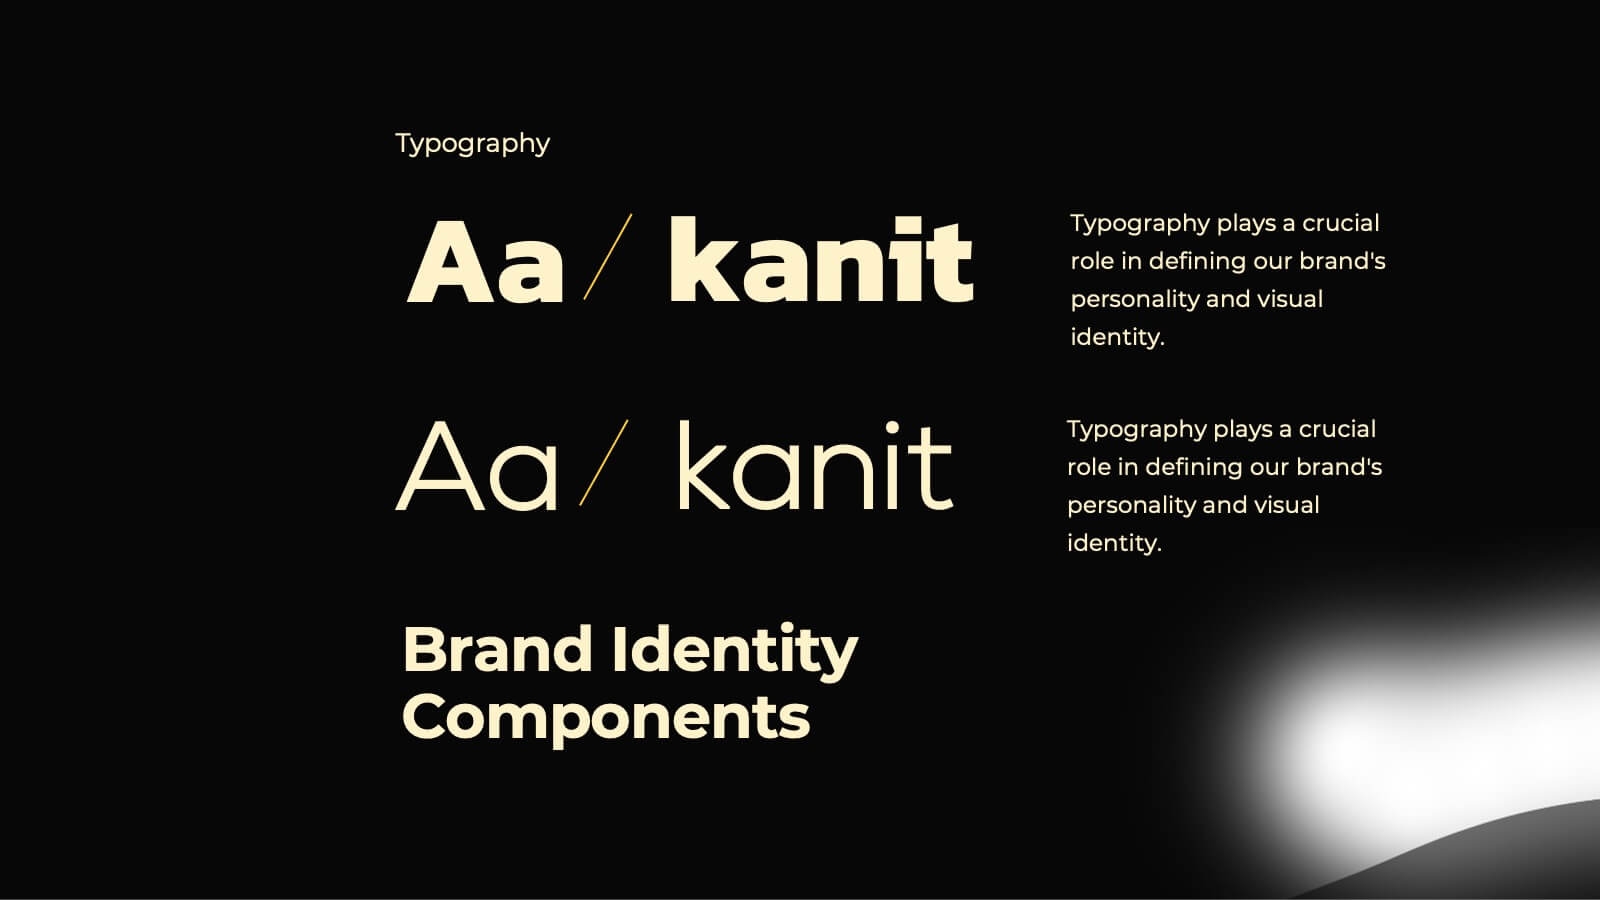
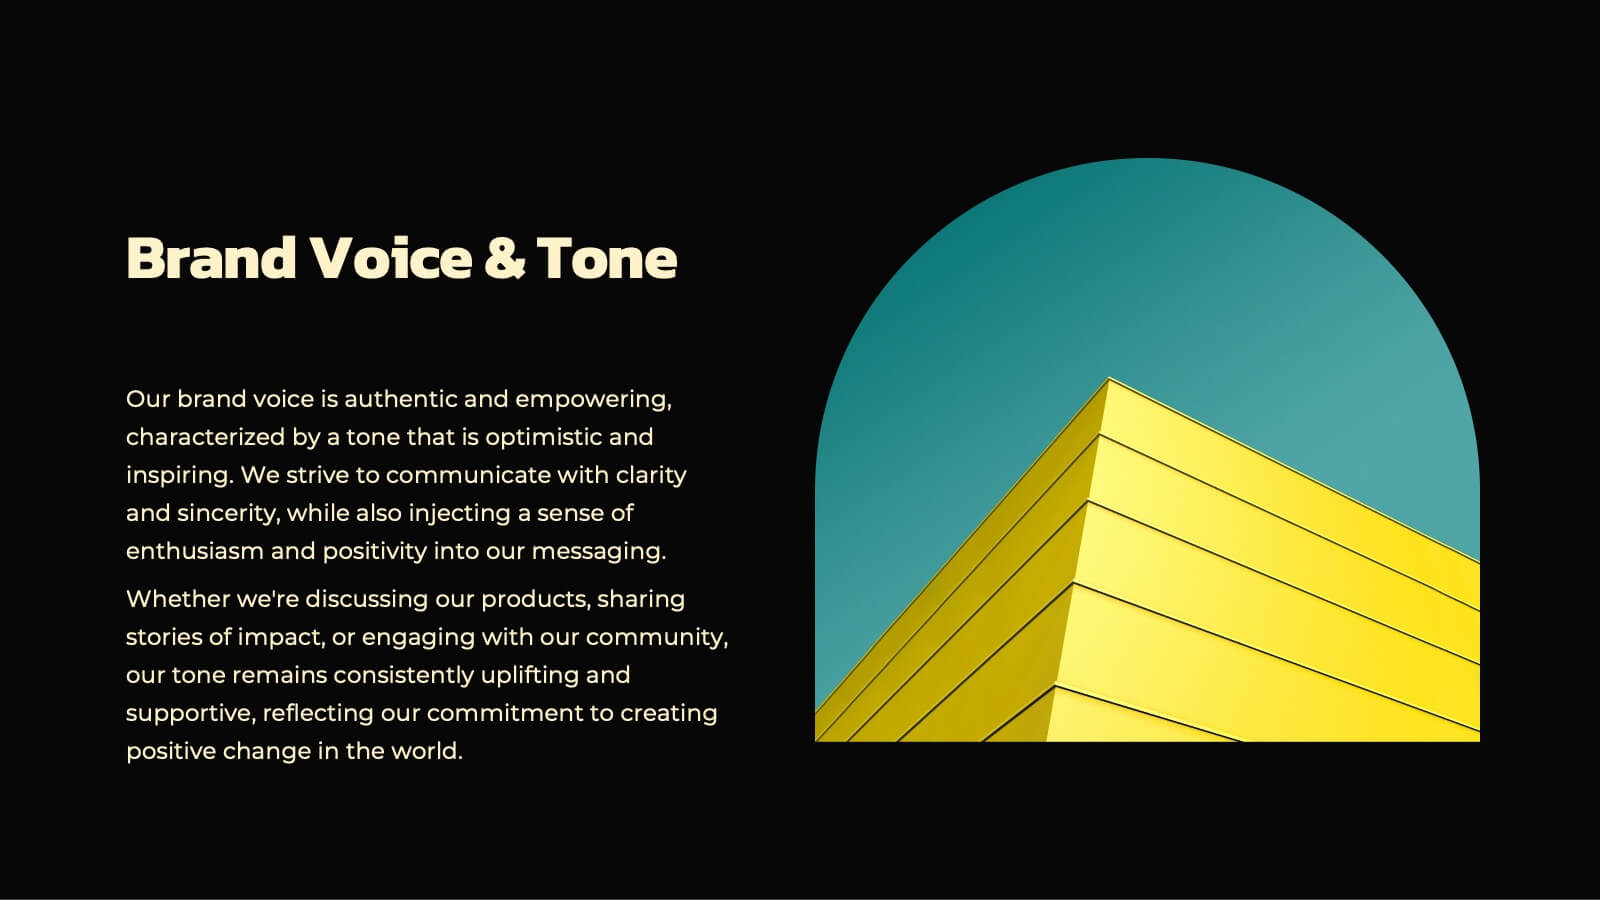
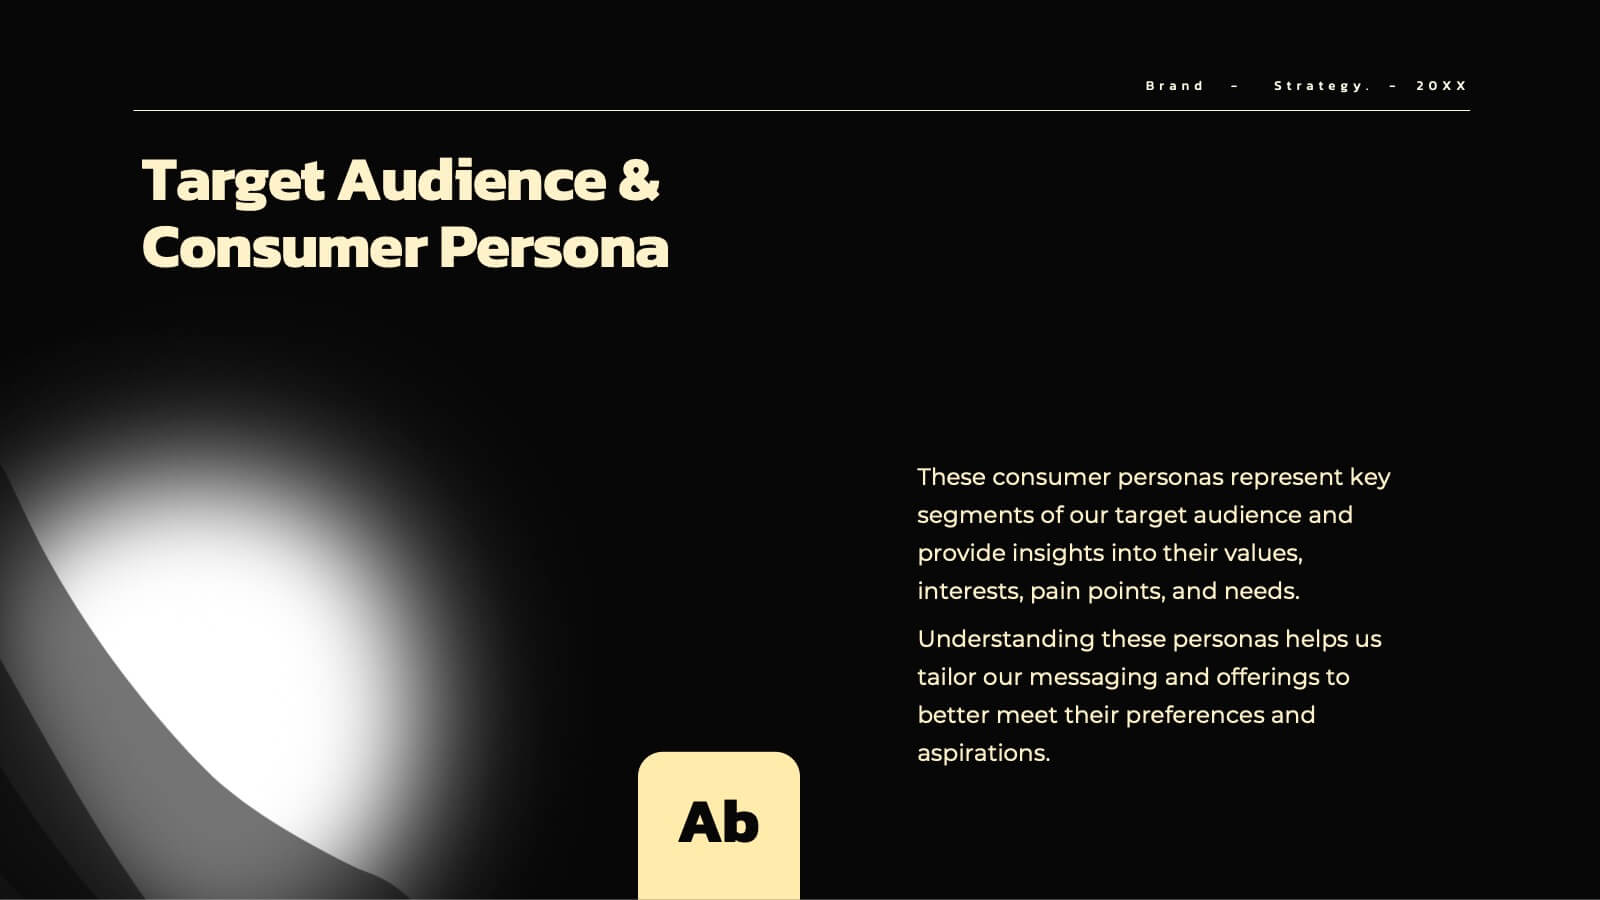
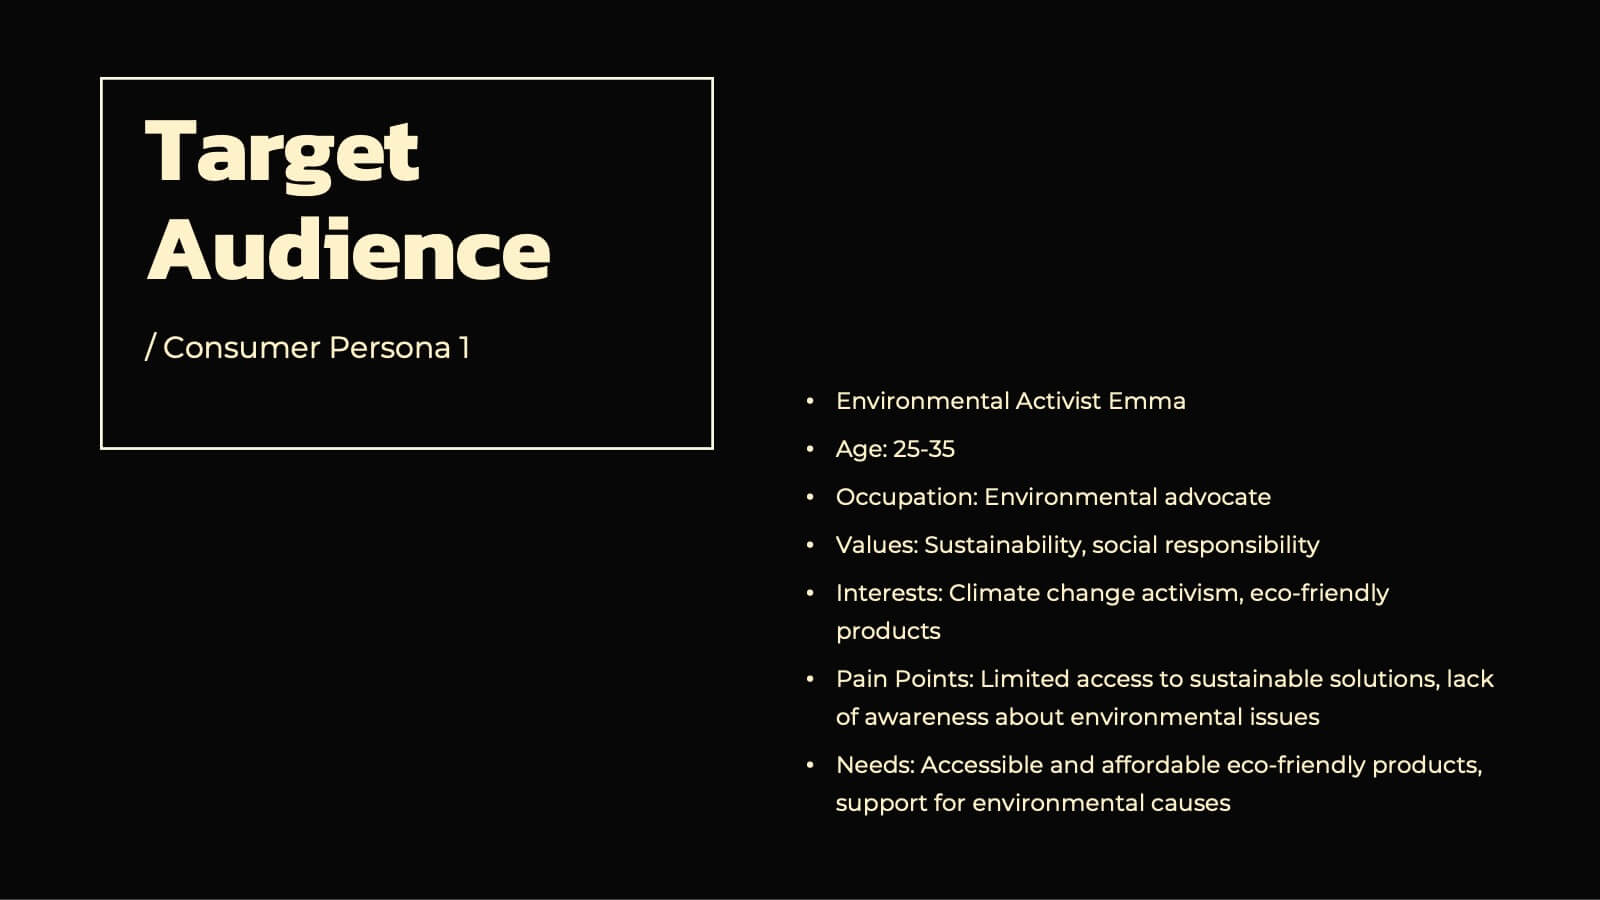
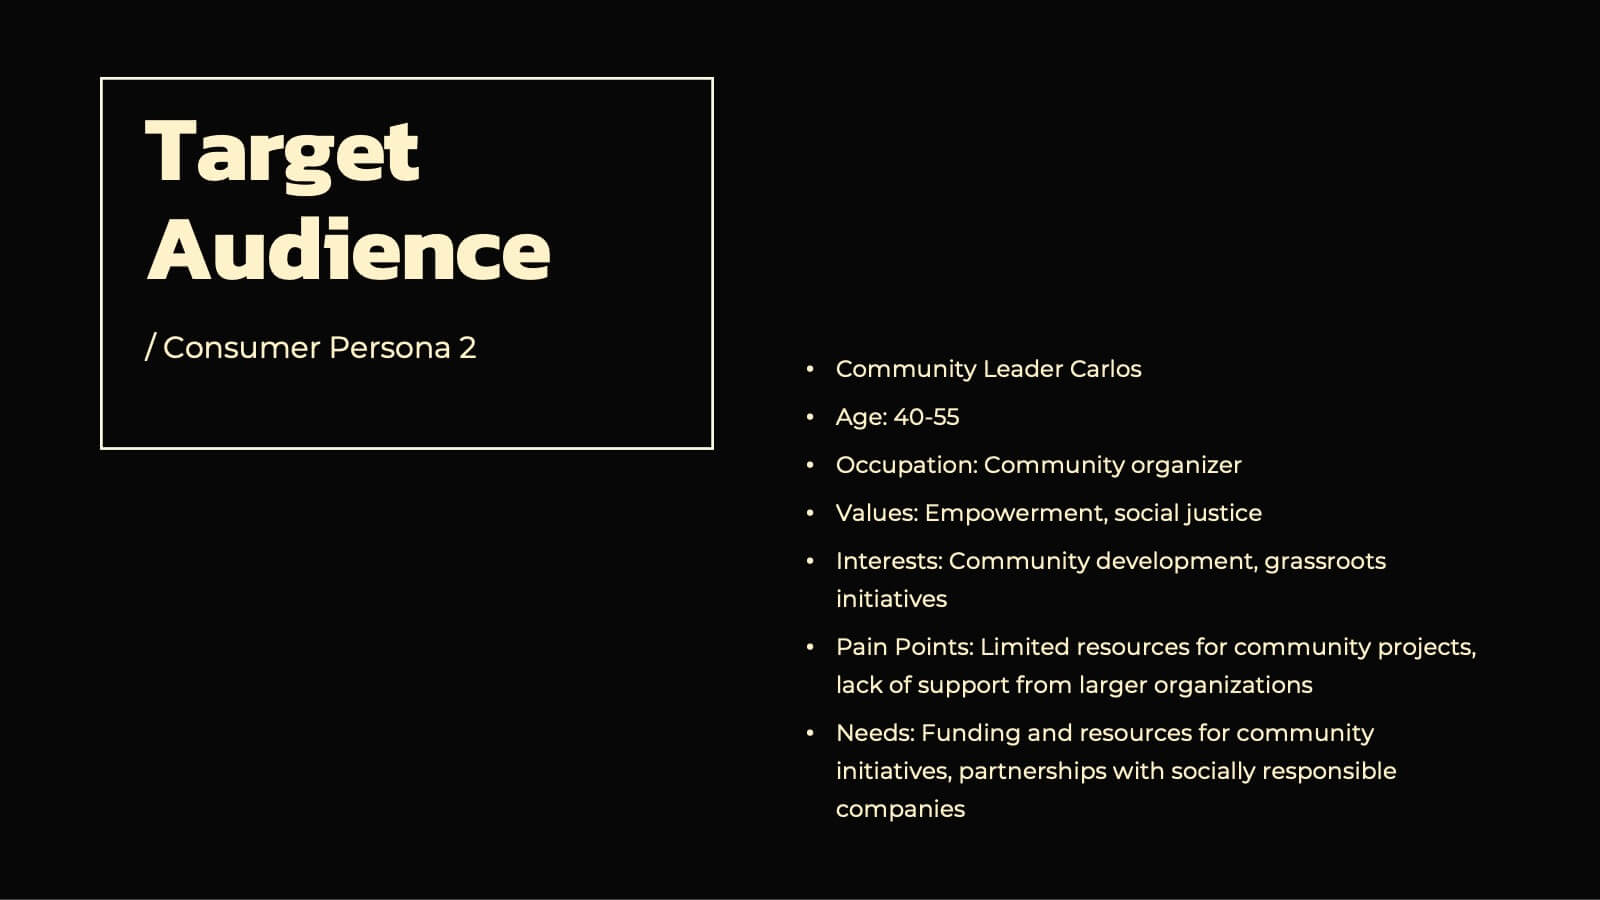
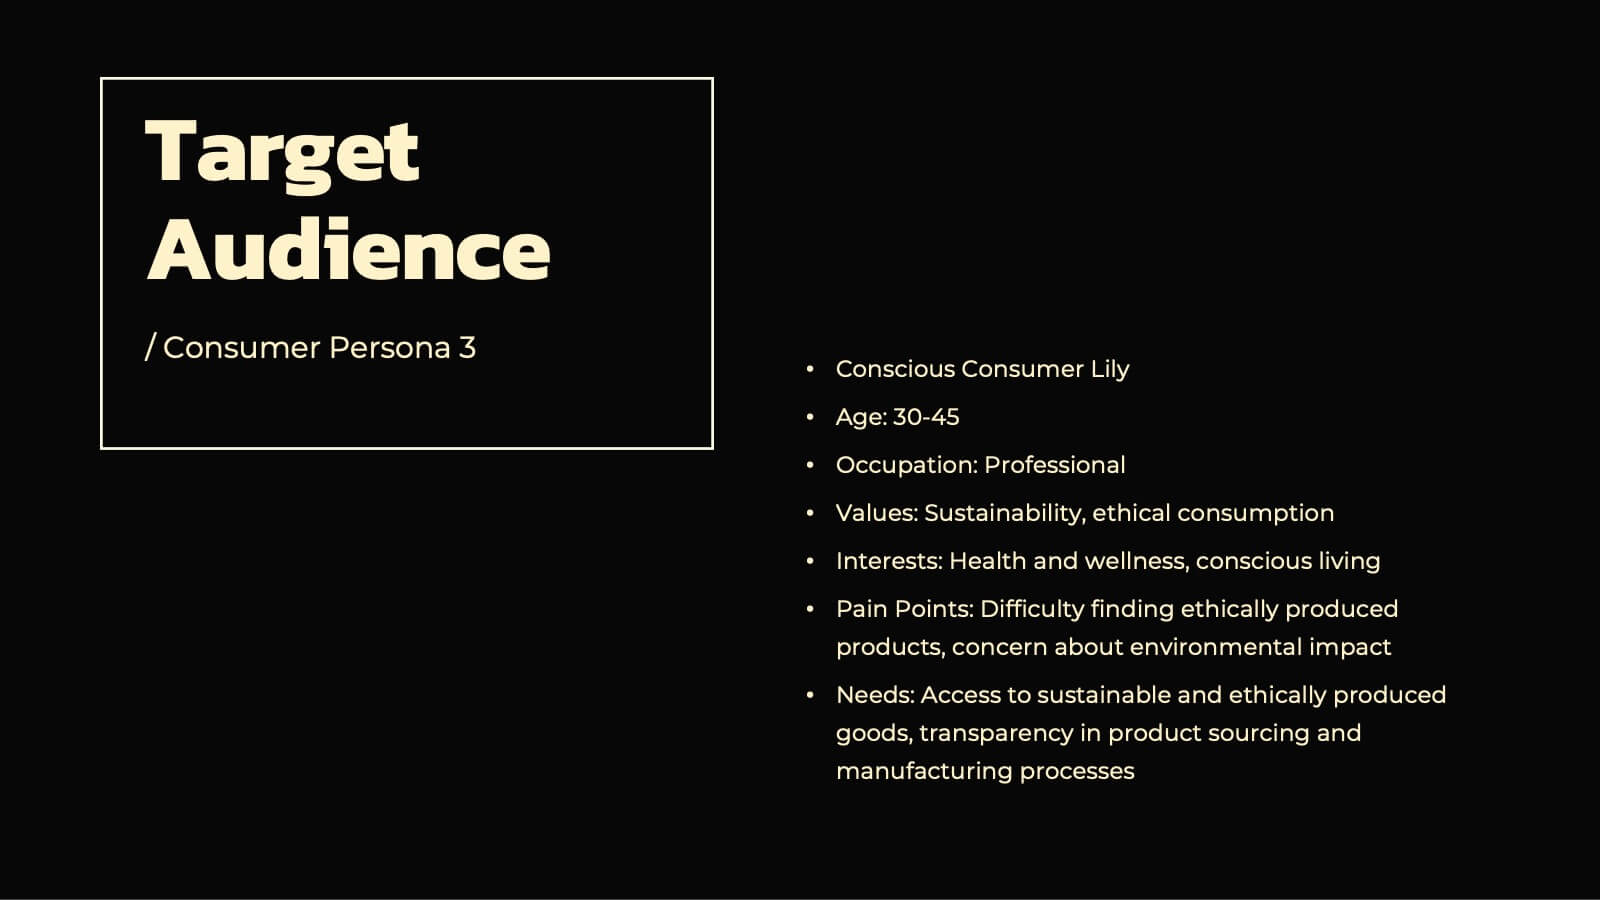
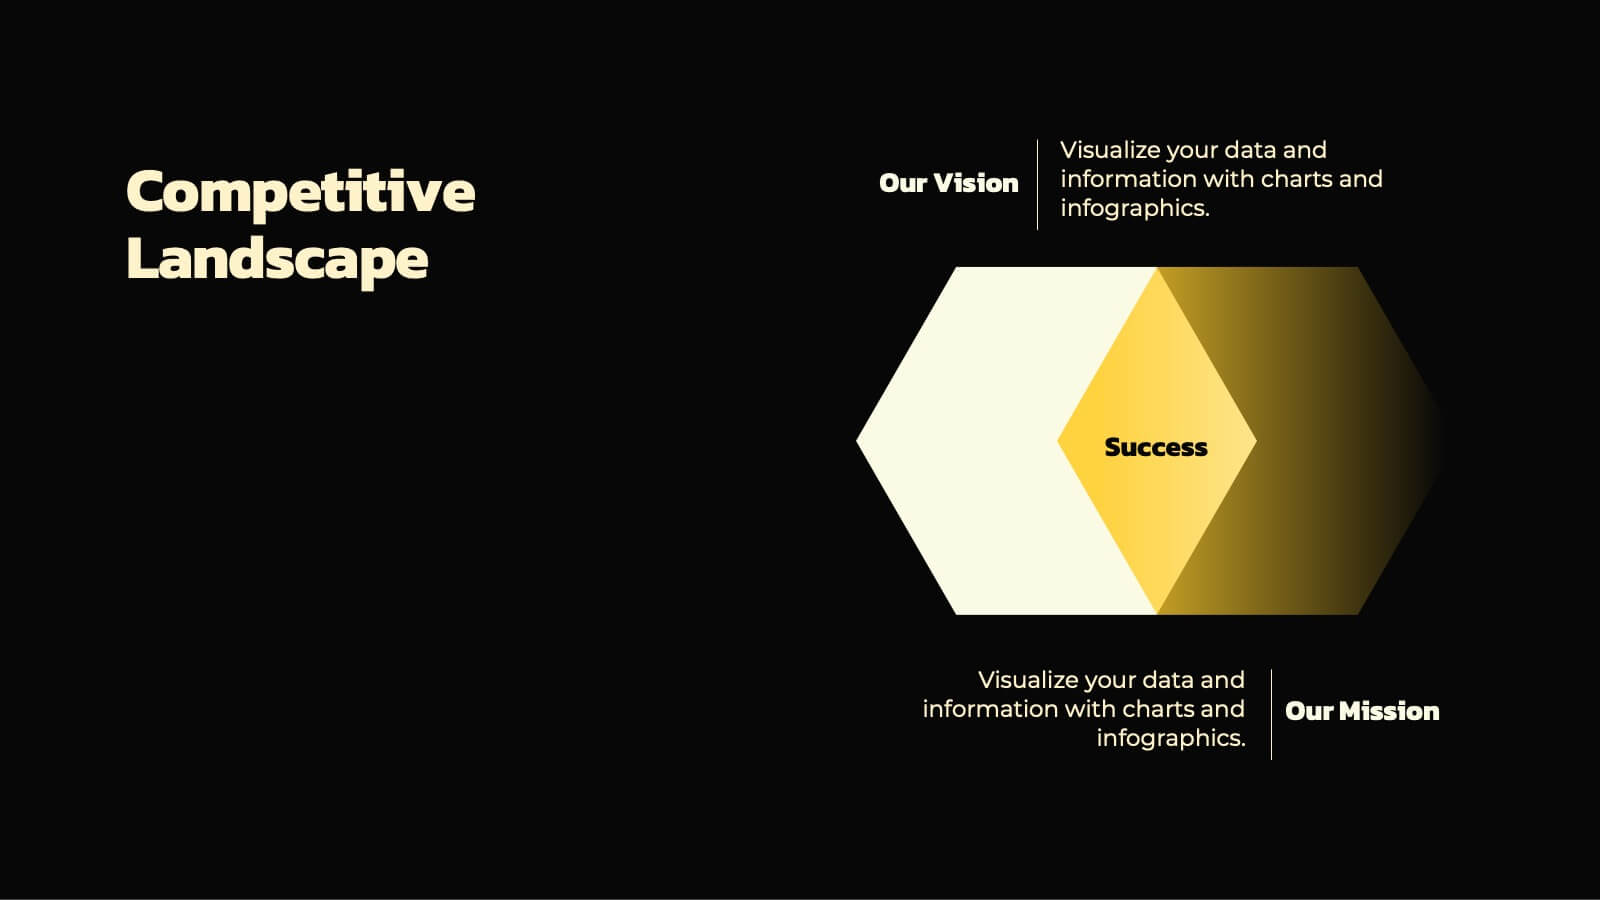
Djinn Brand Identity Presentation
Unleash the power of your brand with this sleek and modern presentation template! From brand identity components to target audience personas, this template covers everything you need to craft a cohesive and compelling brand strategy. Whether showcasing brand guidelines or success stories, it’s designed for maximum clarity and impact. Compatible with PowerPoint, Keynote, and Google Slides for effortless presentations.


6 slides
Eco-Initiatives and Sustainability Efforts Presentation
Highlight your green strategy with the Eco-Initiatives and Sustainability Efforts Presentation. This template features a clean, icon-based layout to showcase up to six key eco-friendly actions or goals. Ideal for CSR reports, environmental planning, or internal sustainability updates. Fully editable in PowerPoint, Google Slides, and Canva.


5 slides
Venn Diagram Comparison Slide Presentation
Bring clarity to your ideas with a layered visual that makes comparing multiple concepts feel effortless and engaging. This presentation helps you highlight differences, similarities, and key insights using clean shapes and simple labels. Fully customizable and compatible with PowerPoint, Keynote, and Google Slides.


4 slides
Lean Startup Business Model Presentation
Optimize your startup strategy with the Lean Startup Business Model Presentation. This fully customizable template simplifies key business components, including funding sources, revenue models, growth strategies, and value propositions. Designed for entrepreneurs, investors, and business analysts, this layout is available for PowerPoint, Keynote, and Google Slides, ensuring a professional, structured, and impactful presentation.


7 slides
Social Media Marketing Infographic
Social Media Marketing refers to the use of social media platforms and networks to promote a product, service, or brand. This fully editable, infographic template looks great on all devices and contains all complete set of slides shown above. You can use this colorful infographic to features tips on how to use social media posts, videos, chats and websites along with a brief explanation of each. Add your logo, banner images and call to action. The template is compatible with Powerpoint, Keynote and Google Slides, so you can easily add in your custom data for a professional finish.


6 slides
Artificial Intelligence Stocks Infographics
Our "Artificial Intelligence Stocks" infographic template, ideal for PowerPoint, Keynote, and Google Slides, is tailored for financial analysts, investors, and tech enthusiasts. This template seamlessly blends technology and finance, focusing on AI stocks and investment trends. This futuristic design includes elements such as AI technology trends, stock market performance, and investment opportunities. It’s an invaluable tool for presenting complex financial and technological data in a clear and visually appealing manner. The template is perfect for conveying intricate investment strategies and market insights related to the burgeoning AI sector. The template features a cutting-edge design with a color scheme that blends shades of blue and gray, symbolizing innovation and financial growth. It’s designed to make your presentation not only informative but also visually engaging. Whether used in investor meetings, tech conferences, or educational seminars, this template ensures your insights on AI stocks are presented with clarity and sophistication.