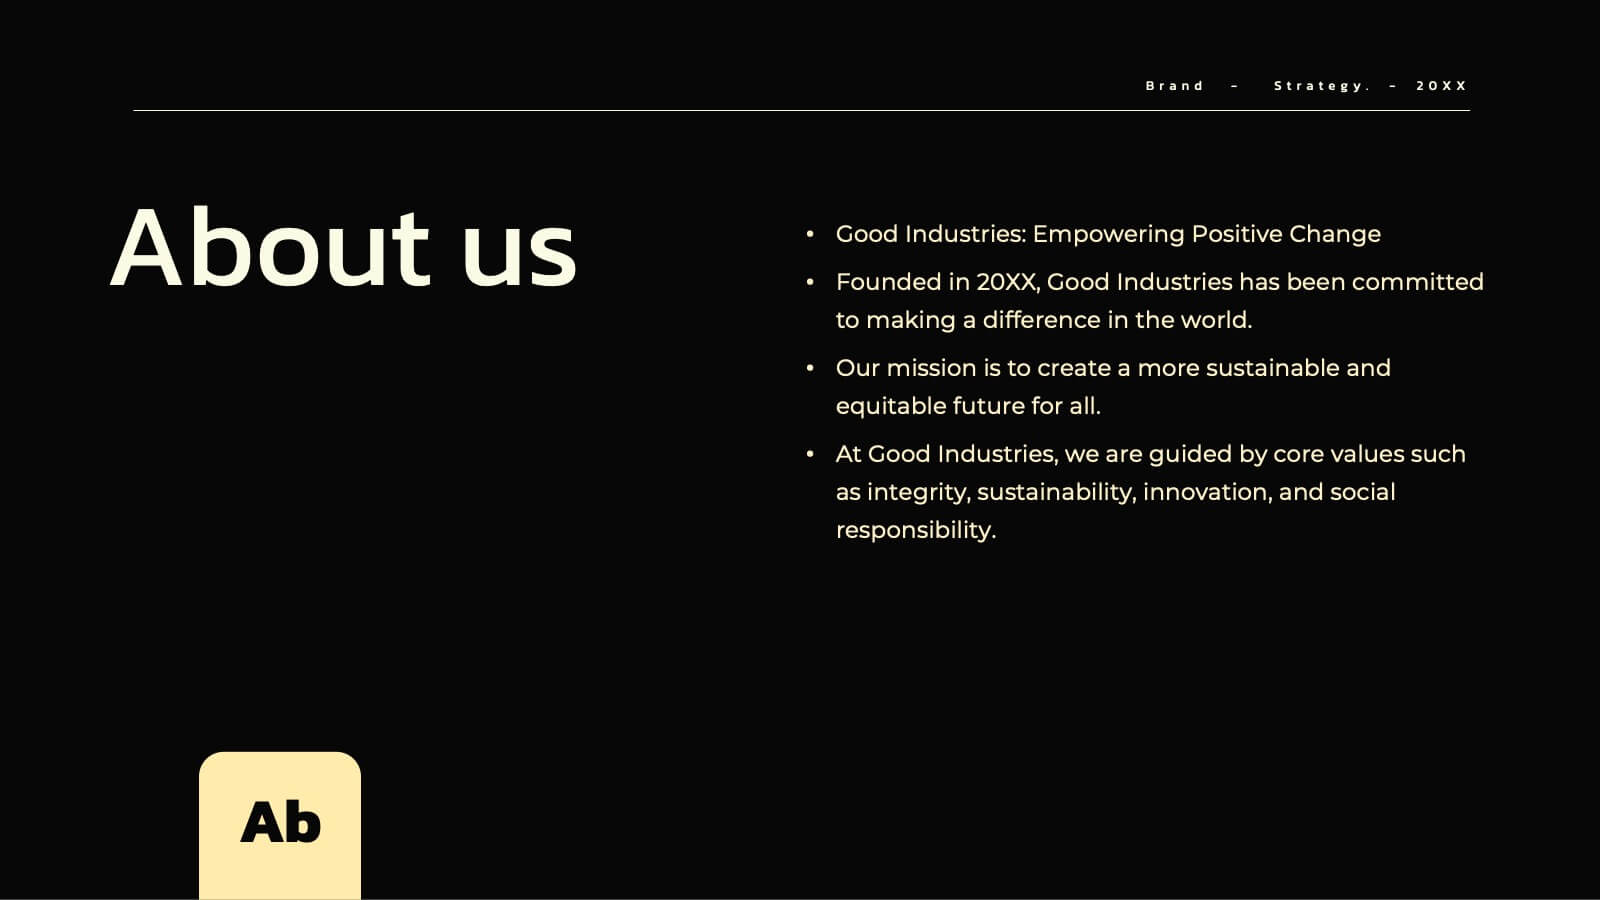
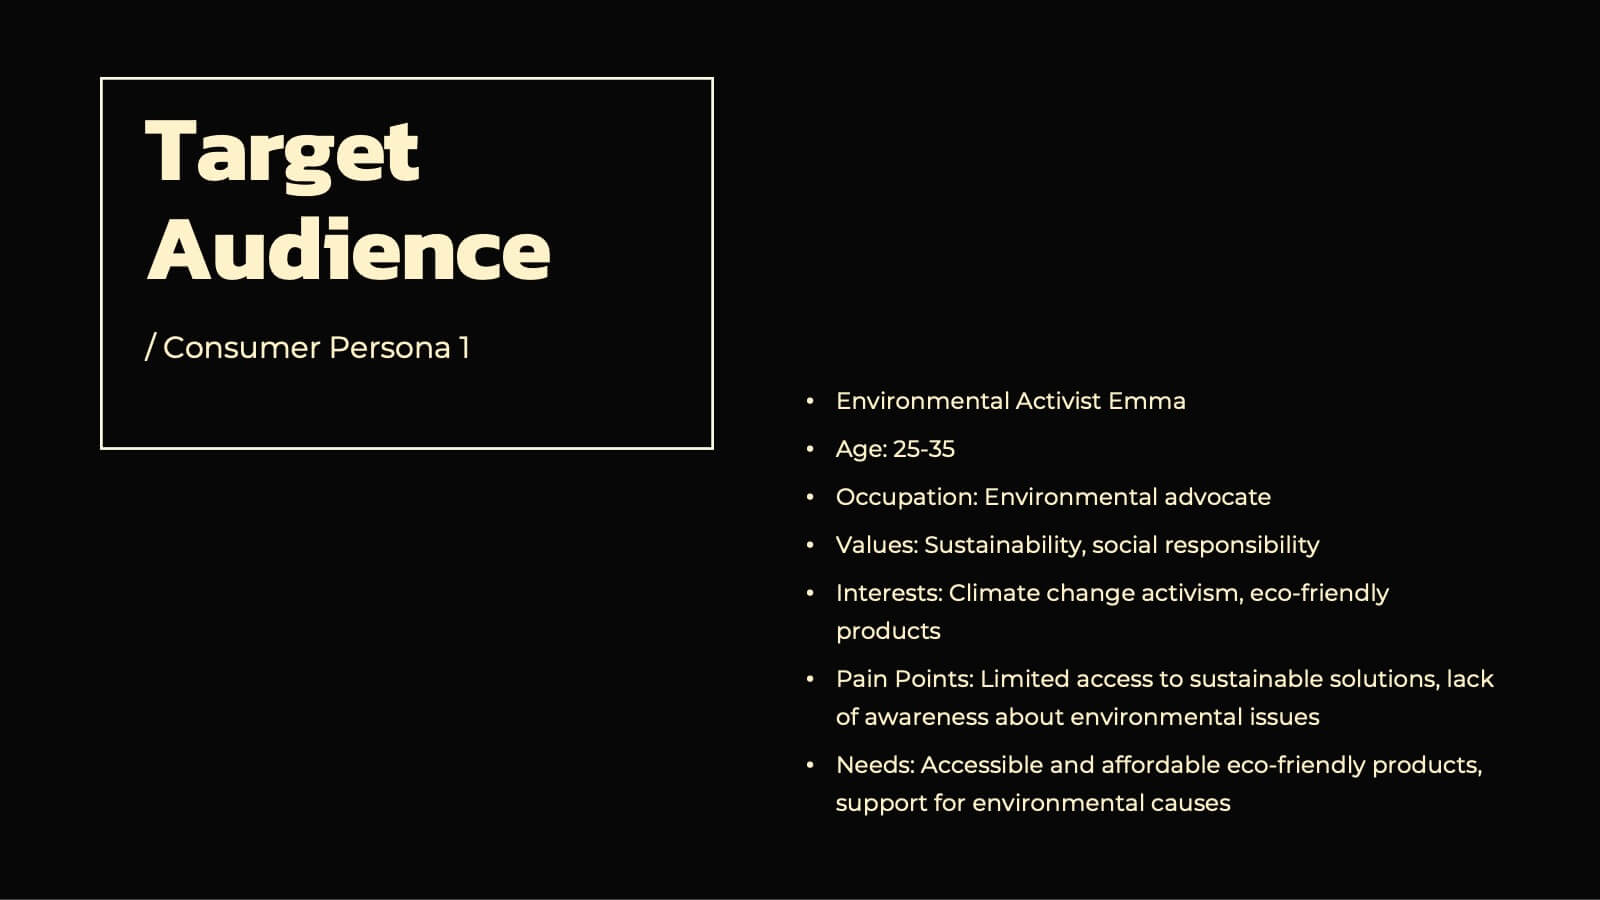
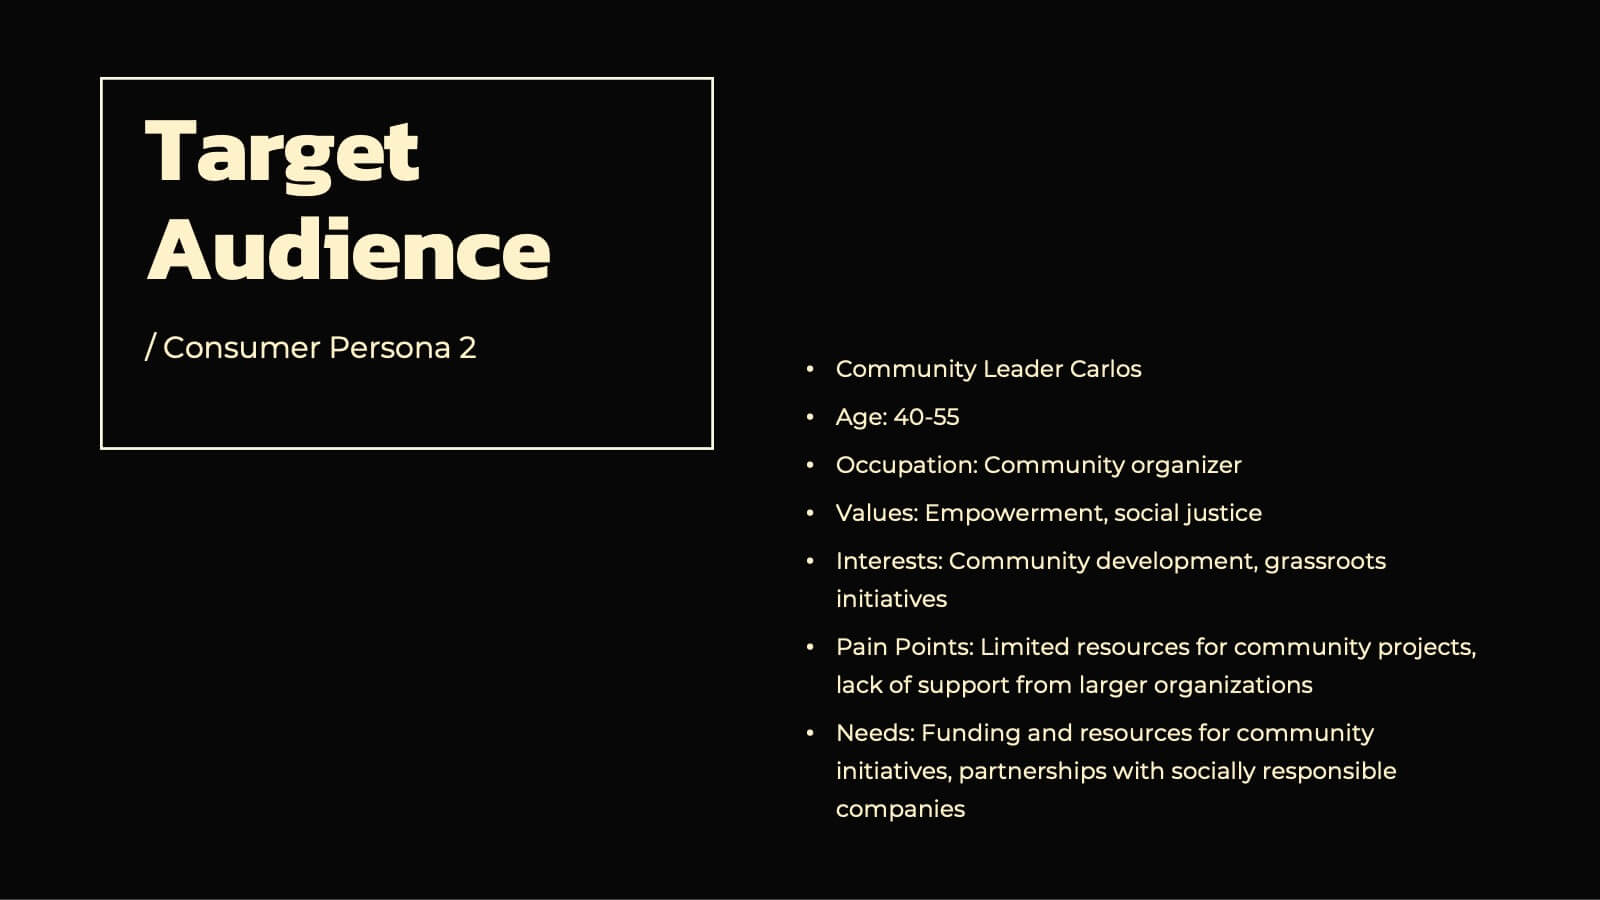
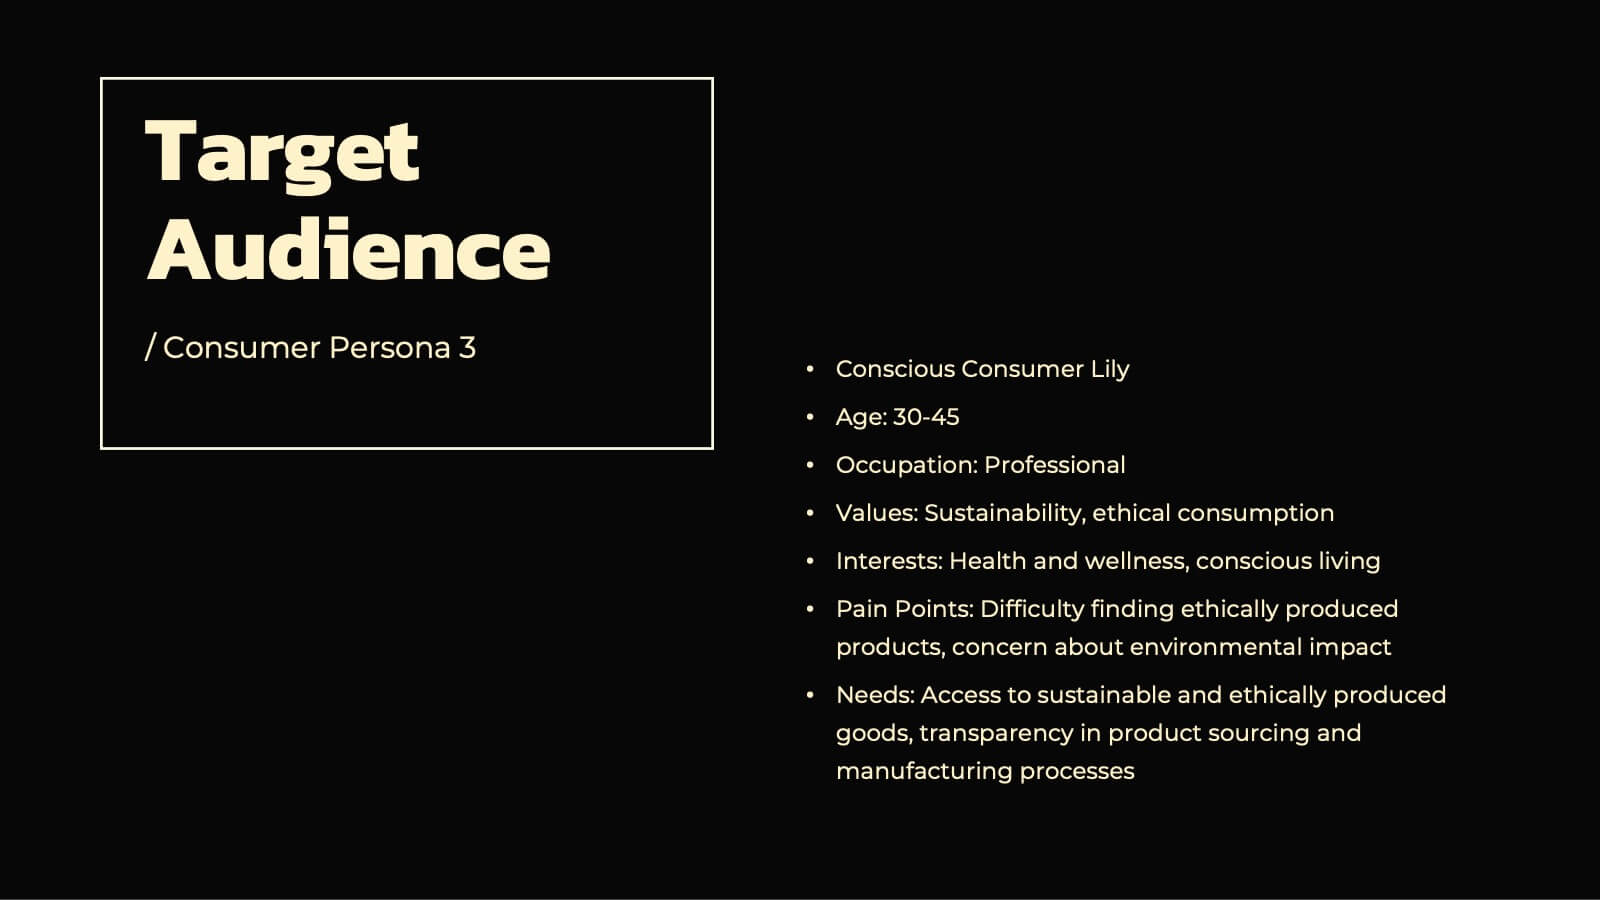
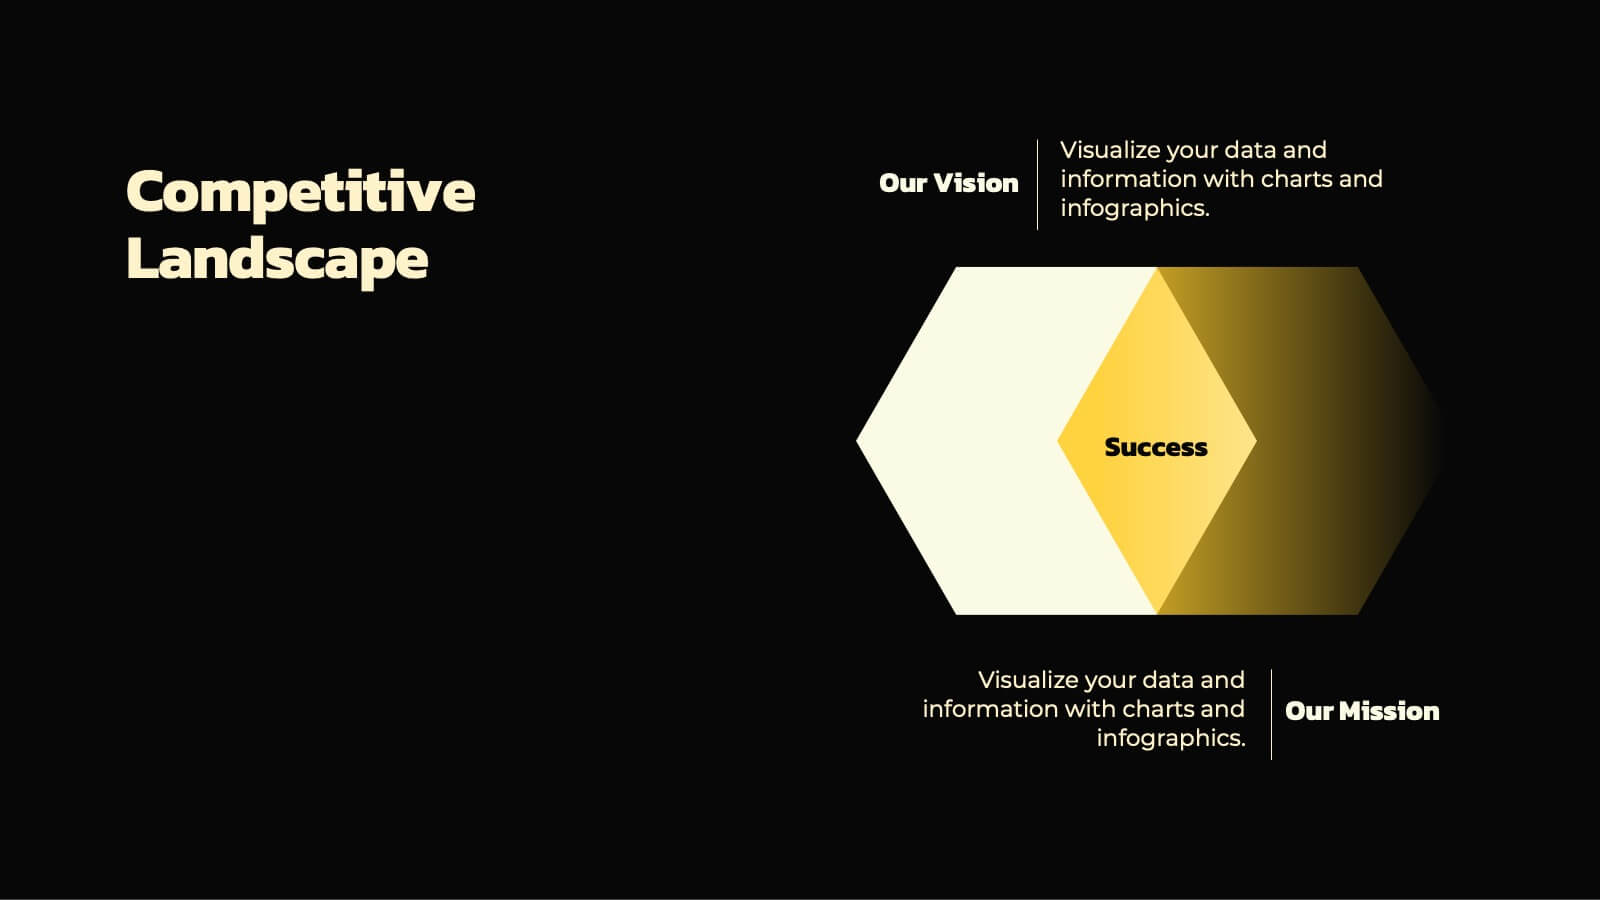
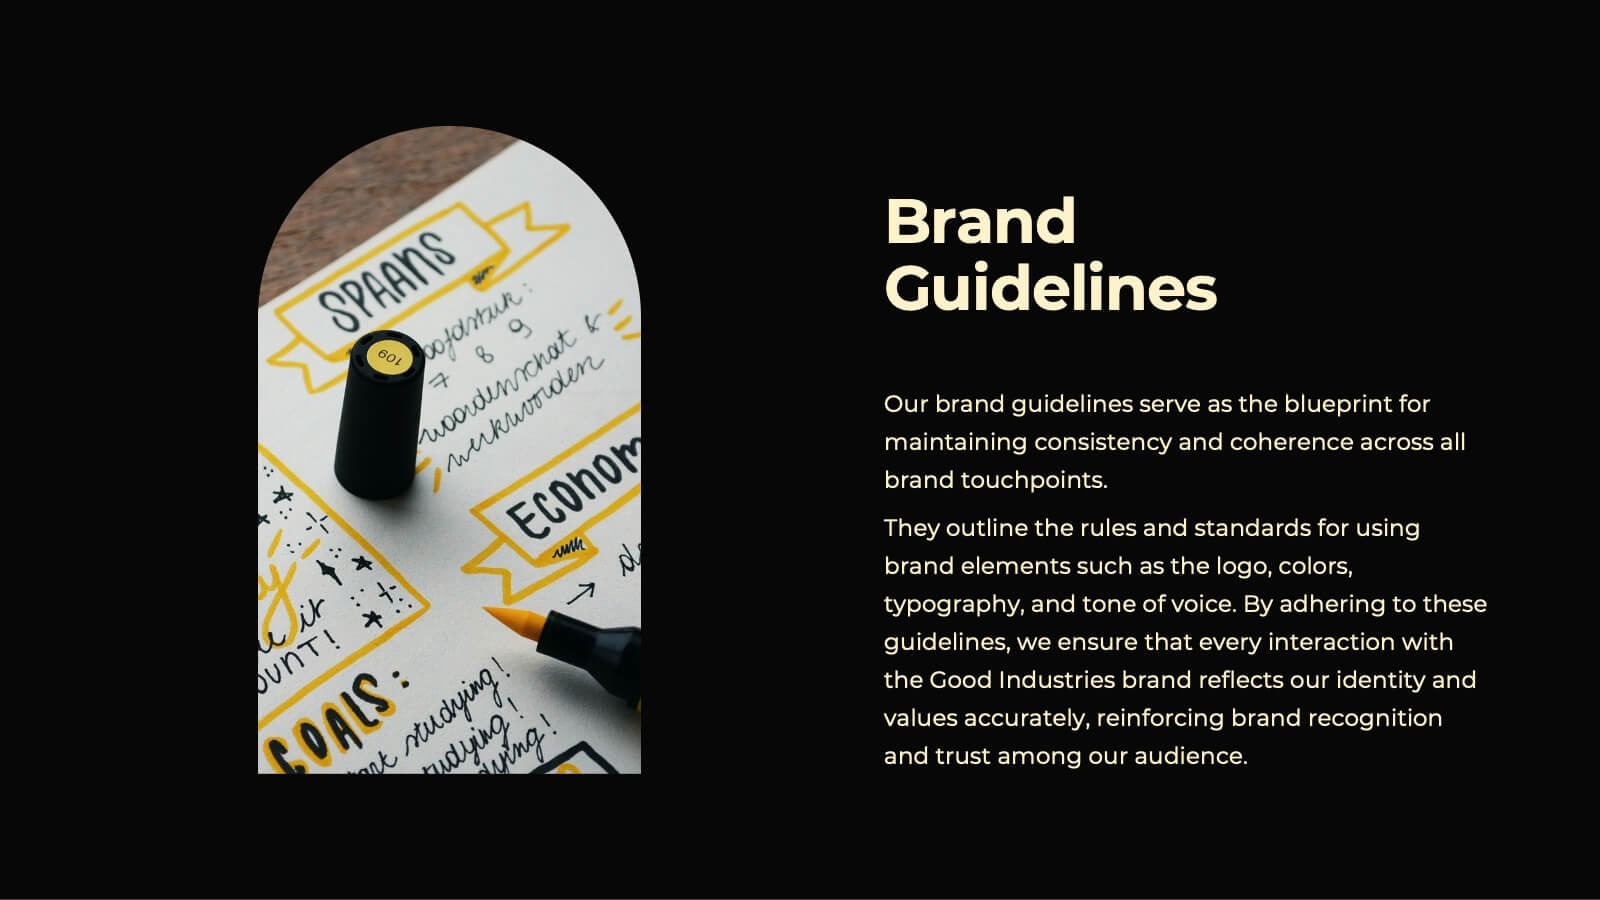
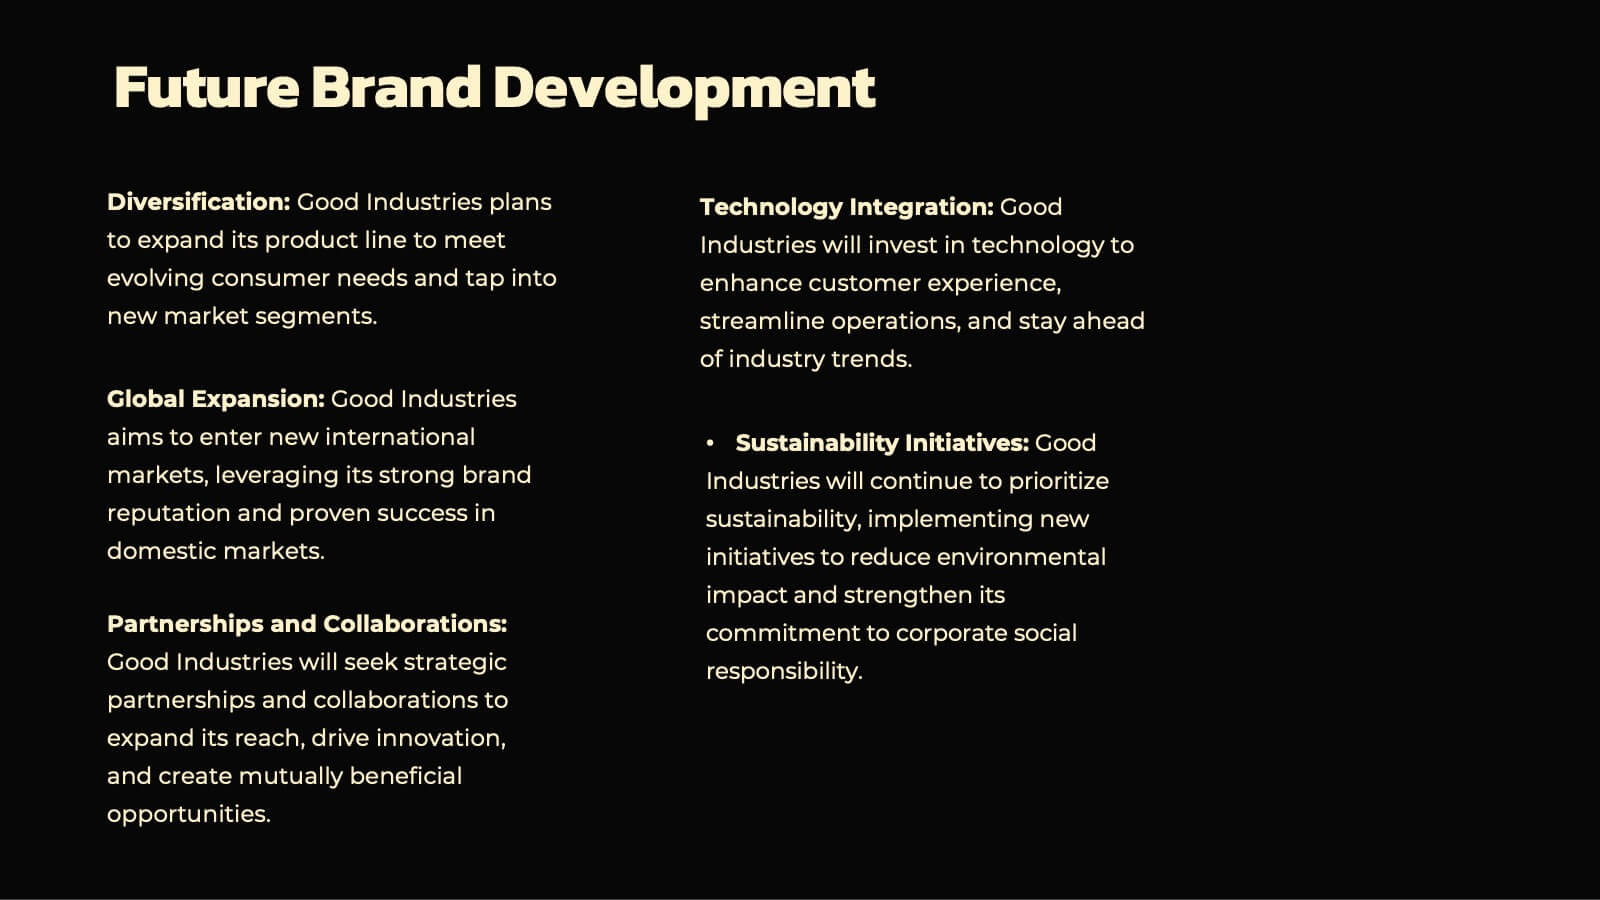
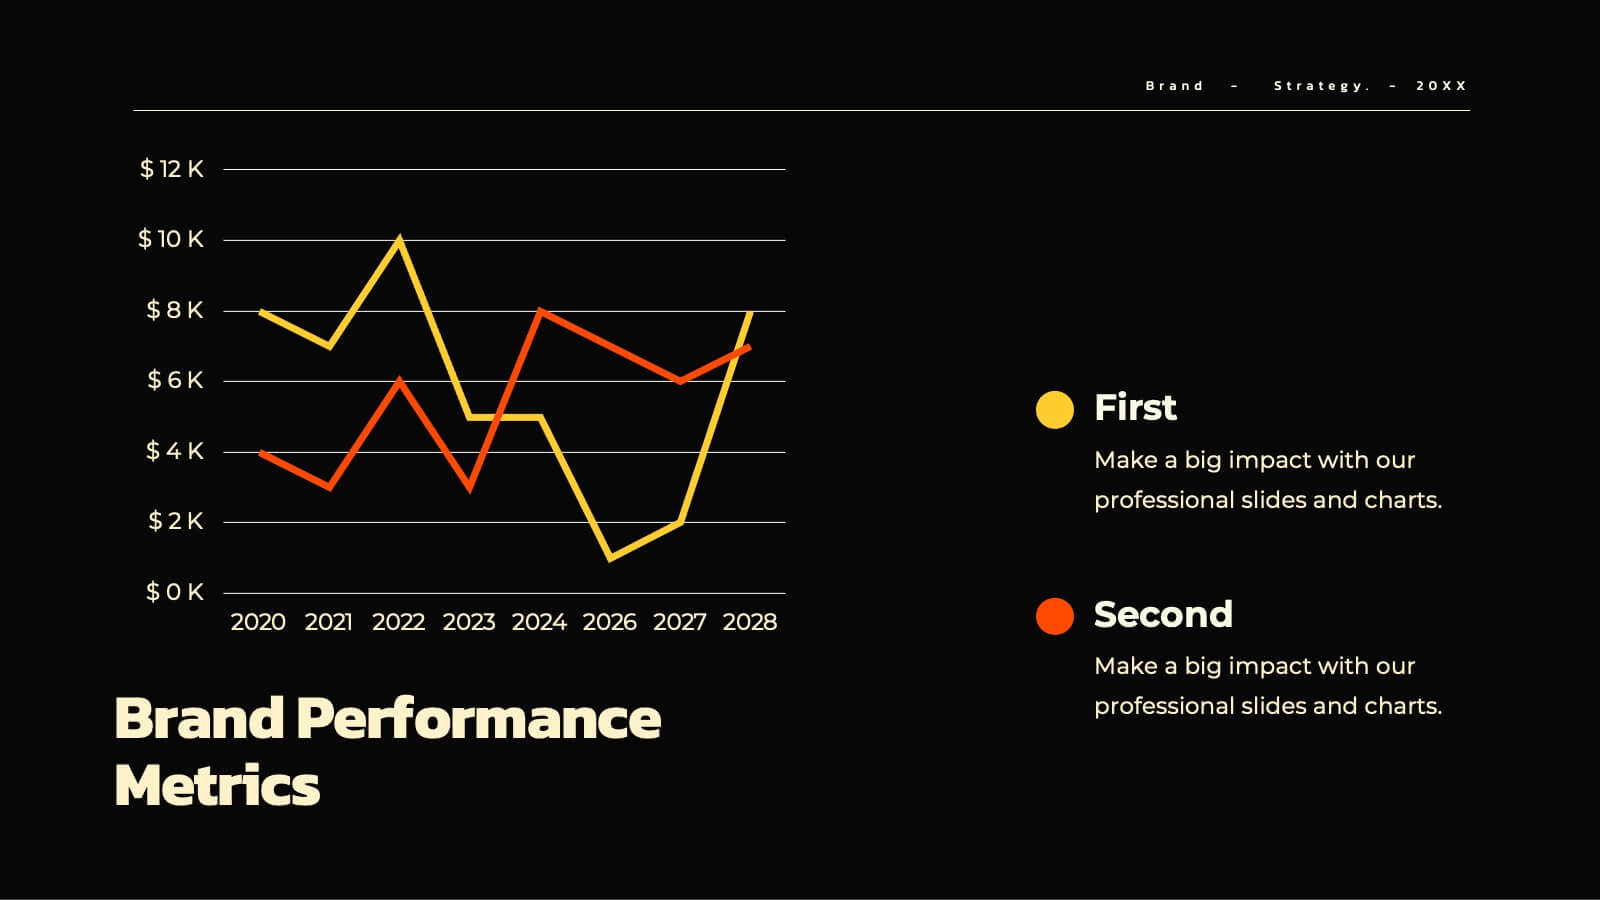
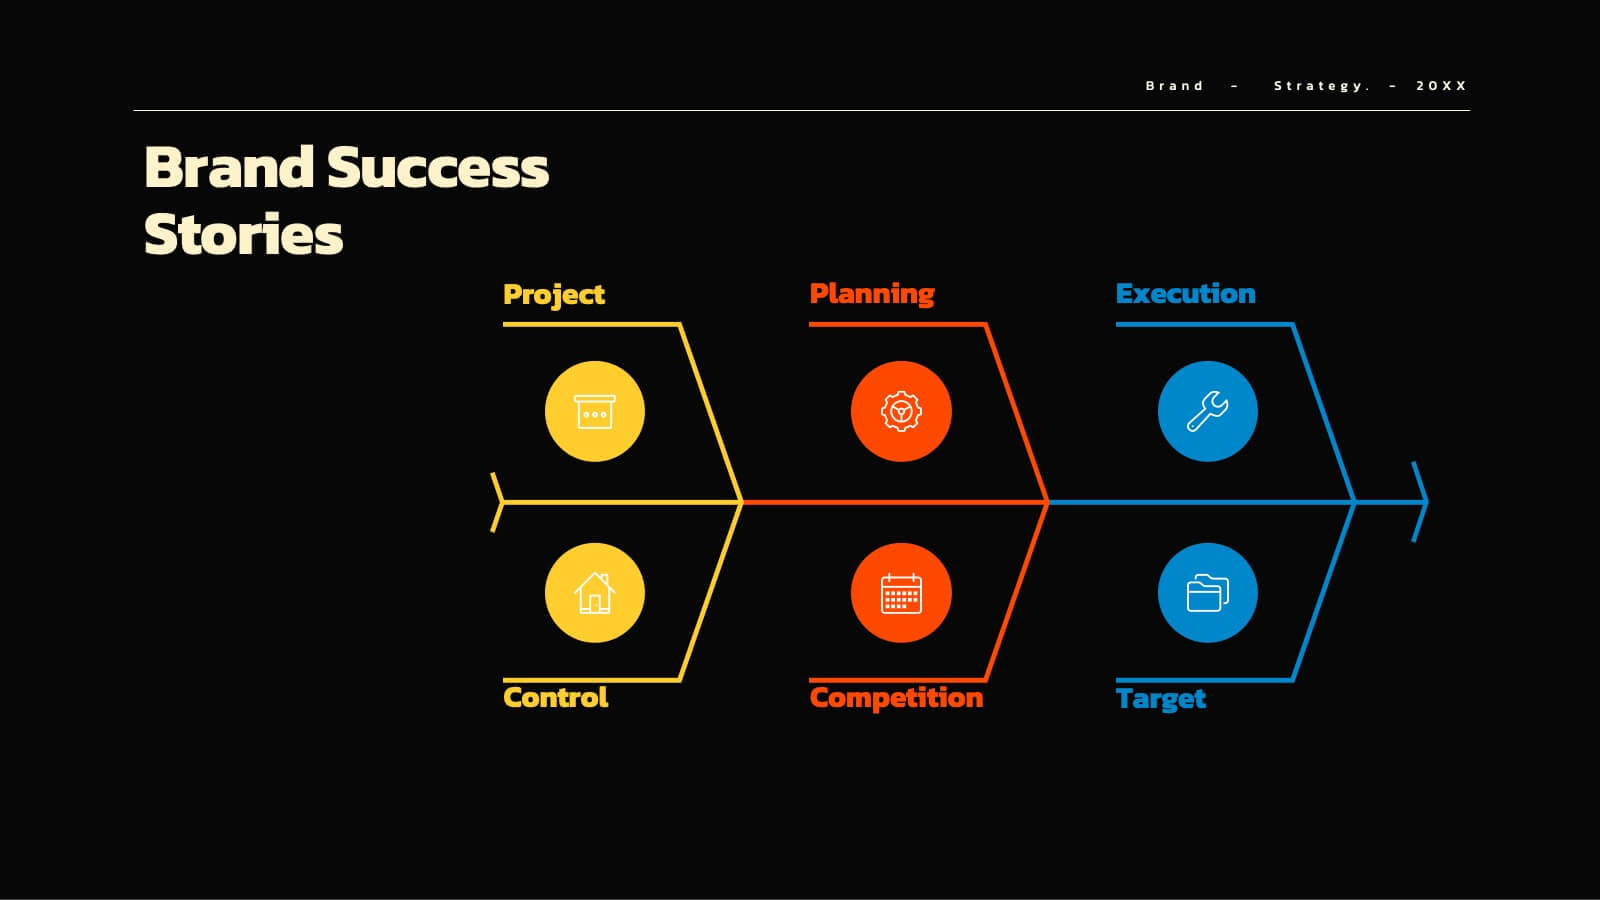
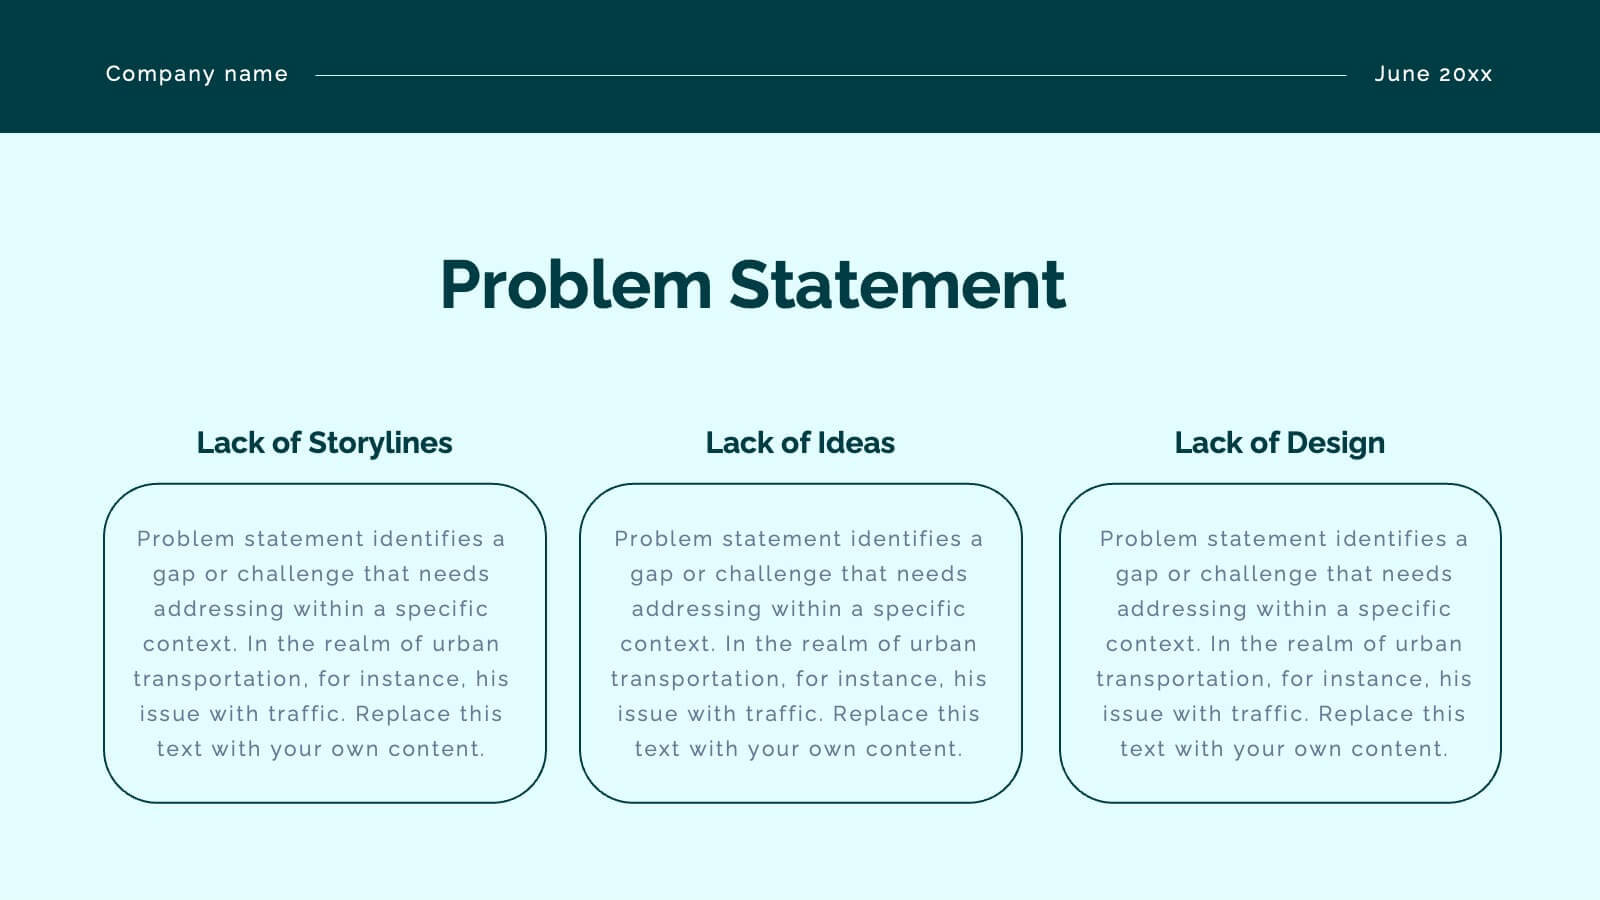
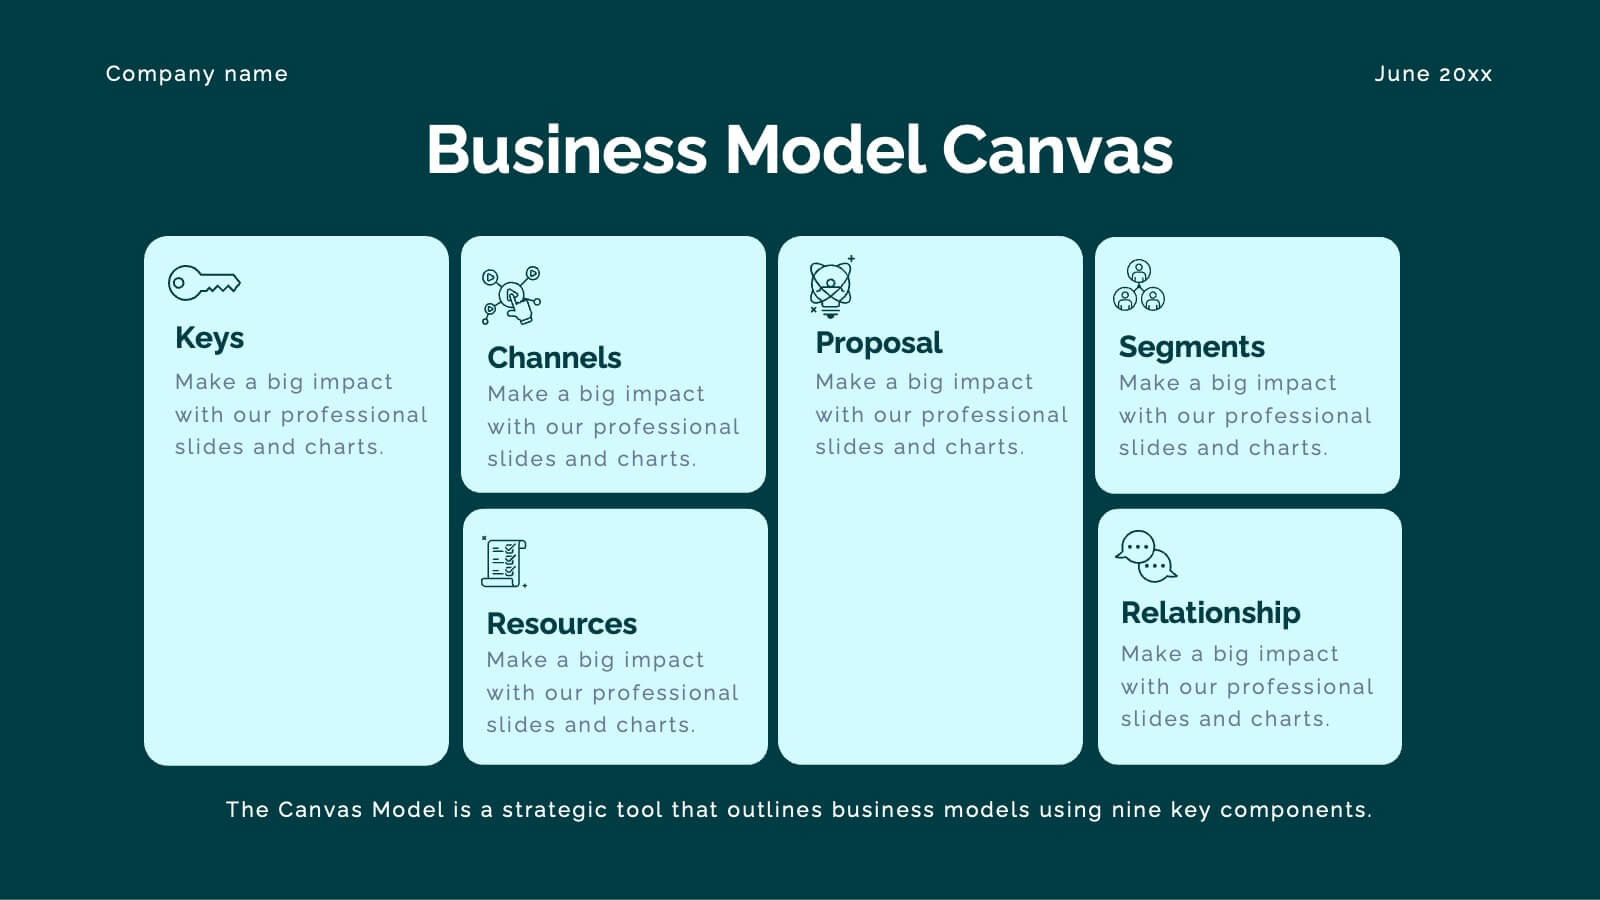
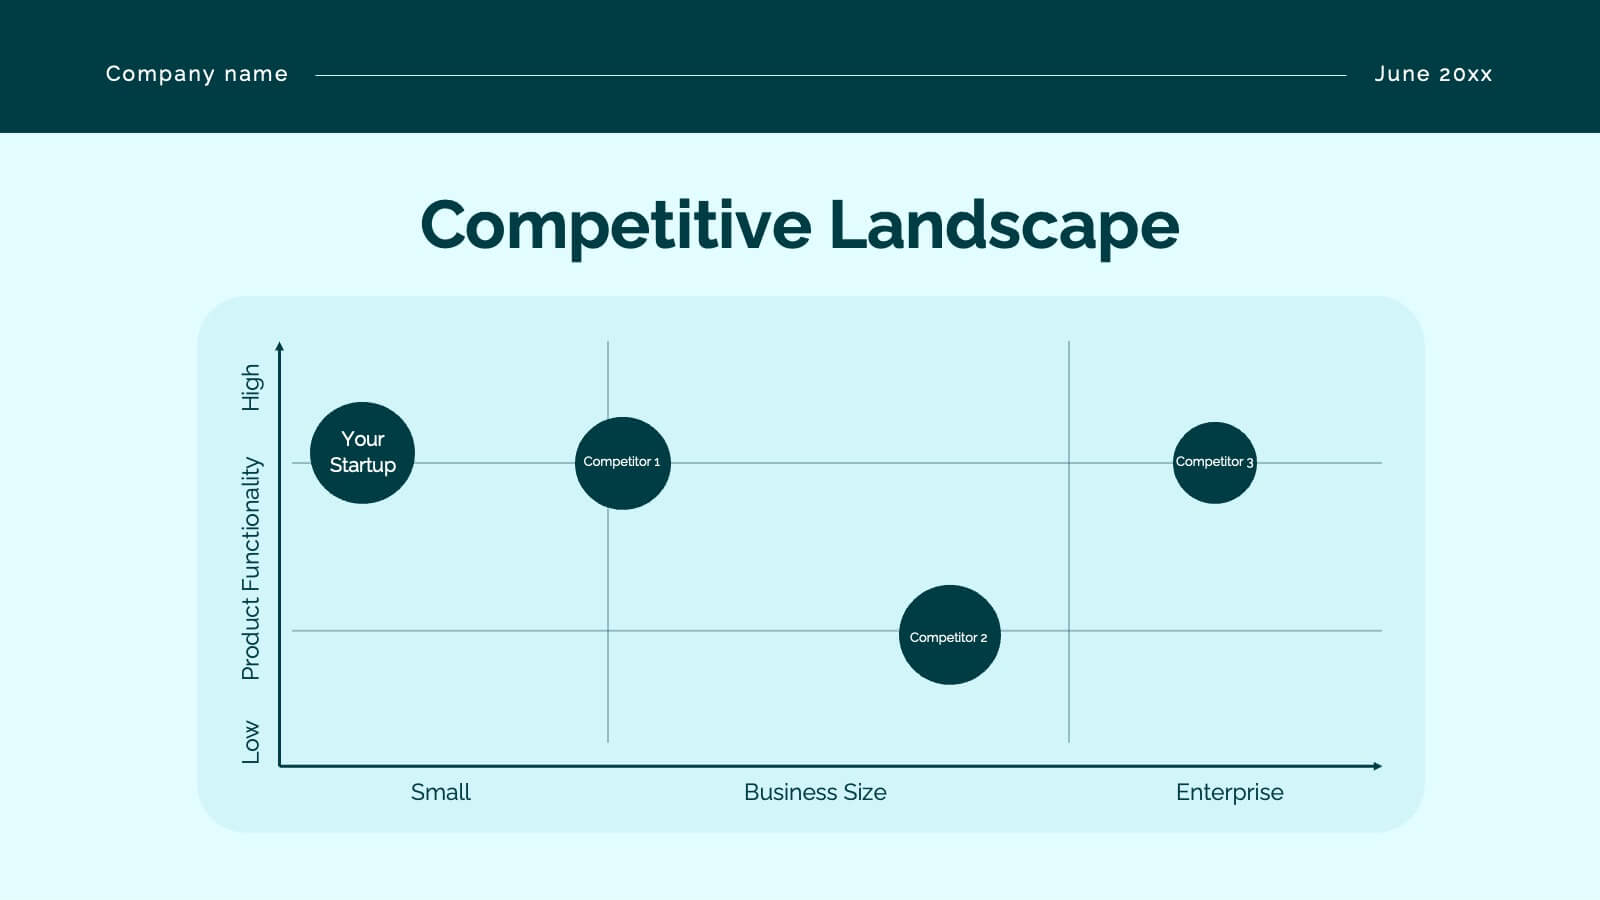
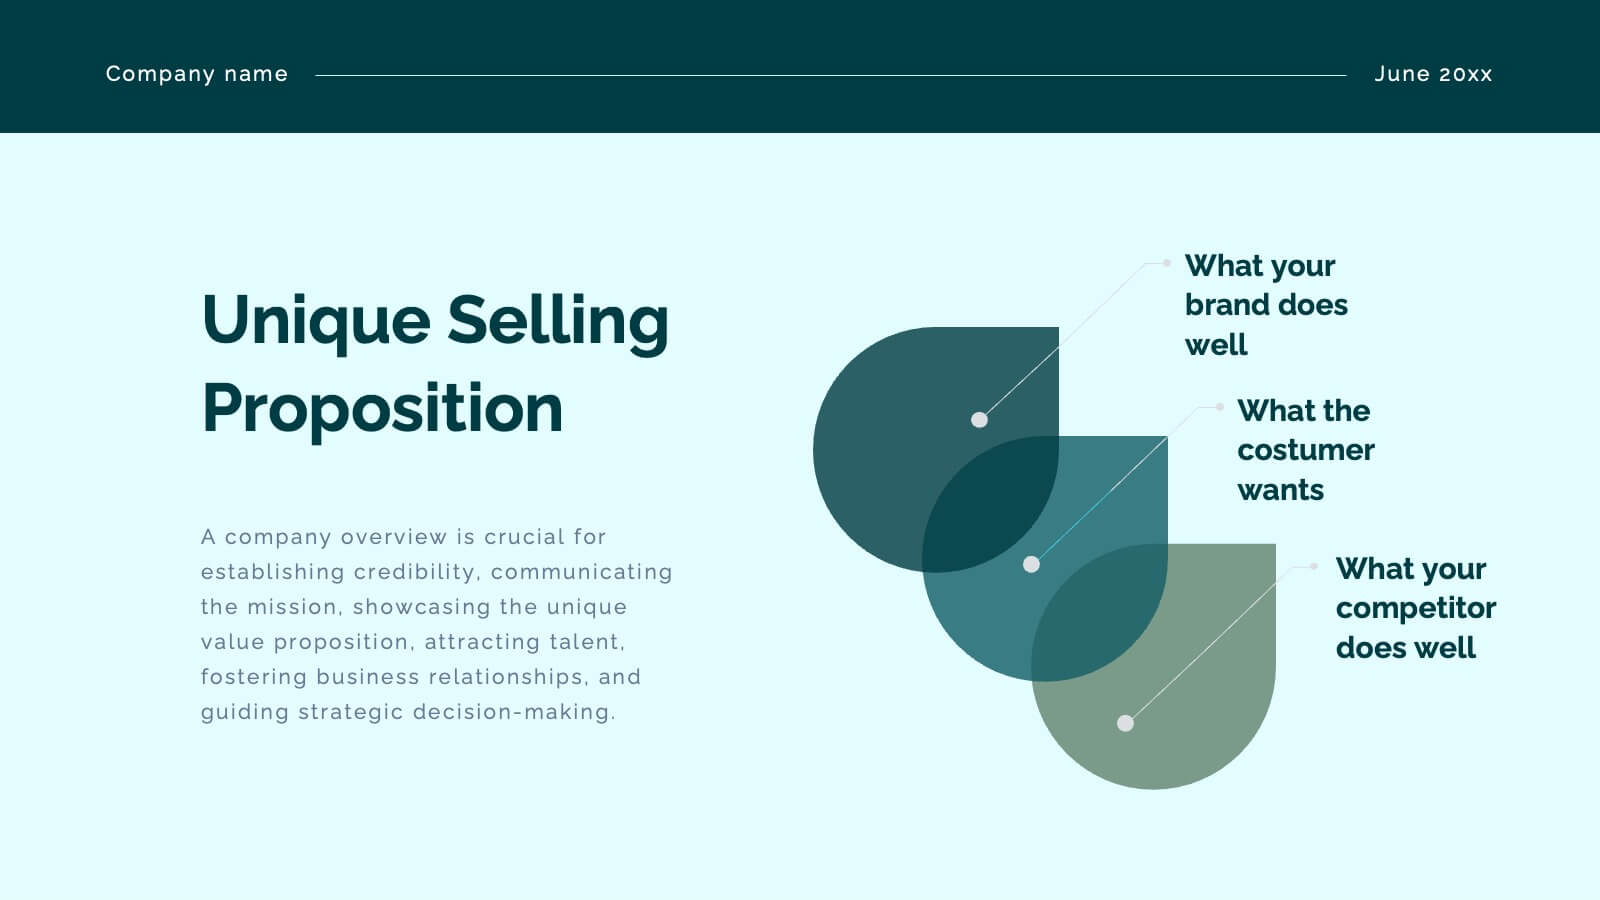
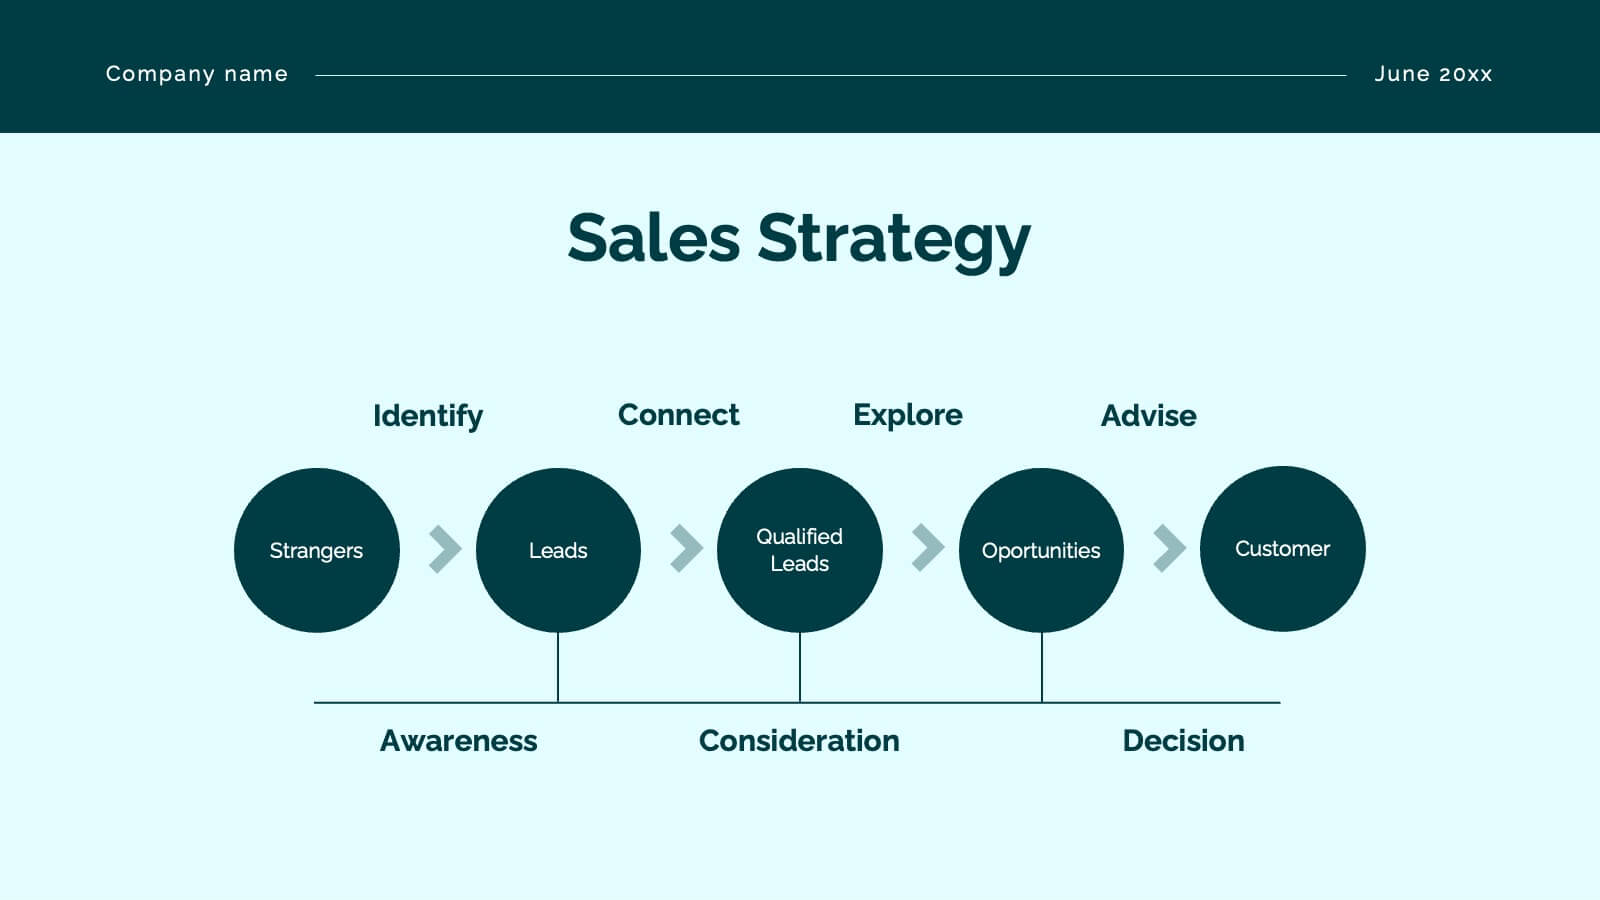
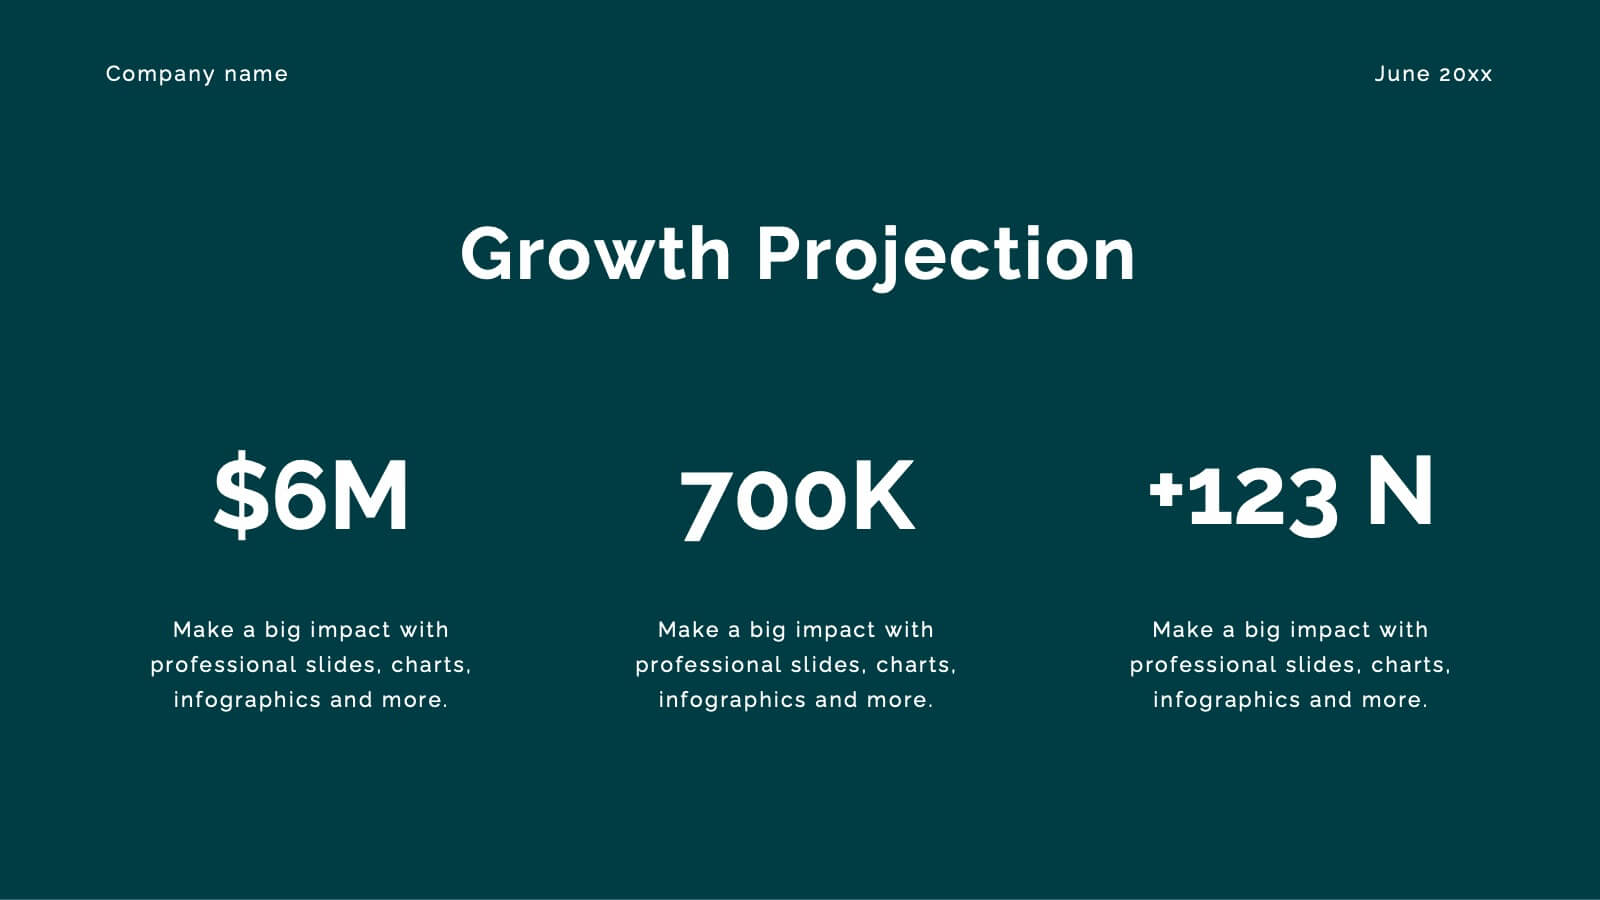
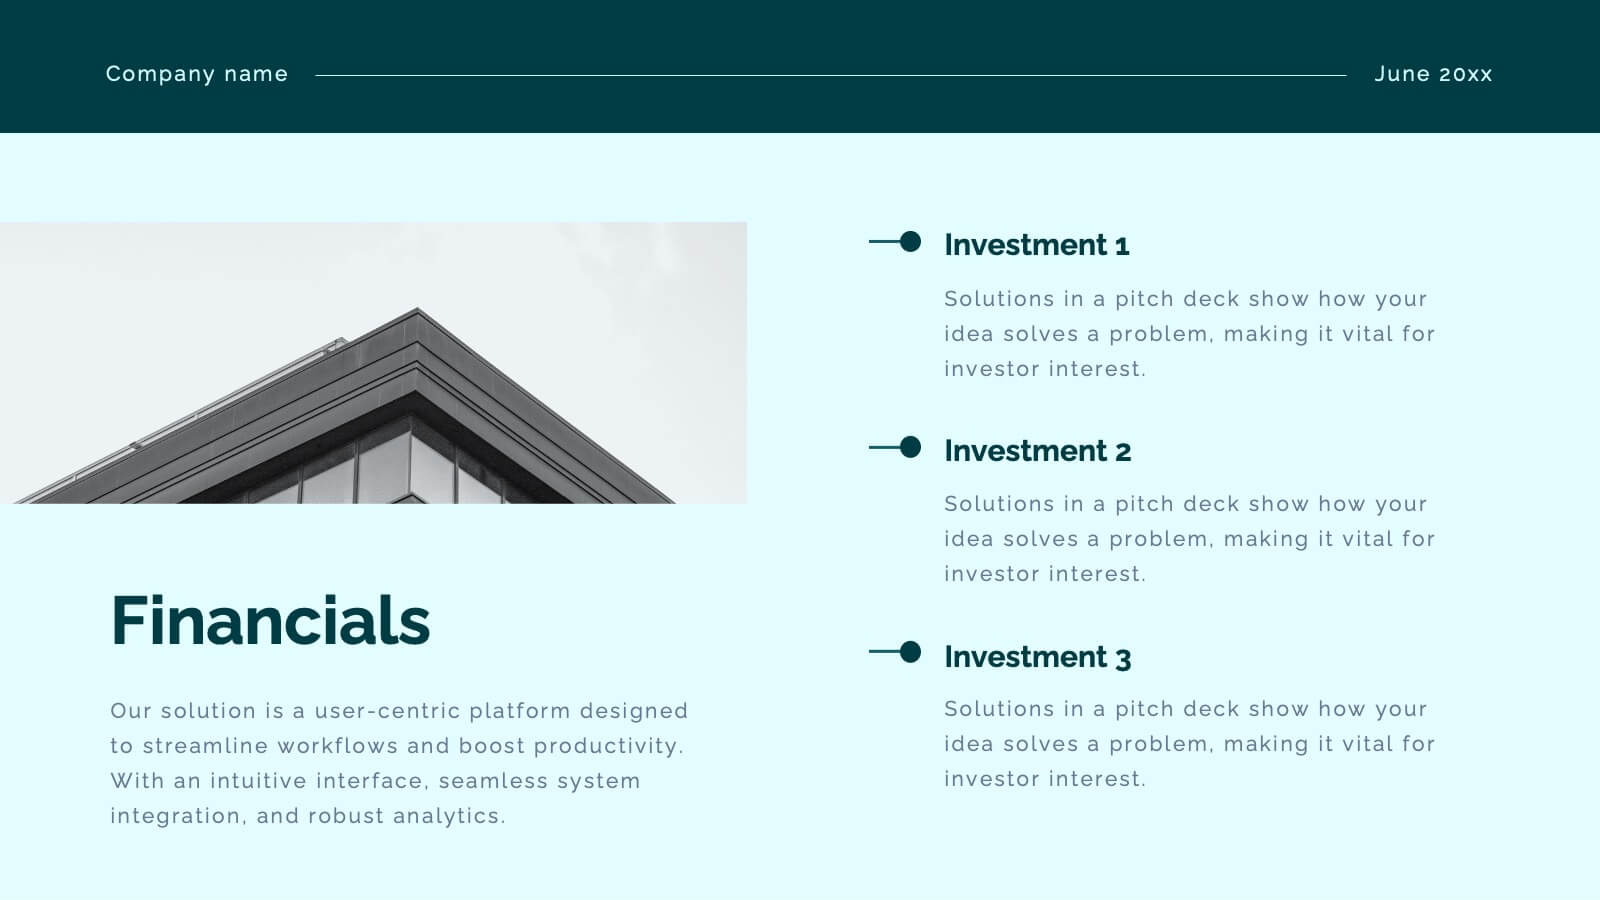
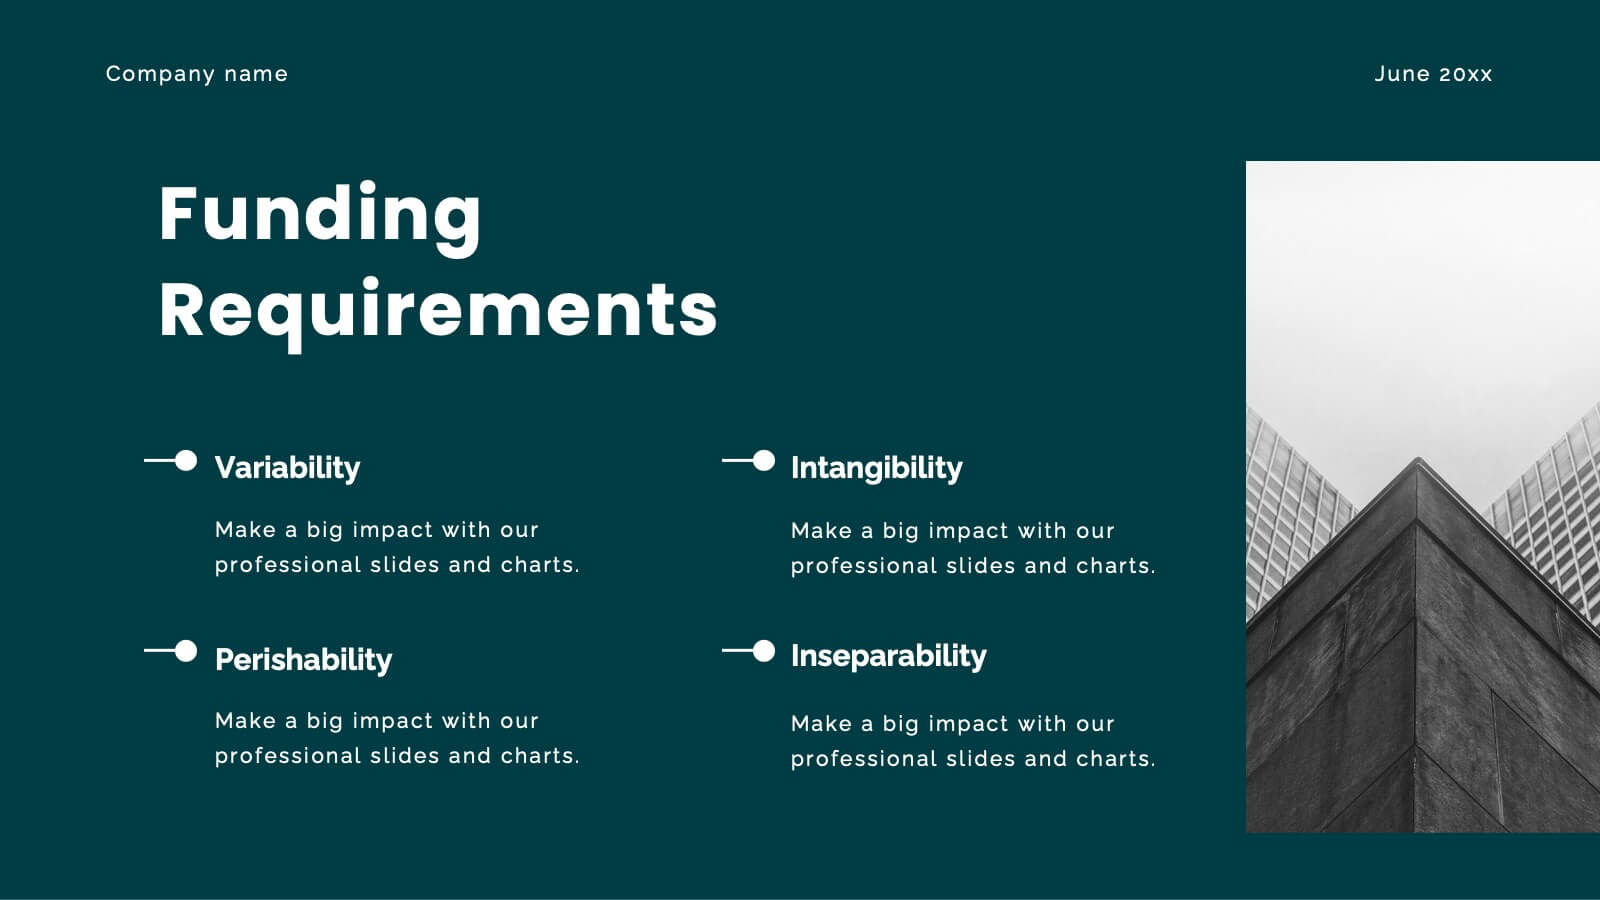
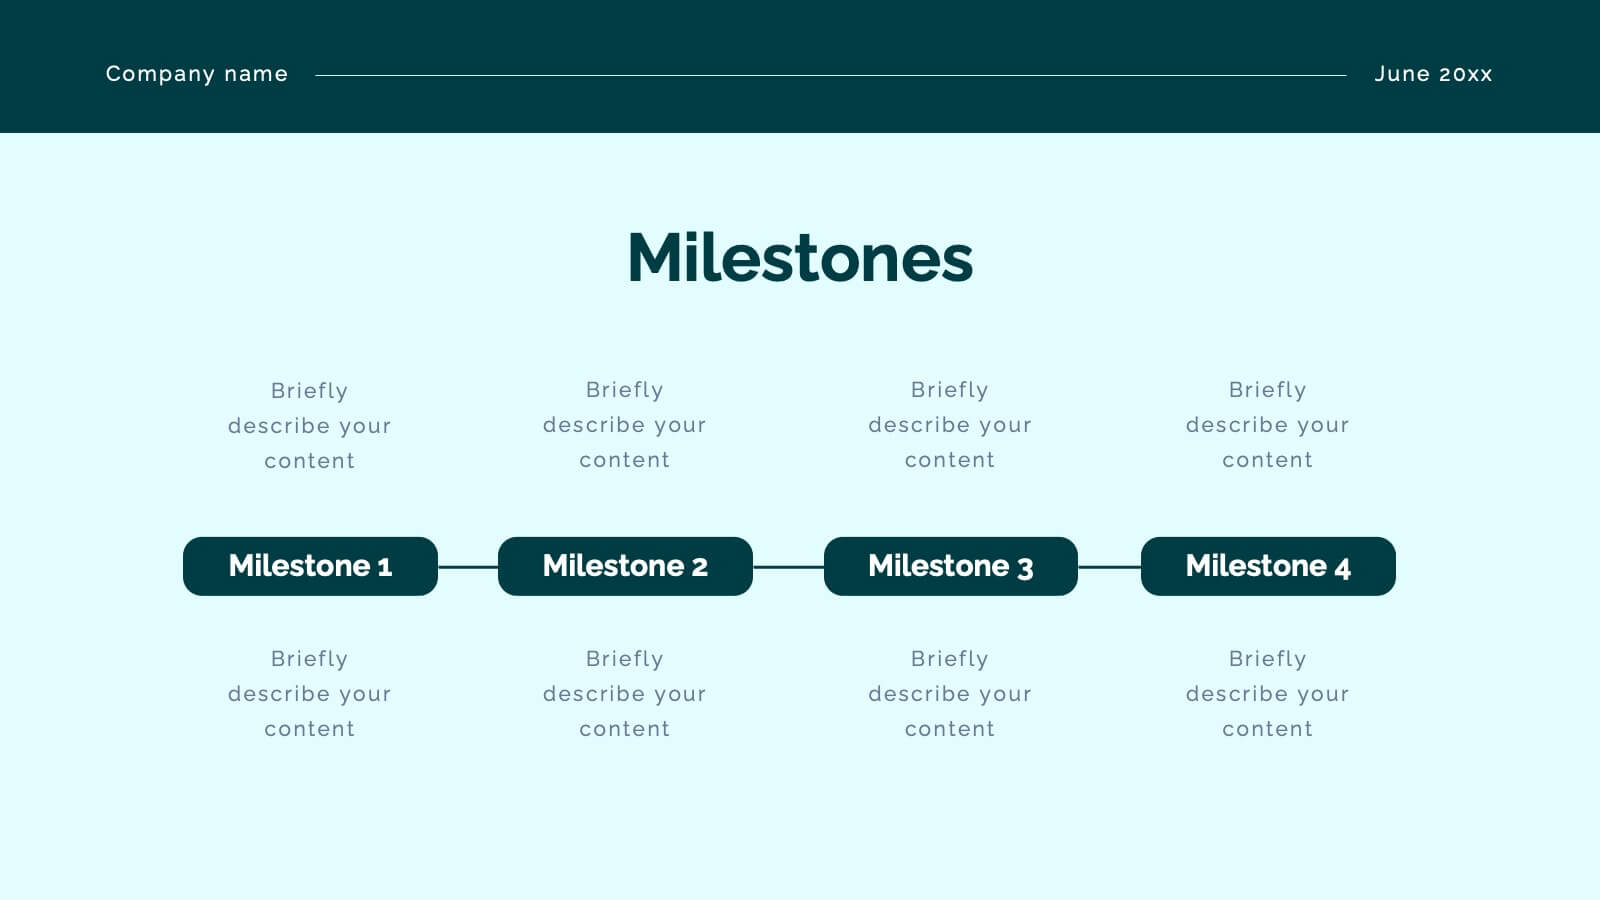
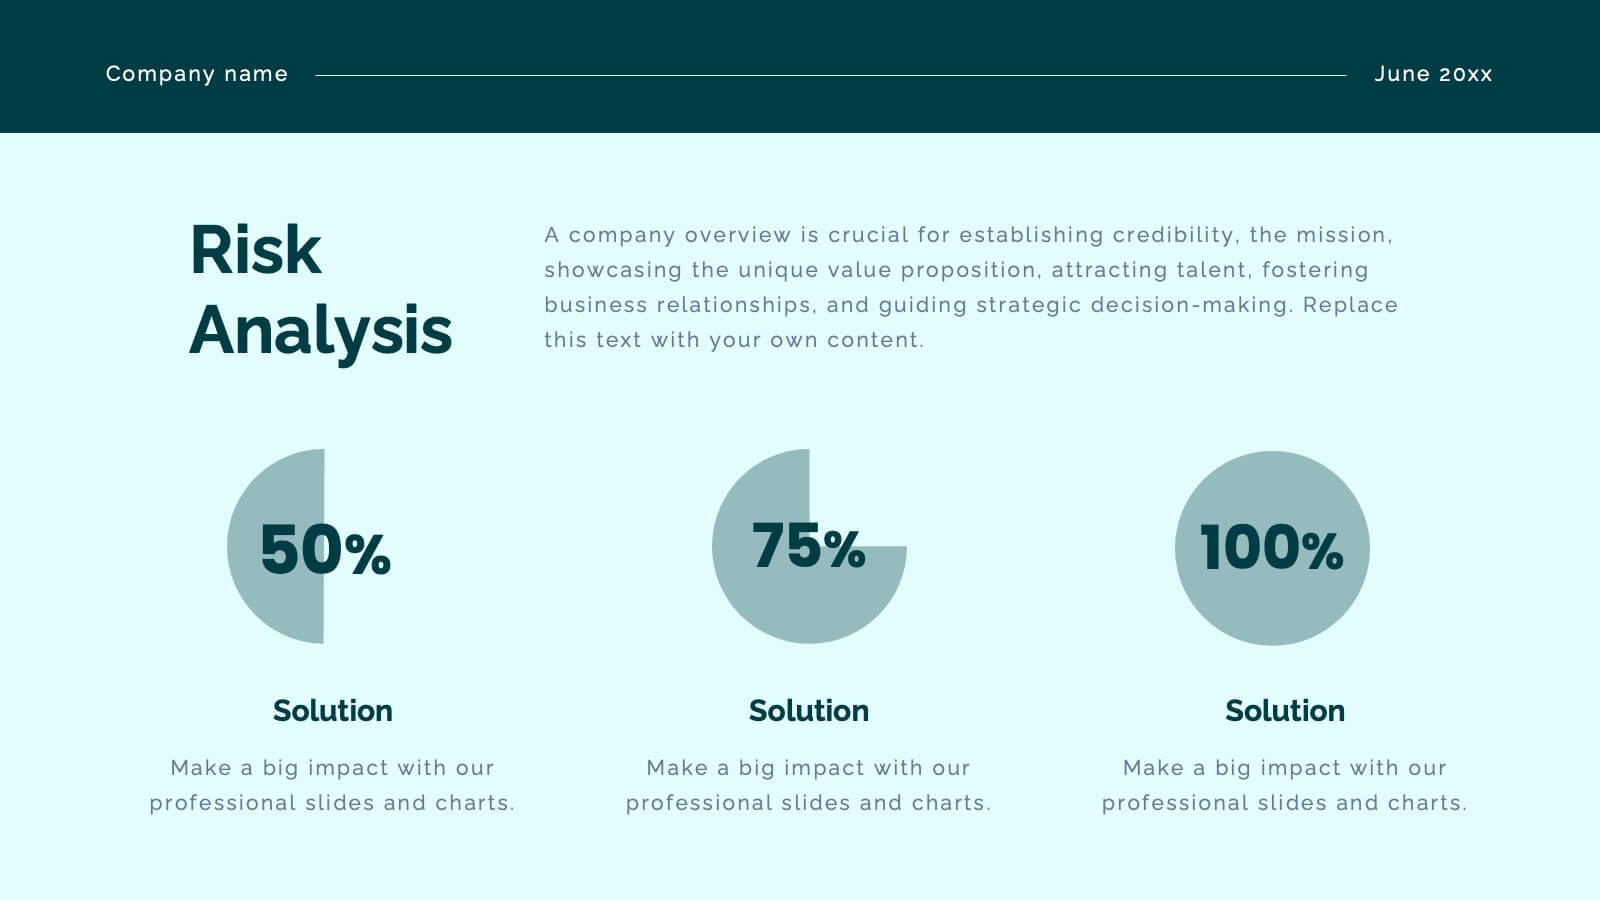
Business Communication Strategy
PowerPoint Template and Google Slides Theme


Features
- 4 Unique slides
- Fully editable and easy to edit in Microsoft Powerpoint, Keynote and Google Slides
- 16:9 widescreen layout
- Clean and professional designs
- Export to JPG, PDF or send by email
- Remove from favorites
Powerpoint Template
1 MB
Google Slides Template
External link
Keynote Template
1 MB
Recommend
- Remove from favorites
Powerpoint Template
1 MB
Google Slides Template
External link
Keynote Template
1 MB
7 slides
Pricing Infographic Presentation Template
Featuring our Pricing Table template it is easy to use and has a design that will grab your visitors attention. This template includes a variety of elements such as data-driven charts and tables, product images, icons and text. This template is a simple yet very effective tool for making your resources, goods or services more sellable, made to present any number of topics or products. Present your numbers like a pro with this fully customizable template, and display your pricing table. This will help you create a great looking pricing table template, which will be perfect for any business!
- Remove from favorites
Powerpoint Template
1 MB
Google Slides Template
External link
Keynote Template
1 MB
6 slides
Business Performance Pie Chart Presentation
Showcase key business insights with the Business Performance Pie Chart Presentation template. Designed for professionals, this fully editable slide deck allows you to present performance metrics, financial data, and strategic analysis using visually appealing pie charts. Ideal for business reports, investor meetings, and corporate presentations, it ensures clarity and engagement. Compatible with PowerPoint, Keynote, and Google Slides.
- Remove from favorites
Powerpoint Template
1 MB
Google Slides Template
External link
Keynote Template
1 MB
6 slides
Unique Intersection Comparison Diagram
Illustrate complex relationships with clarity using the Unique Intersection Comparison Diagram Presentation. This visually engaging 5-circle diagram highlights overlaps and distinct points, ideal for showcasing cross-functional collaboration, multi-variable strategies, or layered comparisons. Each segment supports titles and brief text, making it perfect for business planning, product features, or audience segmentation. Fully editable in PowerPoint, Keynote, and Google Slides.
- Remove from favorites
Powerpoint Template
1 MB
Google Slides Template
External link
Keynote Template
1 MB
10 slides
Brand Loyalty and Customer Retention Presentation
Strengthen your brand’s relationship with your audience using the "Brand Loyalty and Customer Retention" presentation template. This design effectively illustrates how strong branding strategies enhance customer loyalty and retention rates. Ideal for marketers and business strategists, this template is fully compatible with PowerPoint, Keynote, and Google Slides, making it perfect for presentations aimed at improving customer engagement and business growth.
- Remove from favorites
Powerpoint Template
1 MB
Google Slides Template
External link
Keynote Template
1 MB
5 slides
Process Improvement Using Five Steps Framework Presentation
Visualize progress with clarity using the Process Improvement Using Five Steps Framework Presentation. This stepped layout helps you illustrate sequential actions, milestones, or improvements across five stages. Ideal for strategy, operations, or performance initiatives. Easy to customize in PowerPoint, Keynote, Google Slides, and Canva to fit your workflow needs.
- Remove from favorites
Powerpoint Template
2 MB
Google Slides Template
External link
Keynote Template
4 MB
27 slides
Aqua Brand Strategy Report Presentation
Make waves with this fresh, aqua-inspired presentation template, perfect for delivering a standout brand strategy report! Designed to help you showcase your brand's vision, market positioning, and strategic goals, it features a clean, modern layout that grabs attention. Compatible with PowerPoint, Keynote, and Google Slides for effortless customization.
- Remove from favorites
Powerpoint Template
1 MB
Google Slides Template
External link
Keynote Template
1 MB
6 slides
Creative Solutions for Business Challenges Presentation
Present your strategy with impact using the Creative Solutions for Business Challenges Presentation. Featuring a dynamic cloud and gear diagram, this layout helps illustrate interconnected solutions and innovative thinking. Ideal for brainstorming, strategic planning, and team problem-solving discussions. Fully editable in PowerPoint, Keynote, and Google Slides.
- Remove from favorites
Powerpoint Template
1 MB
Google Slides Template
External link
Keynote Template
1 MB
5 slides
Strategic Planning with Concentric Circles Presentation
Visualize Your Strategy with Clarity using this Strategic Planning with Concentric Circles Presentation template. Designed to illustrate layered processes, decision-making frameworks, and business growth strategies, this concentric model helps communicate core ideas with structured, expanding details. Fully customizable and compatible with PowerPoint, Keynote, and Google Slides, this template is perfect for business leaders, strategists, and consultants aiming for clear and impactful presentations.
- Remove from favorites
Powerpoint Template
6 MB
Google Slides Template
External link
Keynote Template
8 MB
23 slides
Crest Investor Pitch Presentation Presentation
Unleash your potential with this powerful pitch deck template! Tailored for presenting innovative business ideas, it features slides for company overview, market opportunity, competitive landscape, and financial projections. Clearly communicate your value proposition and impress investors with professional design and concise content. Compatible with PowerPoint, Keynote, and Google Slides for seamless presentations on any platform.
- Remove from favorites
Powerpoint Template
1 MB
Google Slides Template
External link
Keynote Template
1 MB
3 slides
Project Completion Checklist Presentation
Keep projects on track with the Project Completion Checklist template. This structured layout helps you monitor tasks, update statuses, and document progress seamlessly. Featuring status indicators, date tracking, and notes sections, this template enhances productivity and organization. Fully customizable and compatible with PowerPoint, Keynote, and Google Slides for effortless use.
- Remove from favorites
Powerpoint Template
1 MB
Google Slides Template
External link
Keynote Template
1 MB
5 slides
Professional Relationship Network Presentation
Map out key business connections using this Professional Relationship Network template. Ideal for showcasing client relationships, internal team dynamics, or communication hierarchies. This clean, modern design helps clarify roles and links across stakeholders. Fully editable and compatible with PowerPoint, Keynote, and Google Slides for flexible use in any setting.
- Remove from favorites
Powerpoint Template
1 MB
Google Slides Template
External link
Keynote Template
2 MB
4 slides
Environmental Impact Assessment Presentation
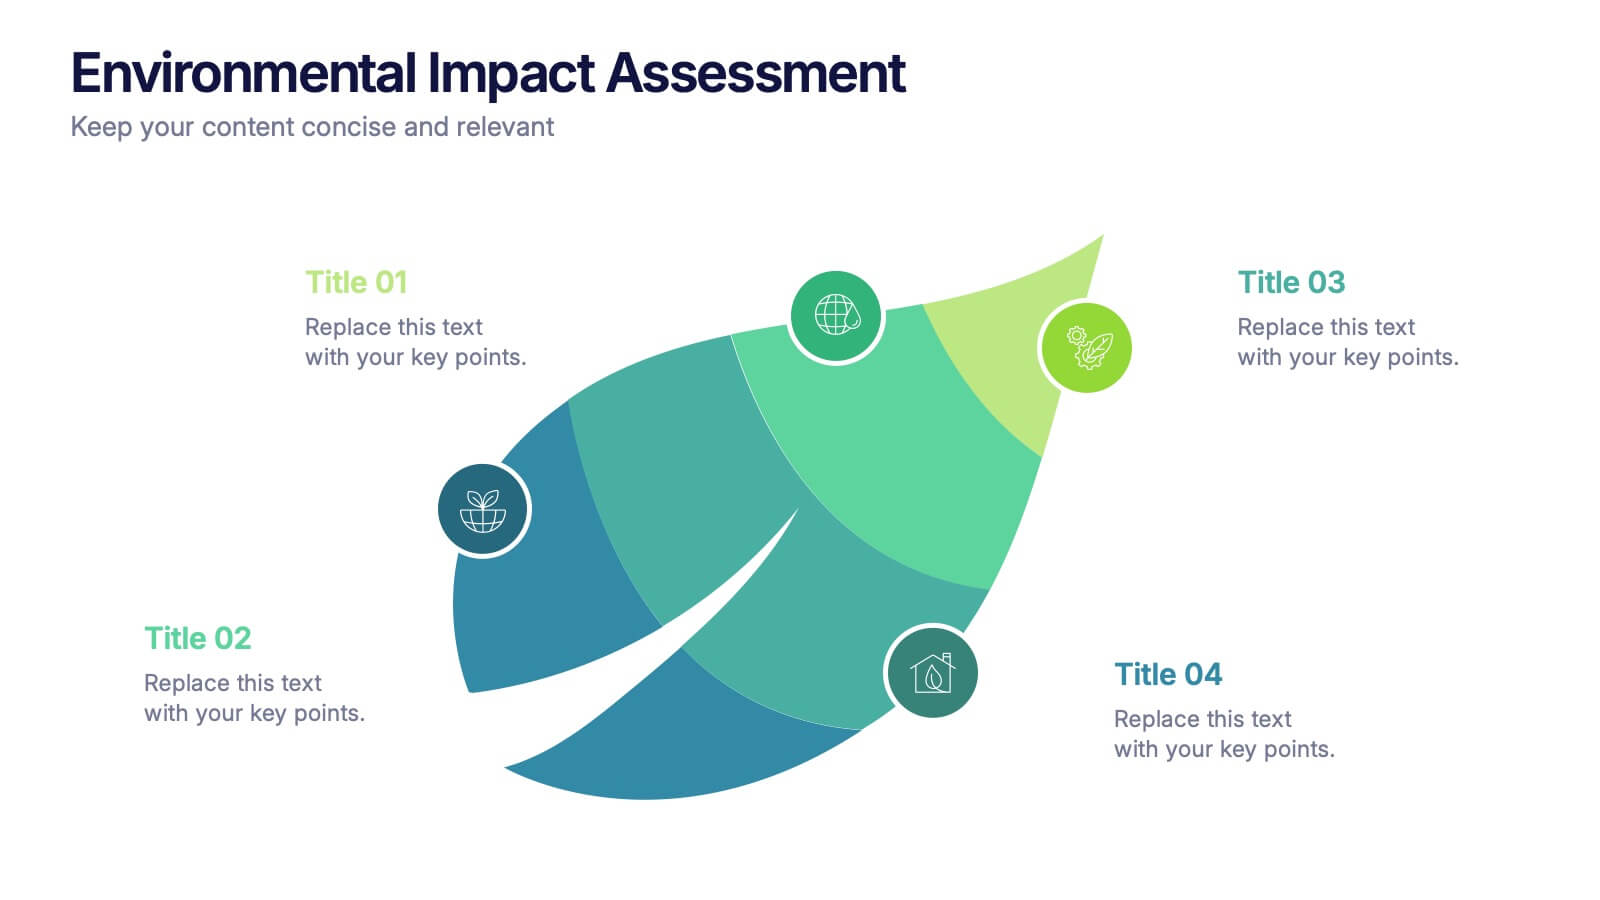
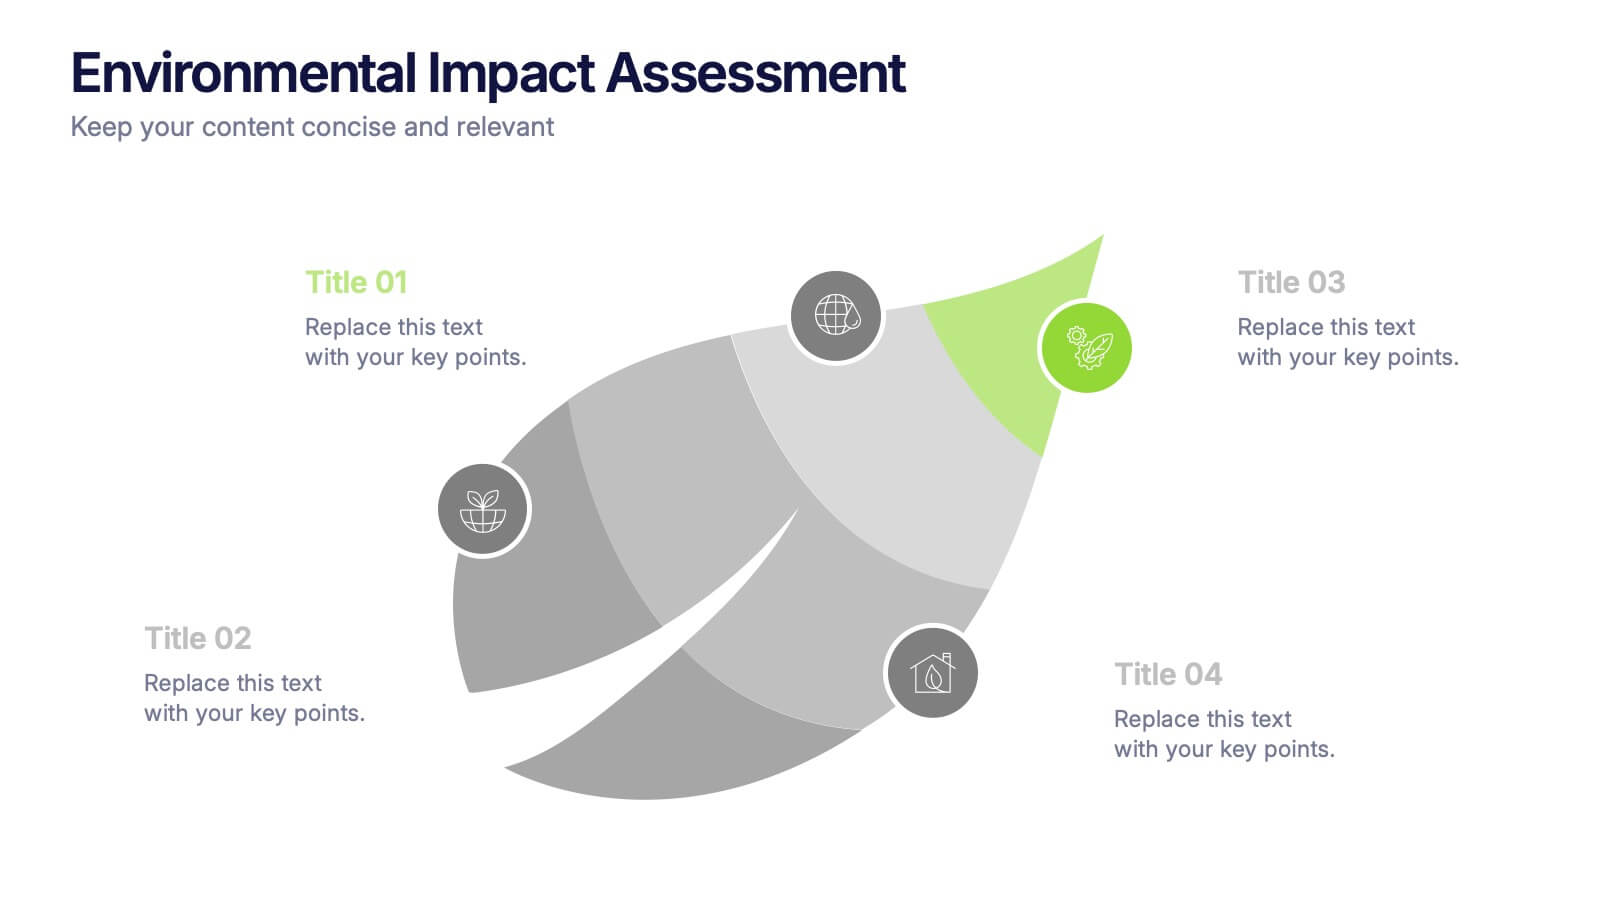
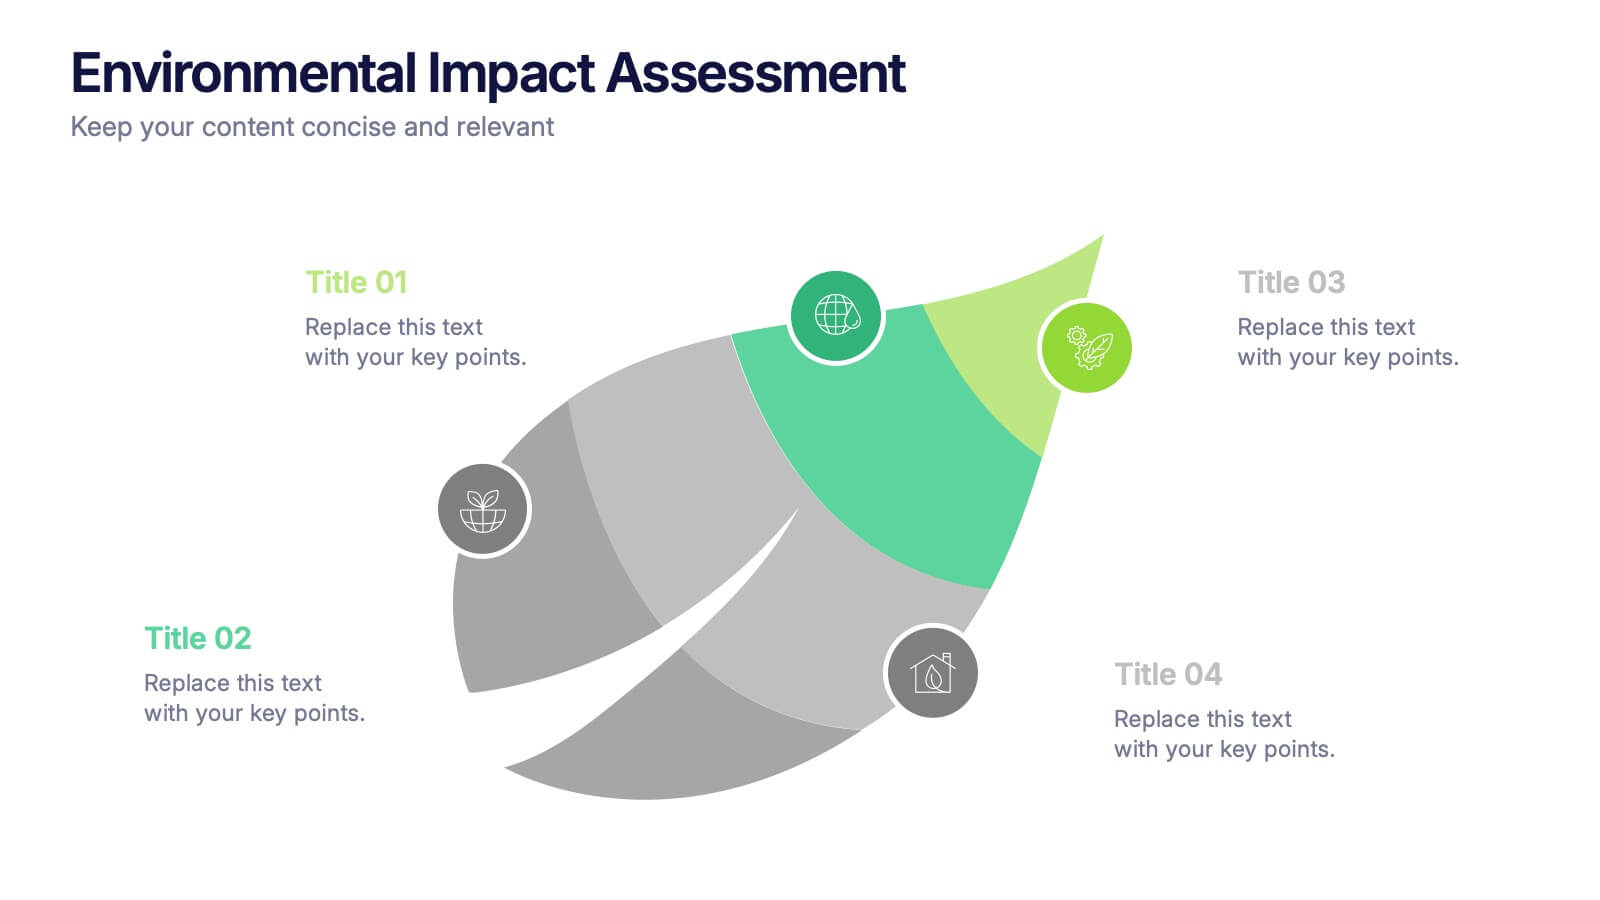
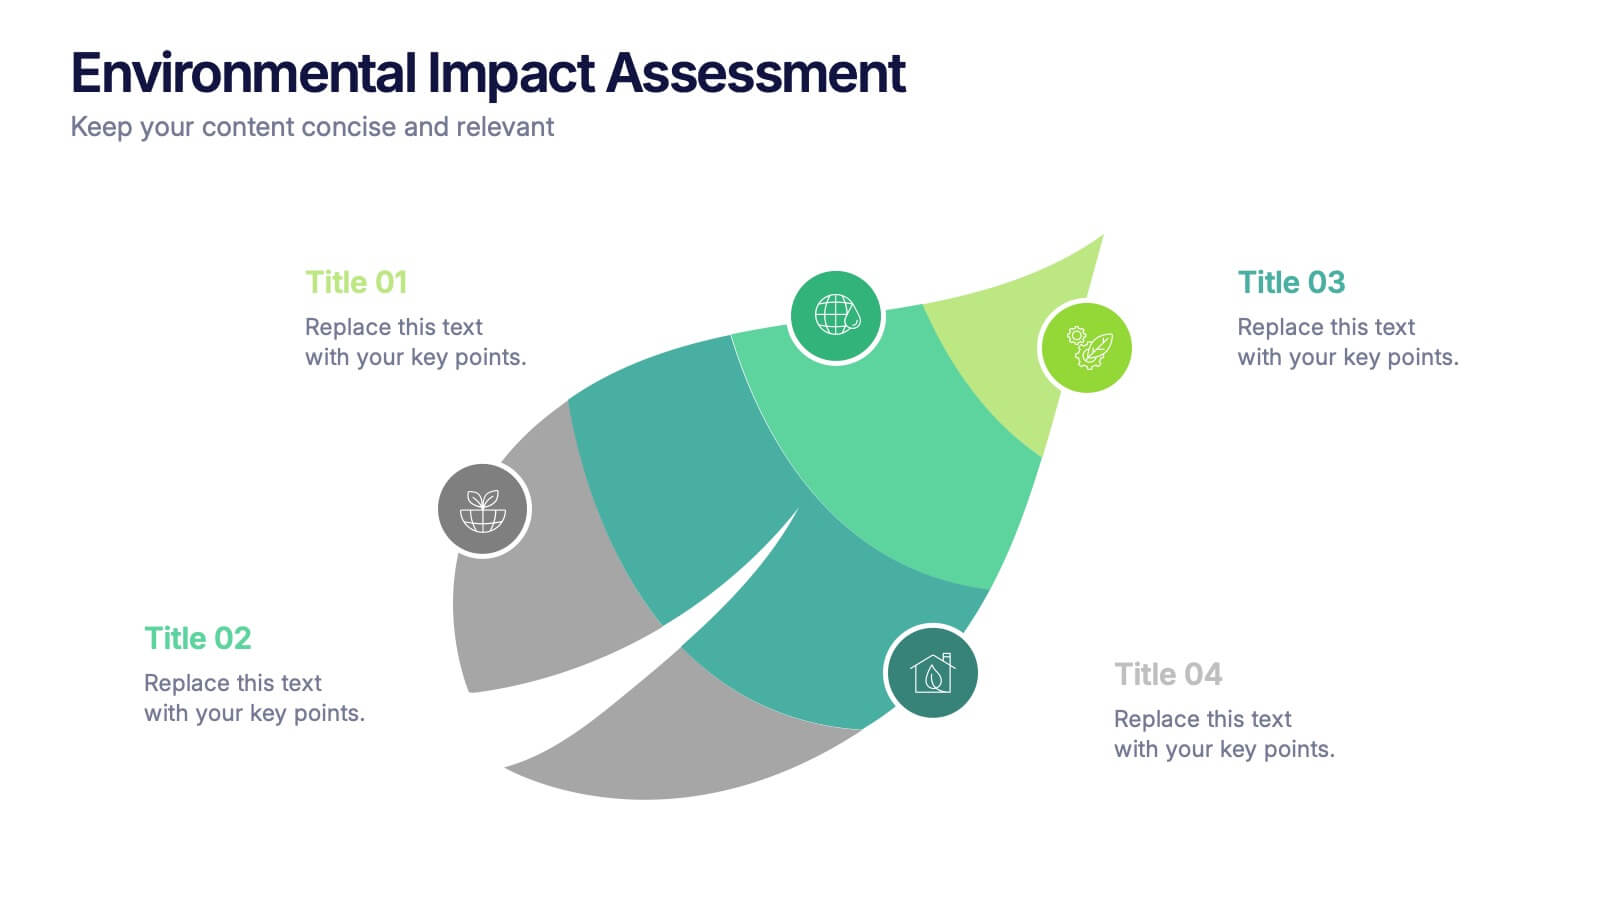
Bring your audience into a greener future with a clean, leaf-inspired design that makes complex sustainability insights feel clear and approachable. This presentation helps you break down key environmental factors, impact areas, and responsible planning in a simple visual flow. Fully editable and compatible with PowerPoint, Keynote, and Google Slides.
- Remove from favorites
Powerpoint Template
1 MB
Google Slides Template
External link
Keynote Template
1 MB
9 slides
Arrow Security Infographic
Introducing our new "Arrow Security Infographic", this is a visually engaging and informative presentation template that focuses on various aspects of arrow infographics. This template can be used to provide an overview of different security measures, techniques, and technologies that can be implemented to enhance safety and protect against potential threats. This is designed with a variety of arrow infographics that can help help individuals and organizations understand the importance of security and make informed decisions to safeguard their assets and interests. Compatible with Powerpoint, Keynote, and Google Slides.
- Remove from favorites
Powerpoint Template
1 MB
Google Slides Template
External link
Keynote Template
1 MB
7 slides
Brain Infographic Presentation Template
Brain infographics can be used to communicate your business ideas in a unique way. The images provide a visual explanation of the project breakdown and how every step is important for a successful project execution. This brain infographic template is the perfect visual to show off your critical thinking skills, with a clear focus on planning and execution. Use this infographics template to illustrate the planning of your project, its control and monitoring, as well as its targets and execution. This template is a fun way to shed light on how our brains react to visuals in content.
- Remove from favorites
Powerpoint Template
1 MB
Google Slides Template
External link
Keynote Template
1 MB
6 slides
Career Objective Infographic
Objective slides help communicate goals, aims, and purpose of the presentation to the audience. This infographic template is a visual representation that communicates your career goals, aspirations, and the value you bring to potential employers. This template serves as a roadmap for your presentation, helping both you and your audience understand the purpose and direction of your objective. Compatible with Powerpoint, Keynote, and Google Slides. This showcases your career objectives and key qualifications. Use a design that reflects your industry and personal brand while conveying your career objectives effectively.
- Remove from favorites
Powerpoint Template
1 MB
Google Slides Template
External link
Keynote Template
1 MB
4 slides
3-Tier Pricing Table Layout Presentation
Make your pricing pitch pop with this bold and modern layout! This presentation template is perfect for showcasing product or service plans with clear comparisons across three tiers. Designed to streamline pricing communication, it’s ideal for SaaS, consulting, or digital services. Fully compatible with PowerPoint, Keynote, and Google Slides.
- Remove from favorites
Powerpoint Template
1 MB
Google Slides Template
External link
Keynote Template
1 MB
4 slides
Hidden Elements Iceberg Strategy Presentation
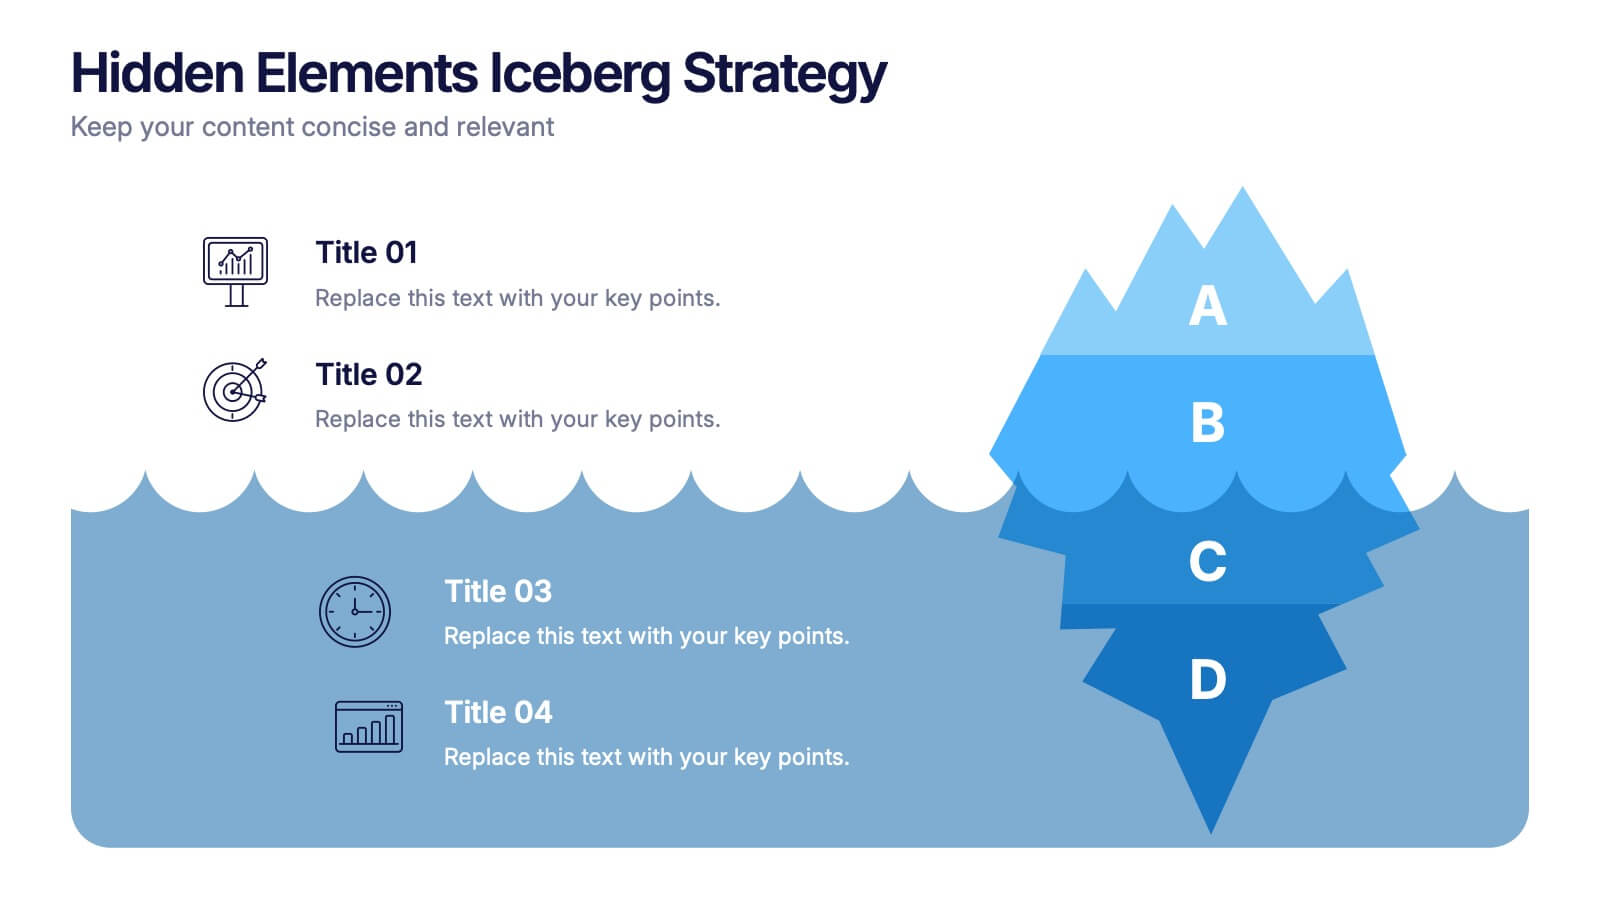
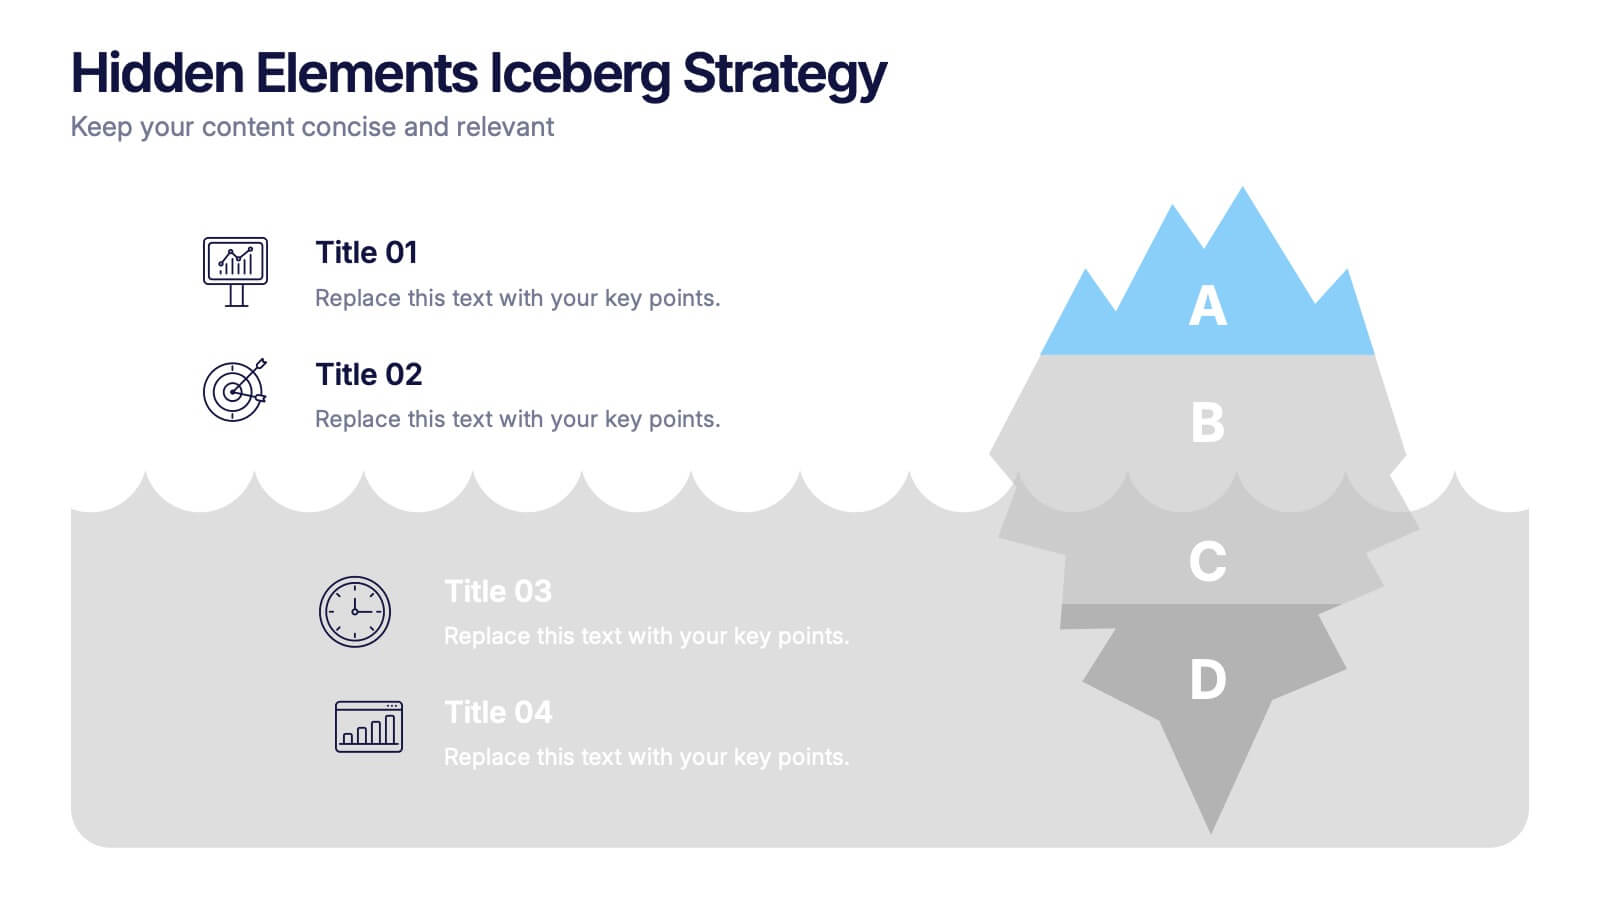
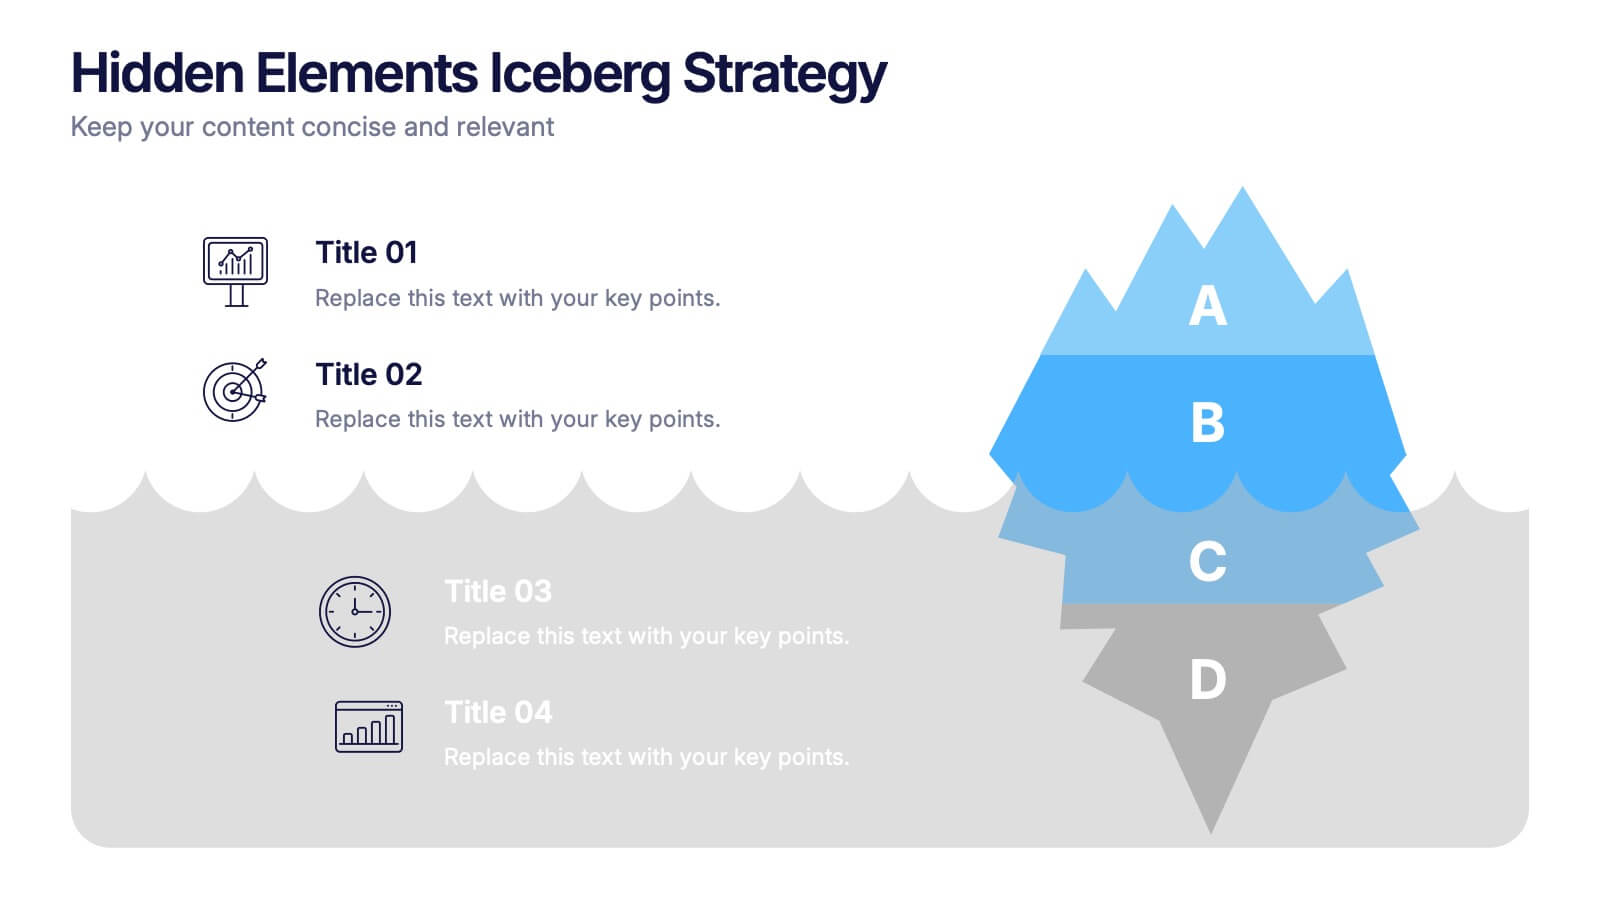
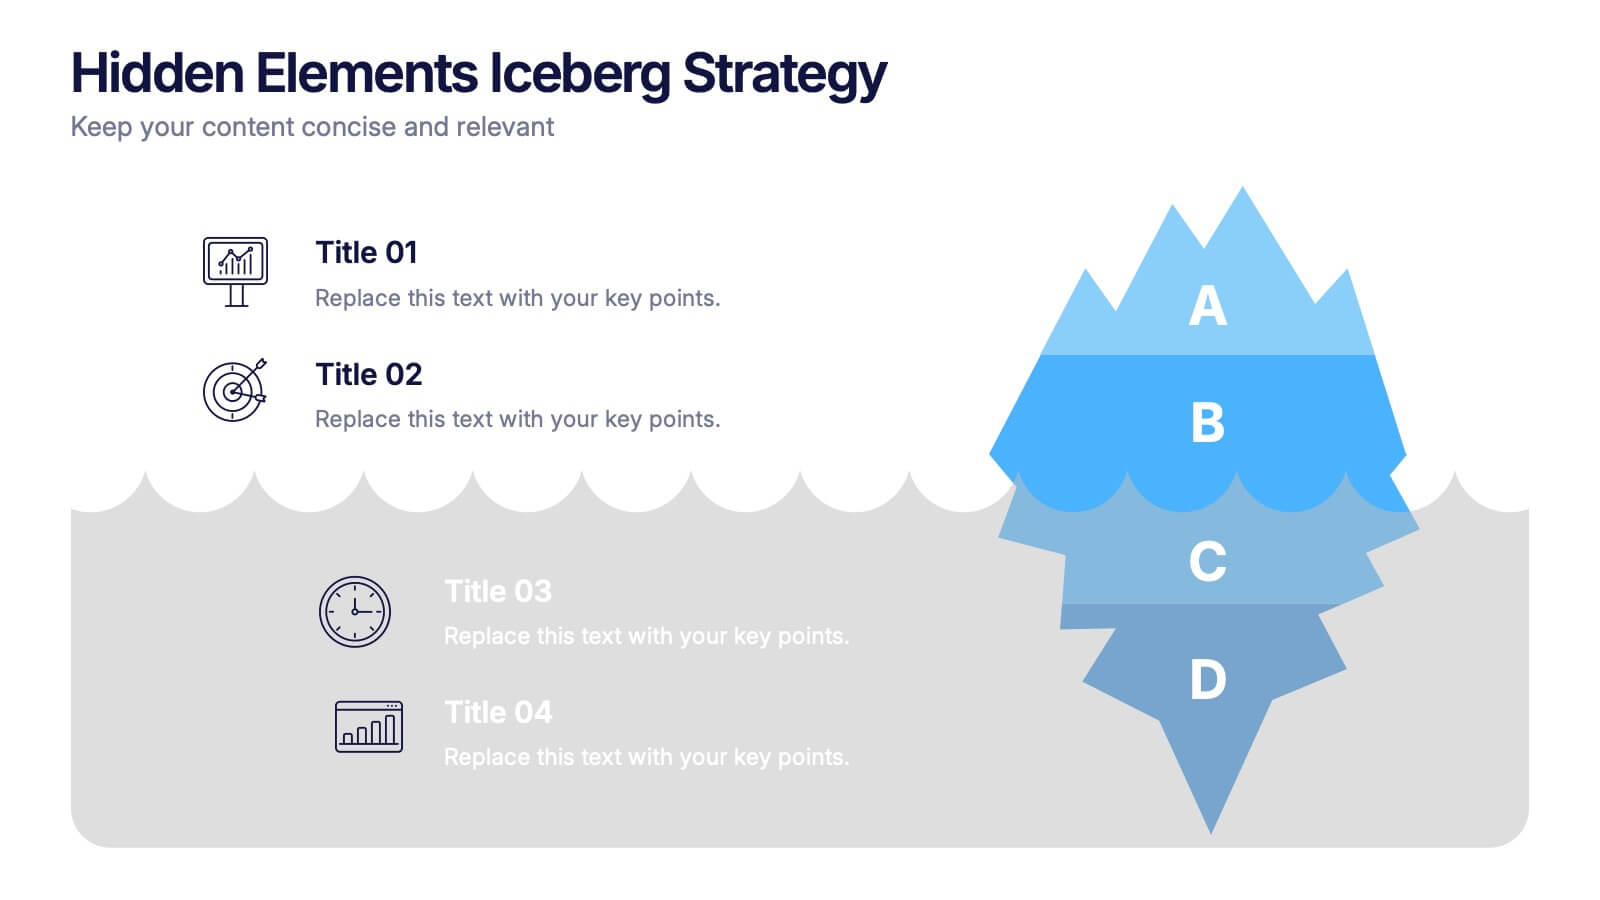
Reveal what lies beneath the surface with this Hidden Elements Iceberg Strategy presentation. Perfect for exploring visible vs. underlying factors in strategy, risk, or behavior. Visually break down your content using layered iceberg graphics. Fully editable in Canva, PowerPoint, and Google Slides to fit your narrative and branding.


