


Features
- 5 Unique slides
- Fully editable and easy to edit in Microsoft Powerpoint, Keynote and Google Slides
- 16:9 widescreen layout
- Clean and professional designs
- Export to JPG, PDF or send by email


Do you have any questions?
Recommend


6 slides
Corporate Training Program Presentation
Build excitement from day one with a sleek and modern visual! This presentation template is ideal for outlining your professional development plans, onboarding paths, or internal training milestones in a structured, step-by-step format. Fully editable and designed to impress, it works seamlessly with PowerPoint, Keynote, and Google Slides.


6 slides
Time Management Benefits Infographics
Unlock the benefits of effective time management with our Time Management Benefits infographic template. This template is fully compatible with popular presentation software like PowerPoint, Keynote, and Google Slides, allowing you to easily customize it to illustrate and communicate the advantages of mastering your time. The Time Management Benefits infographic template offers a visually engaging platform to highlight the positive outcomes of efficient time management, including increased productivity, reduced stress, improved work-life balance, and more. Whether you're a professional, student, or anyone looking to make the most of their time, this template provides a user-friendly canvas to create informative presentations and educational materials. Optimize your time management skills with this SEO-optimized Time Management Benefits infographic template, thoughtfully designed for clarity and ease of use. Customize it to showcase specific benefits, time-saving techniques, tools, and strategies for effective time management, ensuring that your audience understands the value of this essential skill. Start crafting your personalized infographic today to reap the rewards of improved time management.


8 slides
Customer Demographics Target Market Presentation
Dive into the depths of your audience with the "Customer Demographics Target Market" presentation template. Ideal for marketers and businesses aiming to understand and segment their customer base effectively, this template offers a vibrant, clear visual breakdown of demographic data. Ensure your strategic communications resonate with the right crowd, with compatibility for PowerPoint, Keynote, and Google Slides.


6 slides
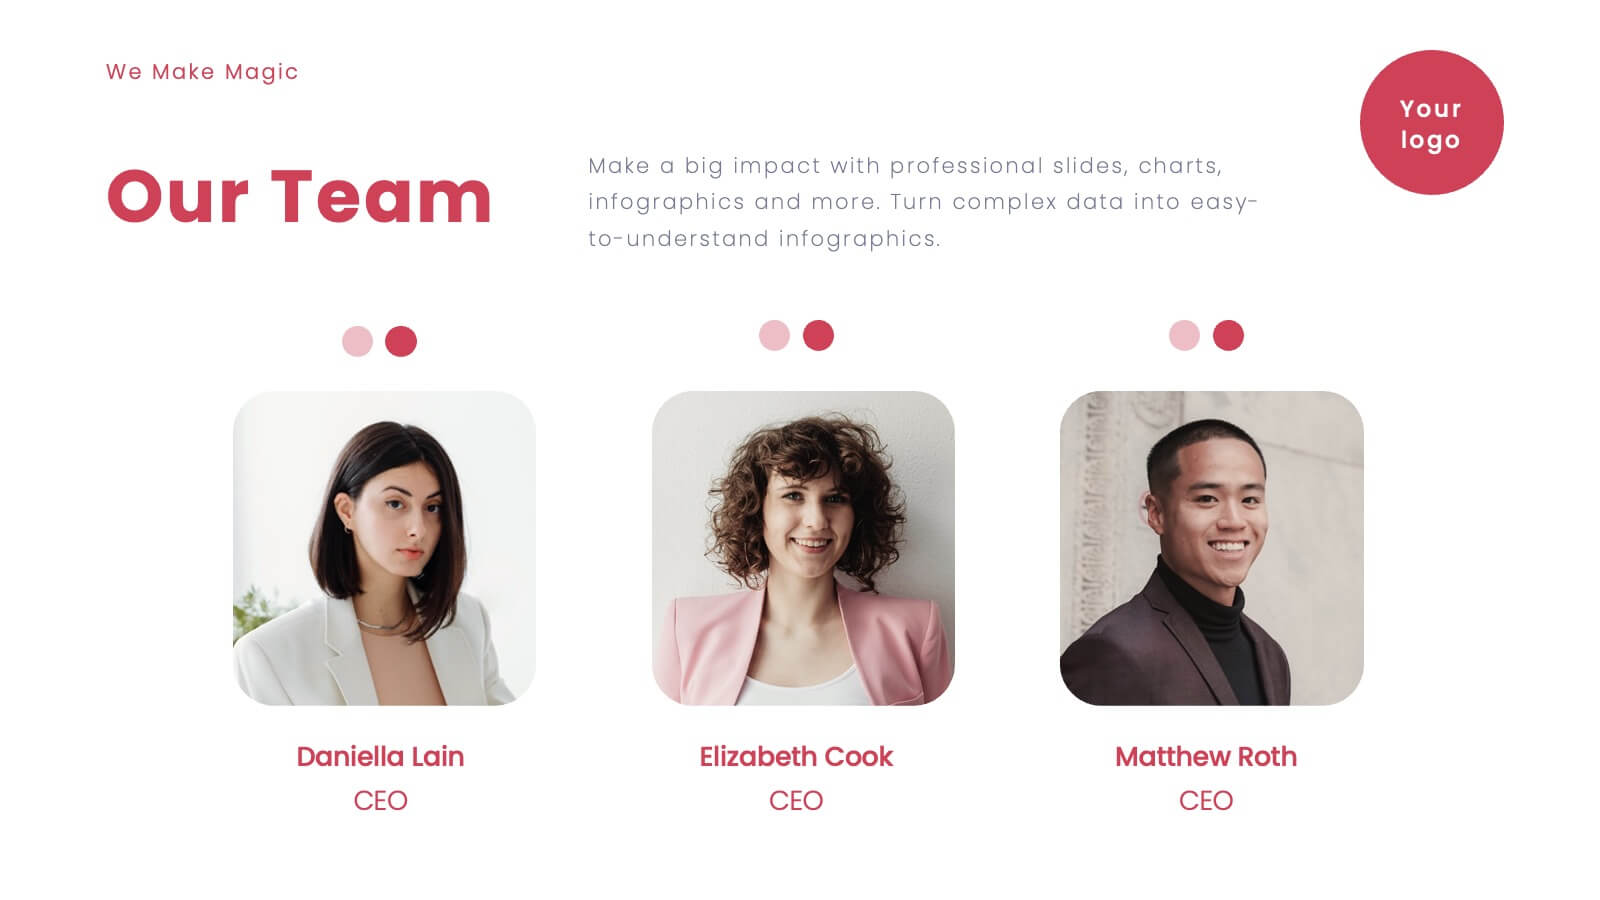
Team Collaboration Overview Presentation
Showcase team structure and collaboration dynamics with this clear, visual overview. Highlight roles, communication flow, and key contributors using a clean layout with up to five team members. Ideal for onboarding, planning, or reporting sessions. Fully editable in PowerPoint, Keynote, and Google Slides—perfect for any organizational or project-based setting.

22 slides
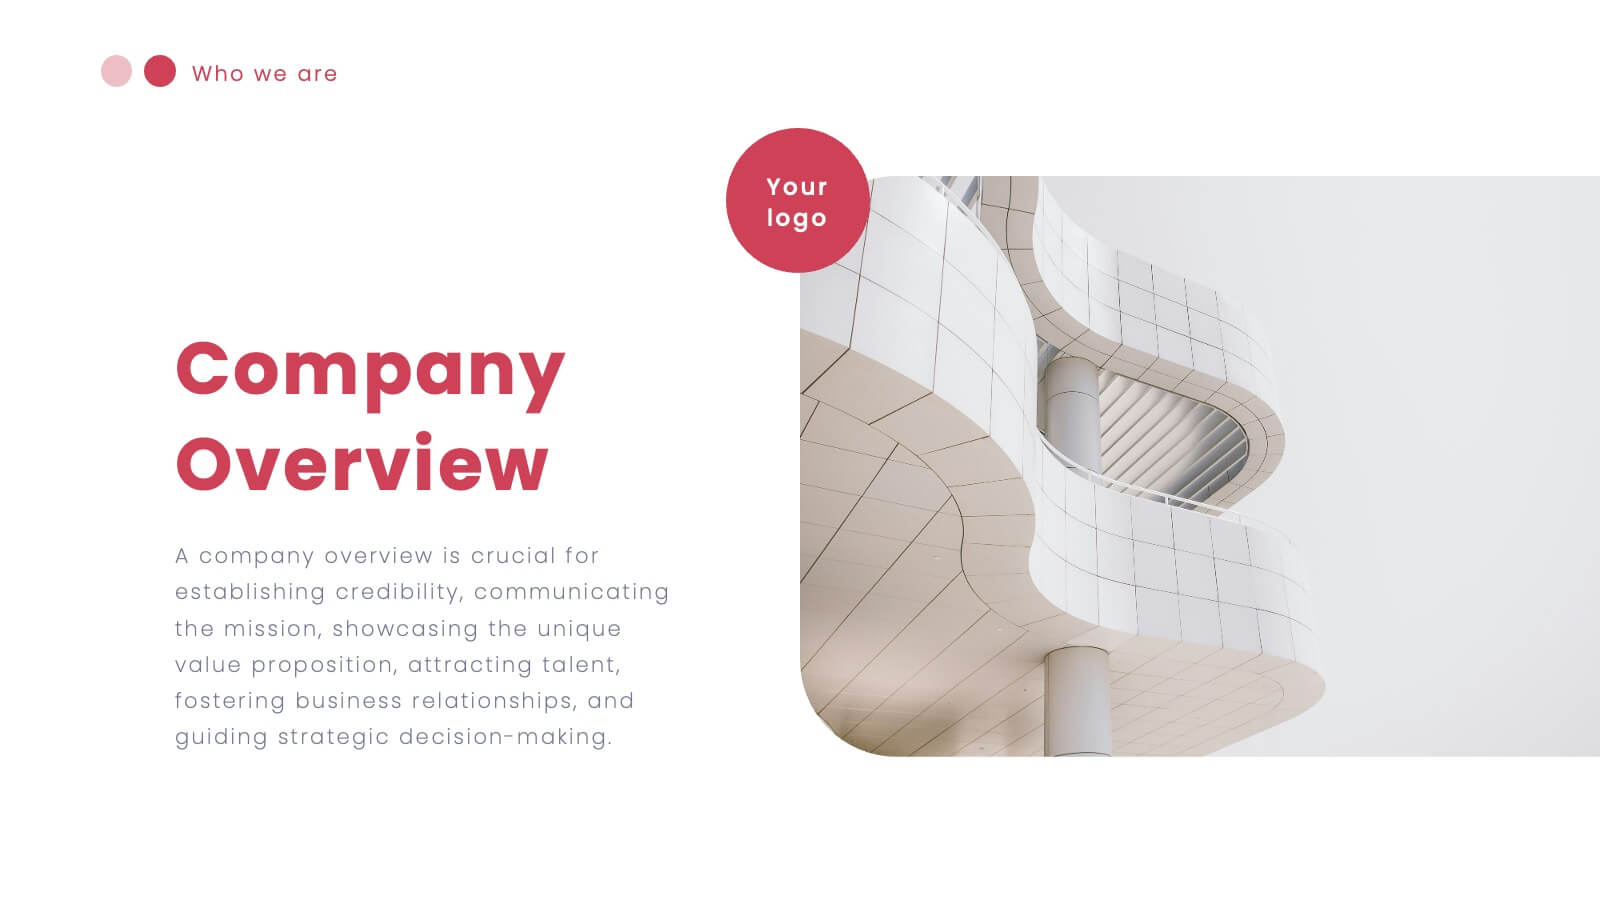
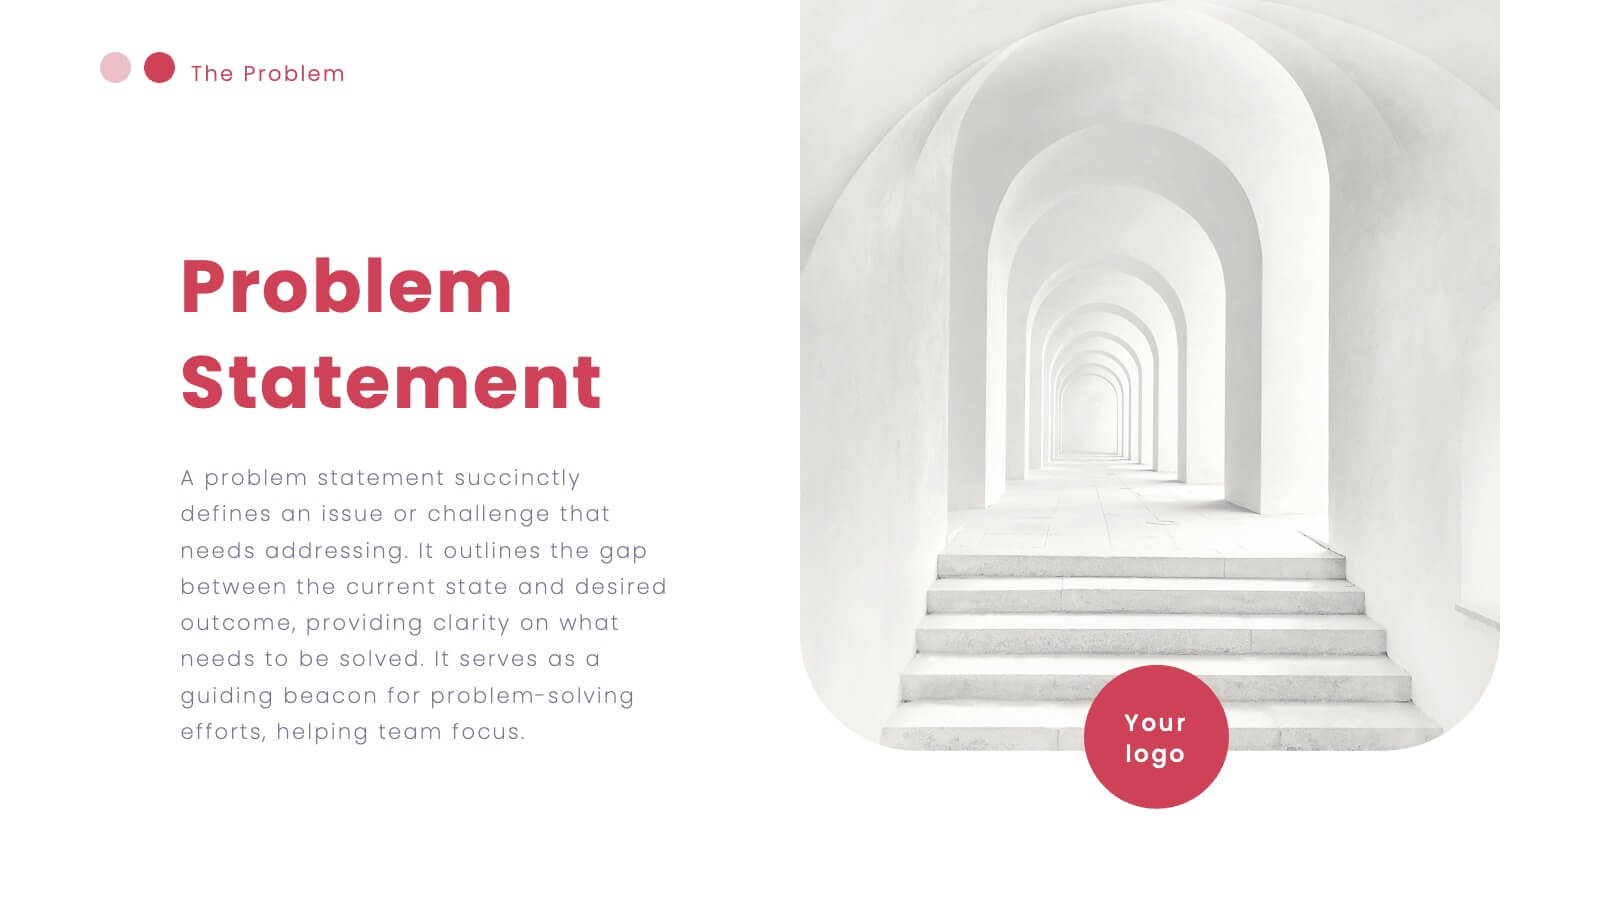
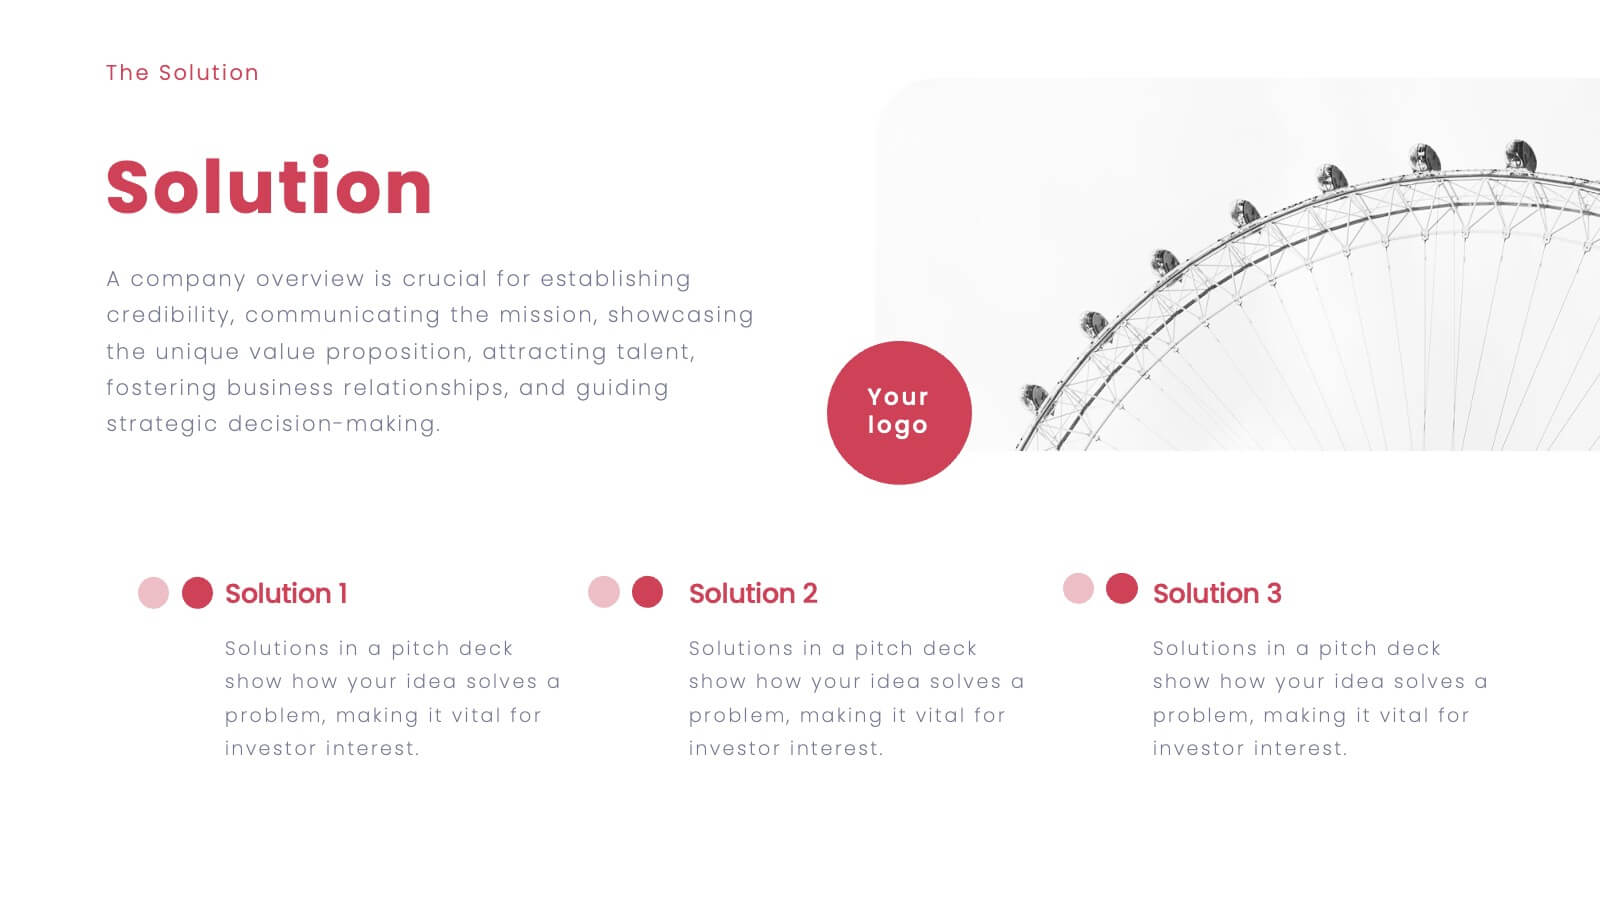
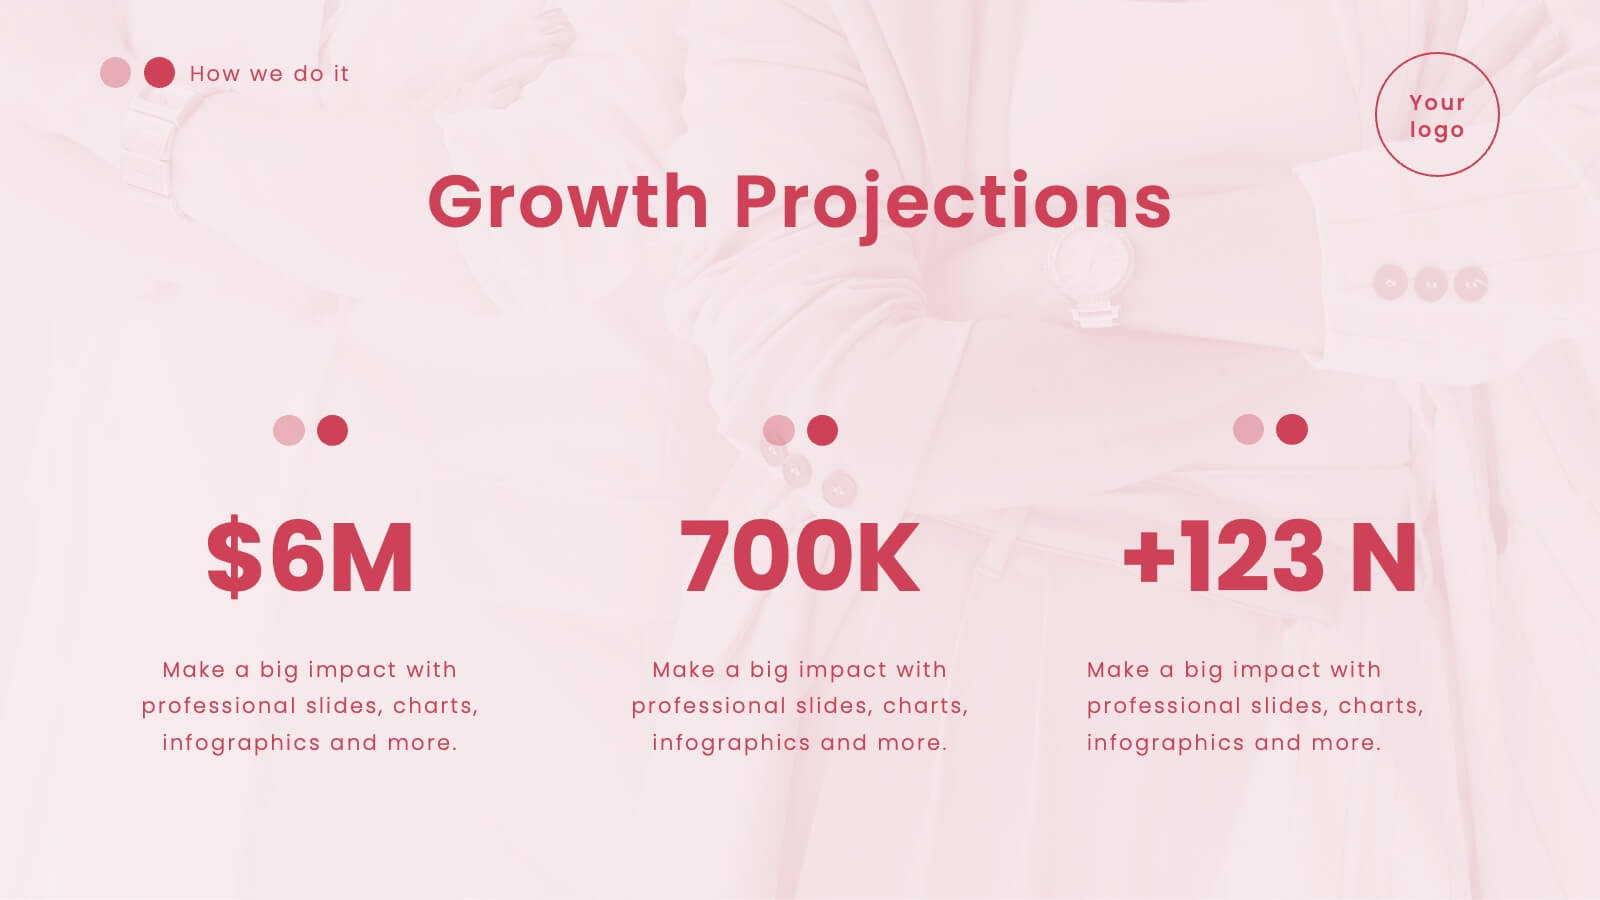
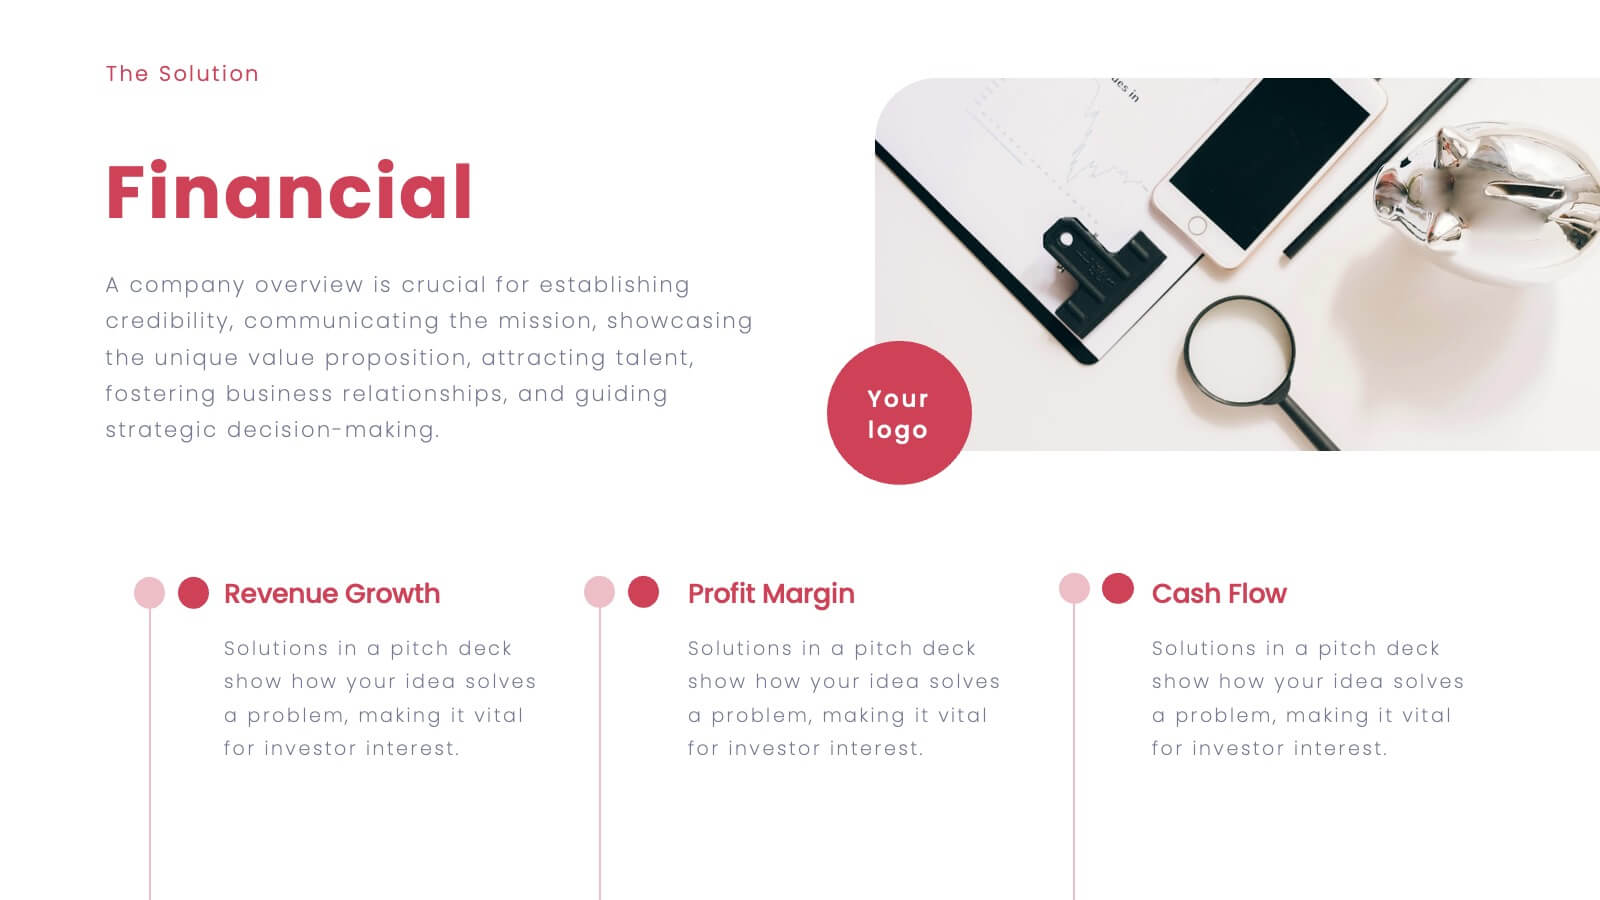
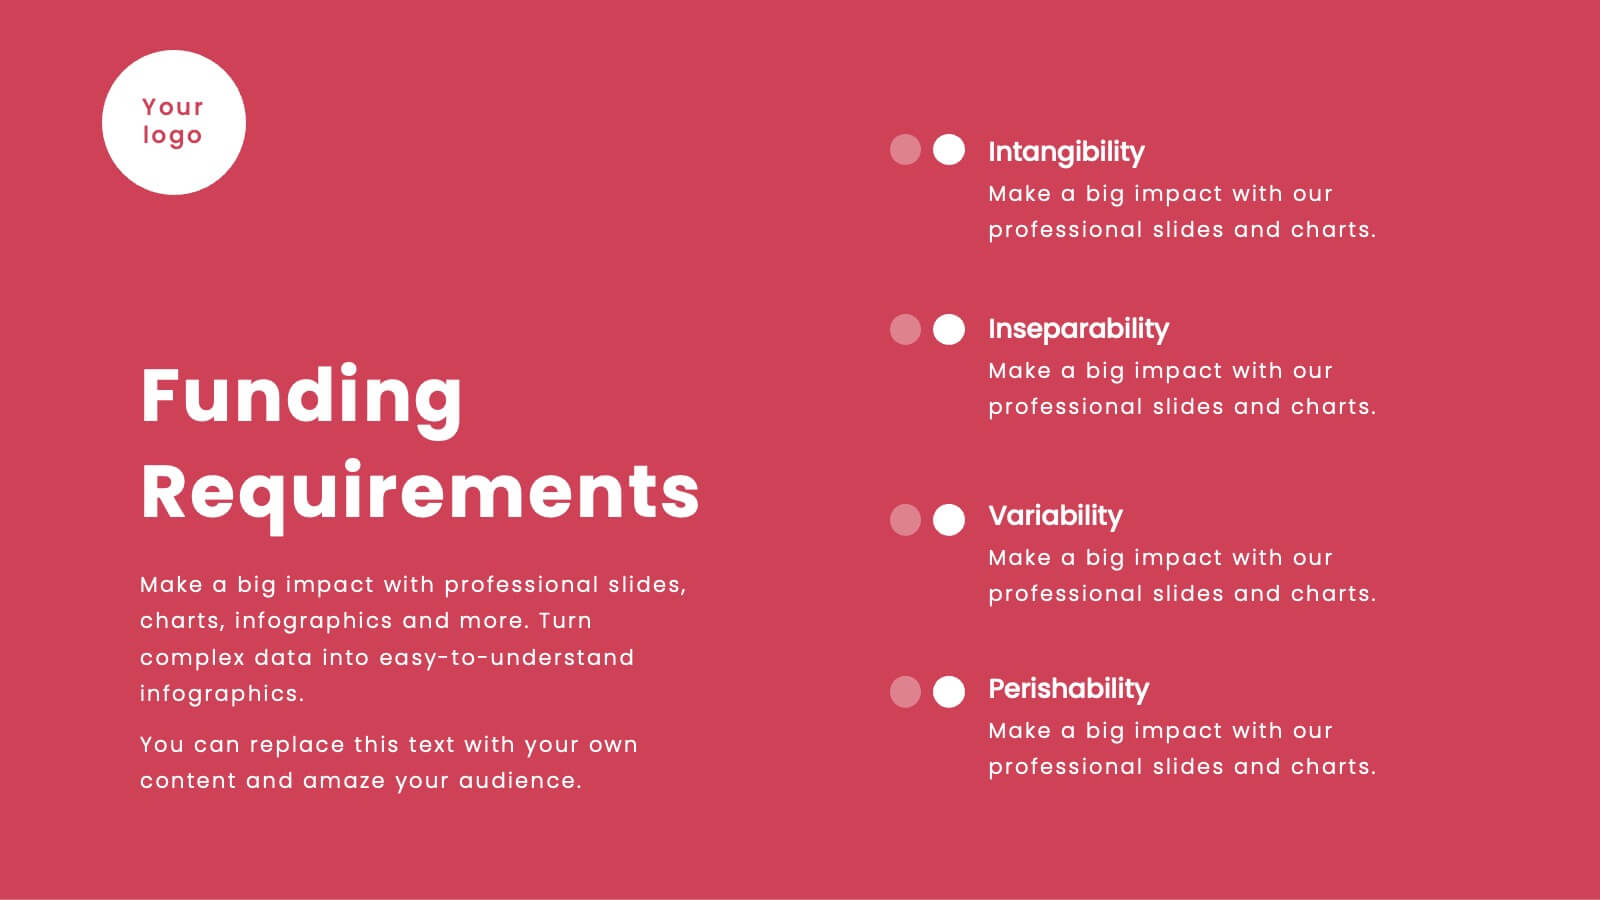
Vortex Startup Pitch Deck Presentation
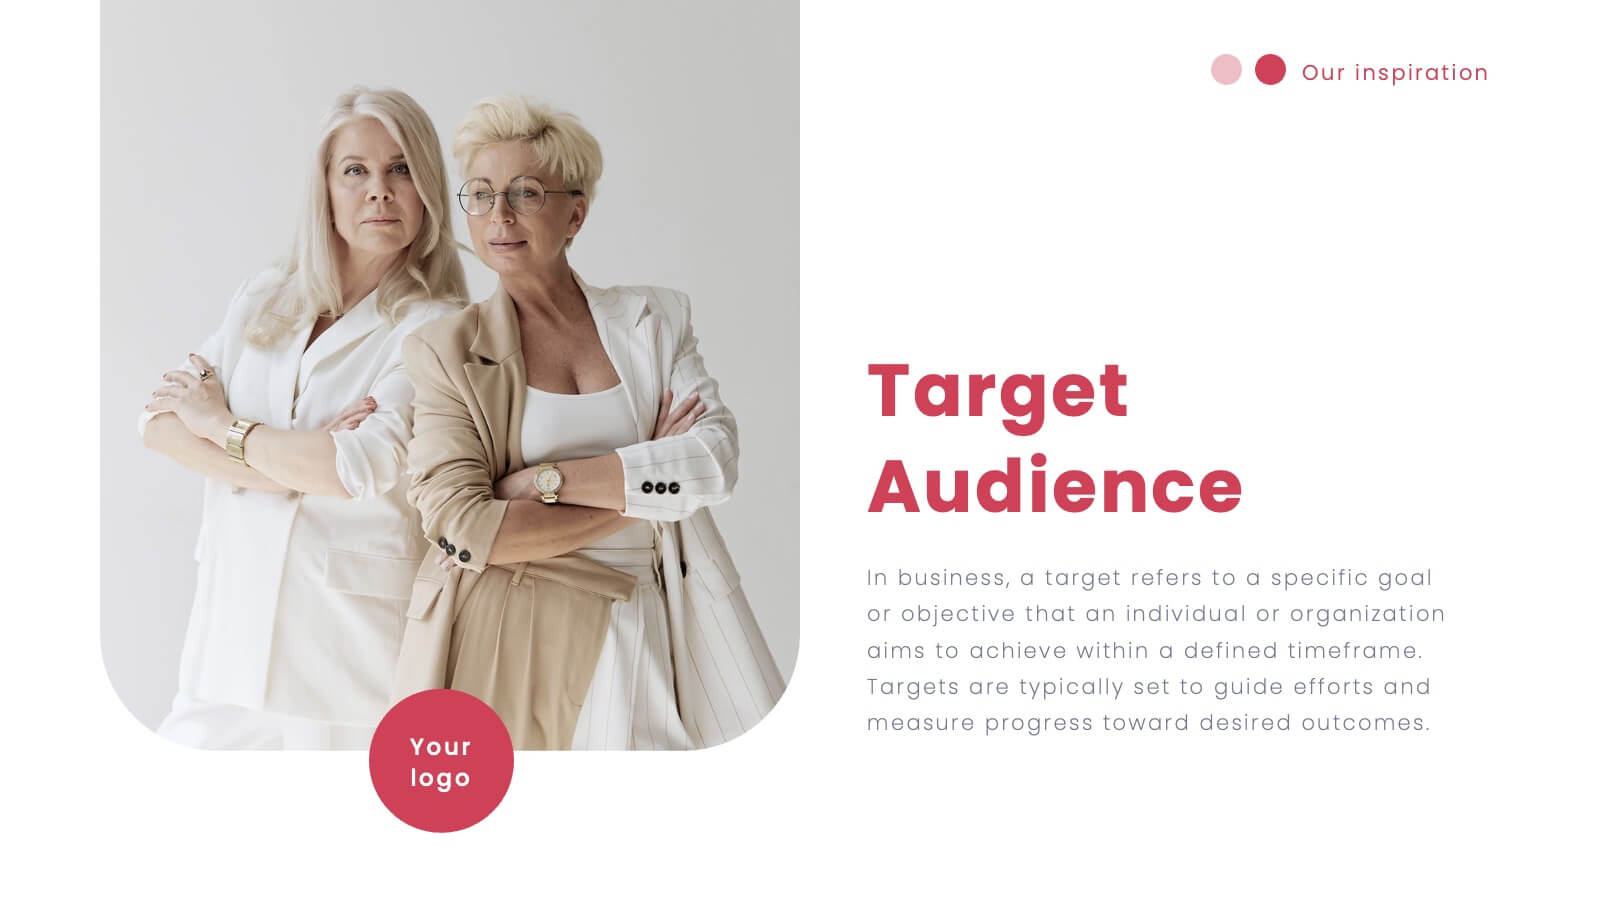
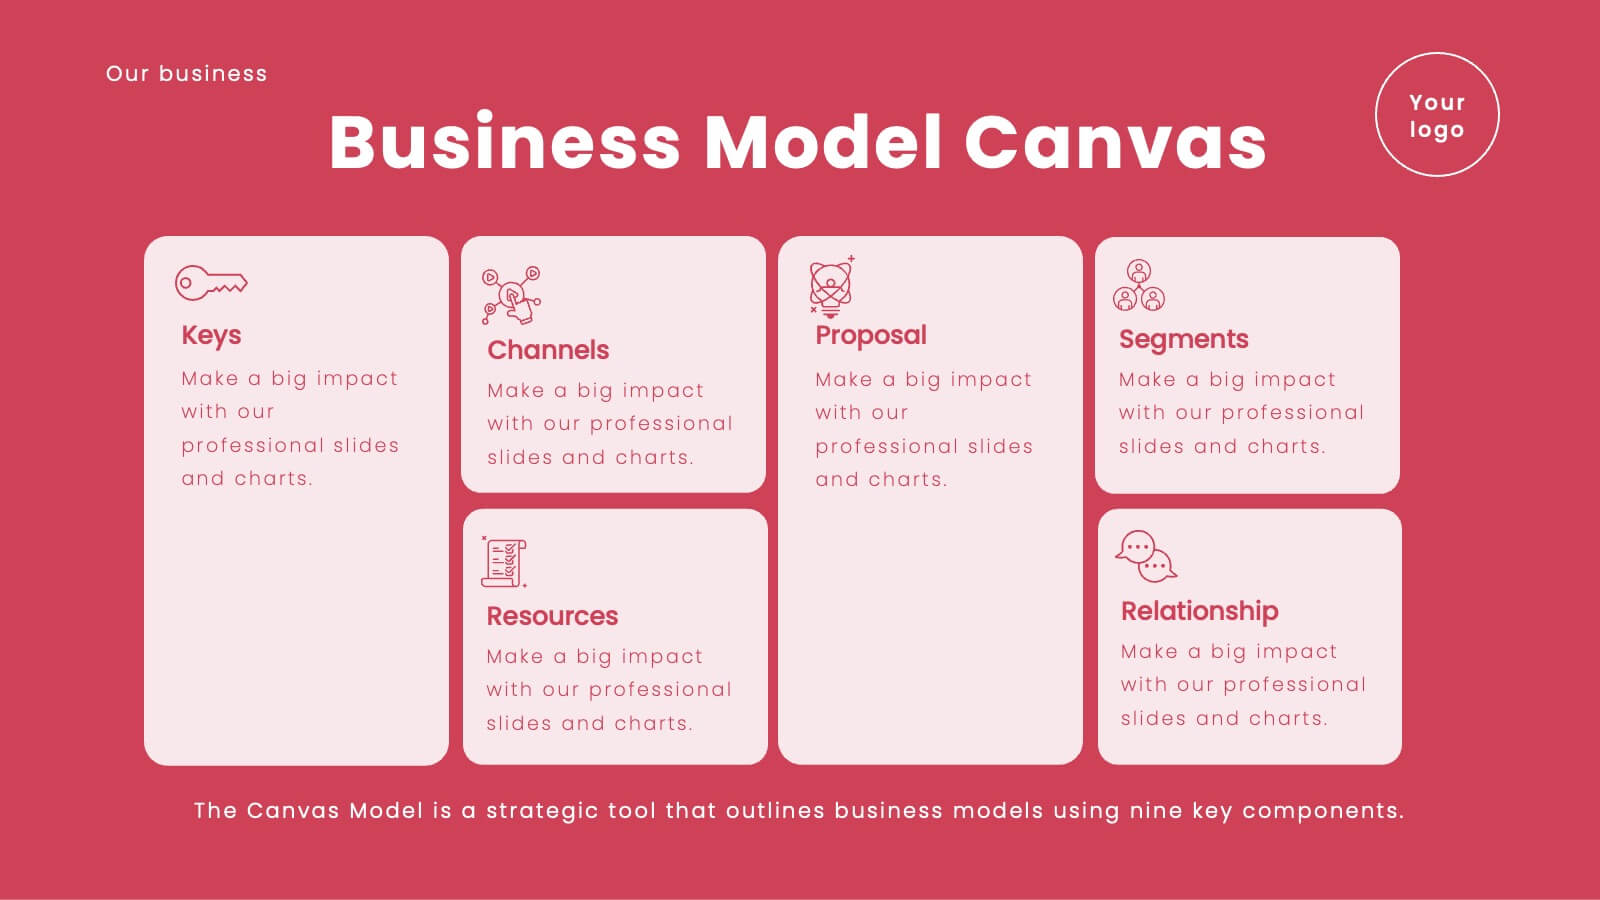
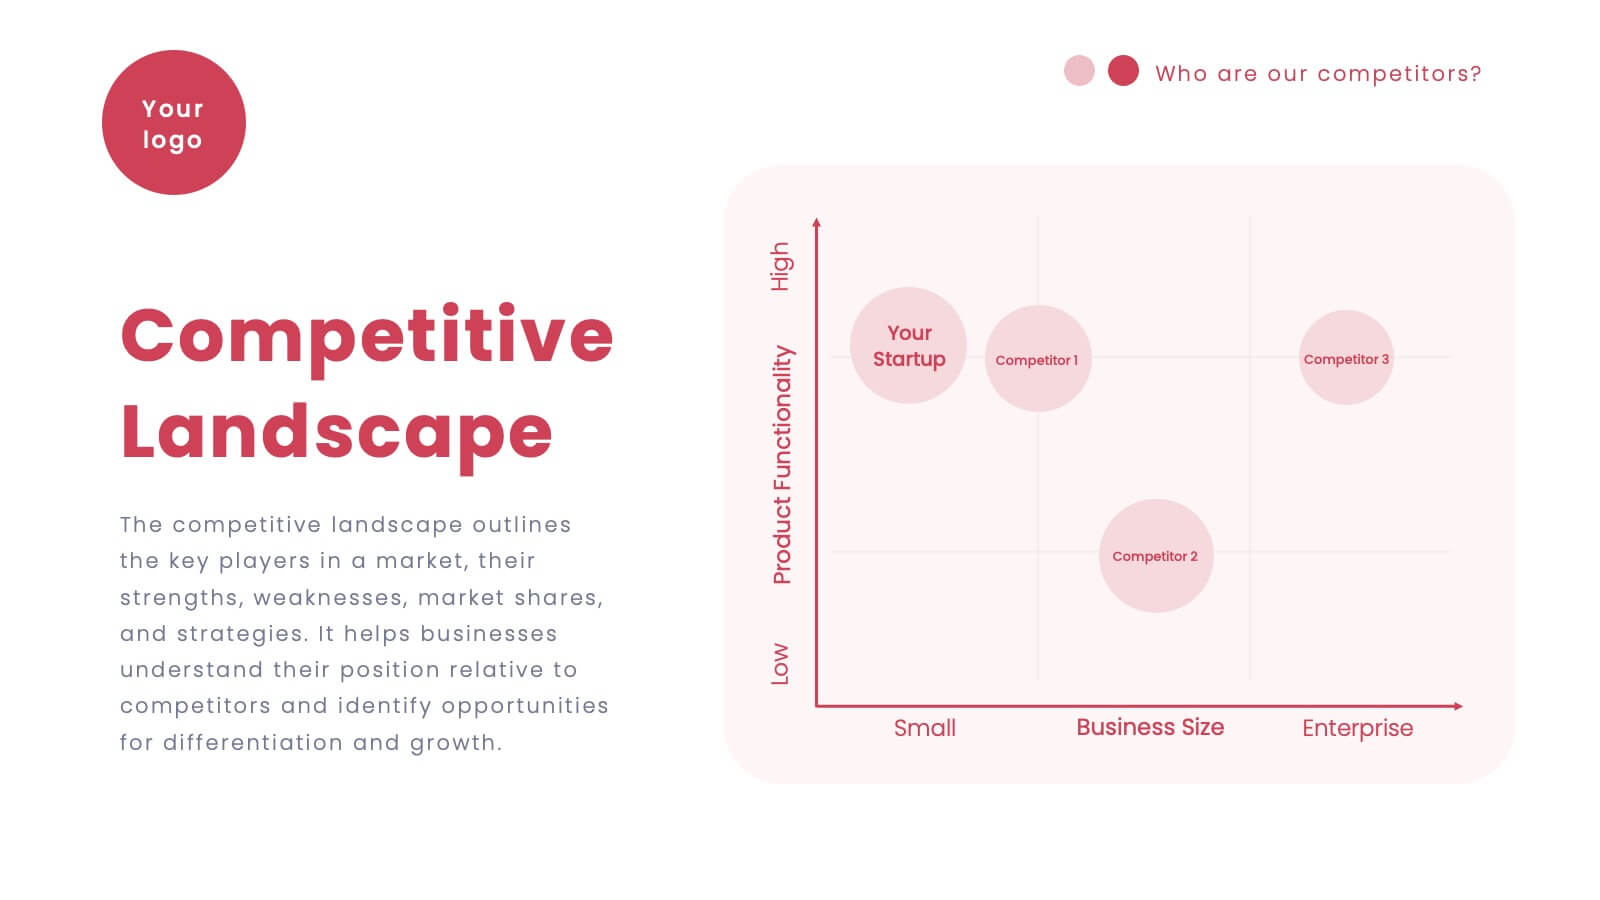
Launch your ideas into action with this vibrant red pitch deck template, designed to captivate and inform potential investors. It covers everything from company overview to financials and market strategy, ensuring your vision is communicated effectively. Compatible with PowerPoint, Google Slides, and Keynote, this template is perfect for startups seeking to impress and engage.


5 slides
Investment and Money Growth Strategies Presentation
Illustrate investment strategies and financial growth with this visually engaging presentation slide. Featuring growing money plant icons on financial podiums, this template helps showcase financial plans, savings growth, and ROI projections effectively. Customizable with editable text, colors, and graphics, it’s perfect for financial advisors, business presentations, and investment reports. Fully compatible with PowerPoint, Keynote, and Google Slides for seamless integration.


6 slides
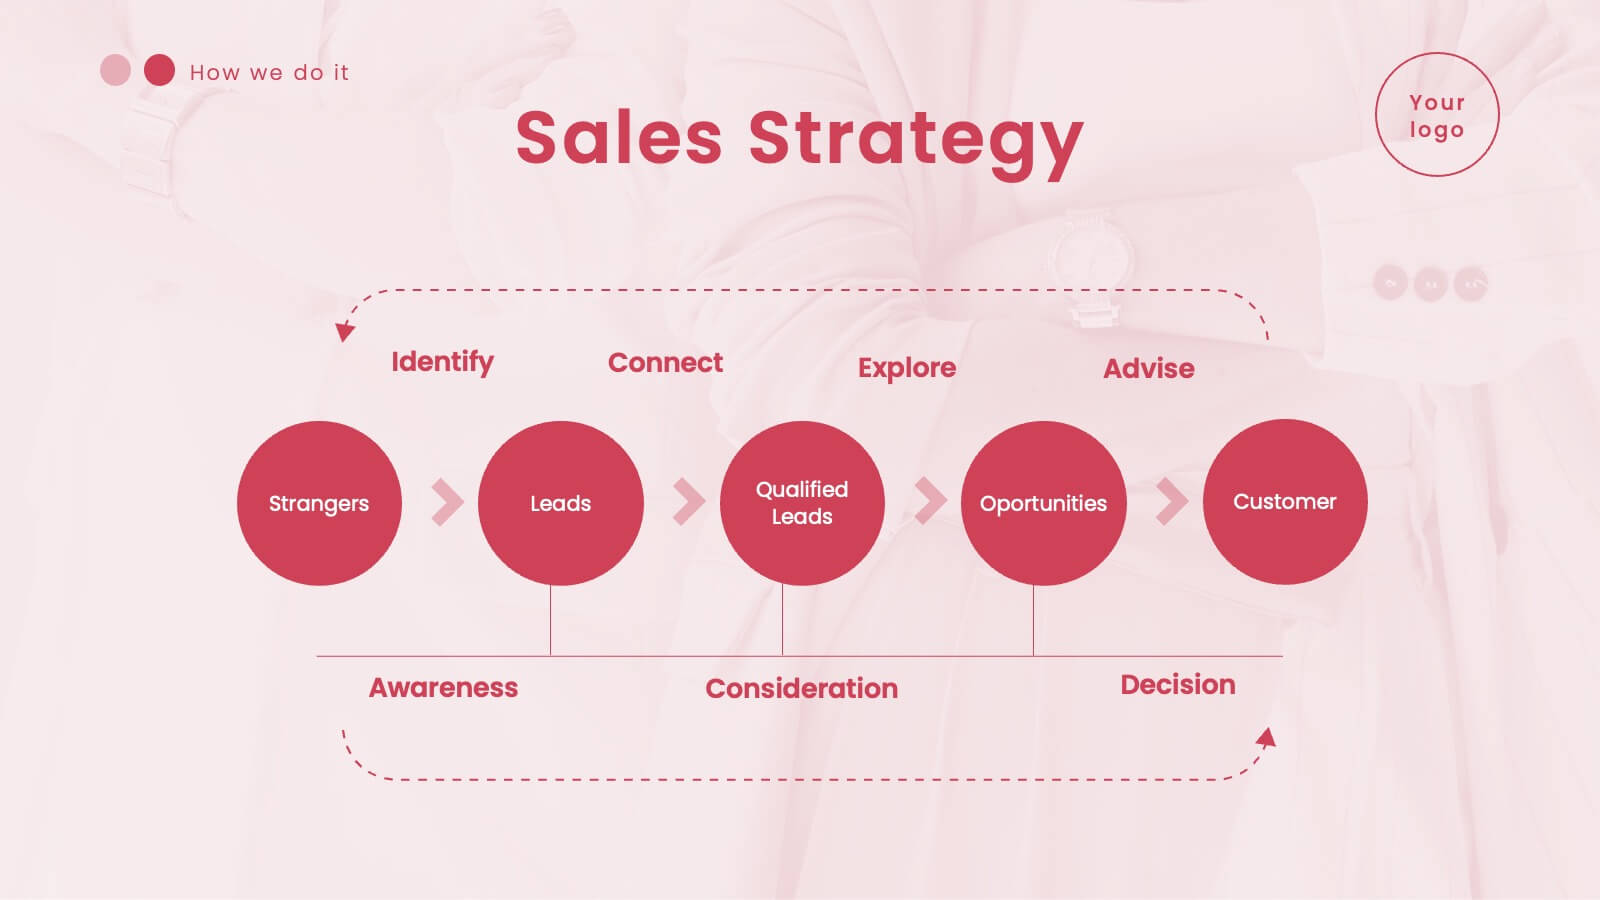
Customer Journey Management Infographic
Map out the customer's path to purchase with our intuitive Customer Journey Management Infographic, perfect for Powerpoint, Google Slides, and Keynote. This visual tool helps businesses understand and enhance the customer experience at every touchpoint. Highlight critical stages from awareness to advocacy with distinct, easy-to-follow layouts. Customize it to fit your brand’s journey, showcasing the interactions and emotions customers encounter. Ideal for marketing strategy sessions and client presentations, it simplifies complex consumer behavior into a clear, actionable pathway.


7 slides
RACI Matrix Process Infographic Presentation
A RACI matrix is a project management tool that is used to clarify and define roles and responsibilities for project tasks and deliverables. Use this template to help you quickly create RACI charts for your next project. Made up of strategic box with shapes, colors, numeric value and text boxes that can be edited easily. This Template is a multipurpose slide as it can be used to present data visually, build a discussion on the topic and influence your audience to take action. Save time and energy with this infographic template, compatible with Powerpoint, Keynote and Google Slides.


4 slides
Organizational Hierarchy Infographic
Showcase your team’s structure with a modern, photo-friendly hierarchy layout. This editable infographic is perfect for company overviews, team introductions, or org chart visualizations. Easily customizable in PowerPoint, Keynote, and Google Slides.


4 slides
Digital Education and Online Learning Tools Presentation
Bring your audience straight into the world of modern learning with a clear, engaging layout that highlights essential digital tools and online teaching methods. This presentation breaks down key platforms, features, and benefits in a simple visual flow that’s easy to follow. Fully compatible with PowerPoint, Keynote, and Google Slides.


5 slides
United States States Outline Presentation
Make your data pop with a vibrant, easy-to-read snapshot of U.S. state insights. This presentation helps you highlight regional trends, compare performance, and showcase key information using a clean state-by-state outline. Perfect for reports, geography topics, or analytics. Fully compatible with PowerPoint, Keynote, and Google Slides.


8 slides
Air Travel Safety and Operations Presentation
Capture your audience’s attention with this aviation window-inspired layout, designed to visualize safety protocols or operational steps in air travel. Featuring four distinct segments arranged like a view through a plane window, it’s ideal for airline safety briefings, operational workflows, or compliance overviews. Fully editable in PowerPoint, Keynote, and Google Slides.


8 slides
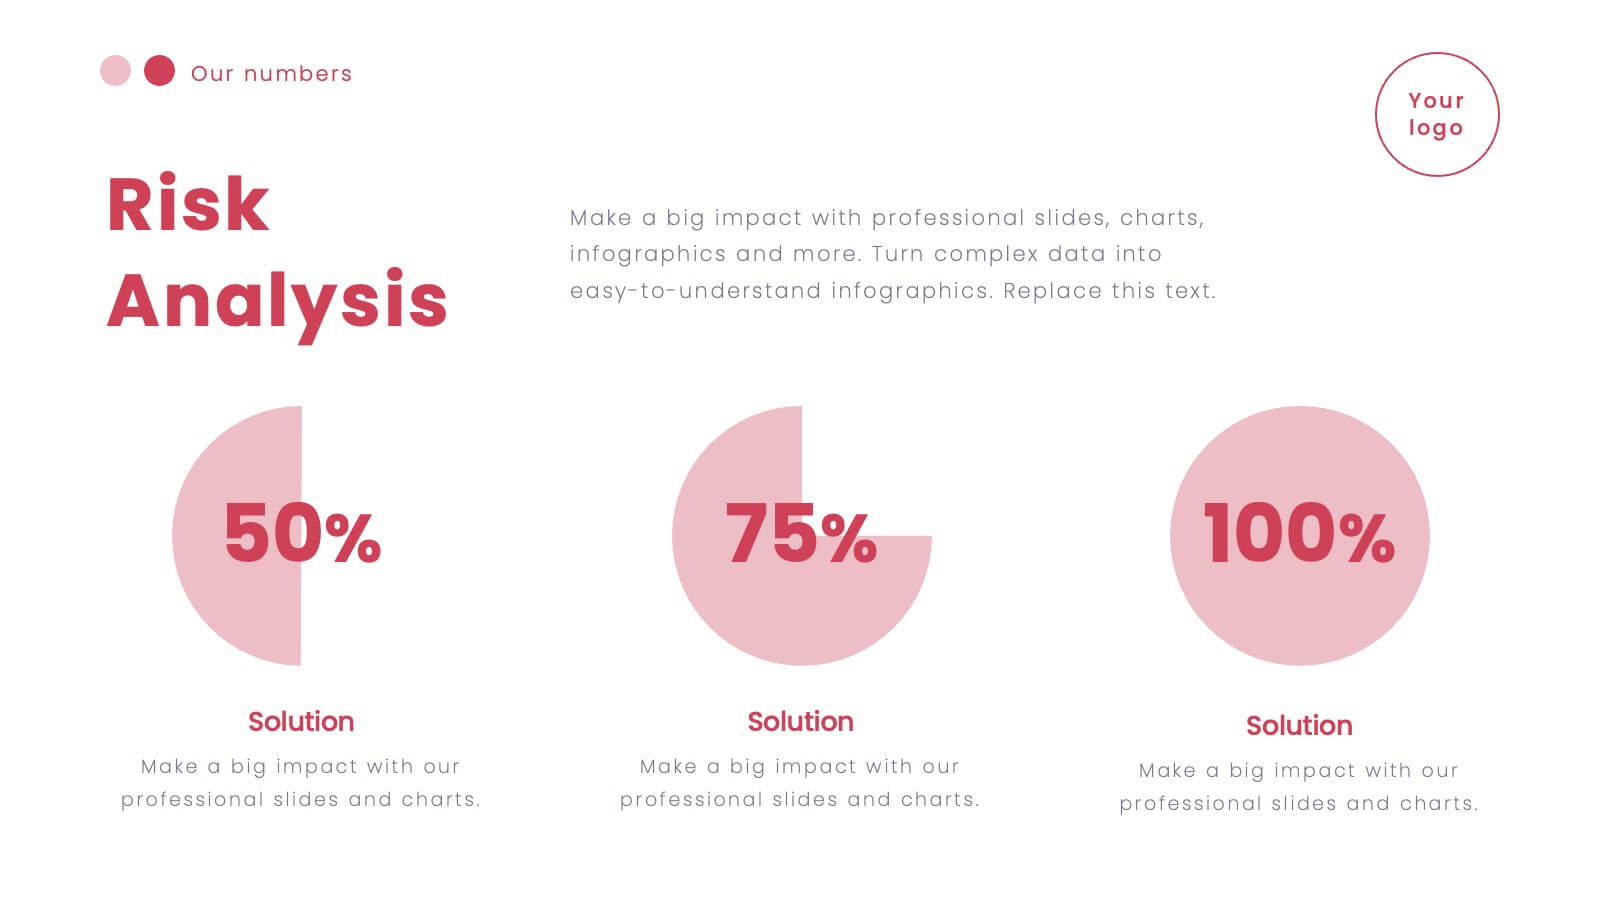
Risk Analysis Bowtie Diagram
Clarify your risk management strategy with the Risk Analysis Bowtie Diagram Presentation. This visual framework helps you analyze causes and consequences of a hazardous event using the bowtie model. The left side details potential causes and preventive controls, while the right outlines possible consequences and mitigating defenses. With bold "Before" and "After" labels, this slide makes complex risk pathways easy to understand. Fully editable in PowerPoint, Keynote, and Google Slides, with multiple highlighting variations to focus on either threats or outcomes.


7 slides
National Survey Results Infographics
Survey Results can provide valuable insights and data that can be used to make informed decisions, improve offerings, and stay ahead of the competition. This survey results template features a clean design and is a completely customizable presentation that allows you to easily change the colors, fonts and graphics. You can use this infographic as a tool to insert into your product and marketing presentations. This presentation is compatible with Powerpoint, Keynote and Google Slides. Simply add your information and have it customized with your text and chart options to suit your needs.


7 slides
Industrial Safety Infographic
Industrial safety, also known as occupational safety, pertains to the management of processes and conditions within industrial settings to ensure the safety, health, and well-being of workers and the general public. This impactful infographic template encapsulates the essentials for fostering a secure and hazard-free industrial environment. Compatible with Powerpoint, Keynote, and Google Slides. The customizable set of icons represents emergency response actions, underlining the need for rapid and efficient responses in critical situations. Build a foundation of safety that fosters a secure and thriving work environment.


4 slides
Financial Budget Forecasting
Visualize your budget like never before with this clean, data-friendly layout designed to simplify your forecasting. The infographic-style graphics help break down financial estimates, expenses, and revenue projections into clear sections, making it ideal for reports or investor meetings. Compatible with PowerPoint, Keynote, and Google Slides.


5 slides
End-to-End Process Flow Framework Presentation
Visualize your operations from start to finish with the End-to-End Process Flow Framework Presentation. This clean, arrow-based layout is perfect for outlining workflows, project stages, or business processes step by step. Fully customizable in Canva, PowerPoint, and Google Slides to suit any team or strategic need.