


Features
- 12 Unique slides
- Fully editable and easy to edit in Microsoft Powerpoint, Keynote and Google Slides
- 16:9 widescreen layout
- Clean and professional designs
- Export to JPG, PDF or send by email


Do you have any questions?
Recommend


6 slides
Virtual Collaboration for Remote Teams
Make teamwork flow from anywhere with this streamlined roadmap-style layout built for remote collaboration. Designed to visualize communication stages, key roles, or workflow steps, this template helps virtual teams stay aligned and productive—no matter where they are. Fully compatible with PowerPoint, Keynote, and Google Slides.


5 slides
Teaching Strategy for Classrooms Presentation
Make classroom planning more engaging with the Teaching Strategy for Classrooms Presentation. This stacked book-style layout is ideal for outlining instructional steps, lesson phases, or teaching priorities. Perfect for teachers, education trainers, or curriculum planners. Fully editable in PowerPoint, Keynote, Canva, and Google Slides.


26 slides
Market Growth Tactics Presentation
Chart a path to success with our Market Growth Tactics presentation template, designed for seamless use in PowerPoint, Keynote, and Google Slides. This template is a vital asset for business strategists, marketing professionals, and consultants who aim to drive growth and capture market share. Our Market Growth Tactics template lays out a strategic framework for identifying and leveraging growth opportunities. It provides a comprehensive array of slides to showcase market analysis, competitive landscape, growth strategies, and execution plans. With customizable elements, you can tailor your presentation to reflect specific market insights and growth targets relevant to your audience. The template is crafted to facilitate clear communication of complex growth strategies, breaking them down into actionable steps with the aid of charts, graphs, and infographics. This helps to convey your message effectively, ensuring that your audience can visualize the growth journey and understand the tactics involved. Elevate your market growth presentations and become an authoritative voice in your industry with our SEO-optimized template, designed to engage, inform, and inspire action towards market expansion.


6 slides
Asia Colonization Map Infographics
Discover the versatility of our Asia Colonization Map infographic template, a powerful tool for visualizing the historical impact of colonization across the diverse continent of Asia. This template is fully compatible with popular presentation software like PowerPoint, Keynote, and Google Slides, enabling effortless customization to suit your specific needs. The Asia Colonization Map infographic template offers a robust foundation for illustrating colonization timelines, colonial powers, and regions affected by colonization throughout Asia's rich history. Whether you're a historian, educator, or simply intrigued by Asia's colonial past, this template provides a user-friendly platform to create engaging presentations and informative materials. Impress your audience with this SEO-optimized Asia Colonization Map infographic template, expertly designed for clarity and ease of use. Tailor it to showcase the historical narratives, impact, and legacies of colonization in Asia, making it a valuable asset for your projects and presentations. Start crafting your personalized infographic today!


5 slides
Mental Health Disorders Infographics
Mental Health Disorder Infographics play a crucial role in raising awareness, combating misinformation, and advocating for better mental health support. These Infographics are visual representations of information about mental health disorders. They include statistics, images, and text to provide information on the prevalence of these disorders, common symptoms, risk factors, and available treatments. These infographics are designed with the goal to raise awareness about mental health disorders and to help people better understand and identify the signs and symptoms of these conditions.


5 slides
Investor-Ready Business Pitch Plan Presentation
Make your business roadmap stand out with this dynamic visual journey, perfect for impressing investors from the first slide. This infographic-style pitch deck helps clearly outline your business strategy across five milestones, using vibrant colors and icons for easy comprehension. Fully compatible with PowerPoint, Keynote, and Google Slides.


4 slides
Value Creation Strategy Presentation
Develop impactful strategies with this Value Creation Strategy template. Designed to visualize key business components, it presents a structured approach to innovation, growth, and market positioning. Ideal for corporate planning and investor presentations, this template is fully compatible with PowerPoint, Keynote, and Google Slides for effortless customization.


5 slides
Benefits of Insurance Infographics
The purpose of insurance is to mitigate the financial impact of unexpected events or circumstances that may result in financial loss. These infographic templates are versatile and effective tools to convey the value of insurance to your audience. These are perfect to highlight the various advantages and importance of having insurance coverage. This serves as an engaging tool to educate and inform your audience about the benefits of different types of insurance policies. This makes it easy for viewers to understand the benefits and importance of insurance in various aspects of life. Compatible with Powerpoint, Keynote, and Google Slides.


8 slides
Monthly and Weekly Planning Calendar Presentation
Stay ahead of your schedule with this all-in-one monthly and weekly planner template. Designed for professionals and teams who need to balance long-term goals with daily priorities, this presentation offers a 6-week overview, to-do list, notes section, and weekday breakdown. With sleek color-coded tabs and editable labels, it’s perfect for time-blocking, campaign tracking, or event coordination. Easily customizable in PowerPoint, Keynote, and Google Slides.


2 slides
Modern Business Cover Slide Presentation
Stand out with this bold and contemporary cover slide. The layout features dynamic geometric shapes and an integrated photo section, perfect for making a memorable first impression. Whether you're presenting to clients or stakeholders, this slide combines style and structure to deliver your brand message clearly. Fully customizable and easy to edit in PowerPoint, Keynote, and Google Slides.


20 slides
Nightshade Design Portfolio Presentation
The Design Portfolio Presentation Template offers 20 slides to showcase your creative work, including design briefs, elements, processes, and feedback. Perfect for professionals to highlight projects with a modern, vibrant layout. Fully editable and compatible with PowerPoint, Keynote, and Google Slides.


21 slides
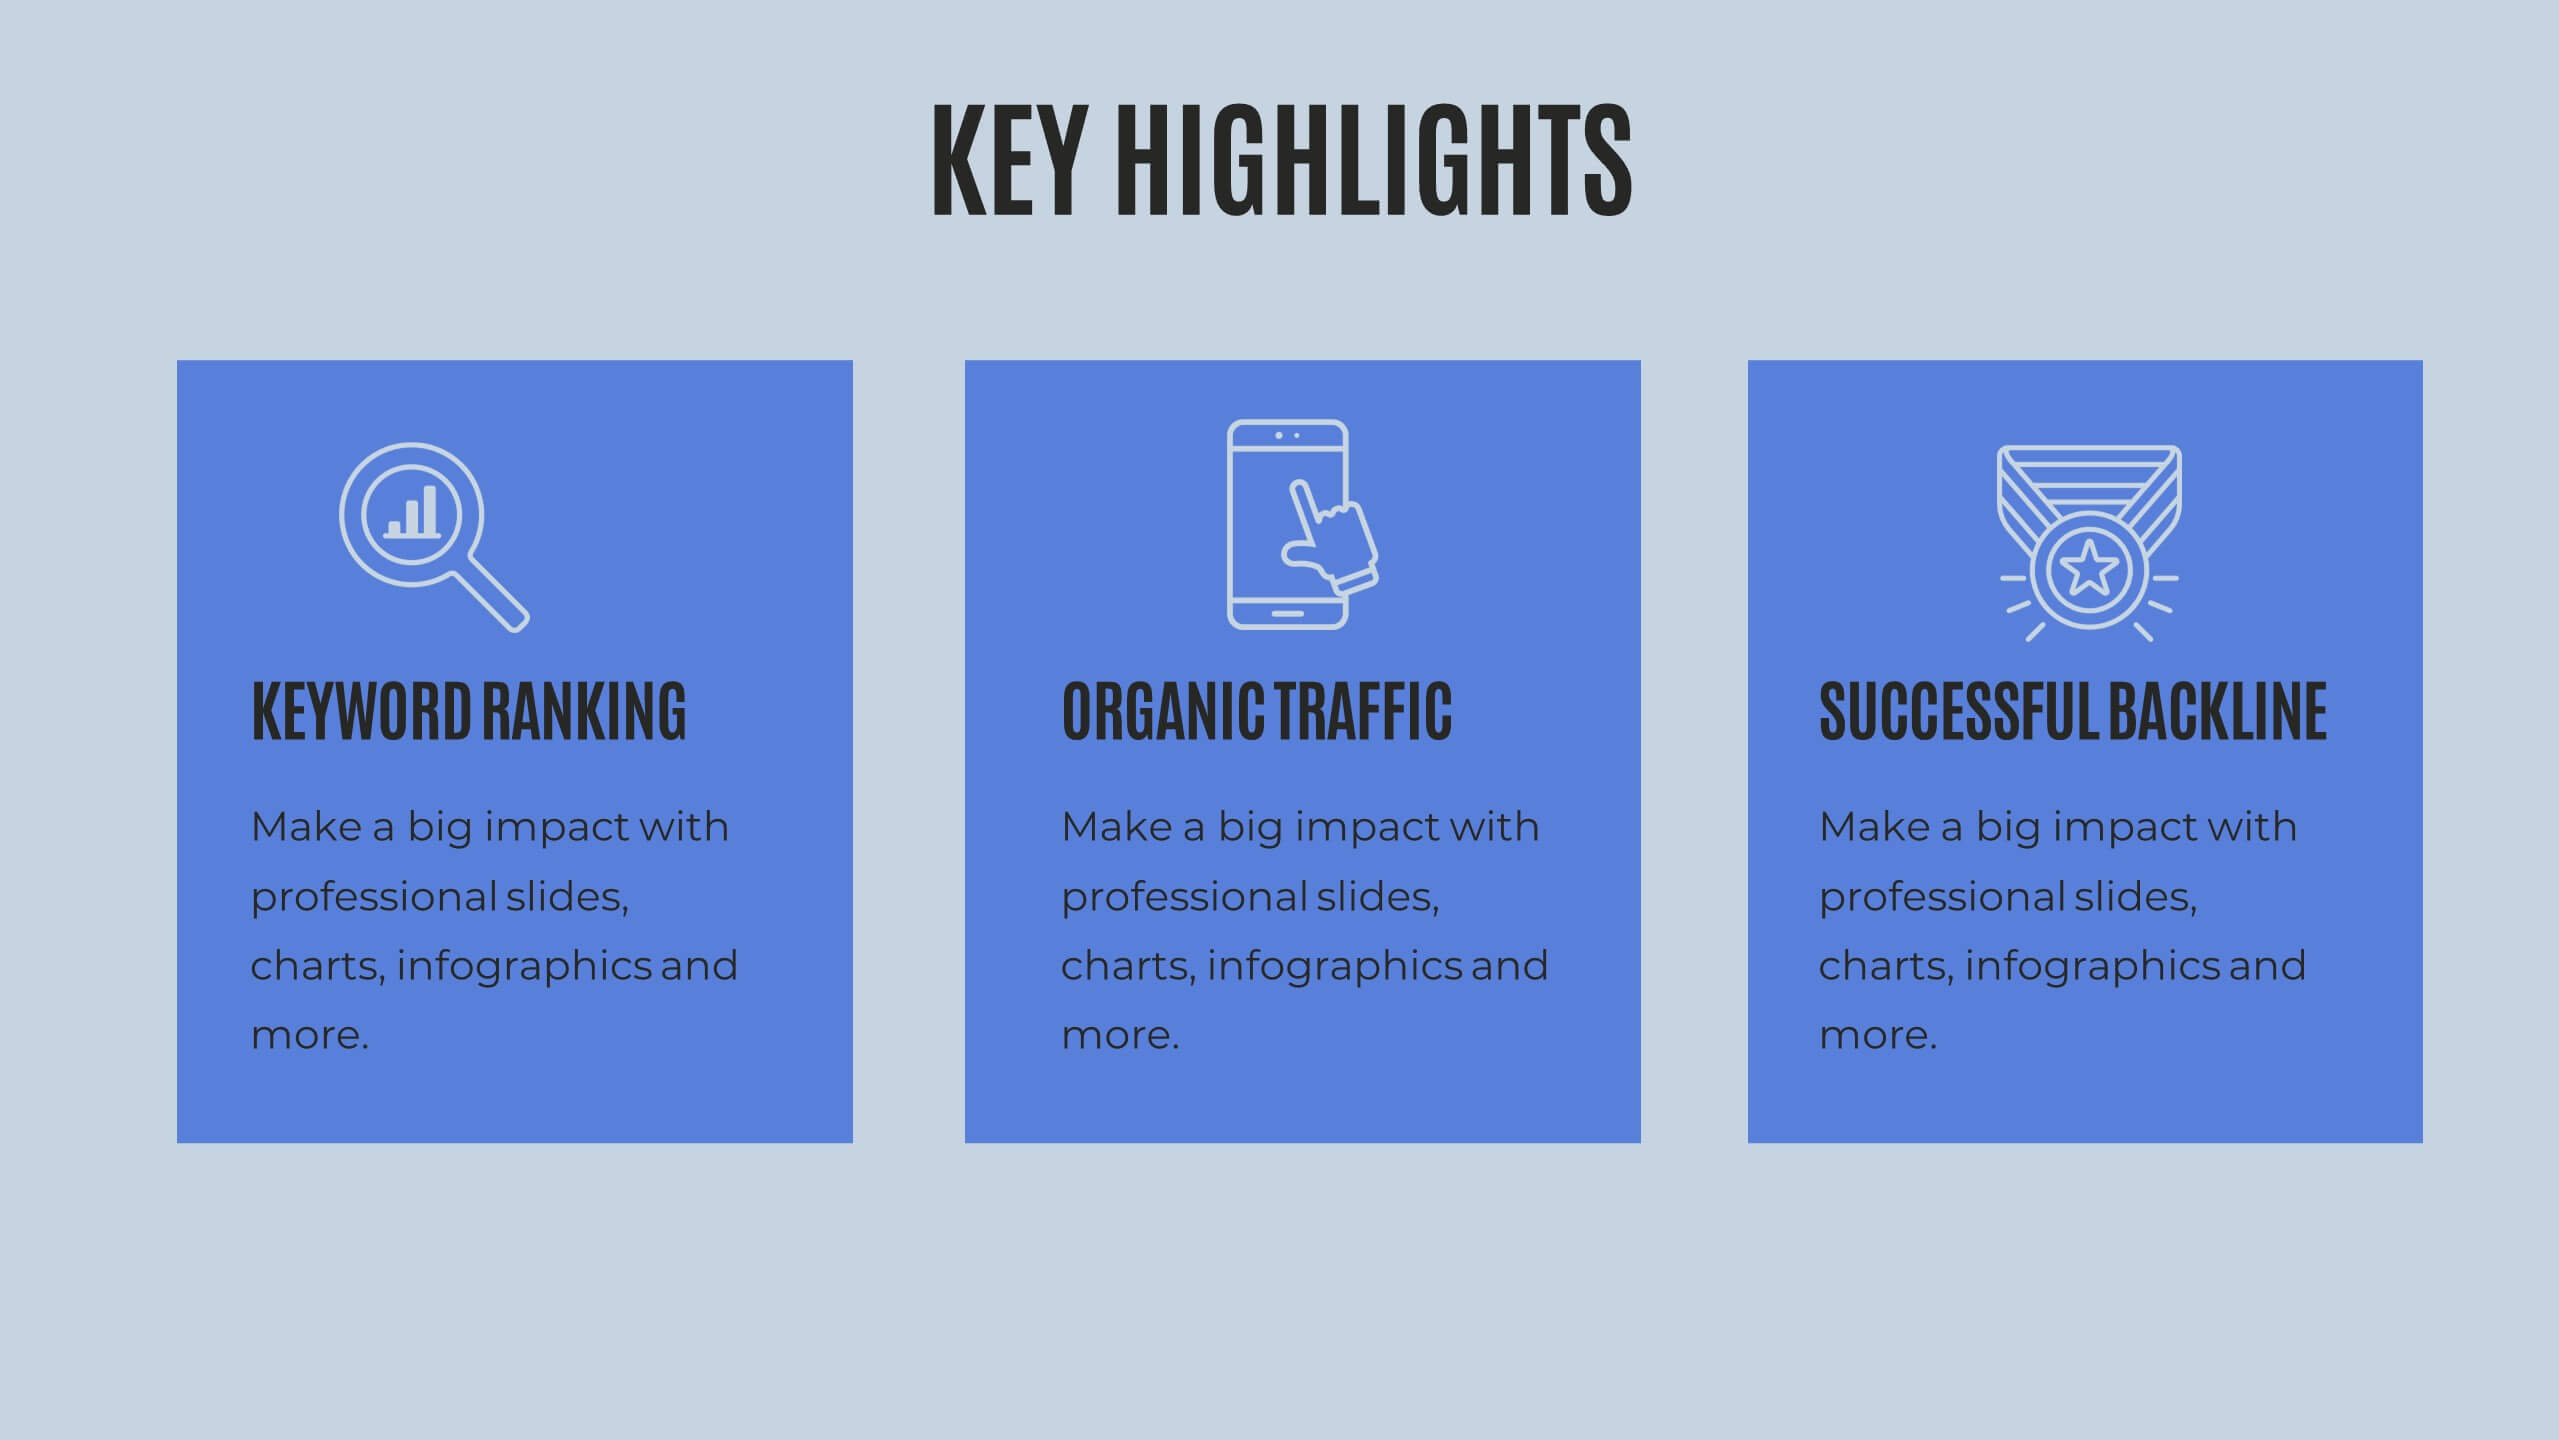
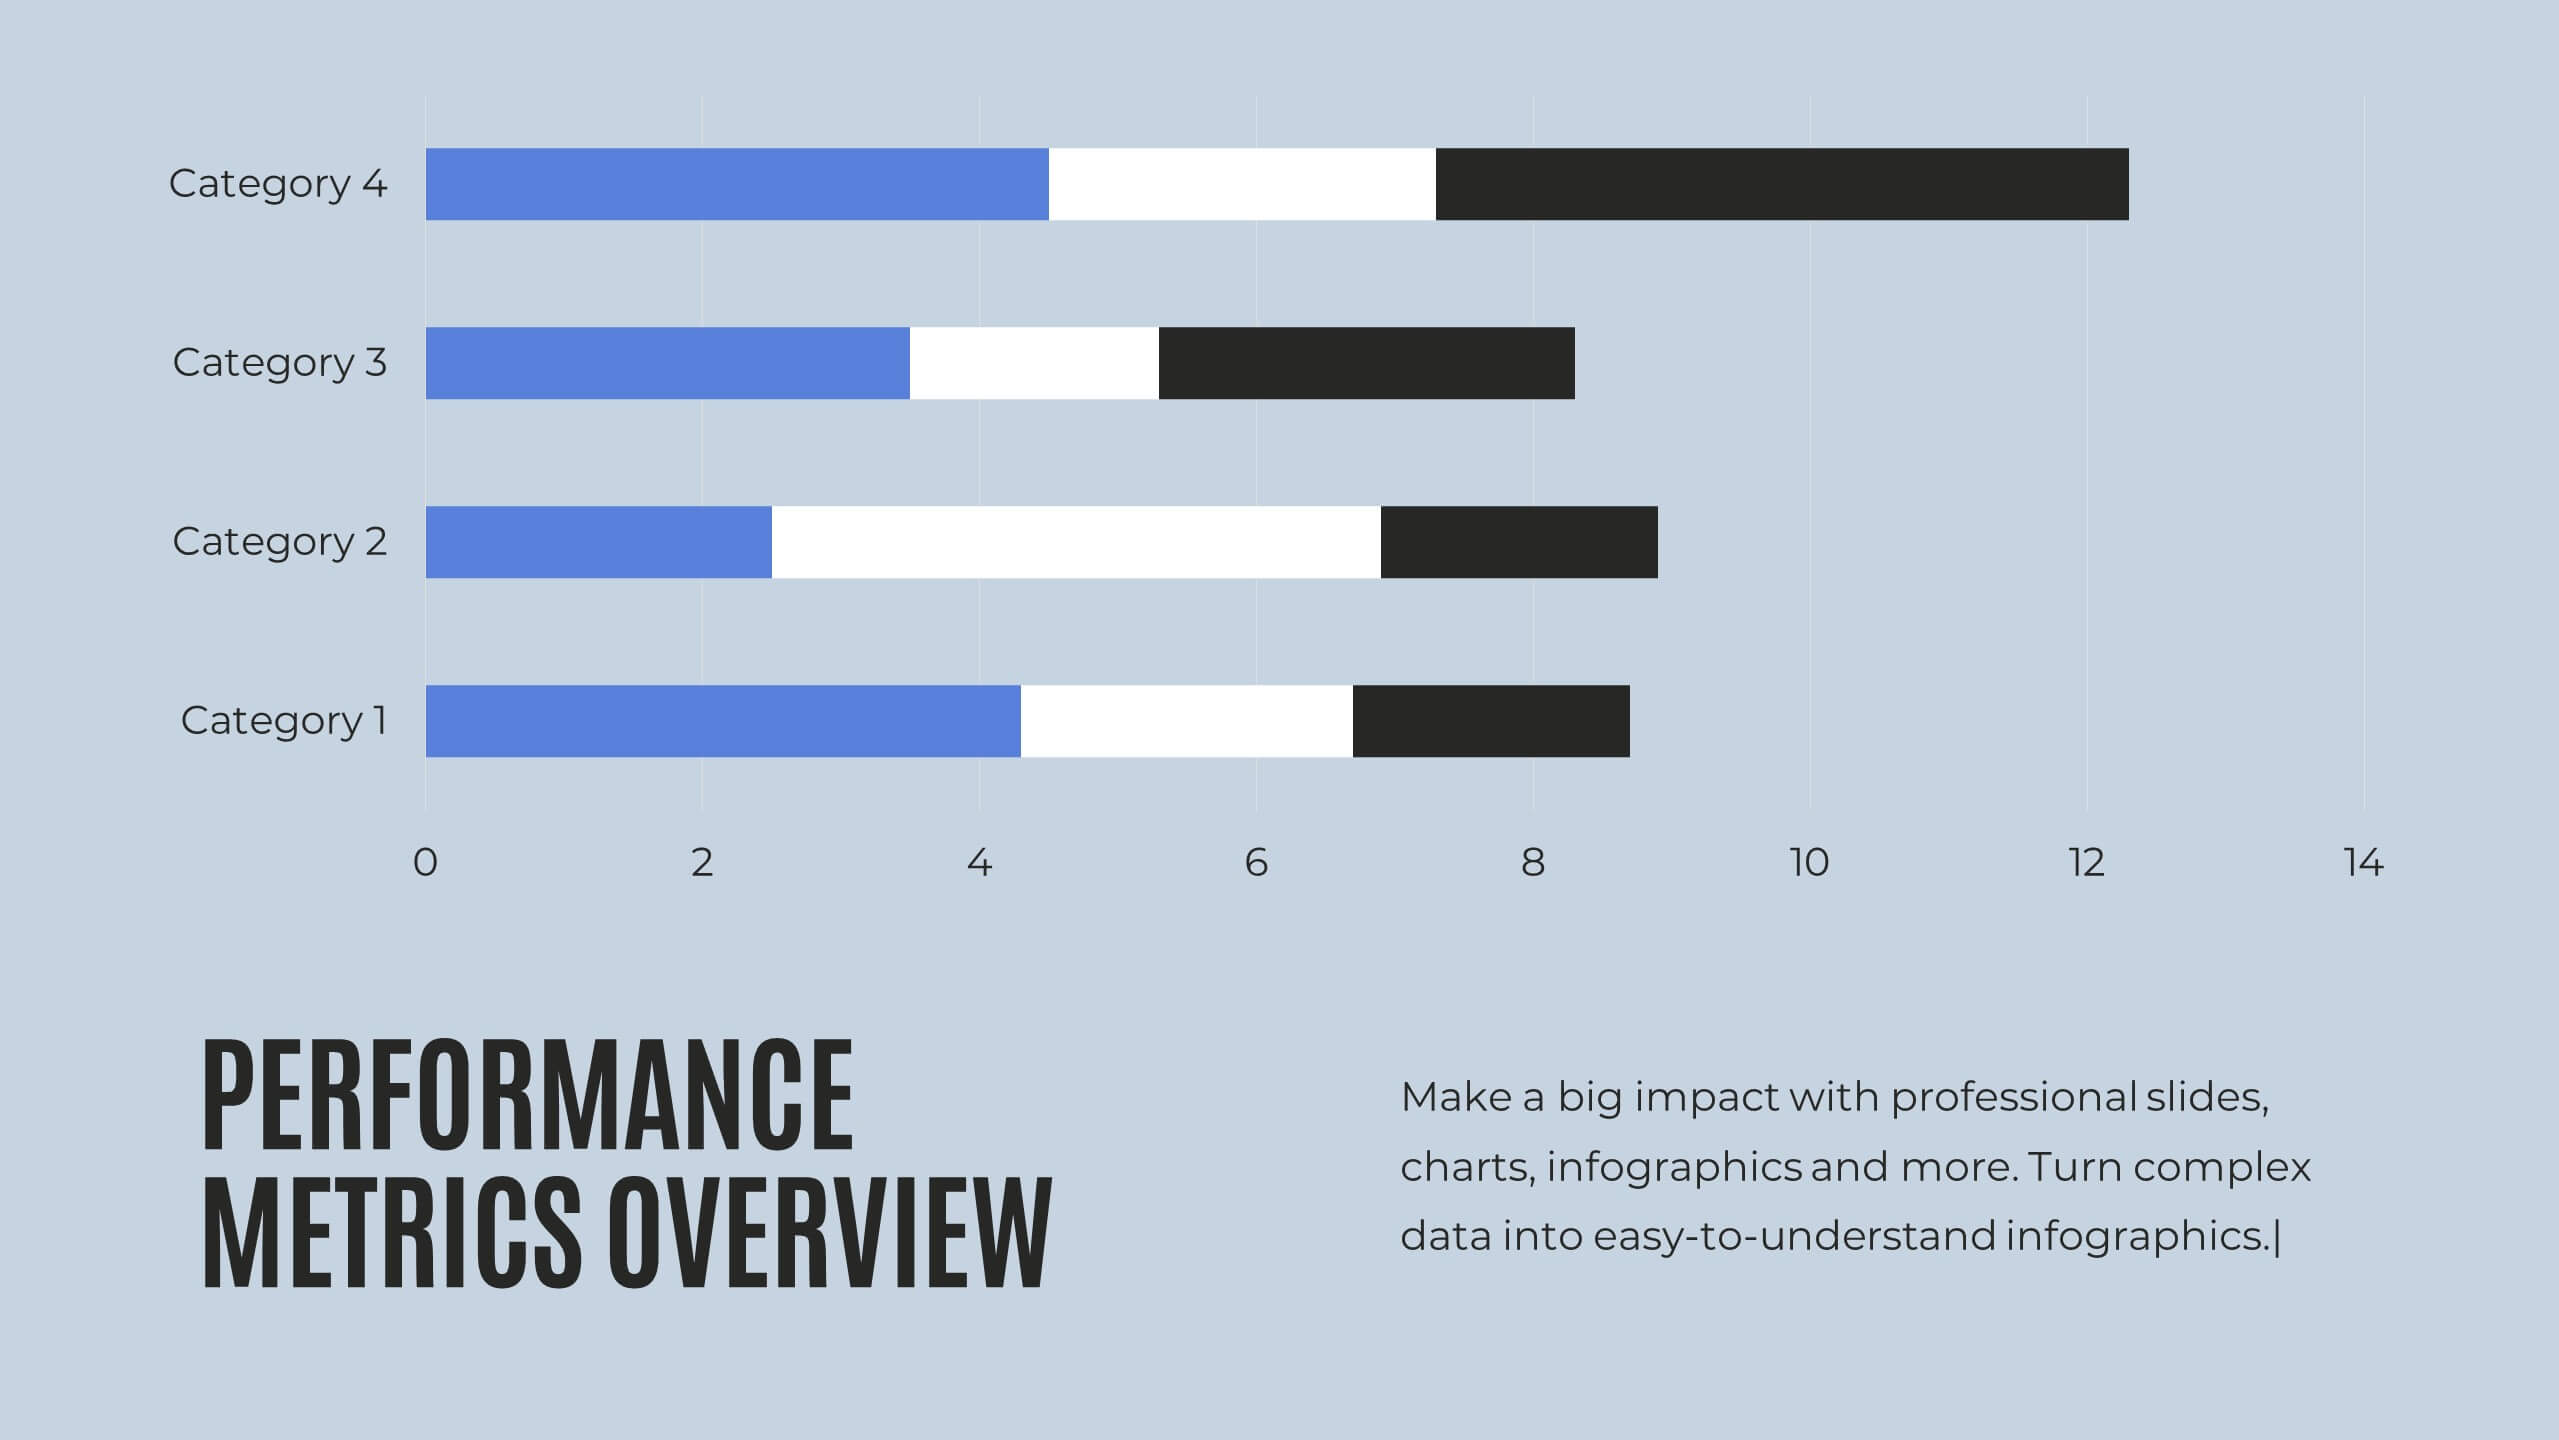
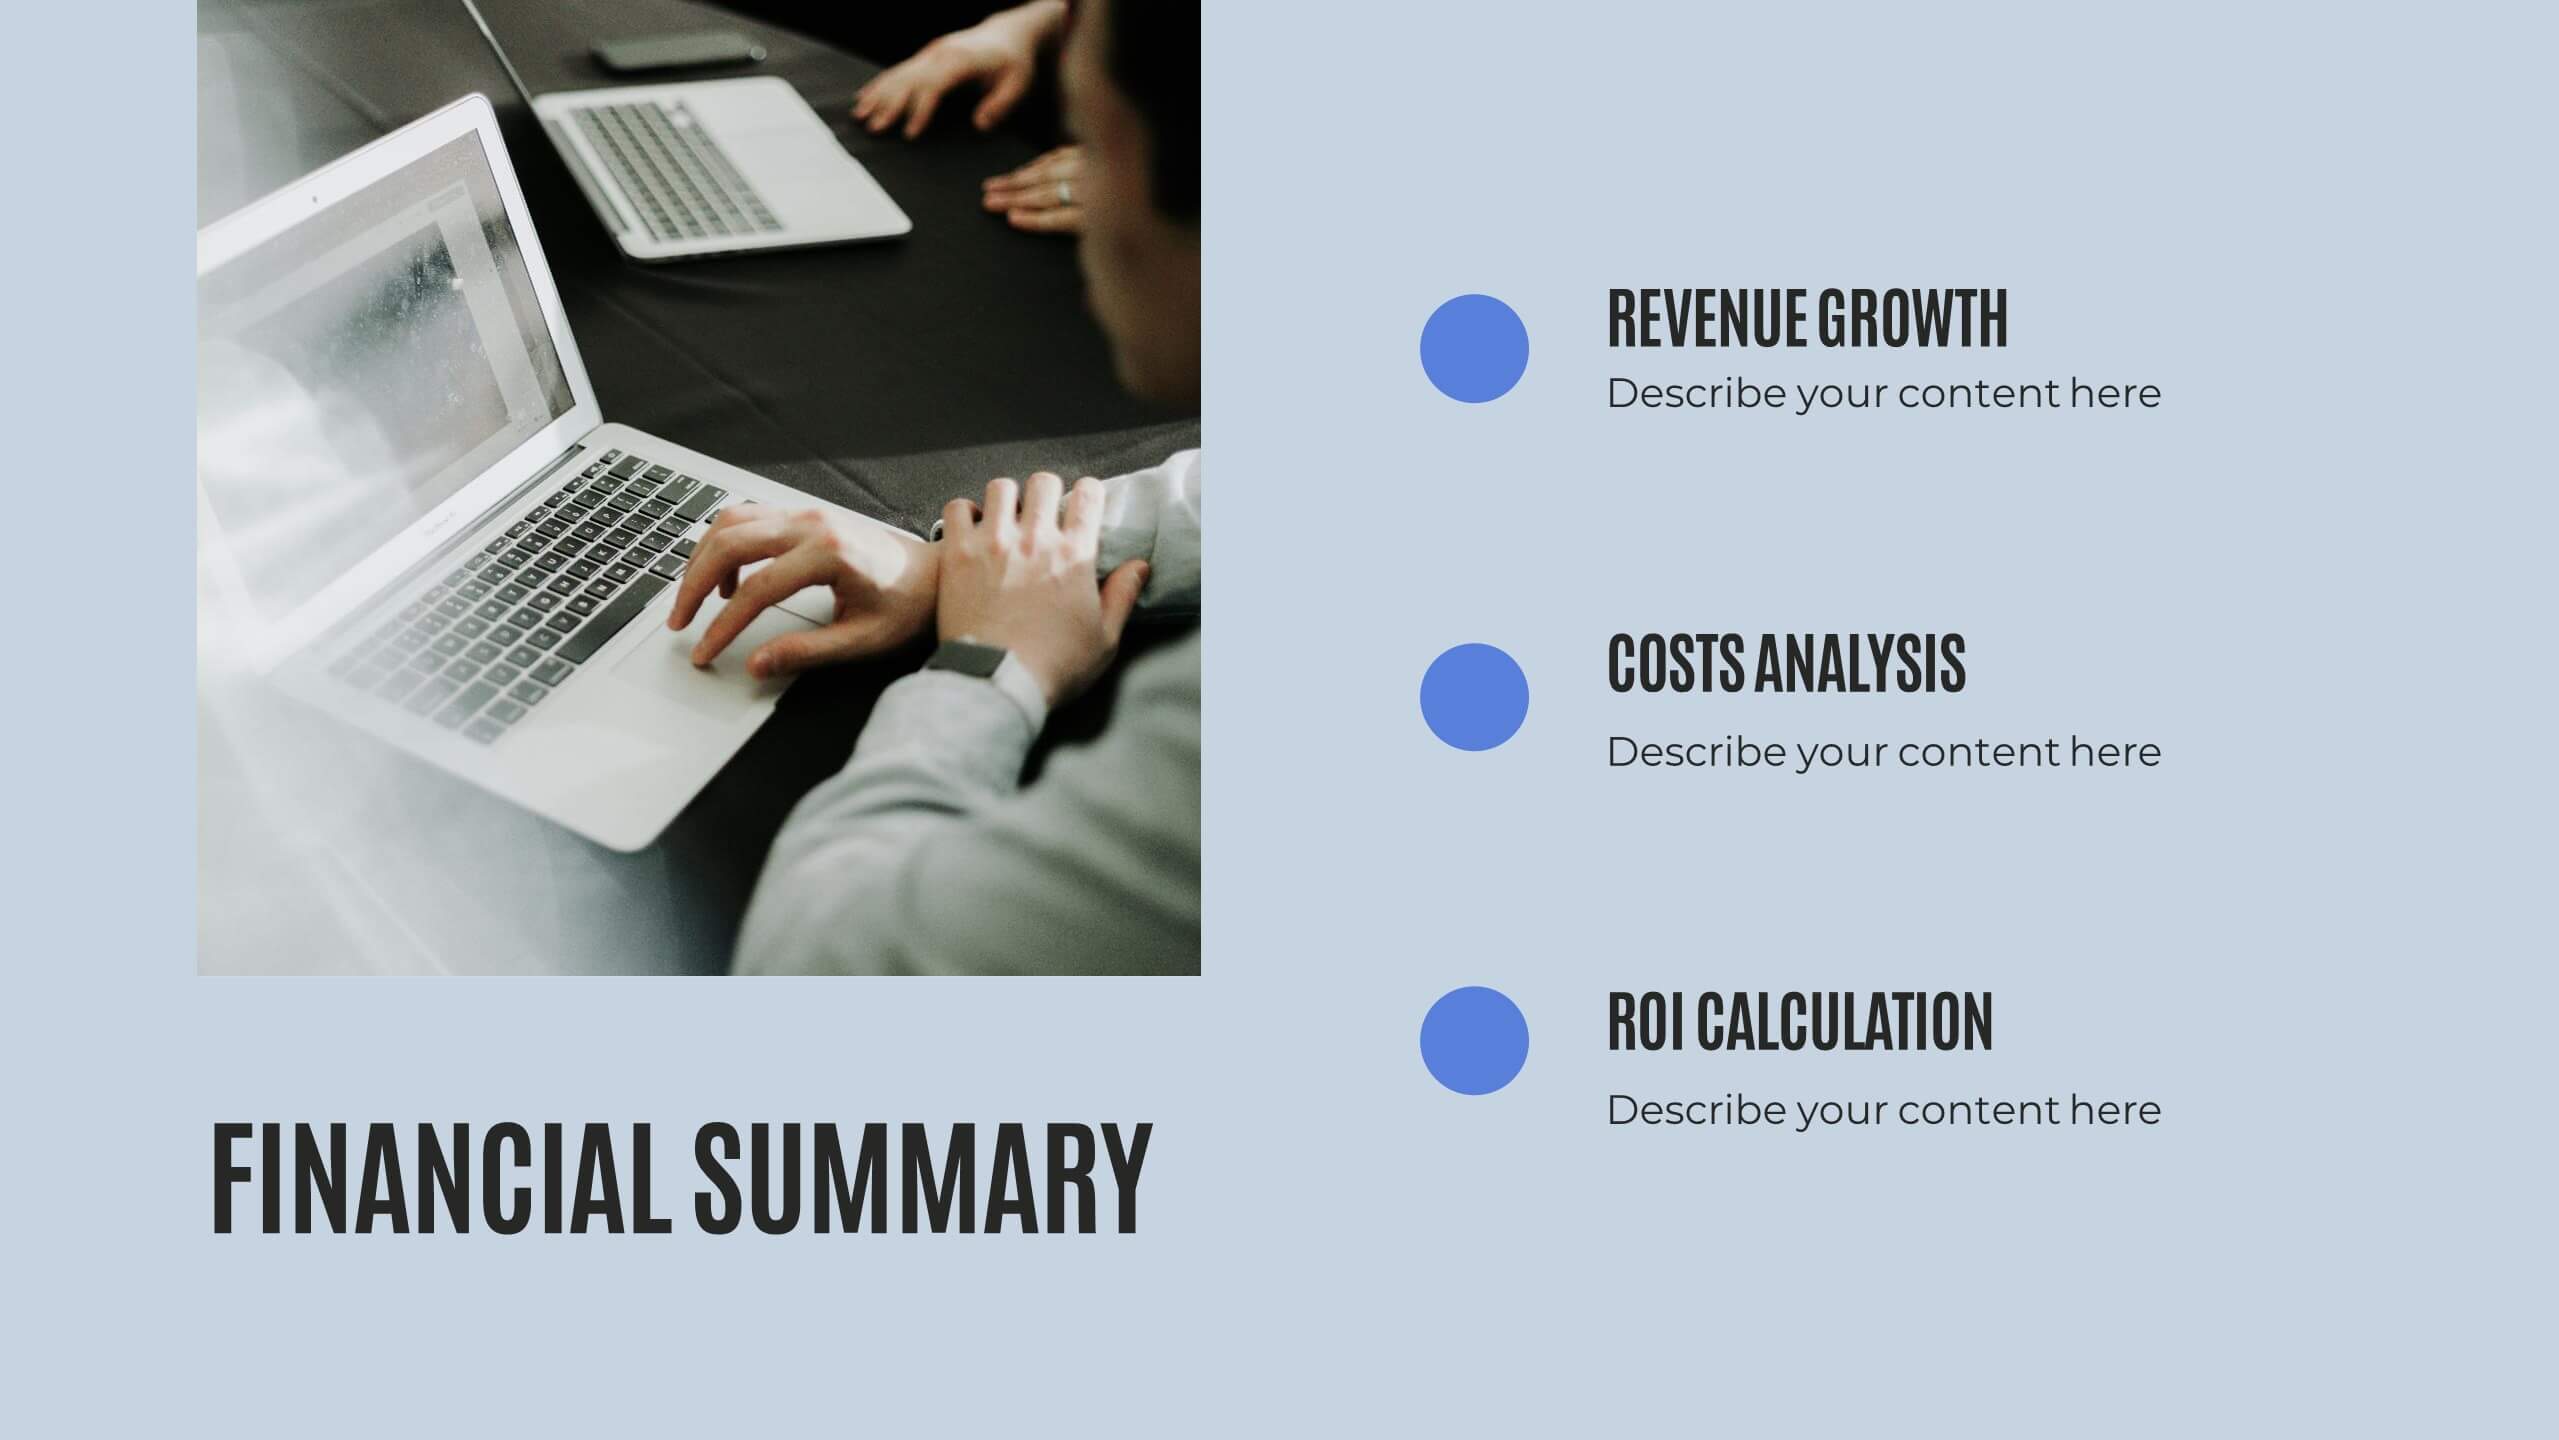
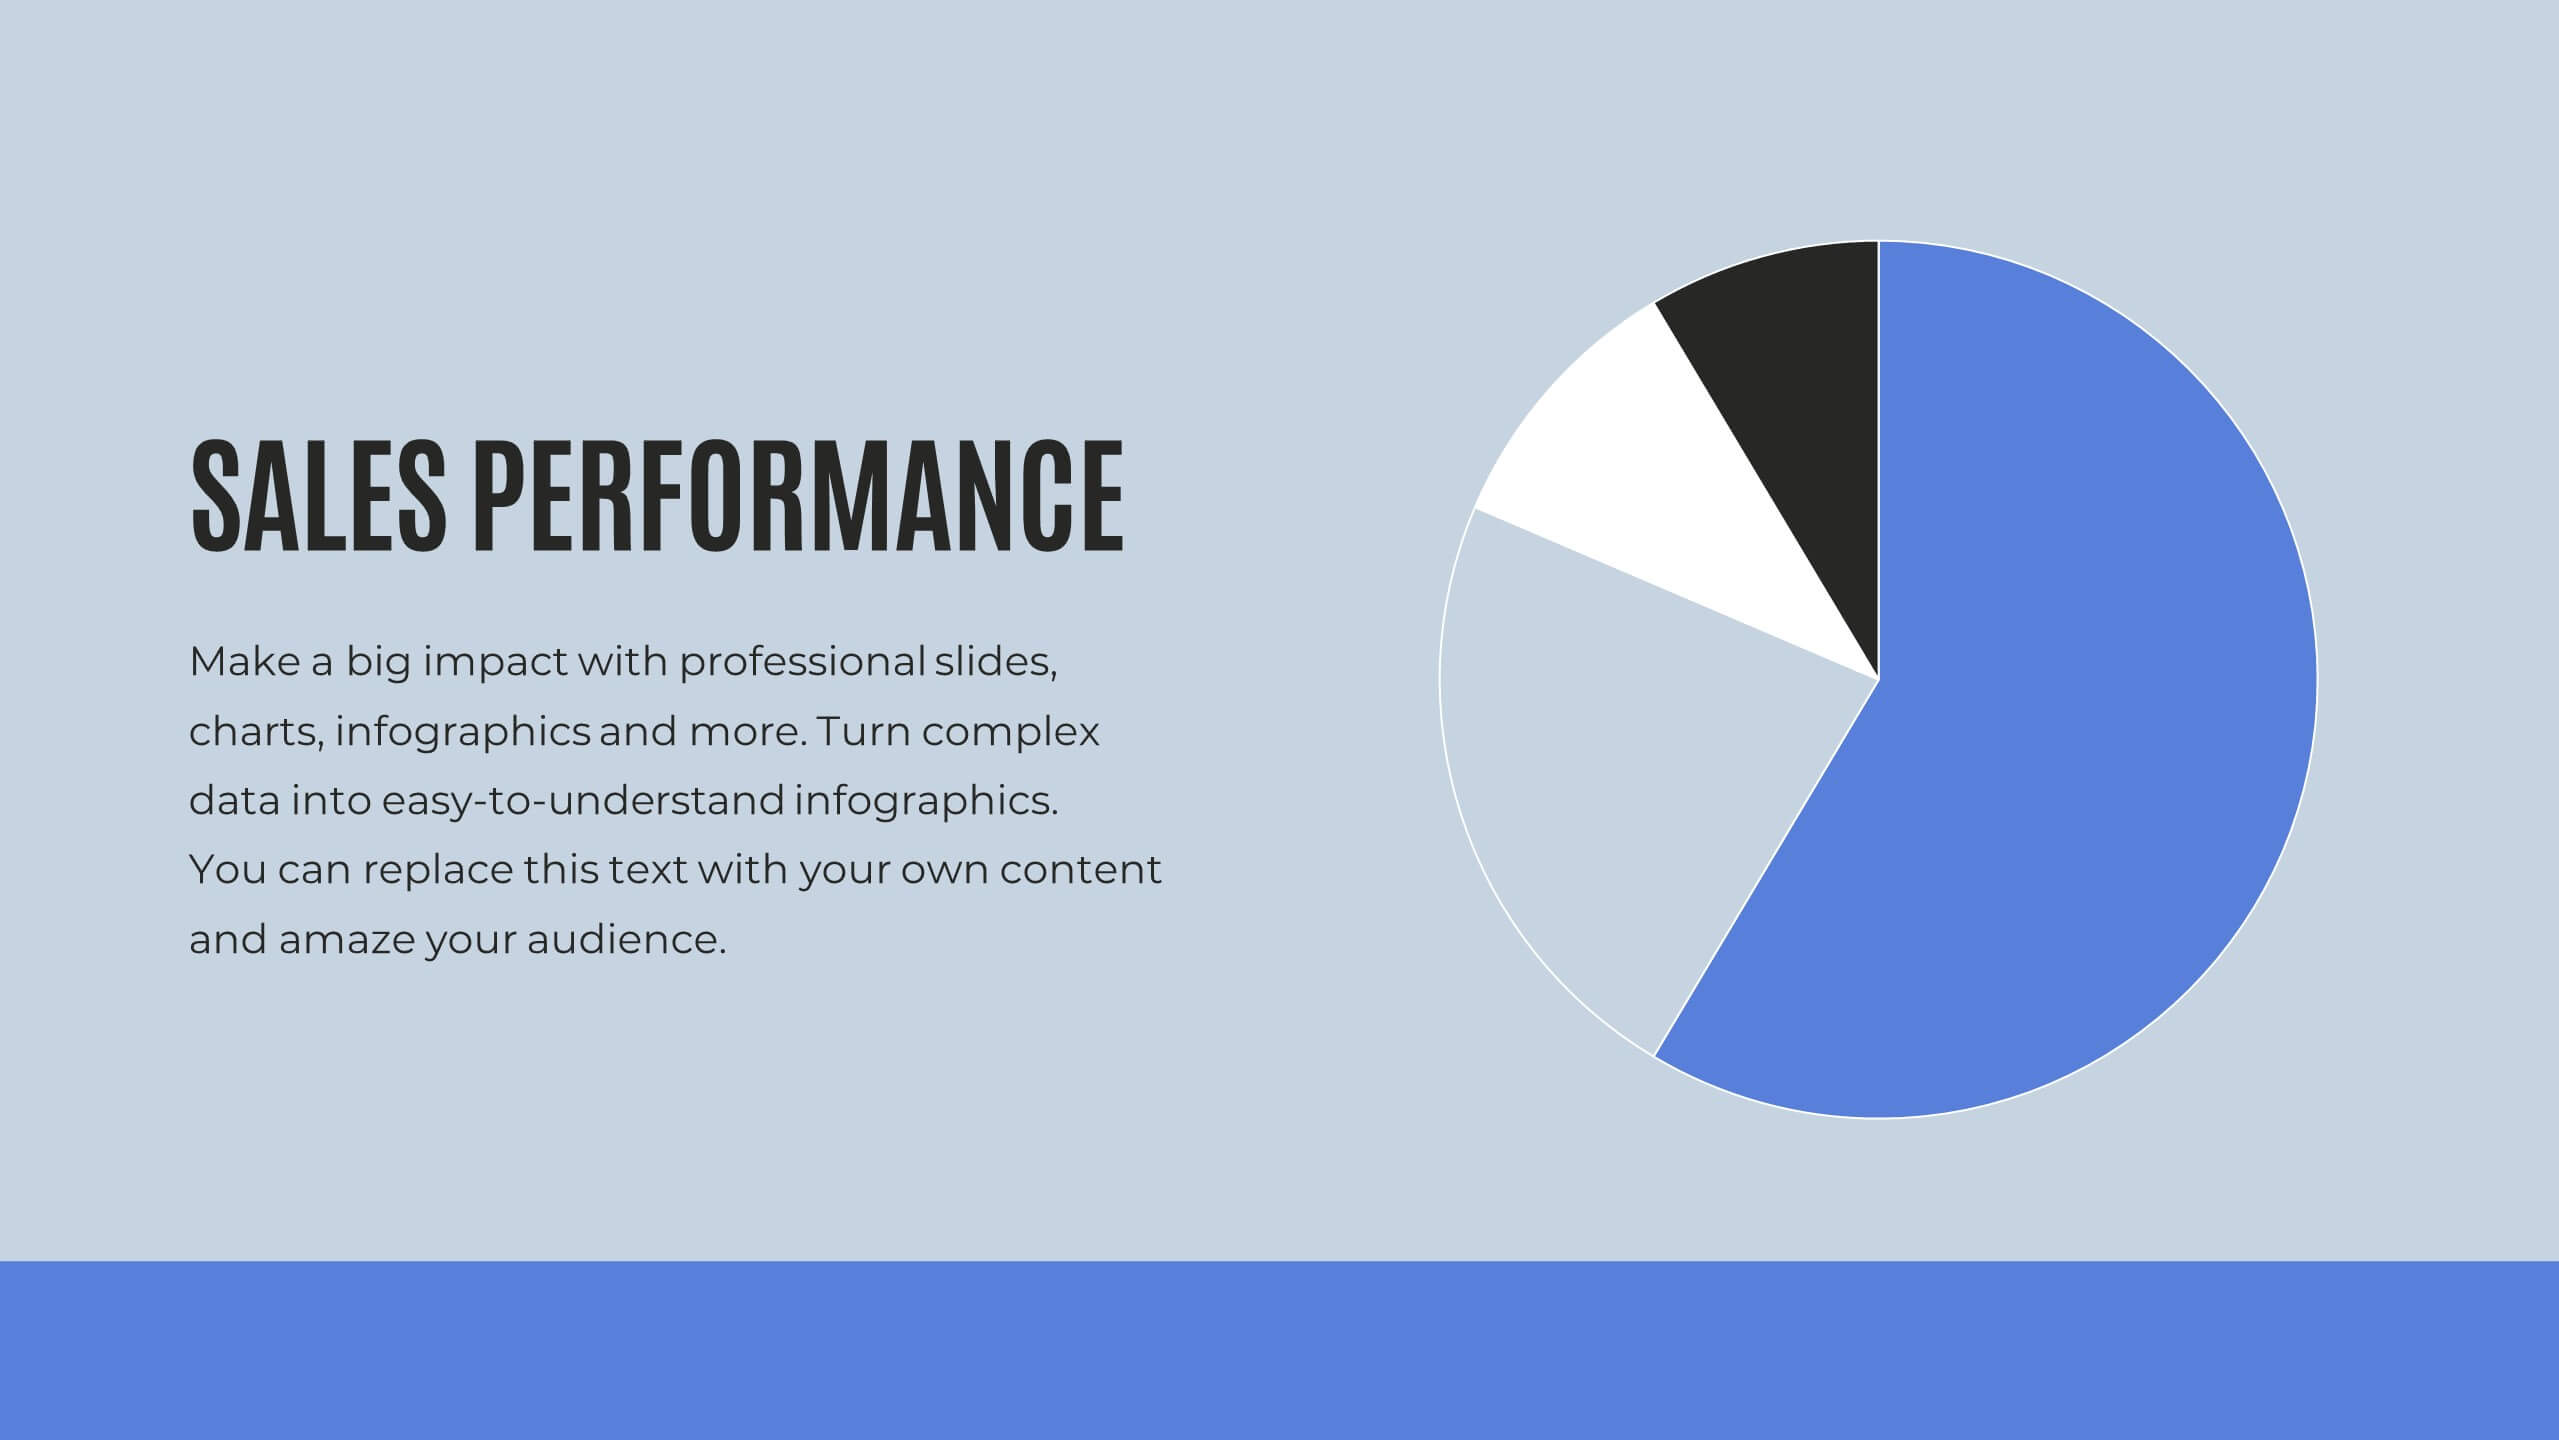
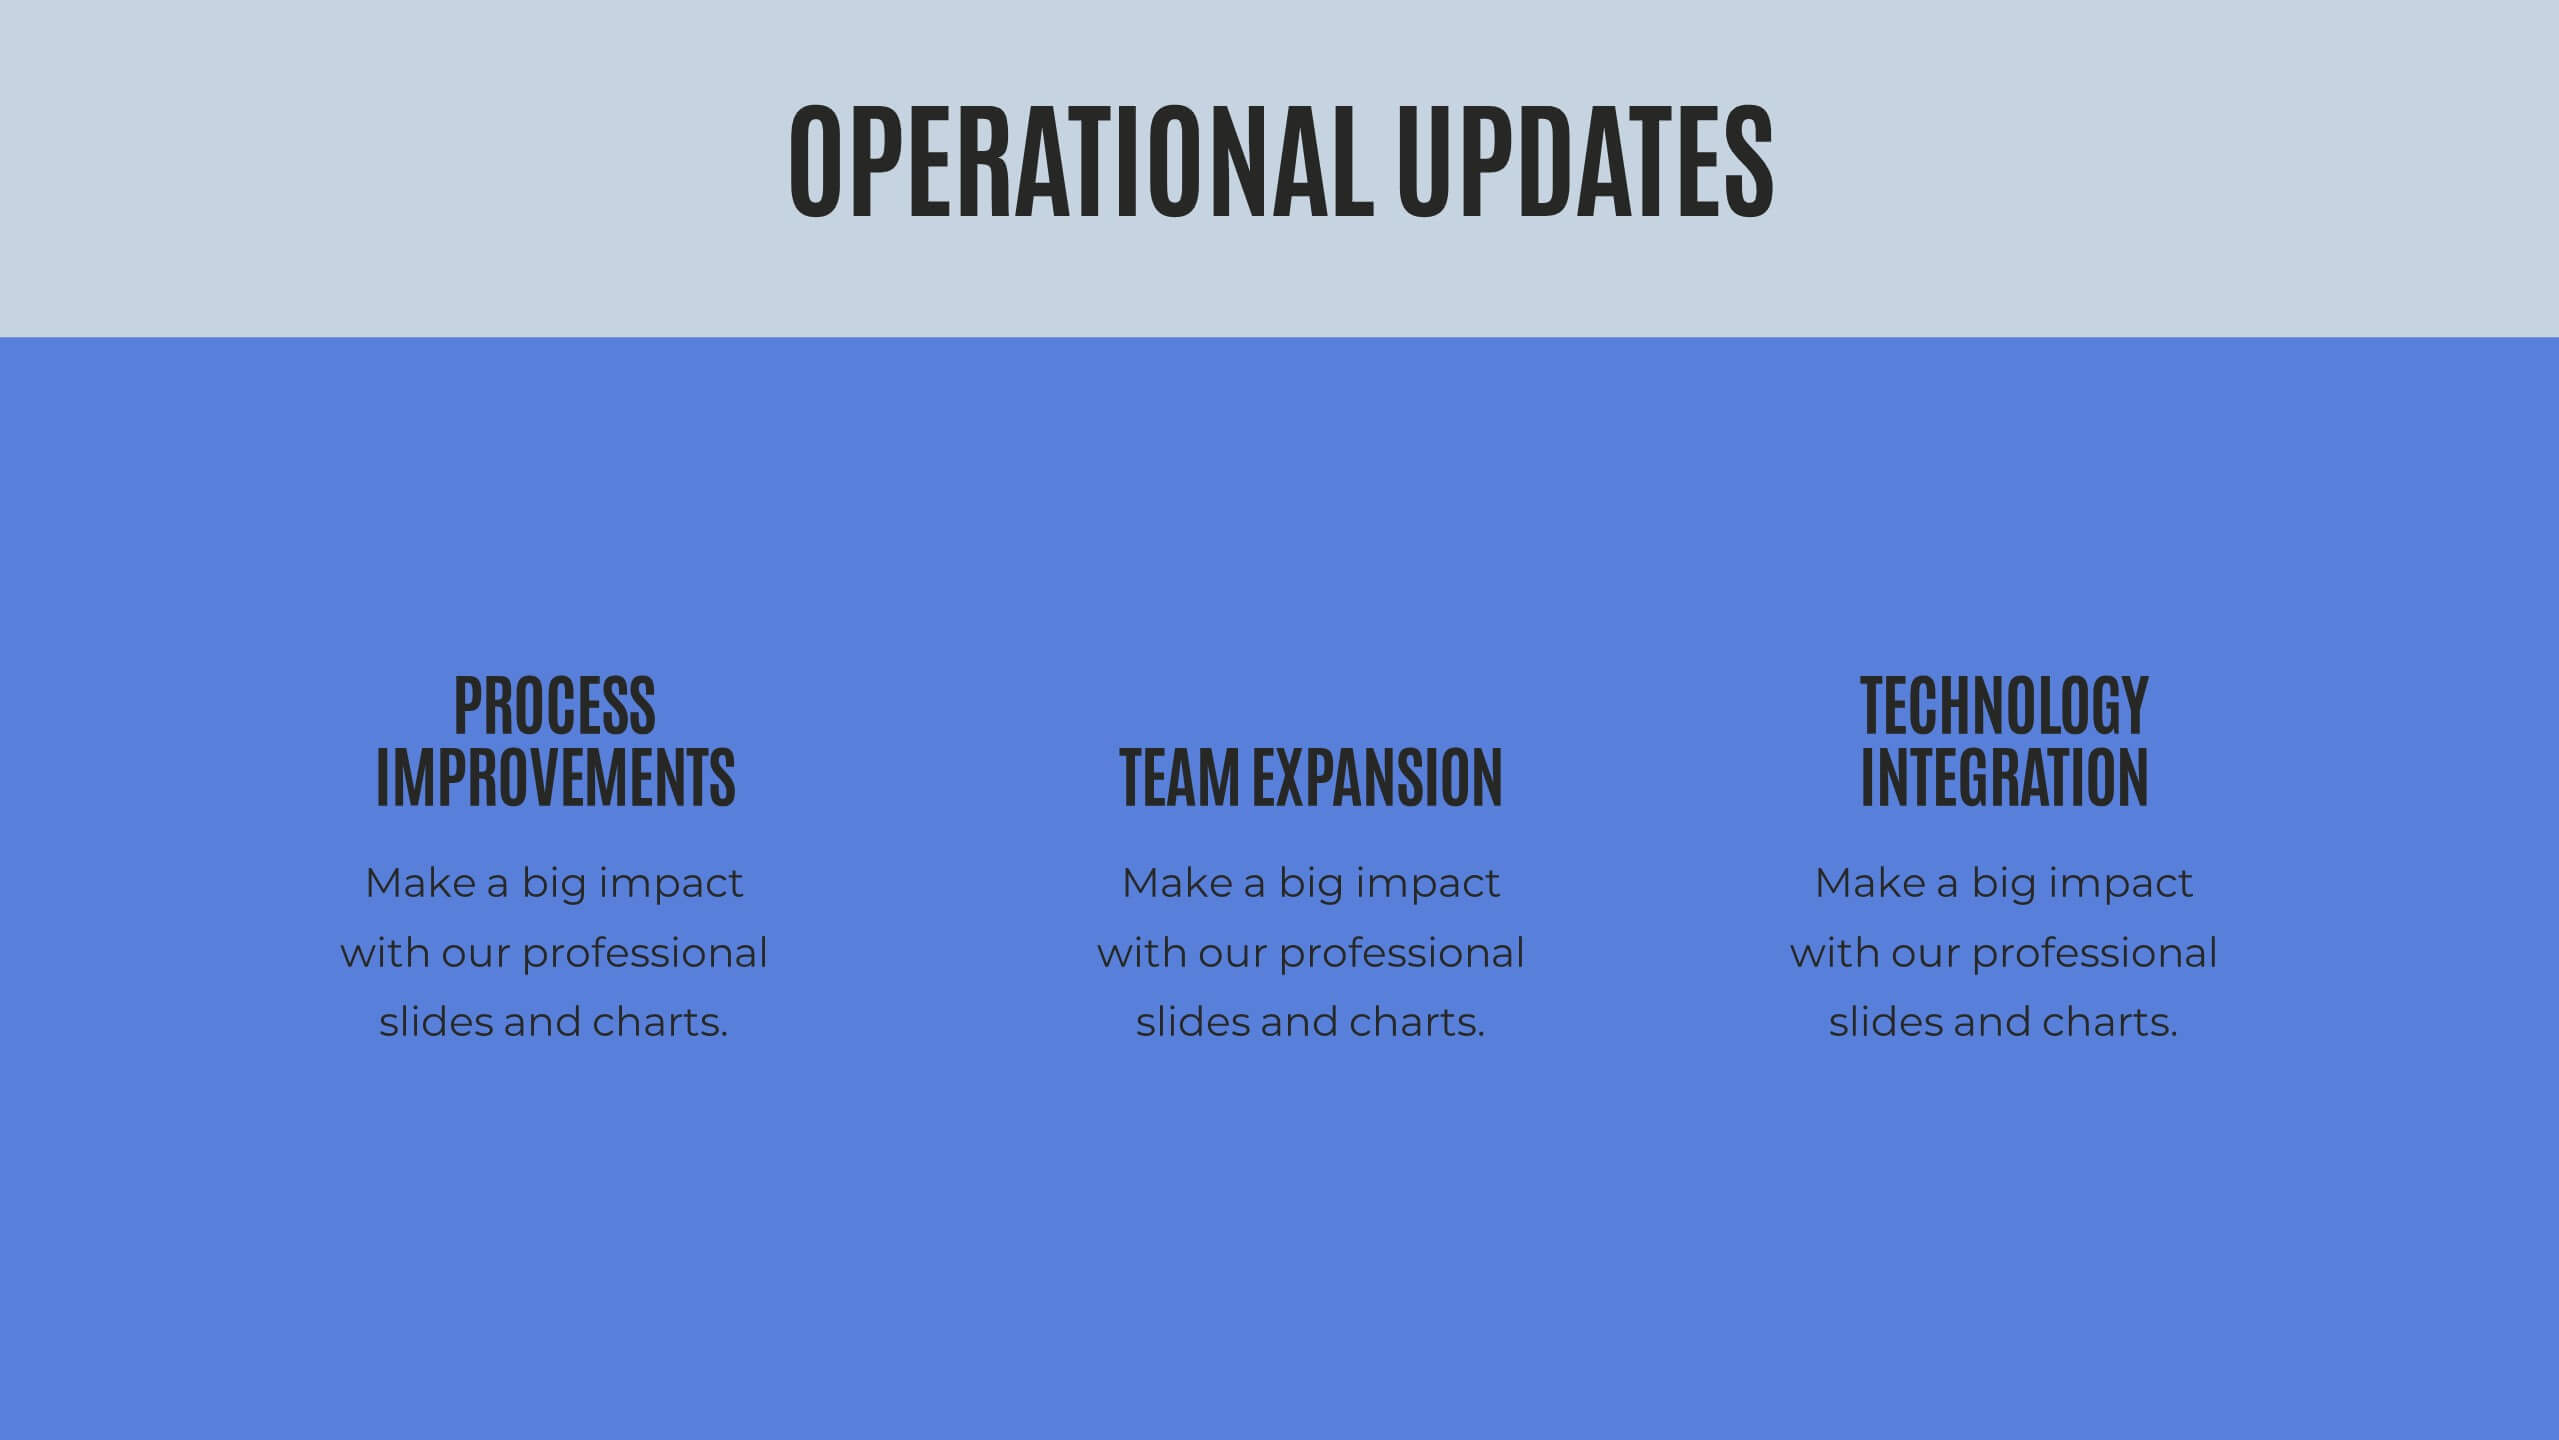
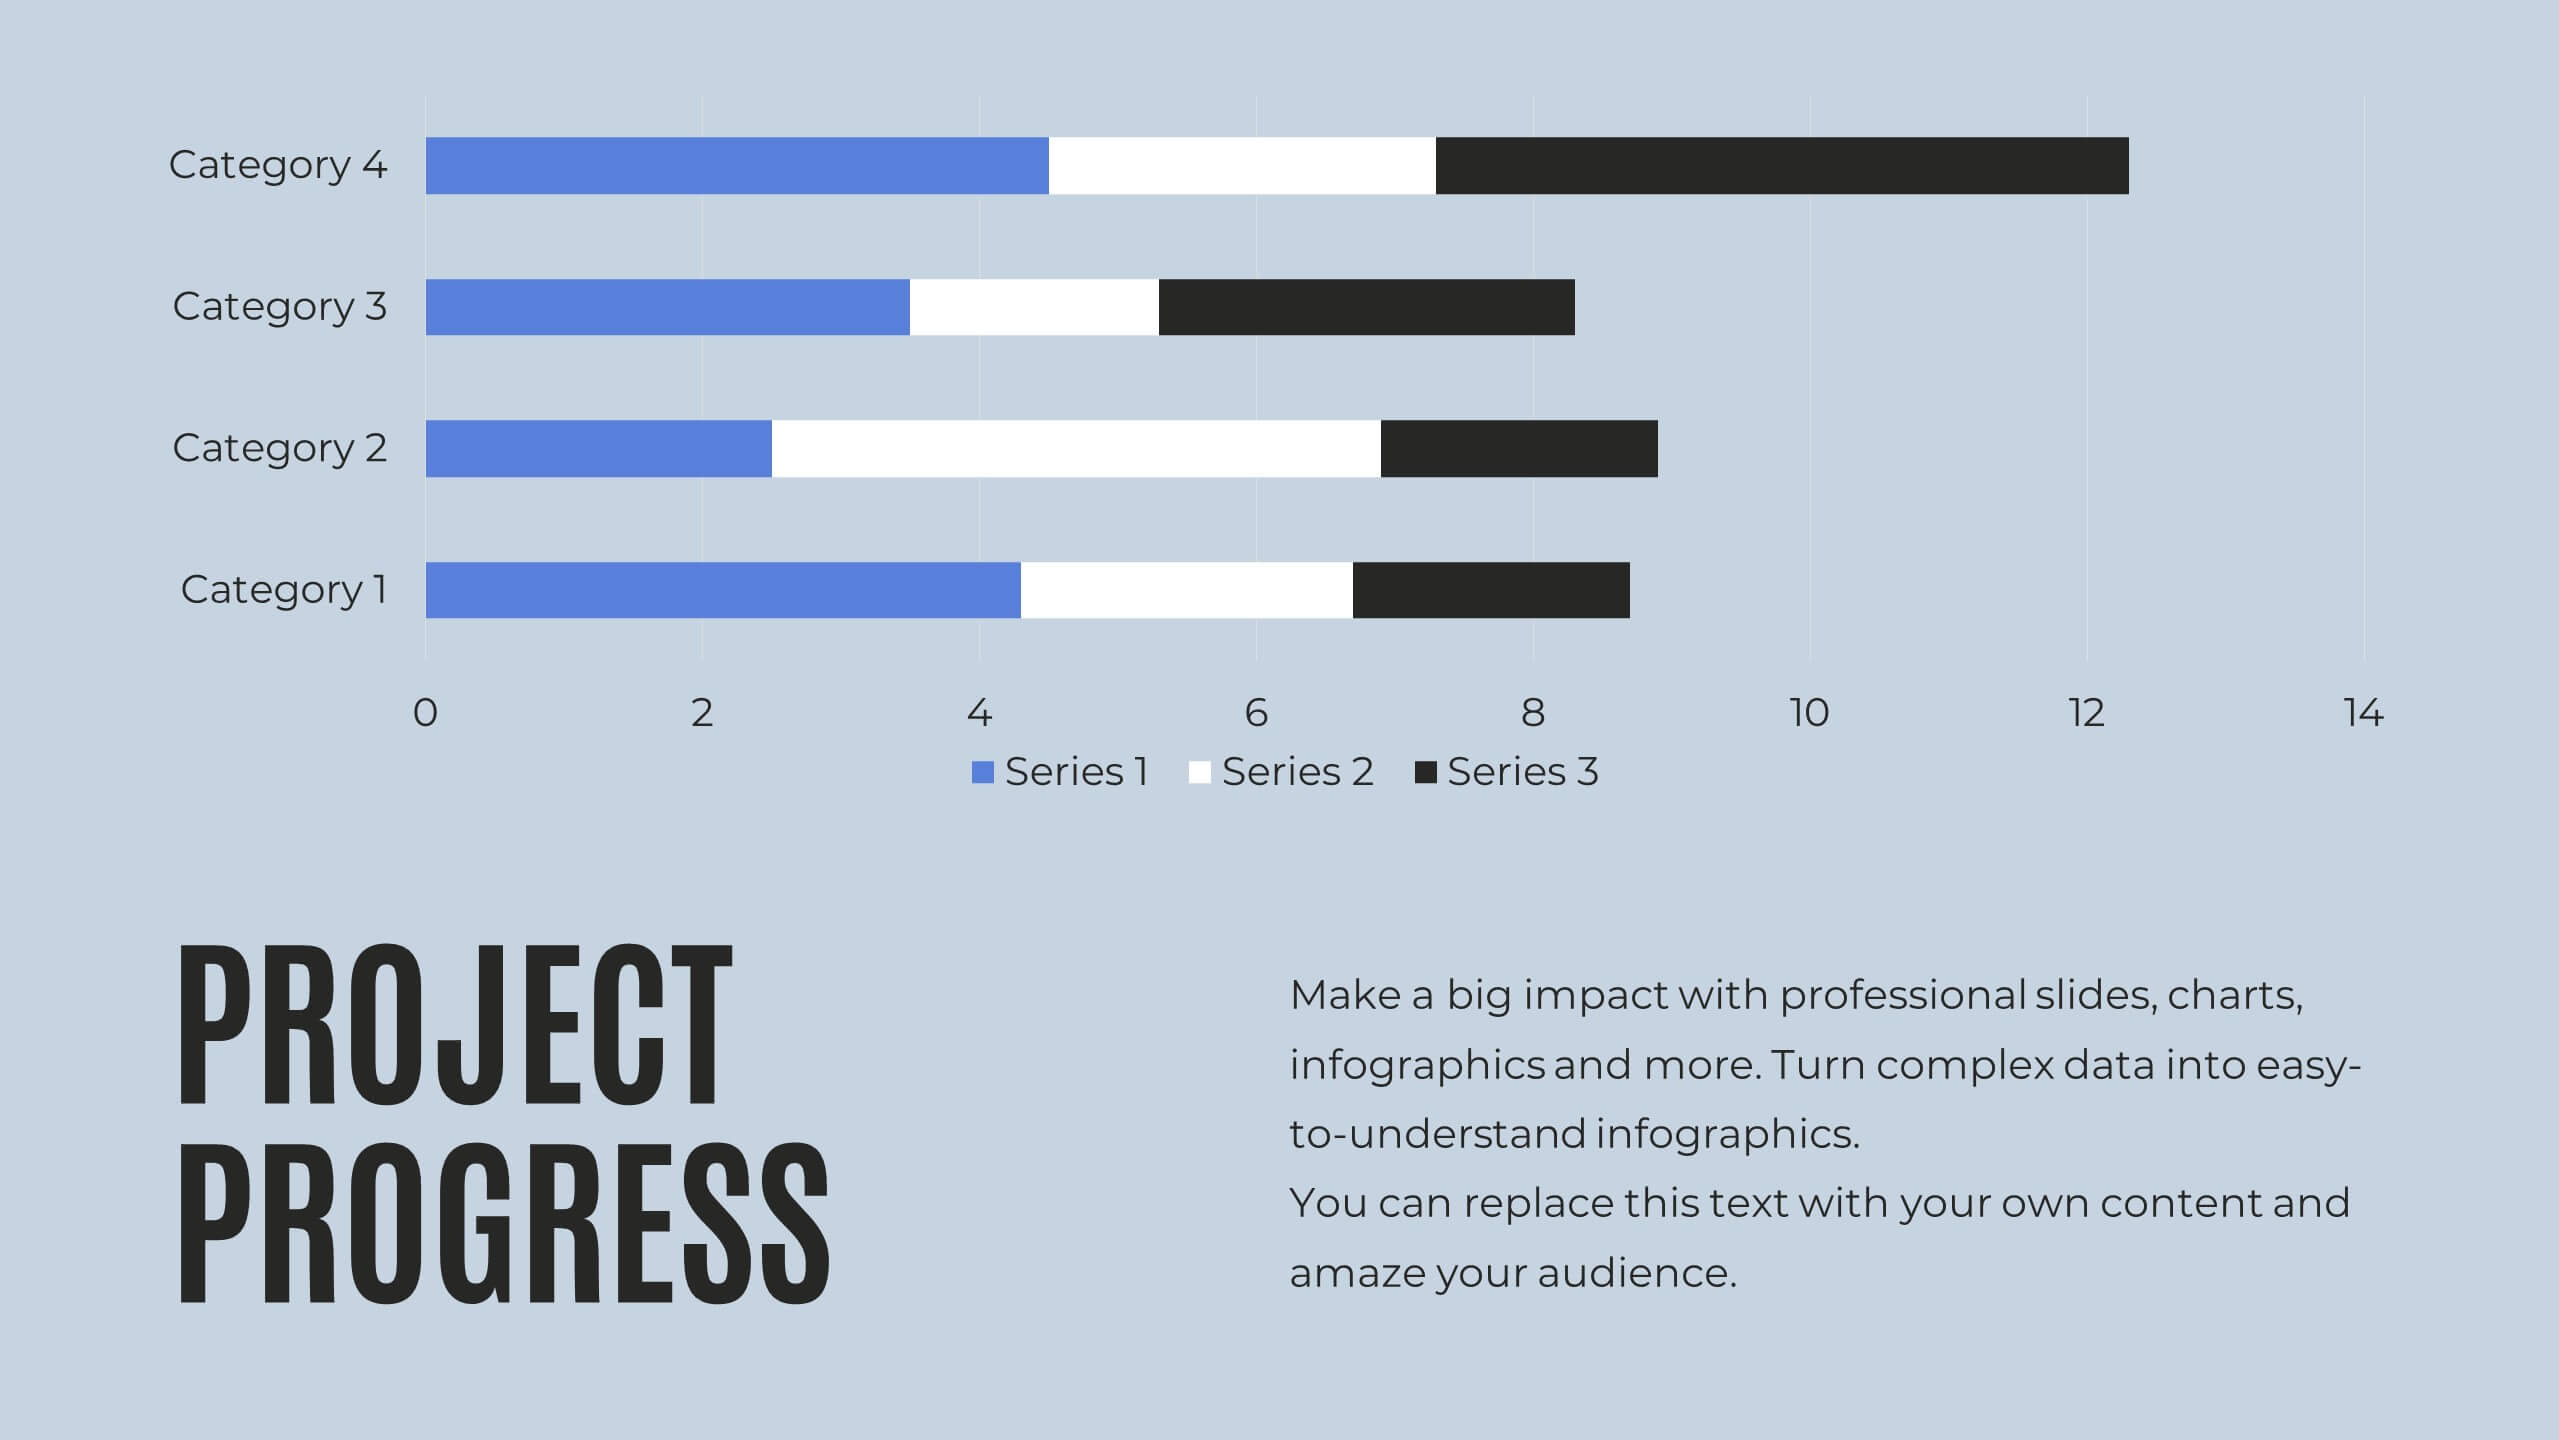
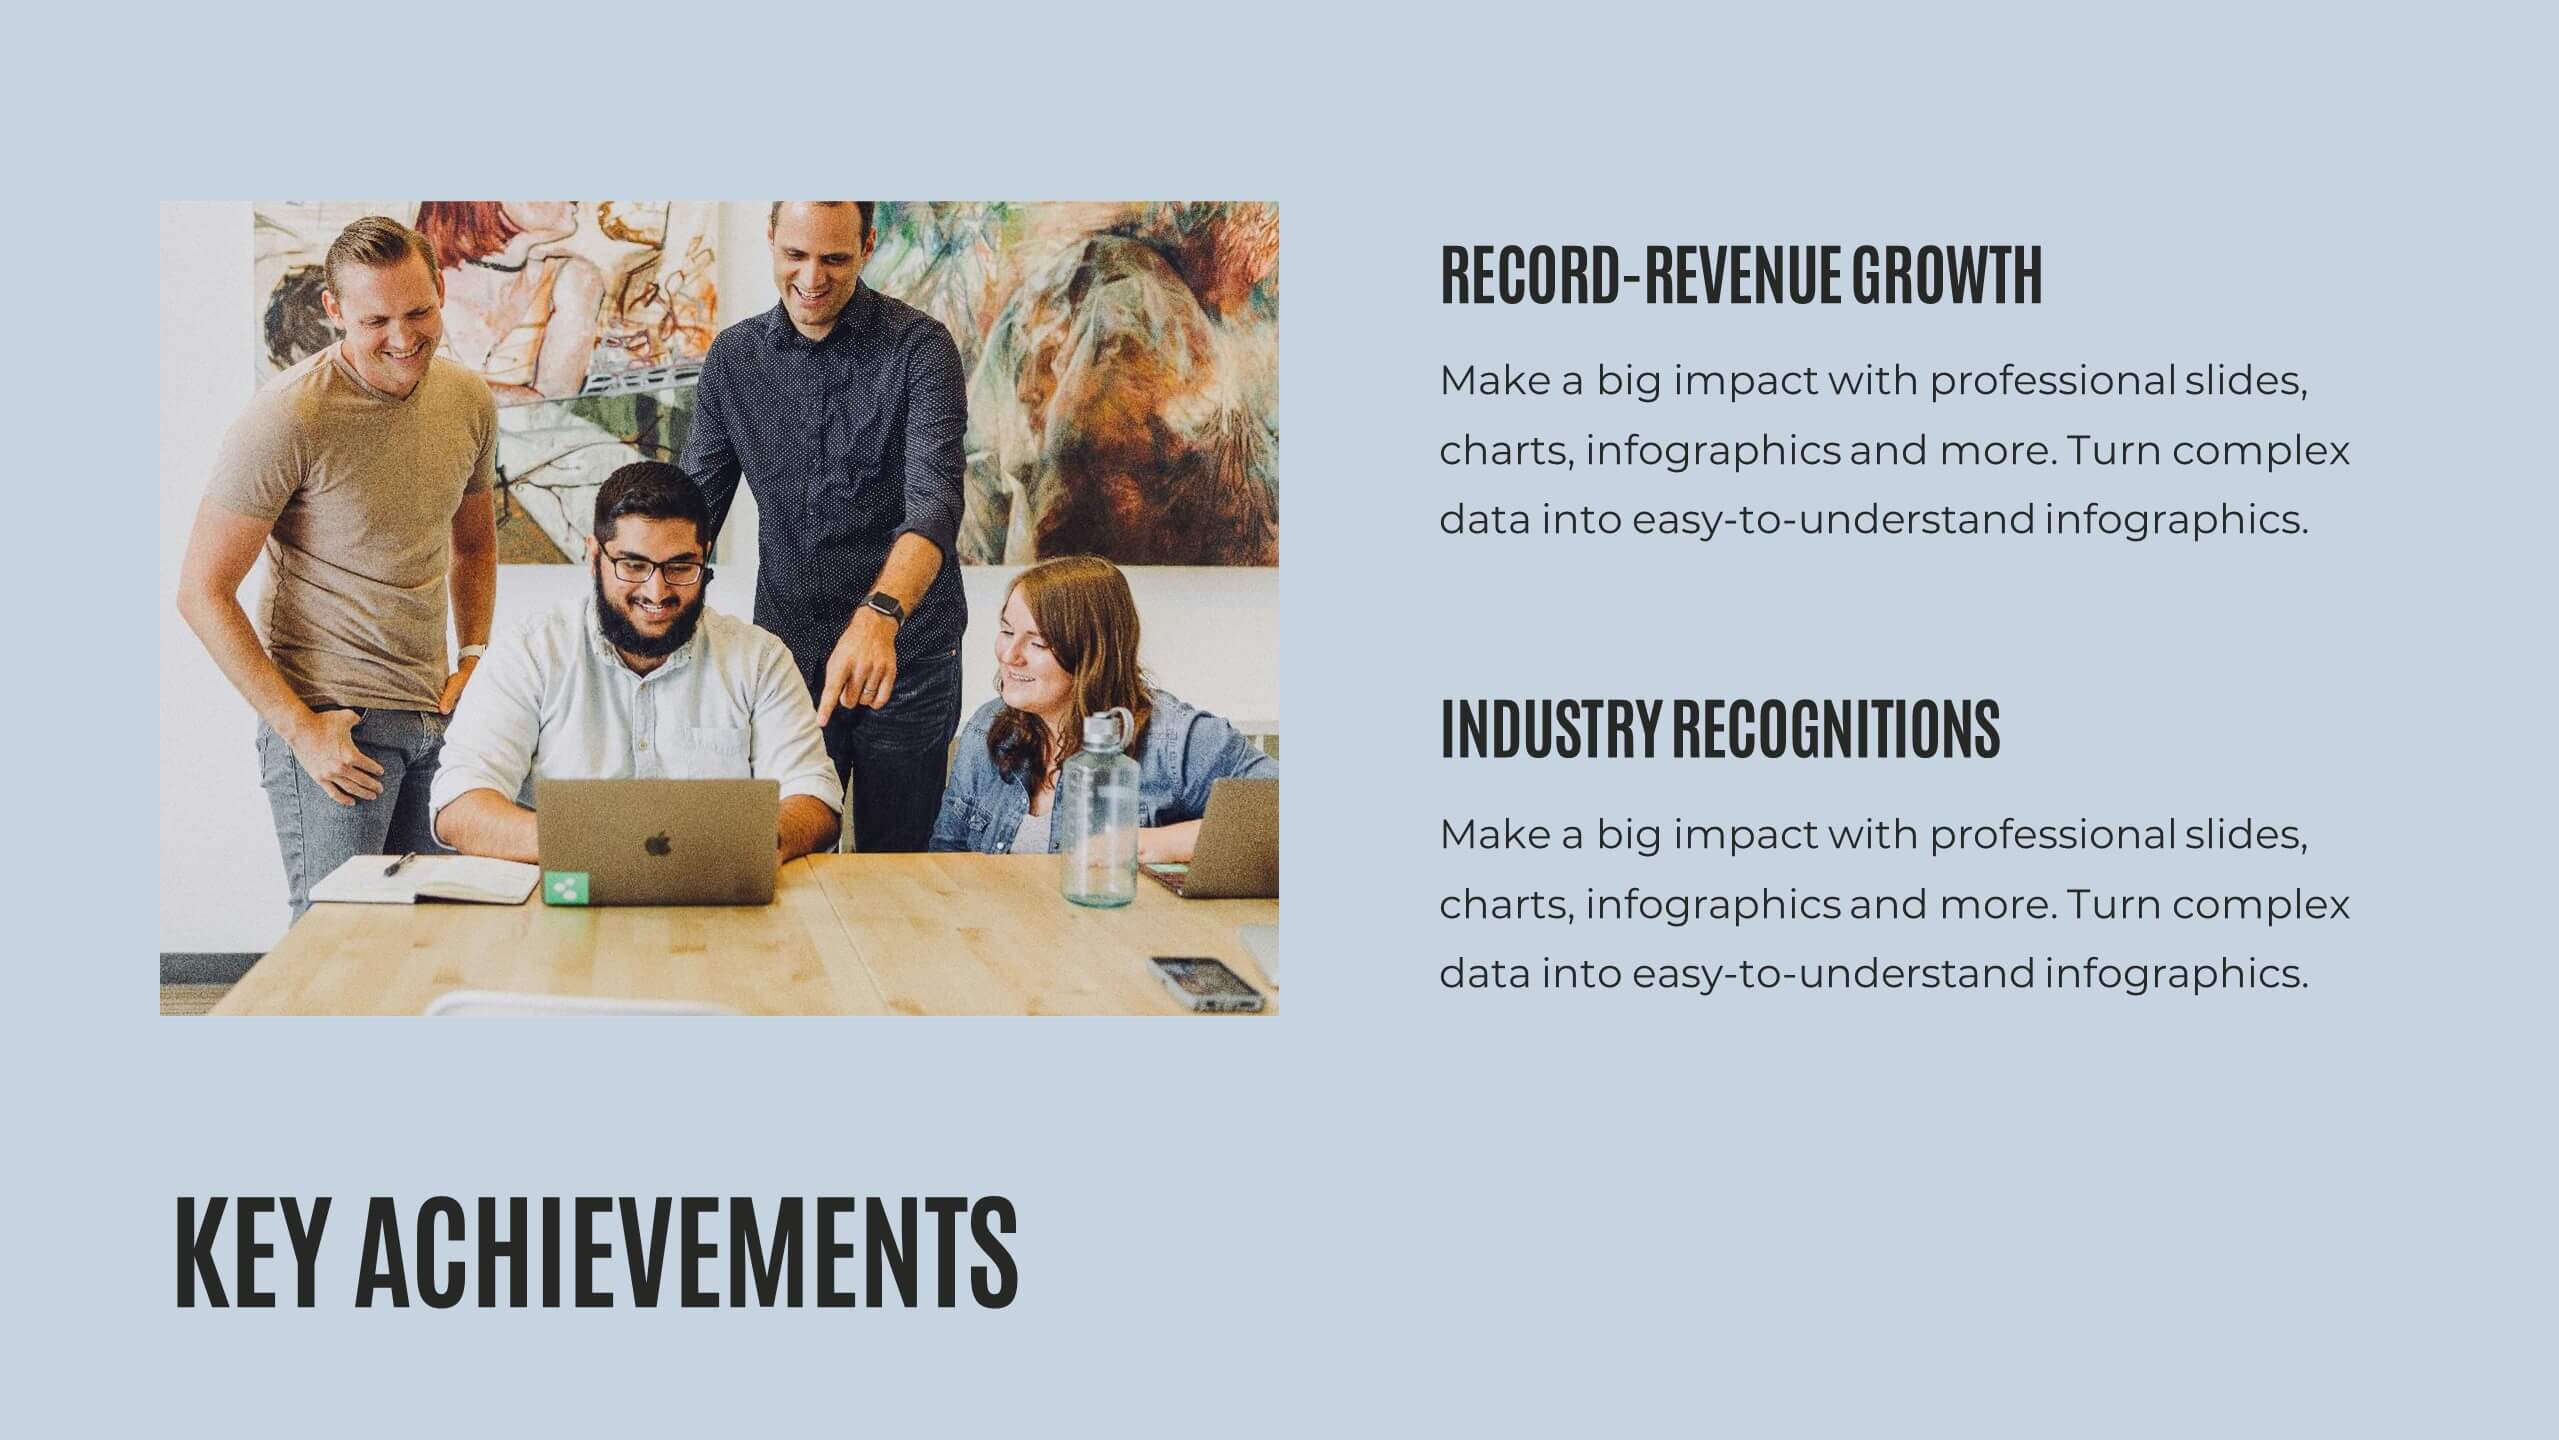
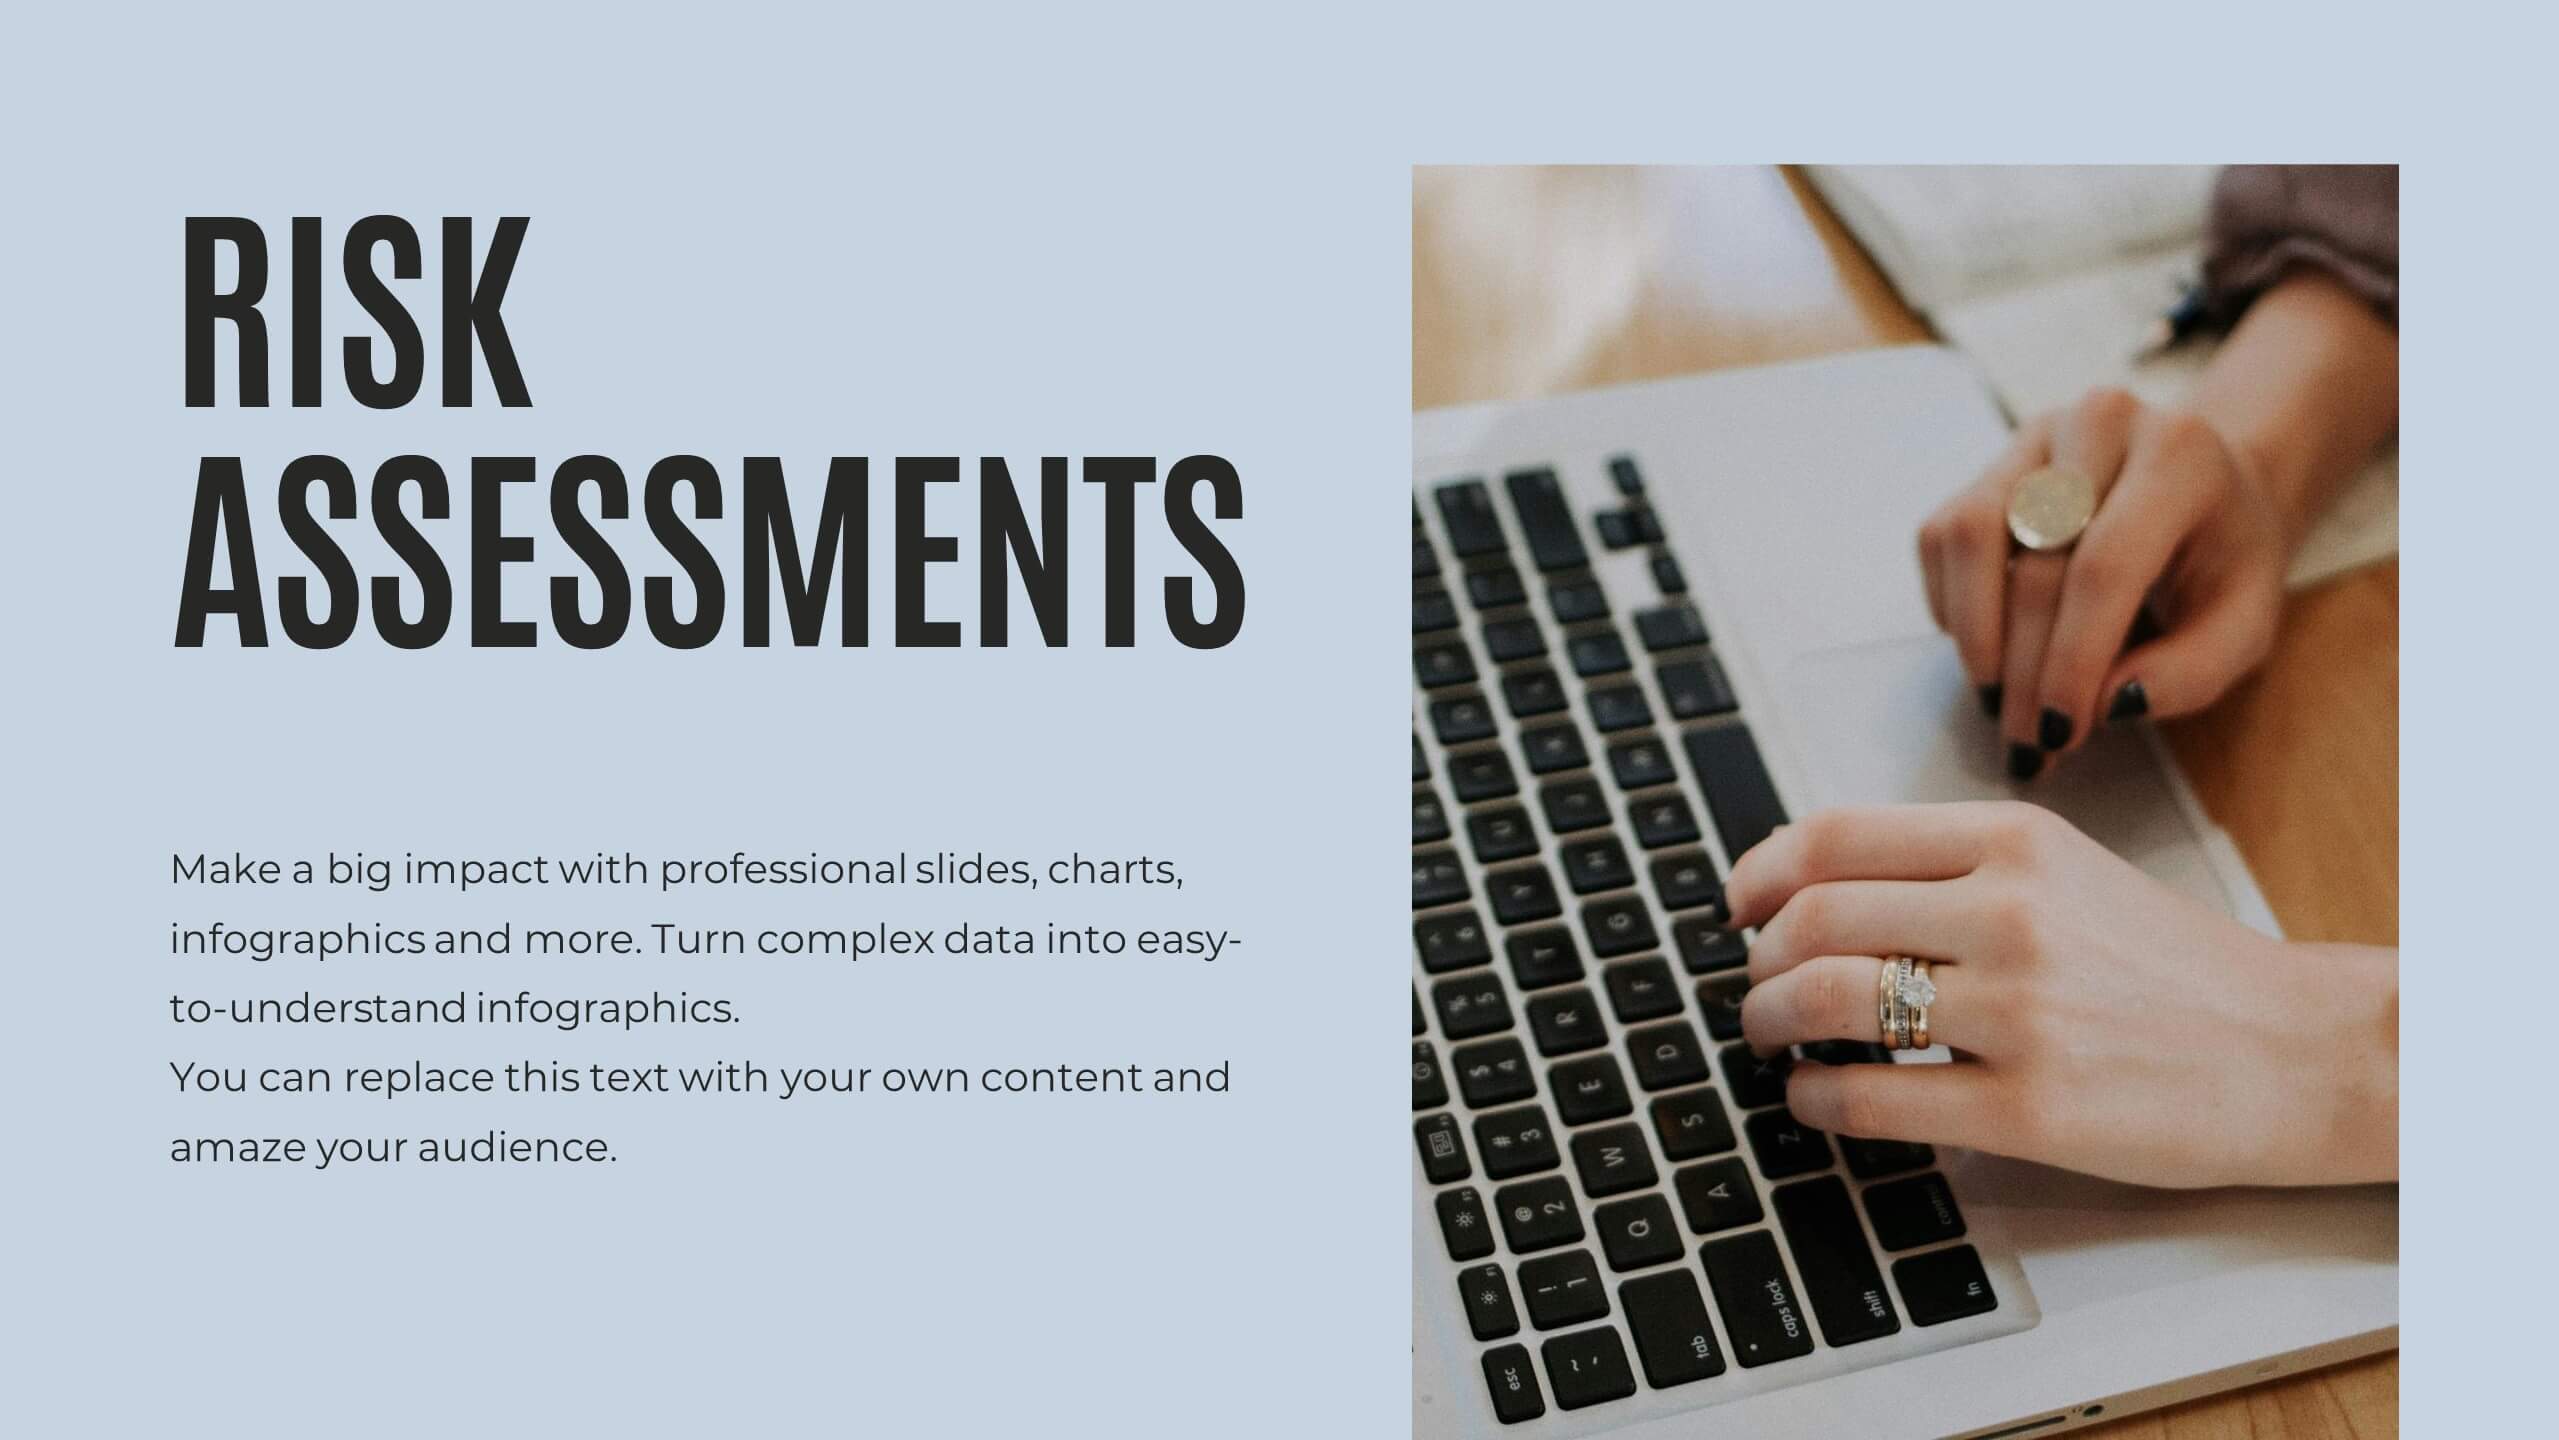
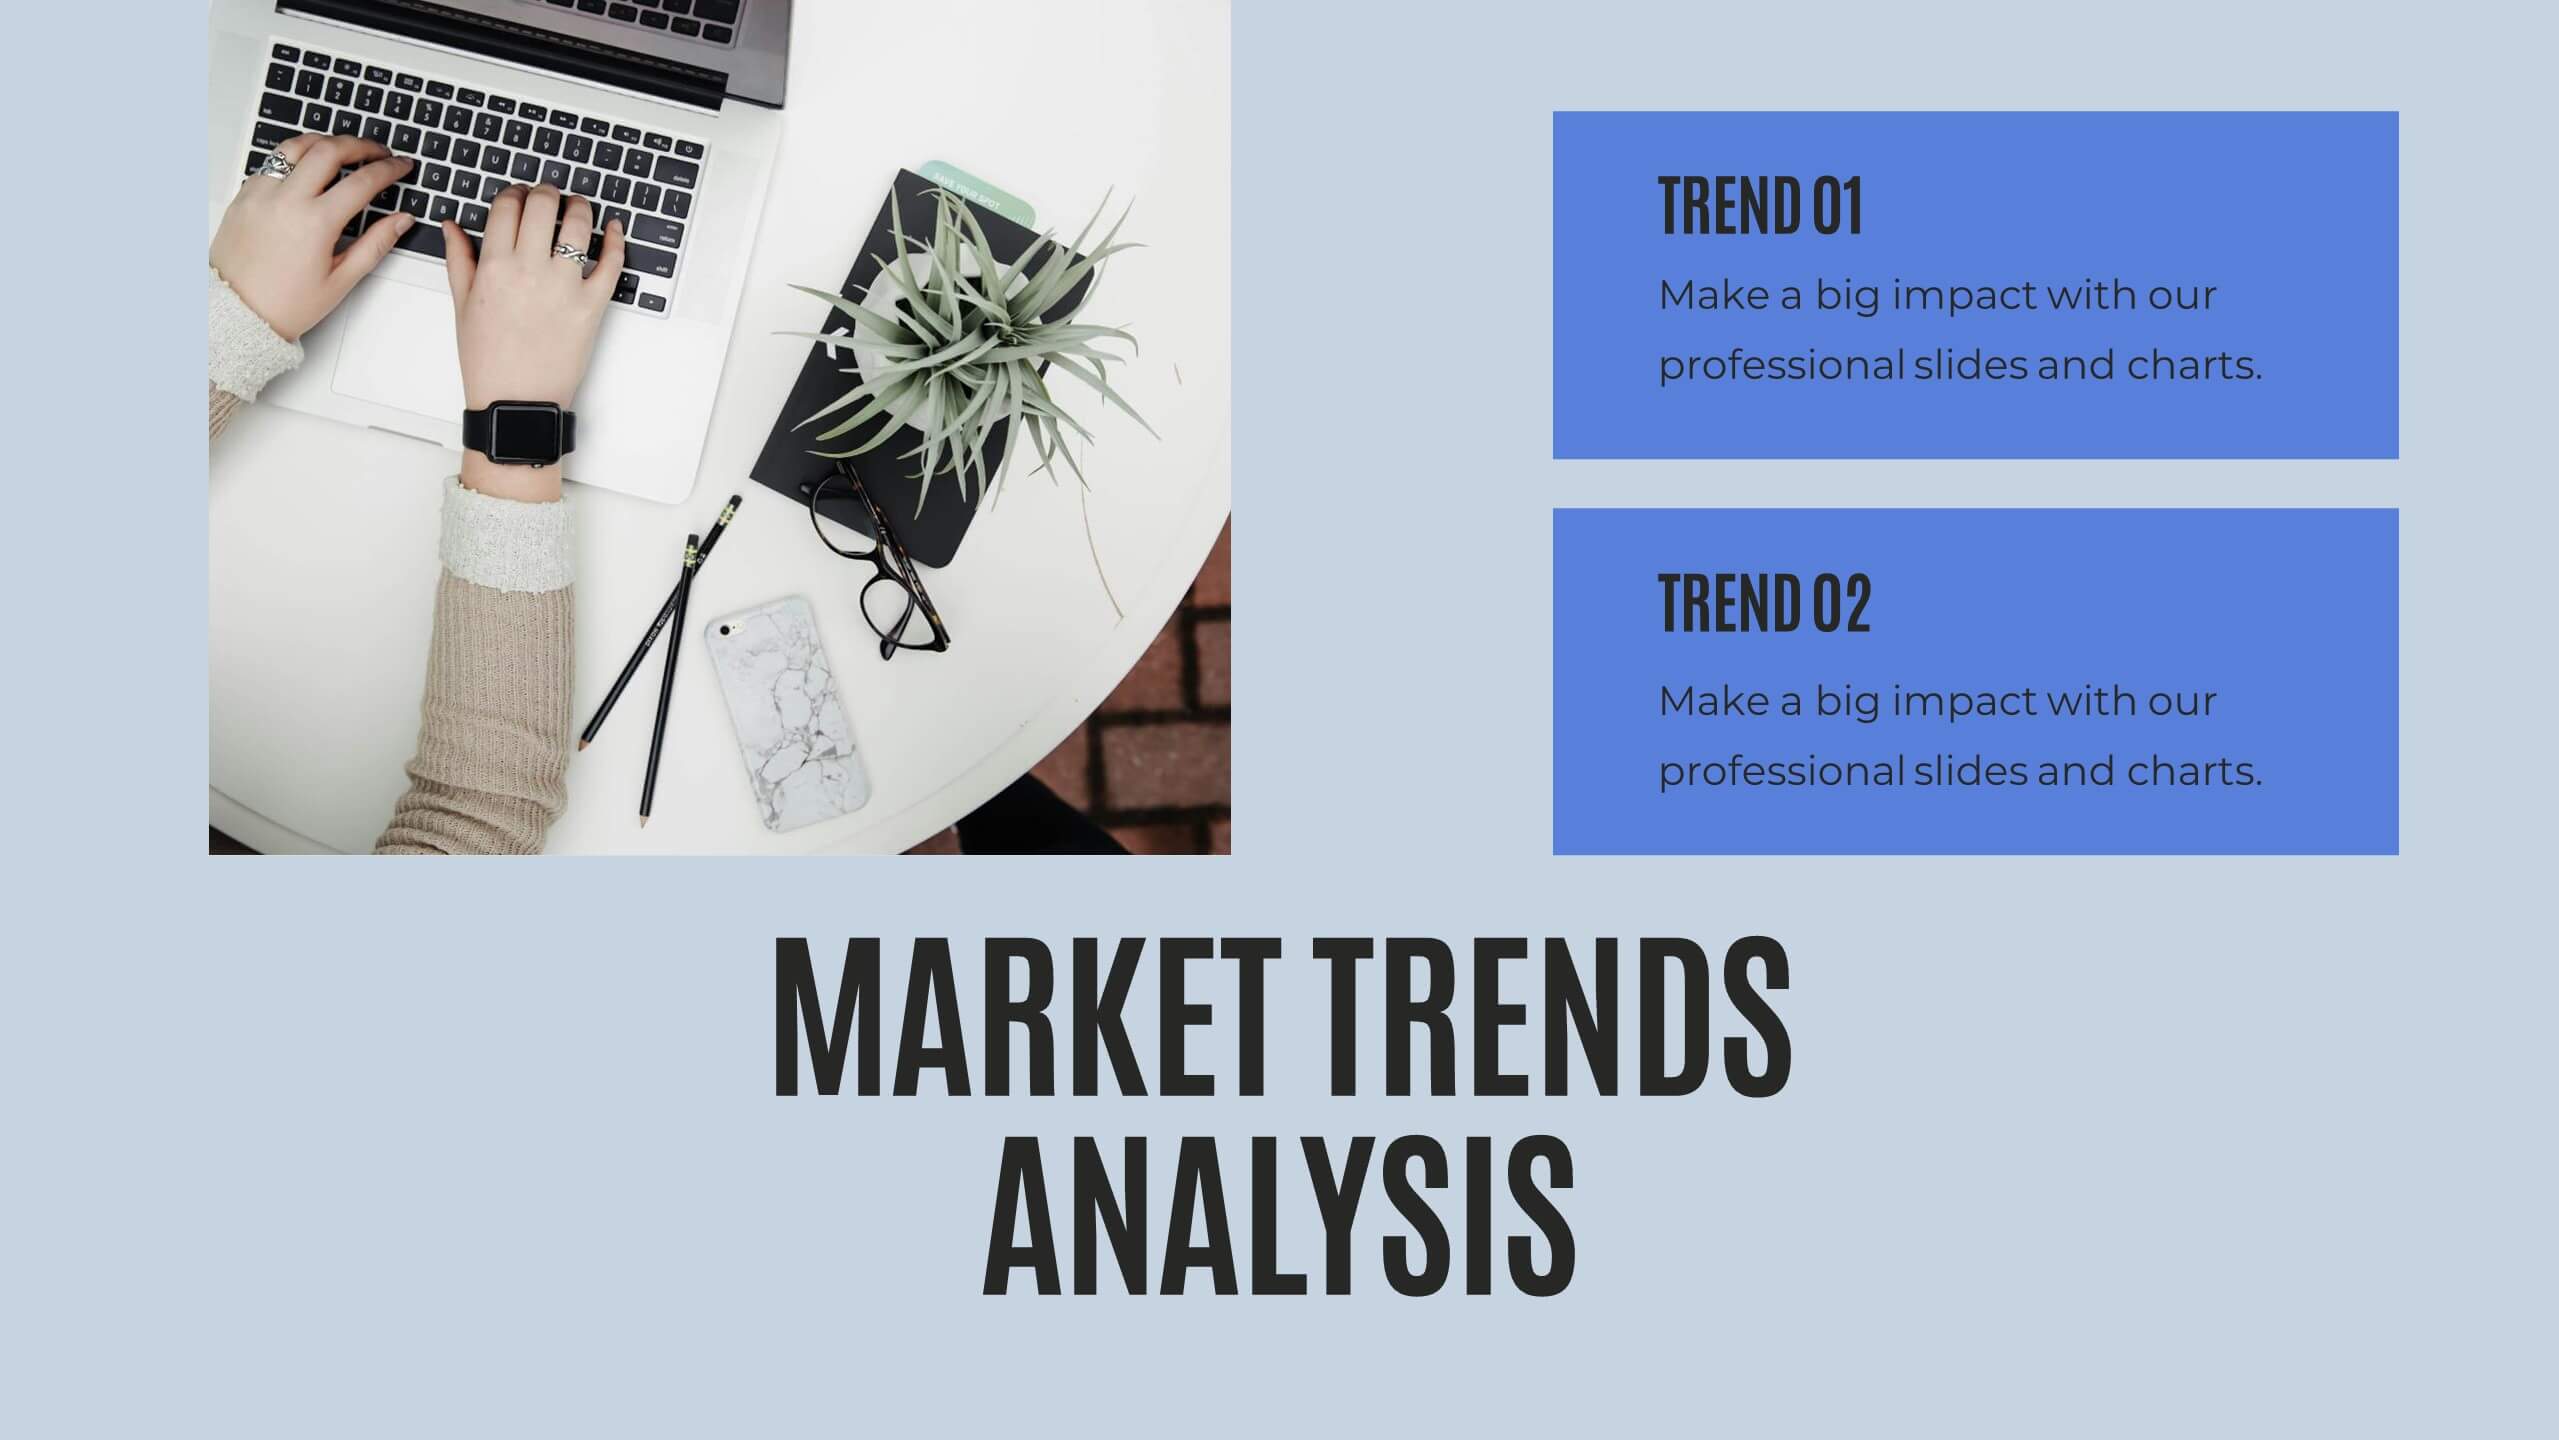
Quill Research Findings Report Presentation
Illuminate your findings with this comprehensive research report template! Perfect for presenting key highlights, performance metrics, and financial summaries, it features professional slides for project progress, risk assessments, and market trends analysis. Engage your audience with clear visuals and detailed content. Compatible with PowerPoint, Keynote, and Google Slides for seamless presentations on any platform.


20 slides
Wonderis Design Proposal Presentation
Deliver an impeccable pitch with this minimalistic and professional design proposal template. Crafted for designers, agencies, and creative professionals, this presentation allows you to seamlessly showcase your expertise, methodology, and deliverables. Walk your audience through a polished narrative that includes a project summary, proposed solutions, objectives, methodology, and timeline. Highlight your expertise with dedicated slides for team introductions, budget breakdowns, and pricing structures. Ensure confidence with risk mitigation strategies, references, and clear next steps to solidify trust in your approach. This template is fully editable and works flawlessly with PowerPoint, Google Slides, and Keynote, providing the flexibility you need to tailor your proposal to specific client needs. Perfect for client pitches, project proposals, and business presentations that need a sophisticated and concise design.


23 slides
Orbit Marketing Strategy Plan Presentation
Elevate your marketing strategy presentations with this vibrant and dynamic template! Perfect for analyzing market trends, identifying target audiences, and outlining strategic objectives. Ideal for marketing professionals aiming to captivate their audience and drive results. Compatible with PowerPoint, Keynote, and Google Slides, this template ensures your strategy is clear, compelling, and effective.


10 slides
Logistics and Procurement Supply Chain
Streamline your supply chain narrative with this clean, visual timeline layout. Perfect for operations managers, logistics planners, or procurement leads, this slide breaks down each stage of the supply chain process with color-coded segments and intuitive icons. Fully editable in PowerPoint, Keynote, and Google Slides.


8 slides
Competitive Market Strategy Presentation
Stay Ahead in the Market with this Competitive Market Strategy Presentation template. This slide helps you analyze industry competition, market positioning, and strategic advantages with a clean, engaging circular layout. Ideal for business planning, marketing strategy meetings, and competitive analysis, this template allows you to highlight key differentiators and action steps clearly. Fully customizable and available for PowerPoint, Keynote, and Google Slides.


5 slides
Multi-Layer Concentric Diagram Presentation
Make a splash with your ideas using this layered ripple-style layout! Perfect for visualizing cascading strategies, phased impacts, or multi-tiered processes, this multi-layer concentric diagram turns complex data into clean, memorable visuals. Fully compatible with PowerPoint, Keynote, and Google Slides, it’s ready to elevate your next presentation.