


Features
- 21 Unique slides
- Fully editable and easy to edit in Microsoft Powerpoint, Keynote and Google Slides
- 16:9 widescreen layout
- Clean and professional designs
- Export to JPG, PDF or send by email


Do you have any questions?
Recommend


5 slides
Spider Chart for Mind Organization Presentation
Clarify complex ideas with the Spider Chart for Mind Organization Presentation. This layout visually maps key topics and subtopics, helping you identify patterns, priorities, or areas of focus. Ideal for planning, decision-making, and brainstorming sessions. Fully customizable in Canva, PowerPoint, Google Slides, and Keynote for seamless use.


21 slides
Drift Agile Project Plan Presentation
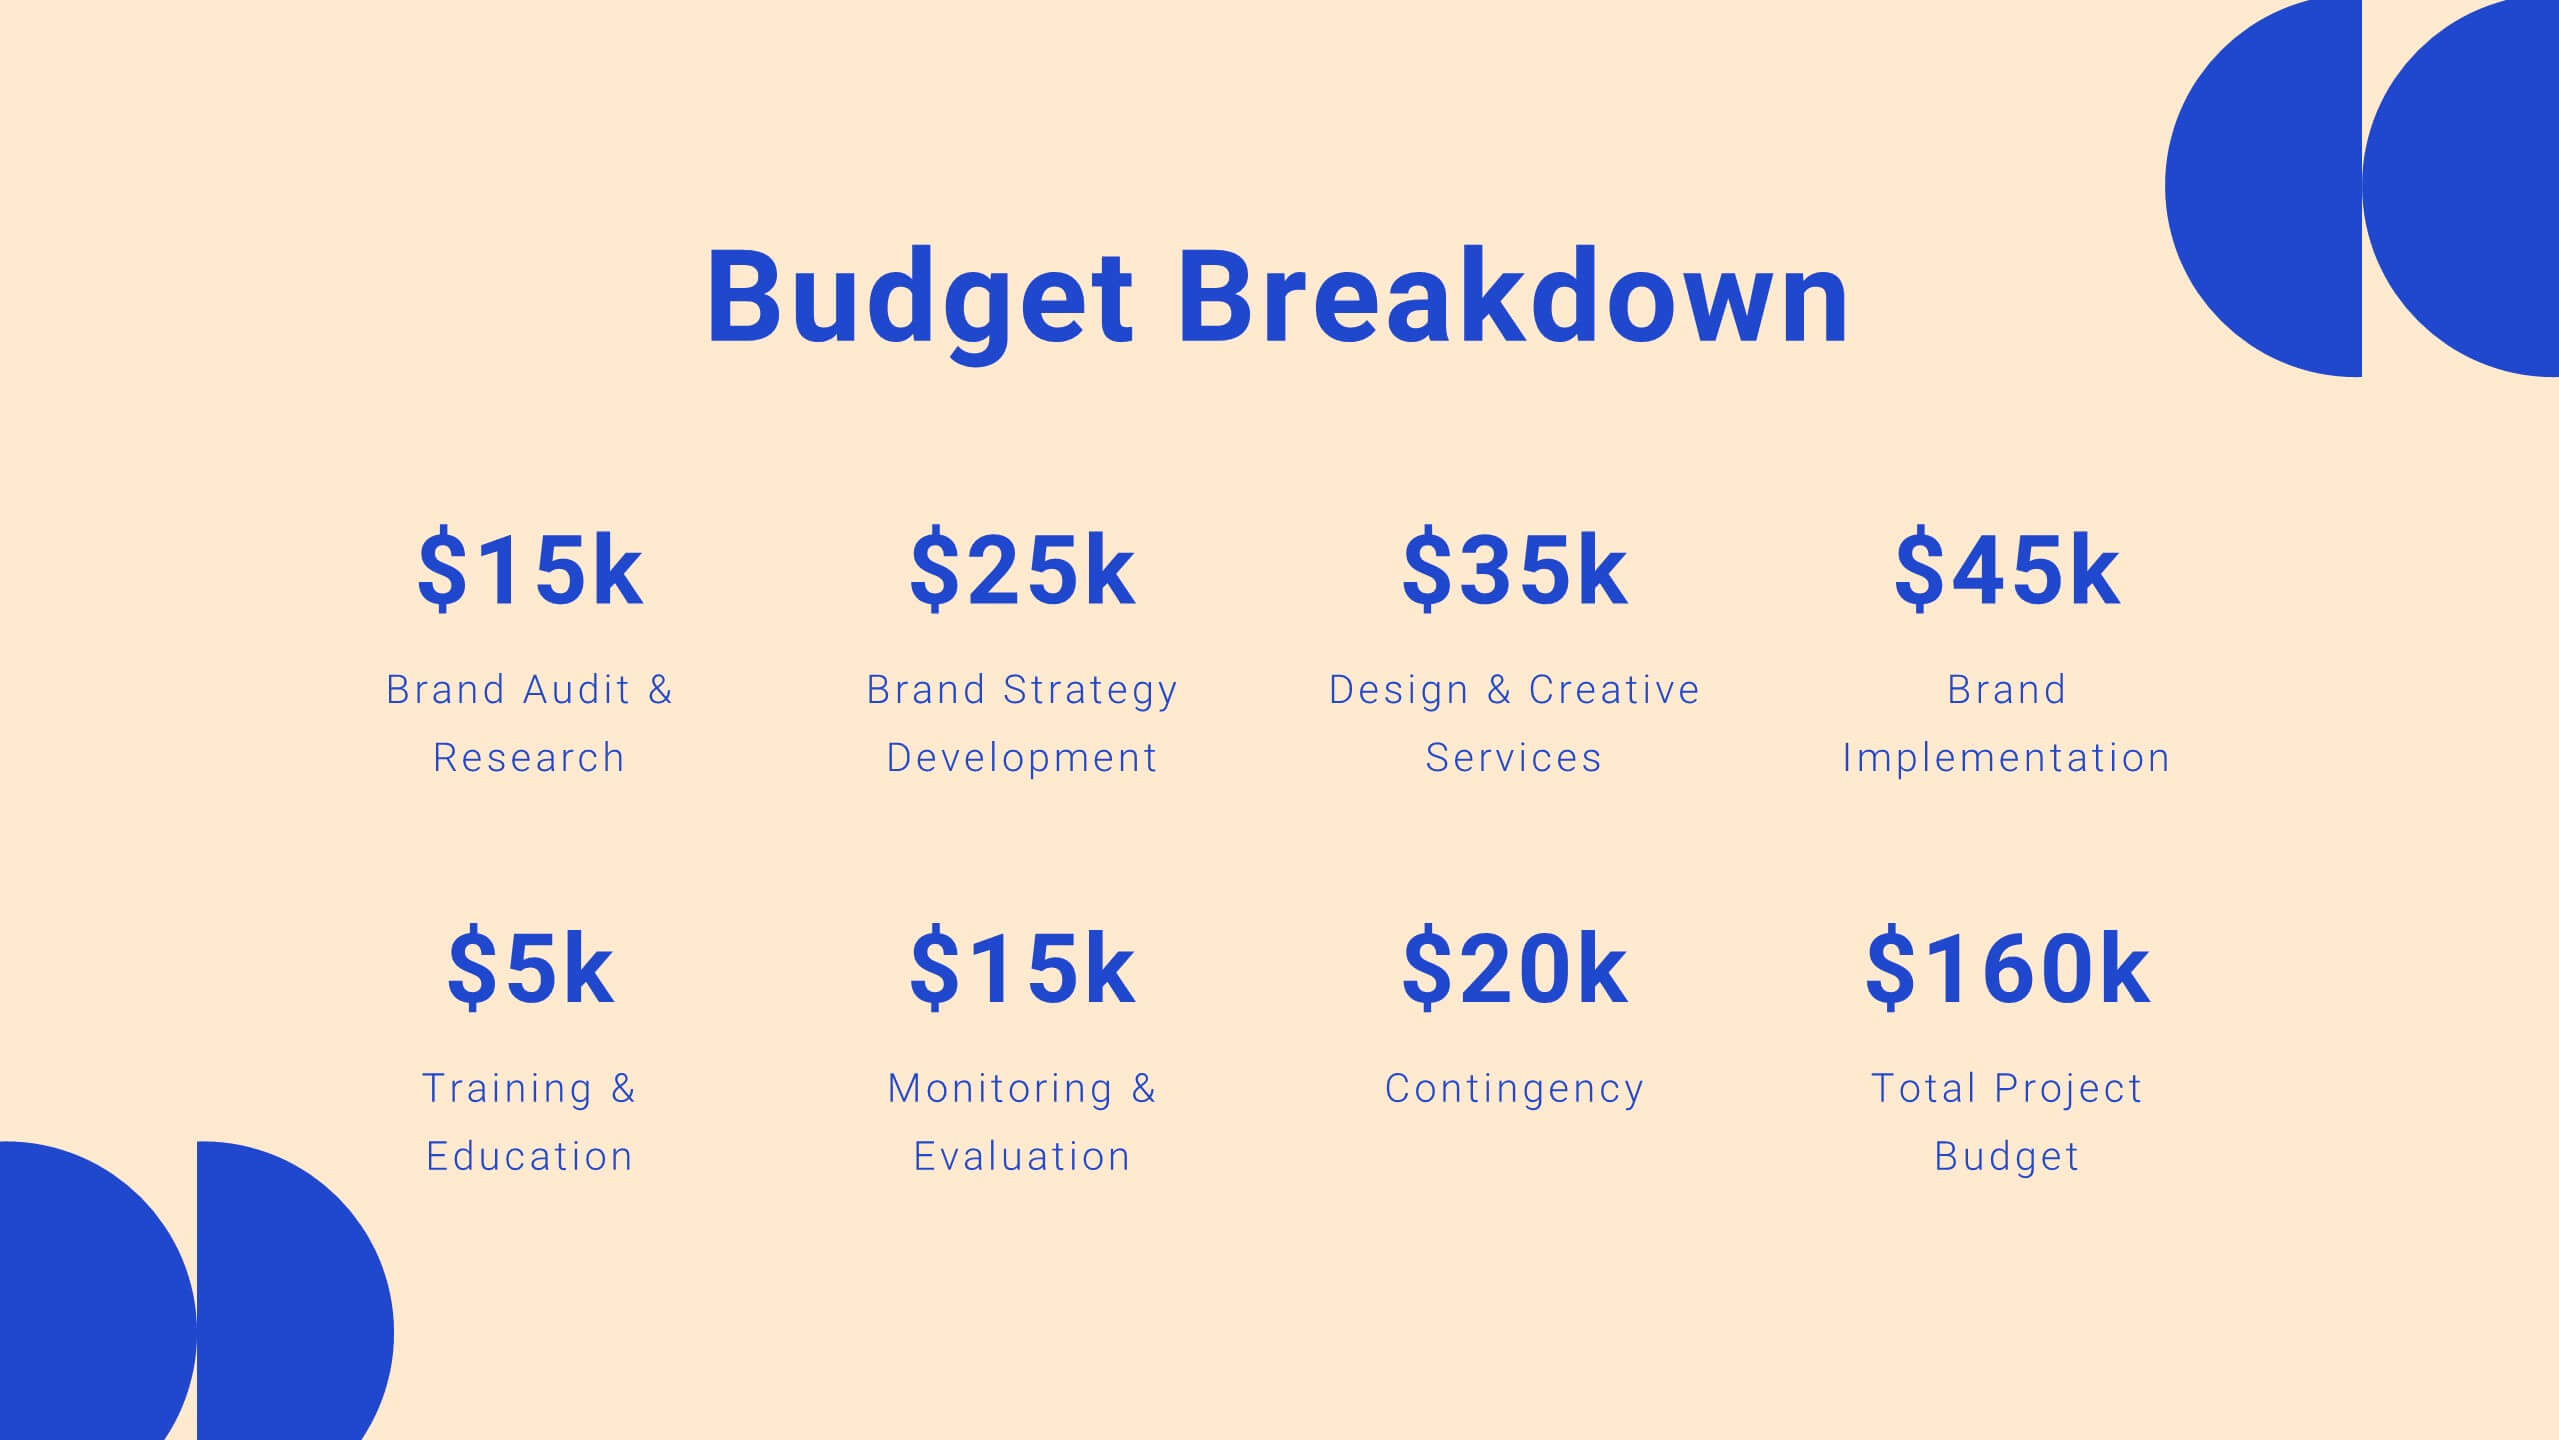
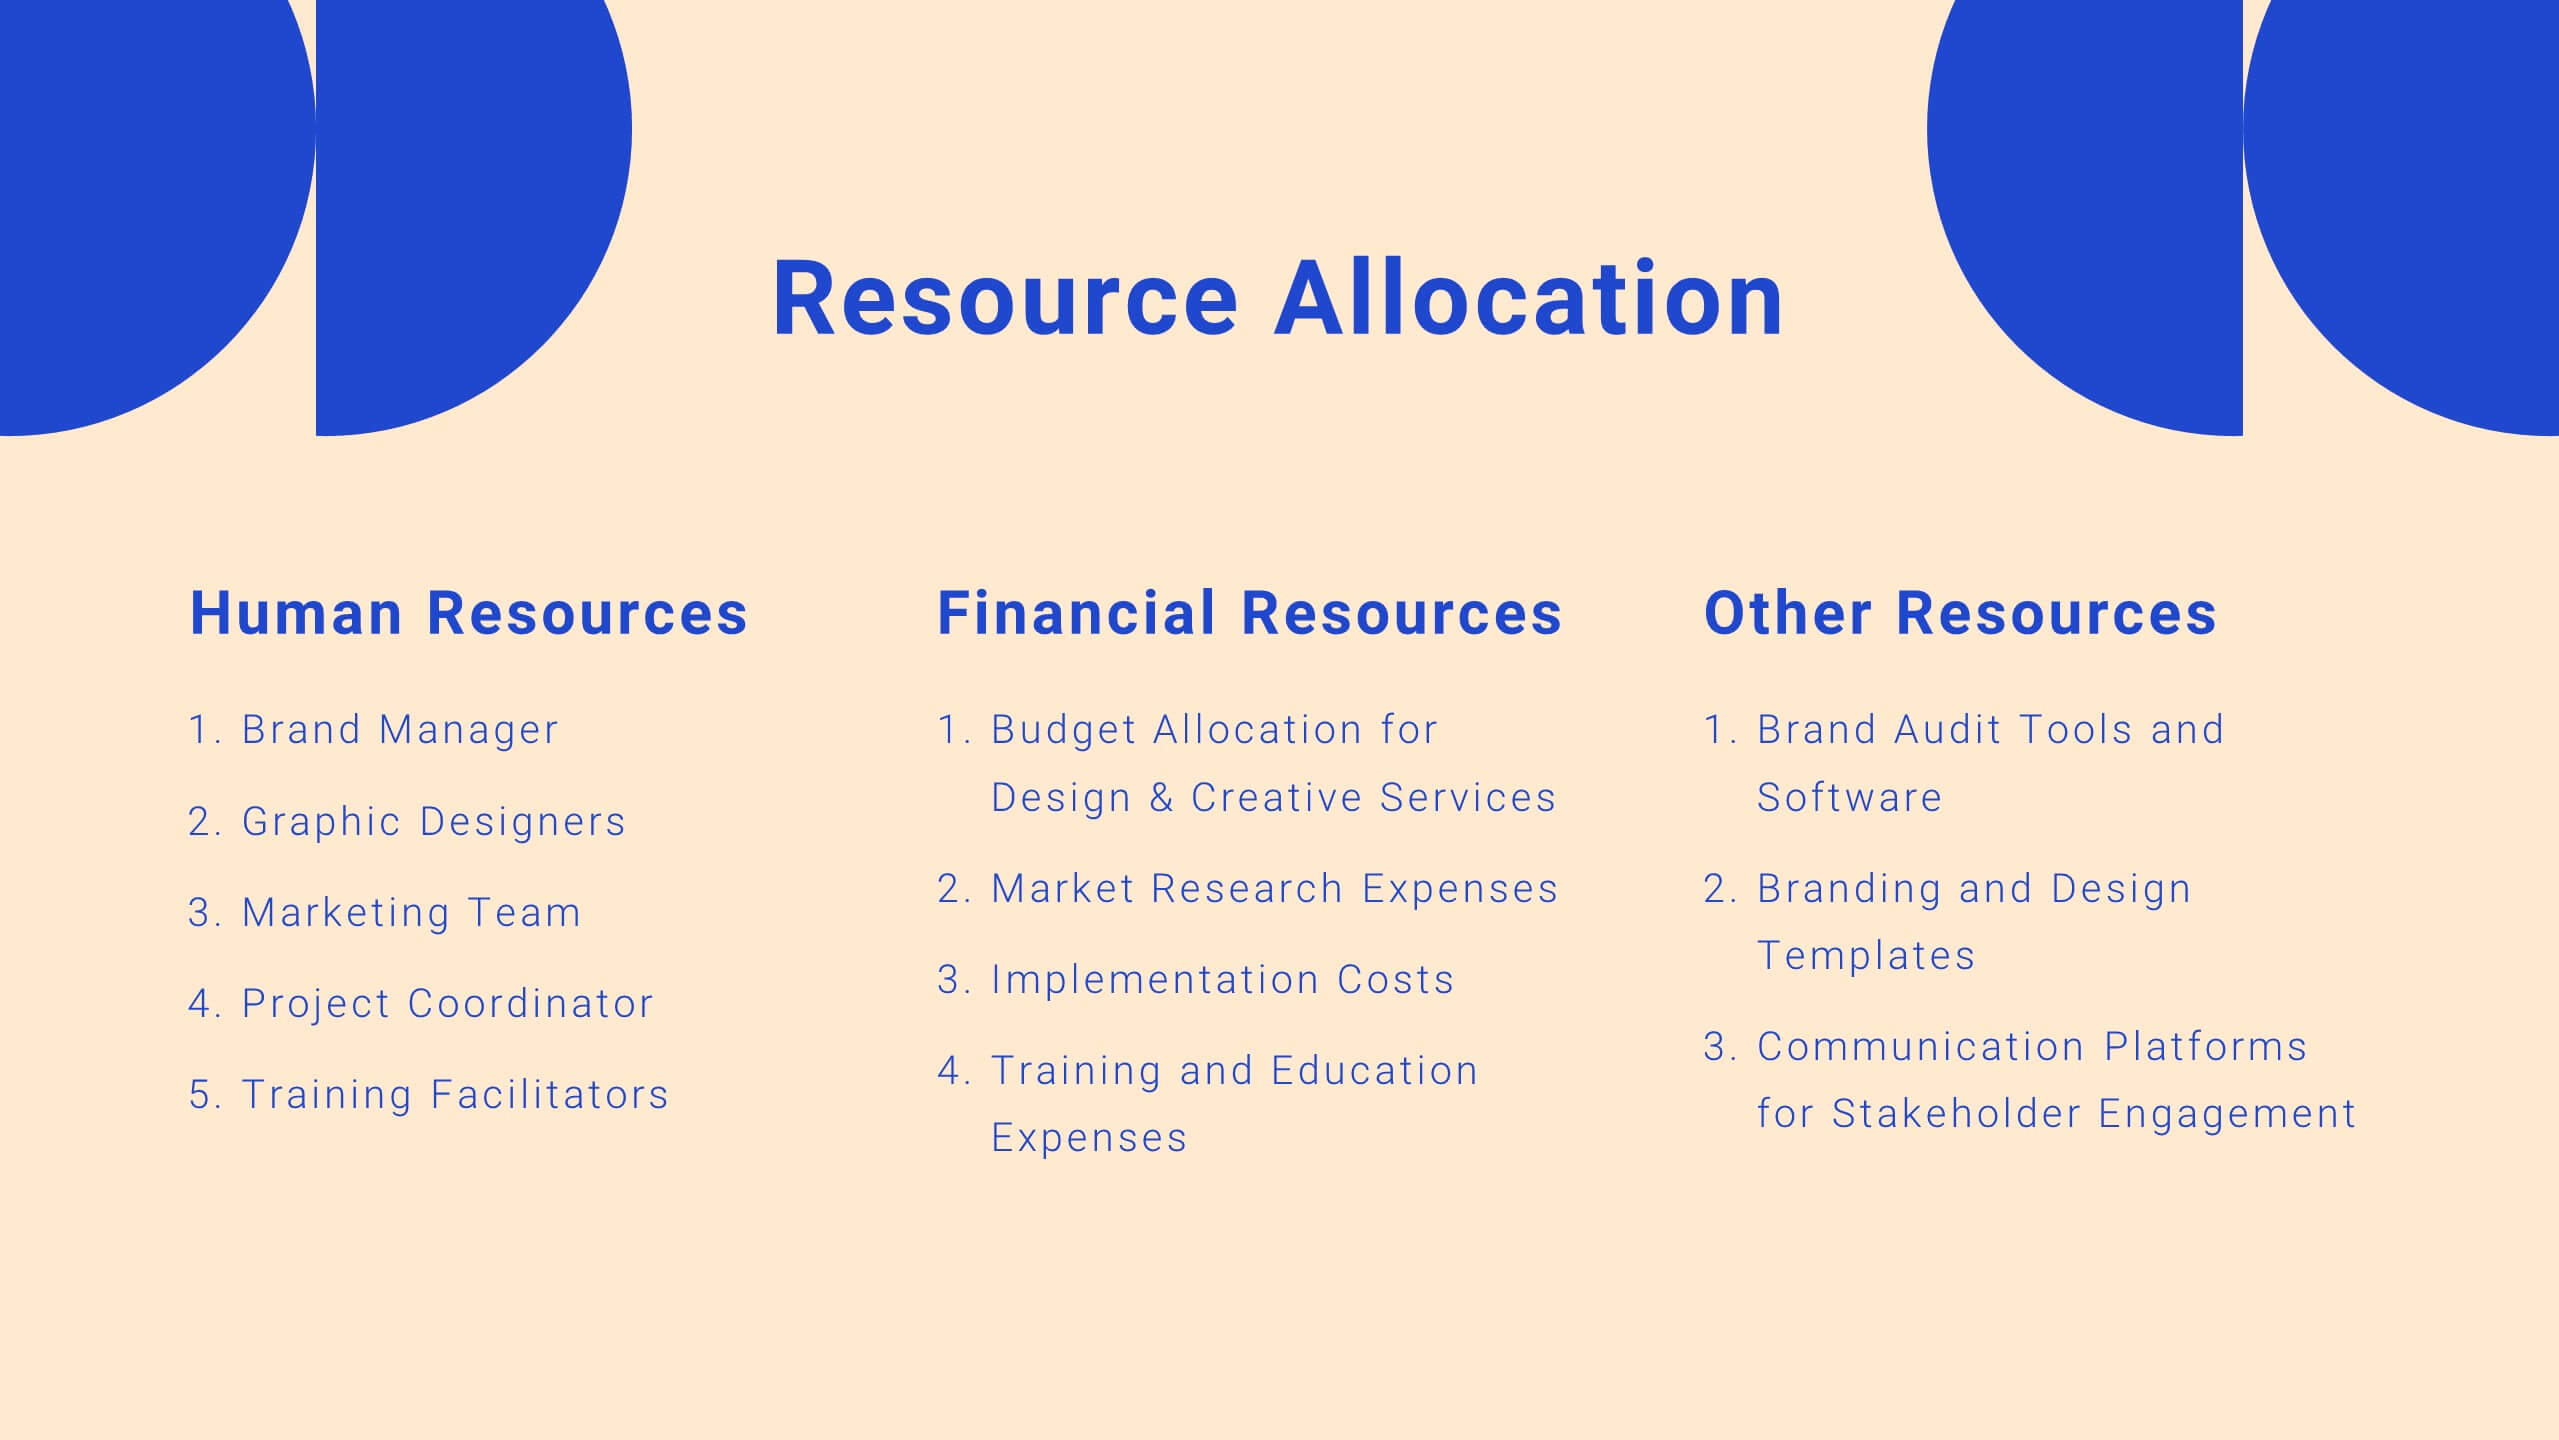
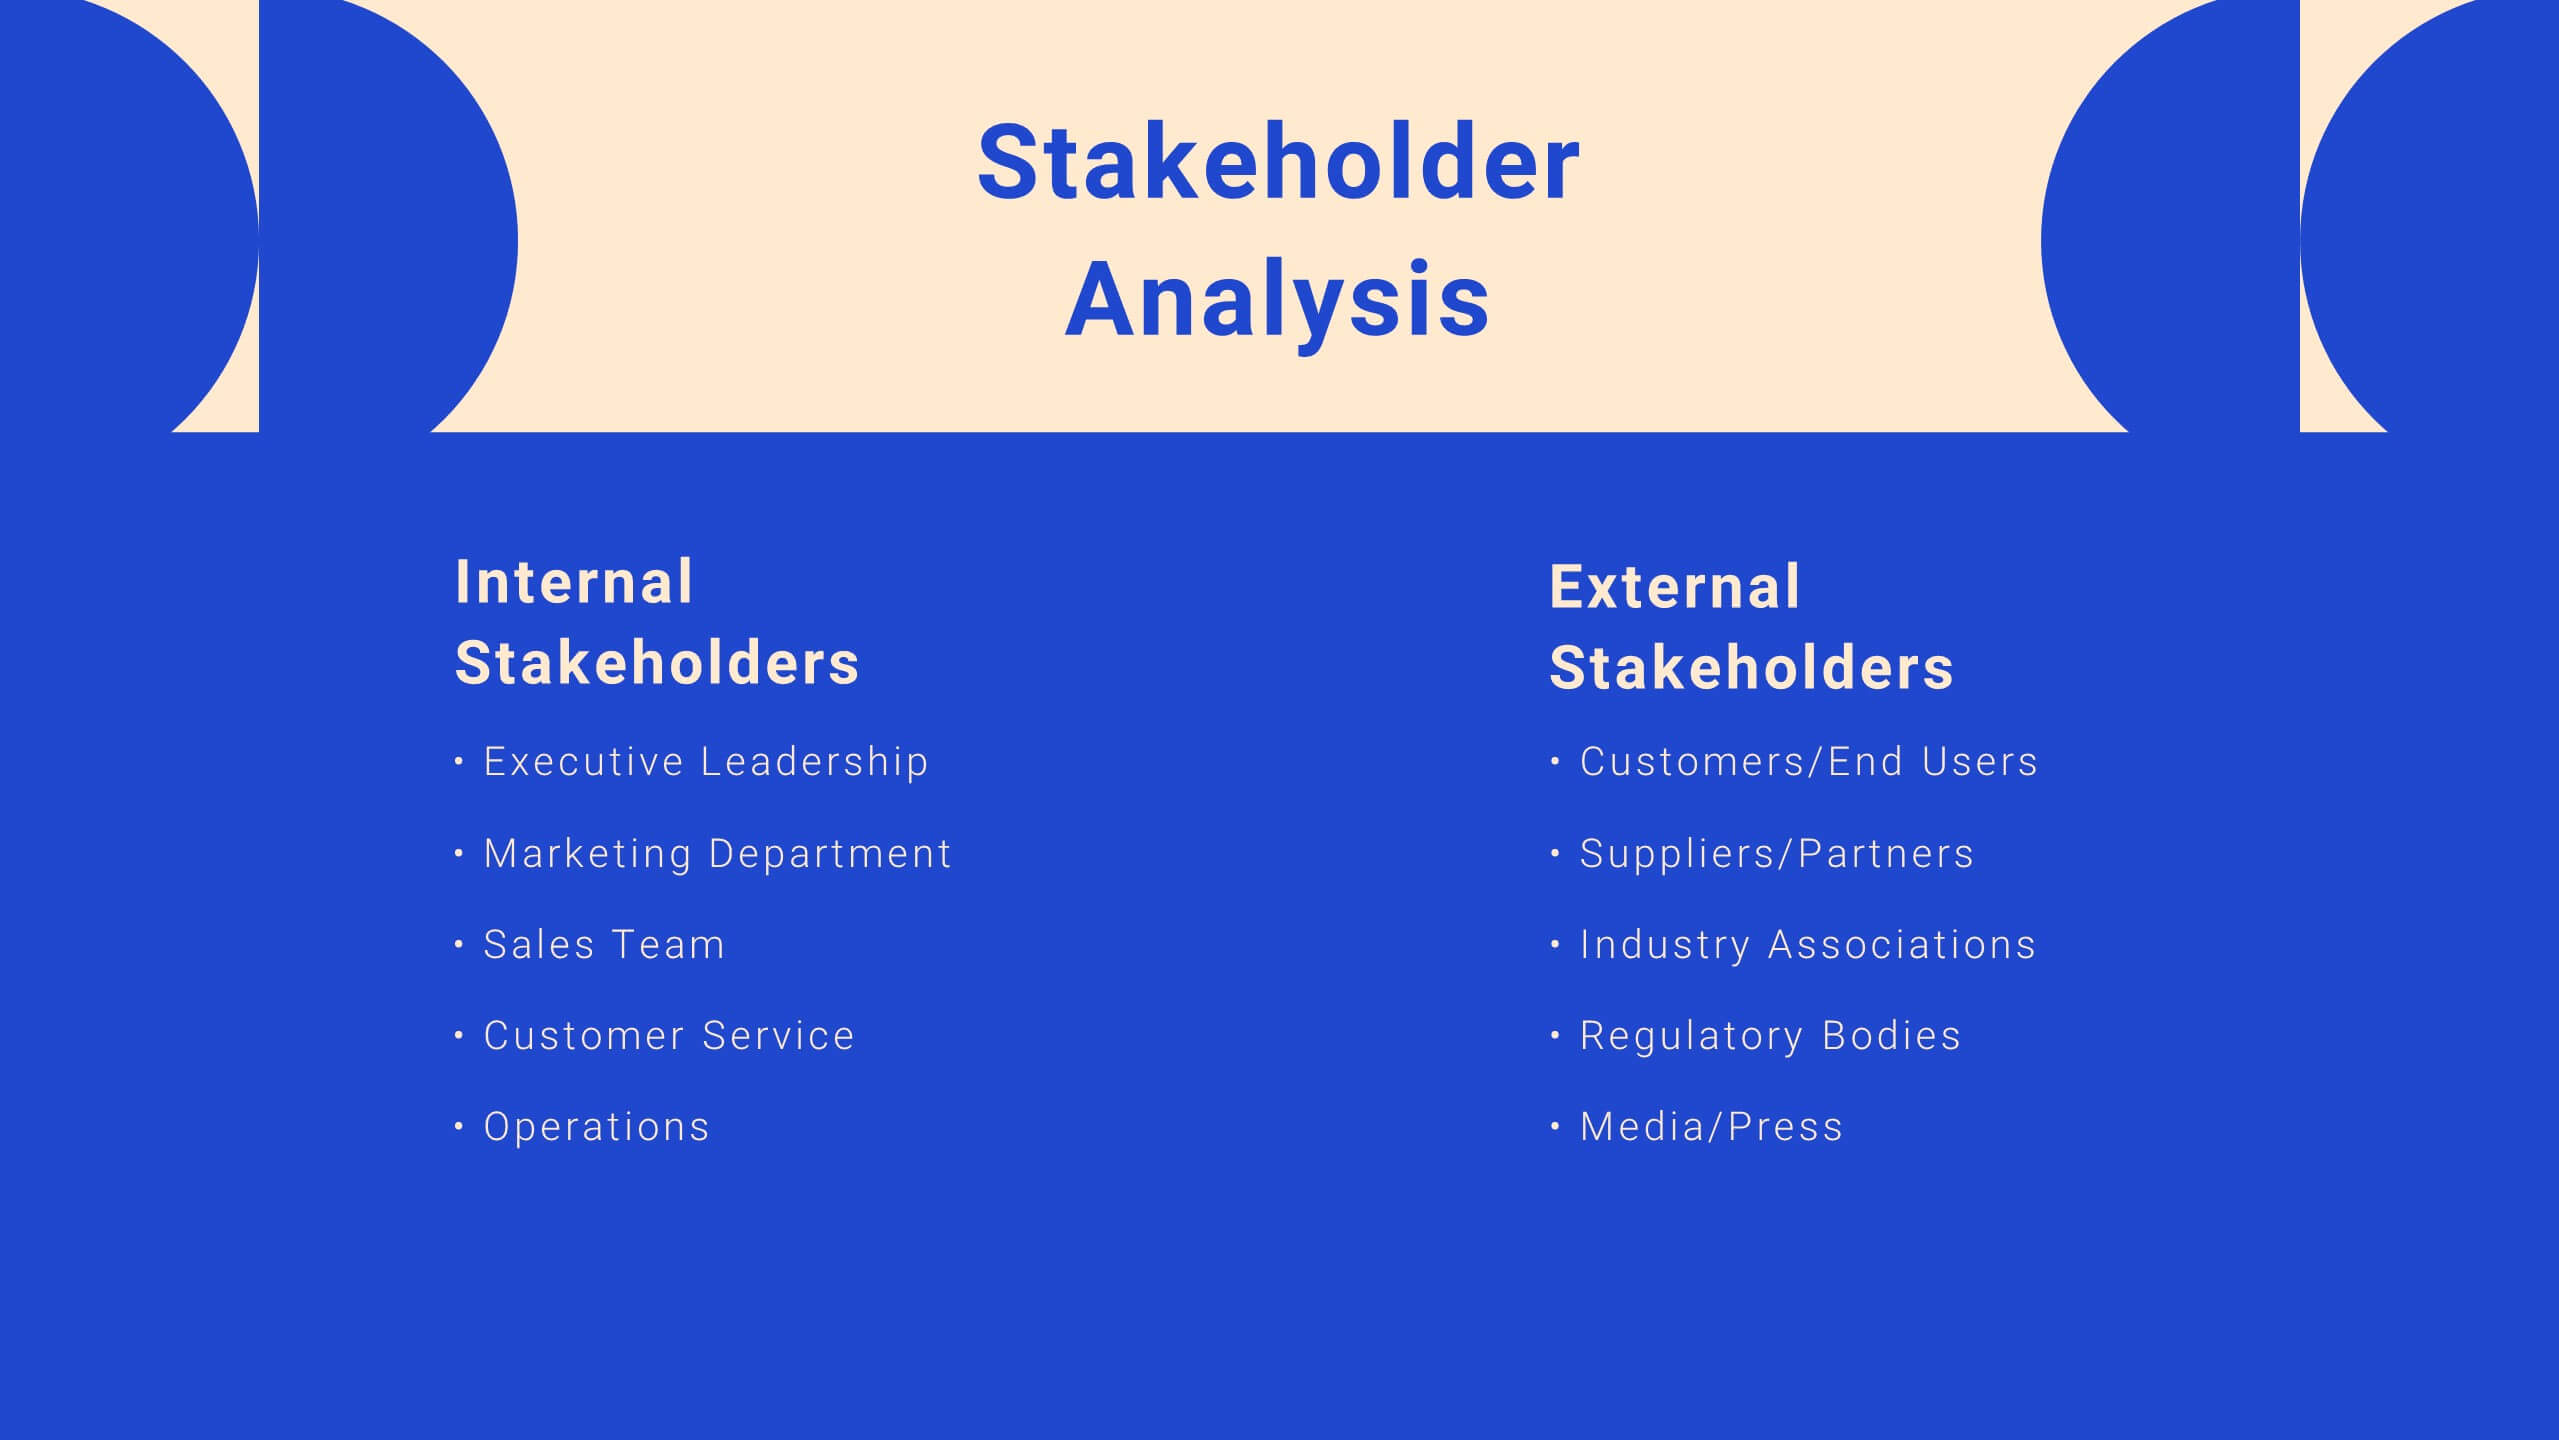
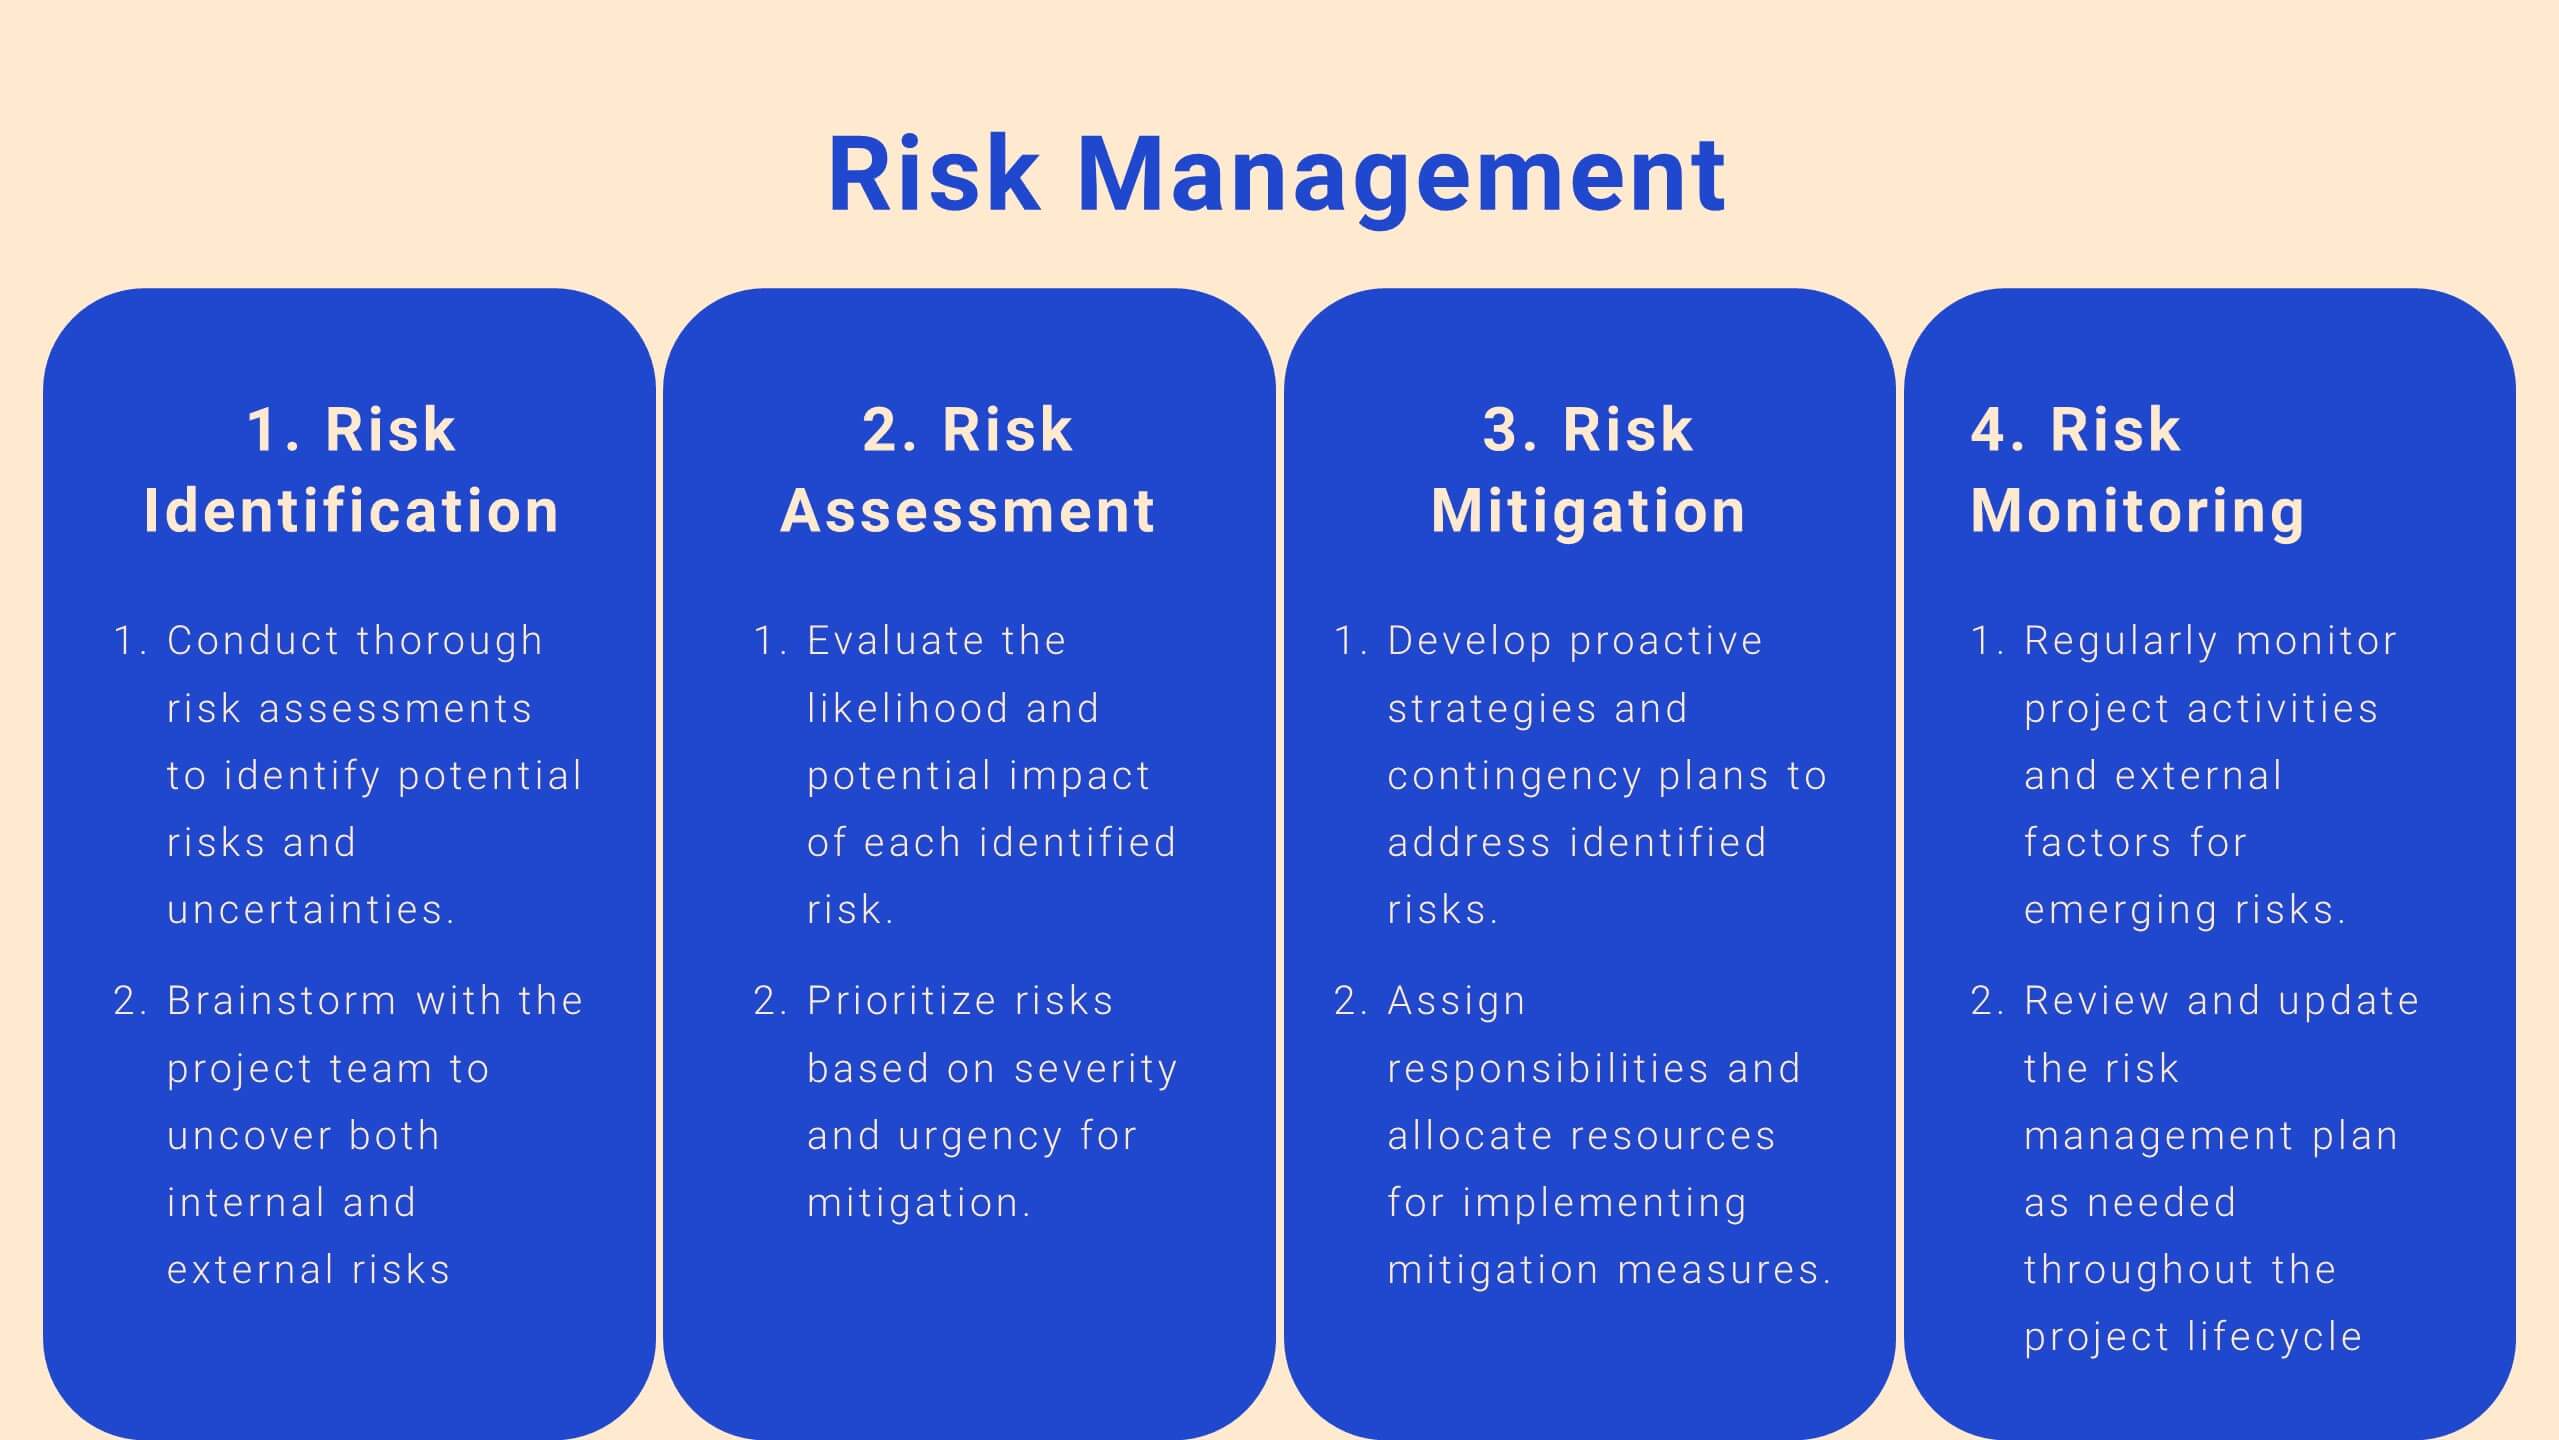
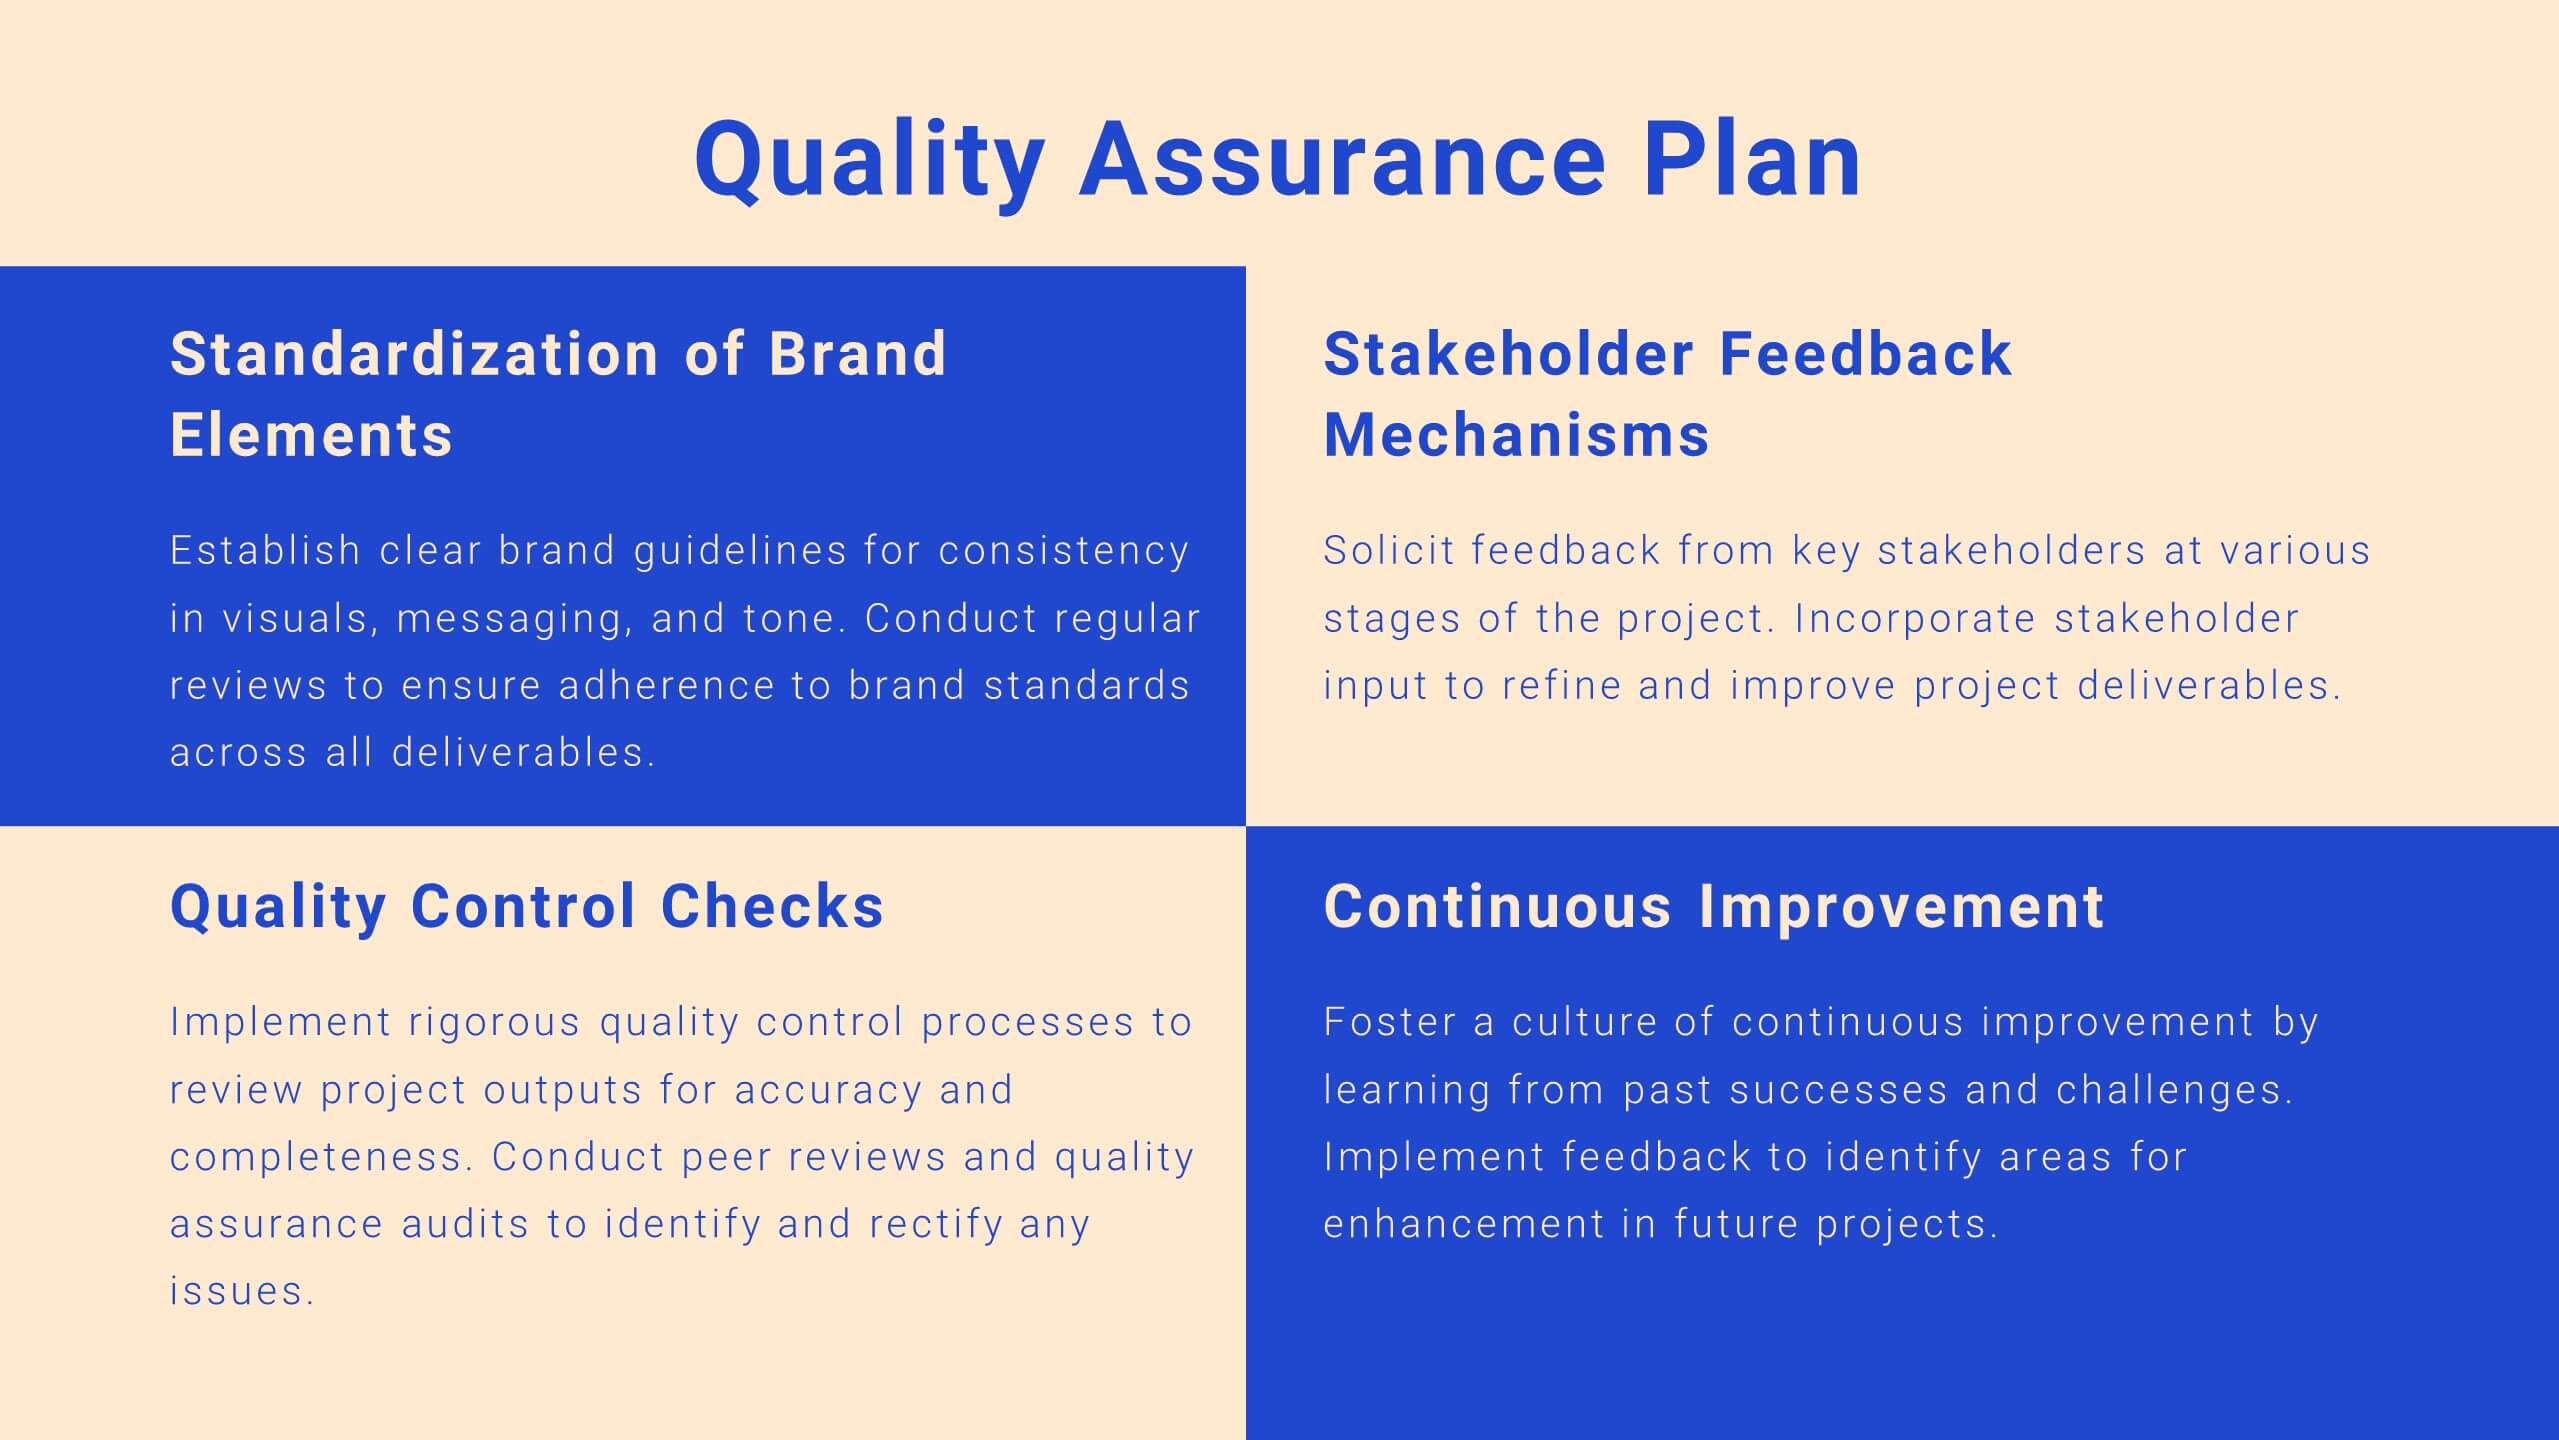
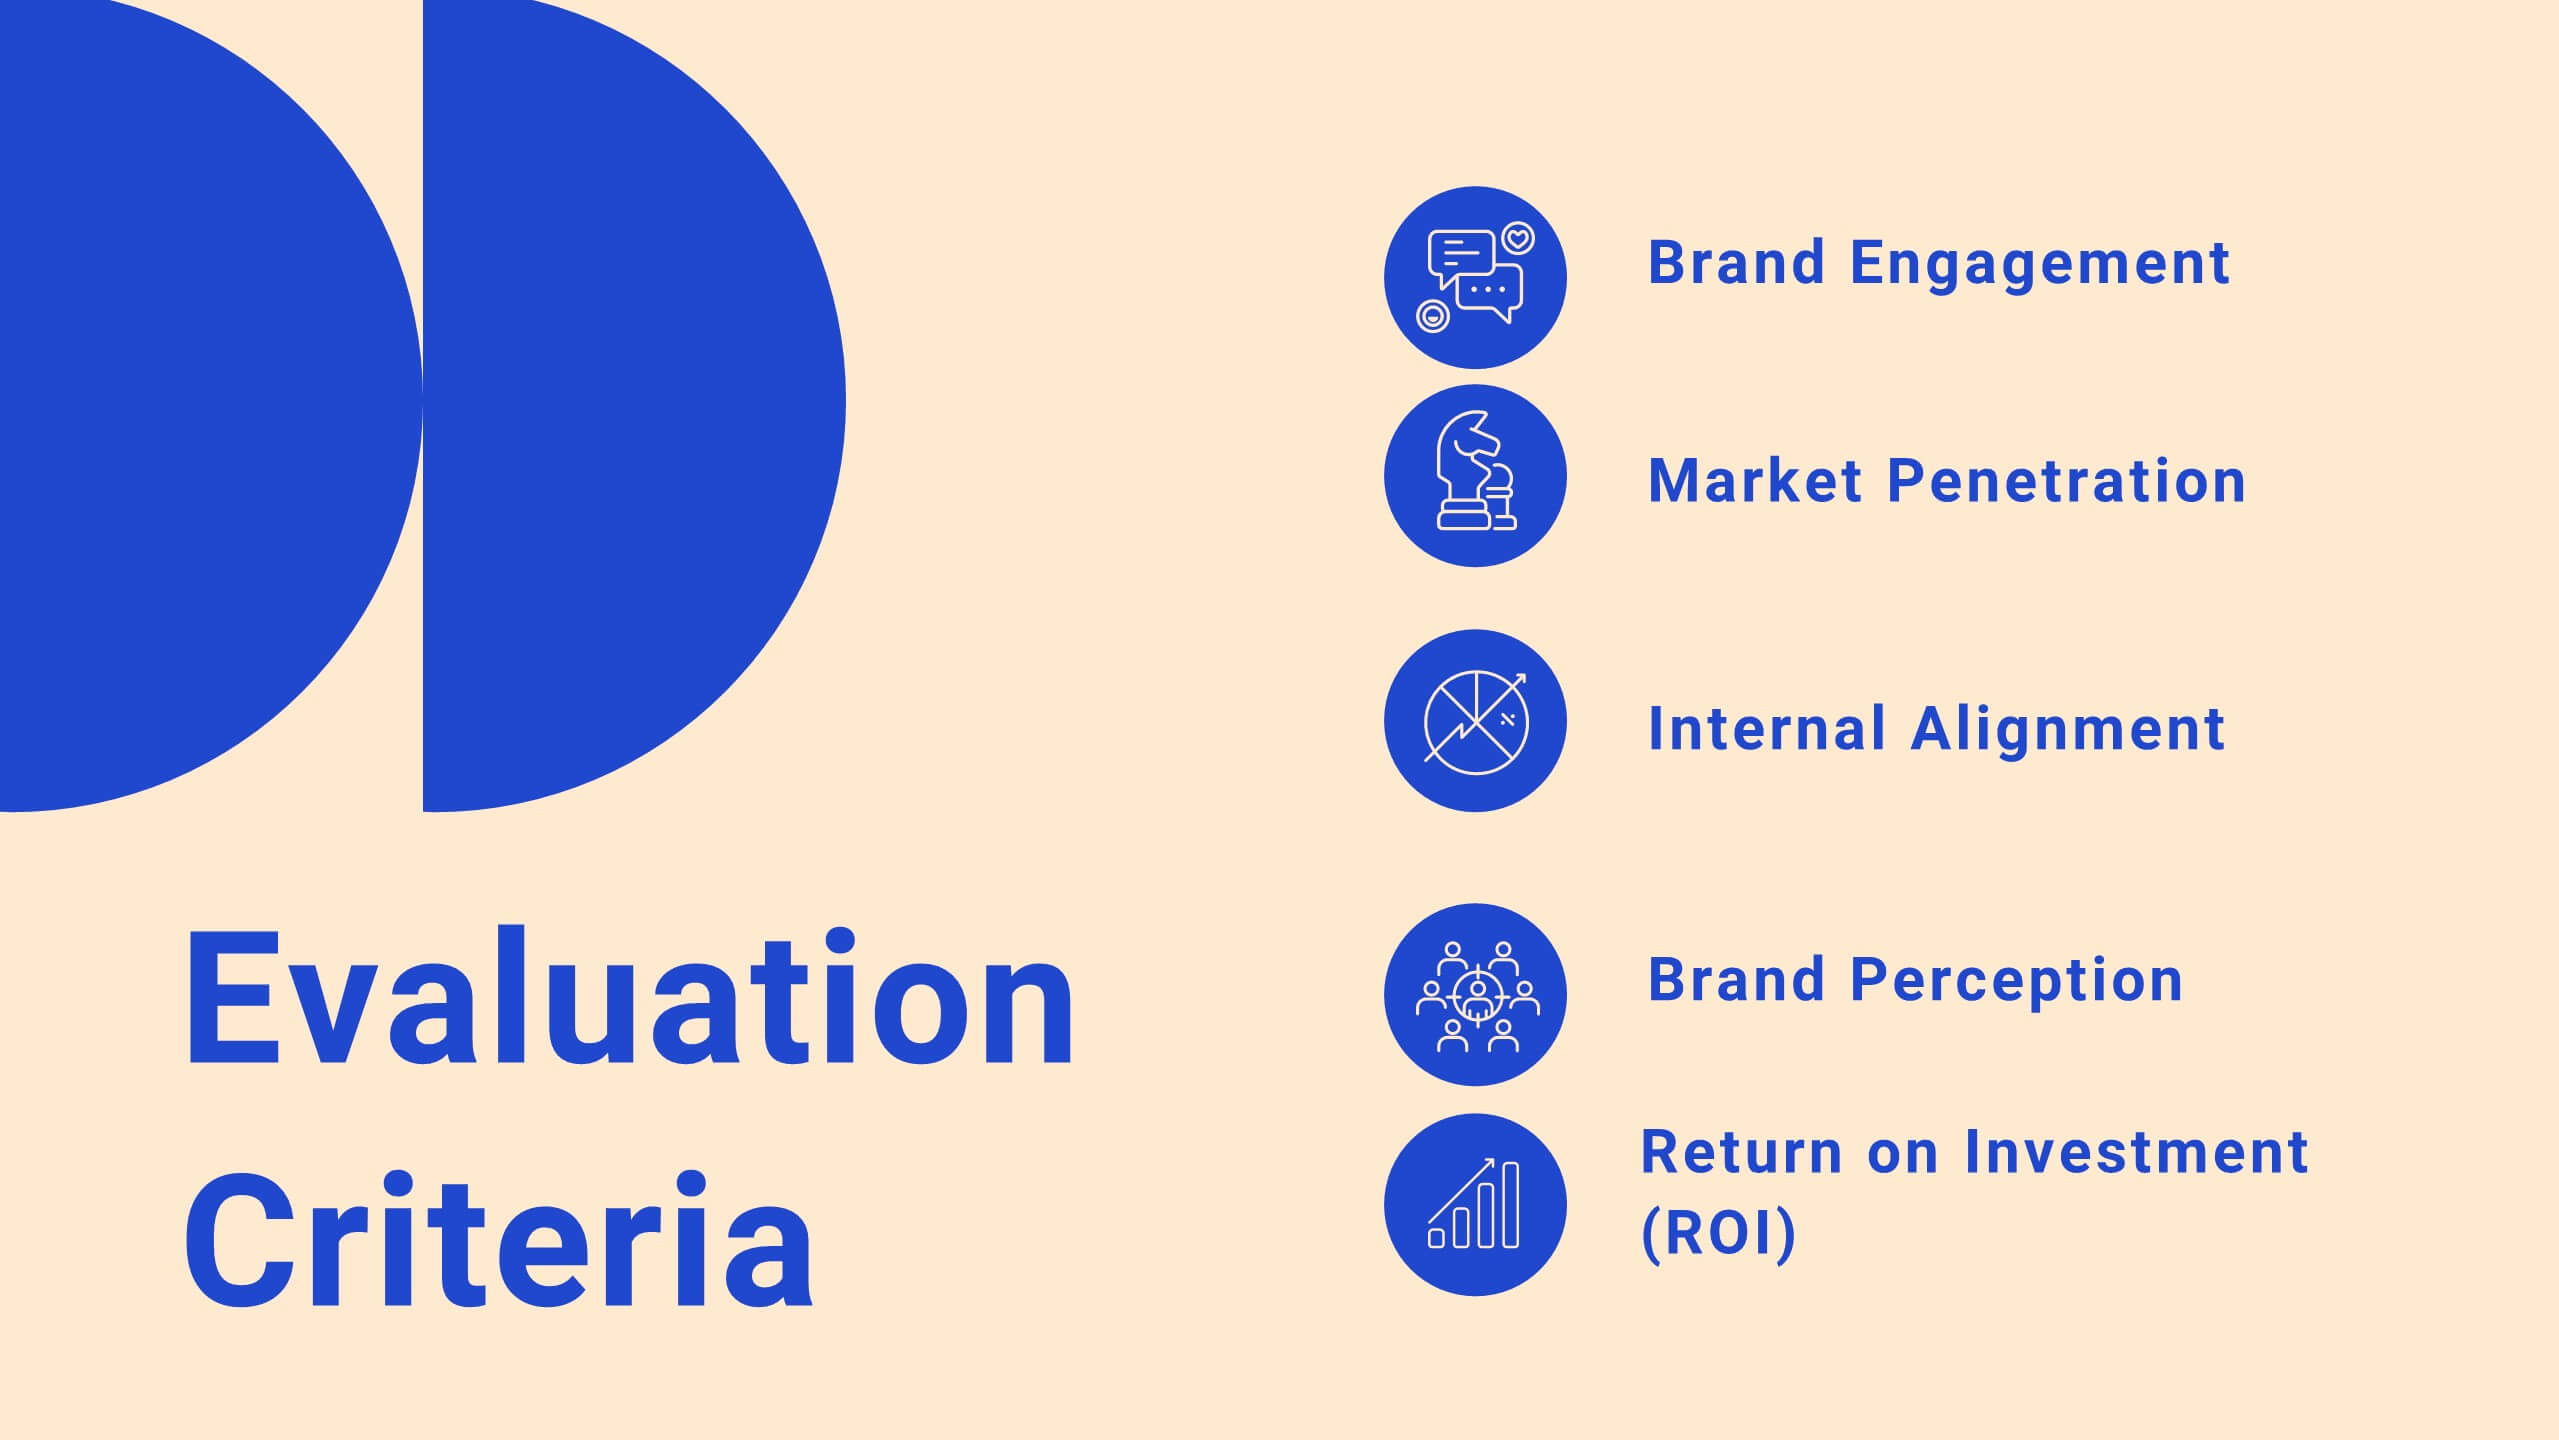
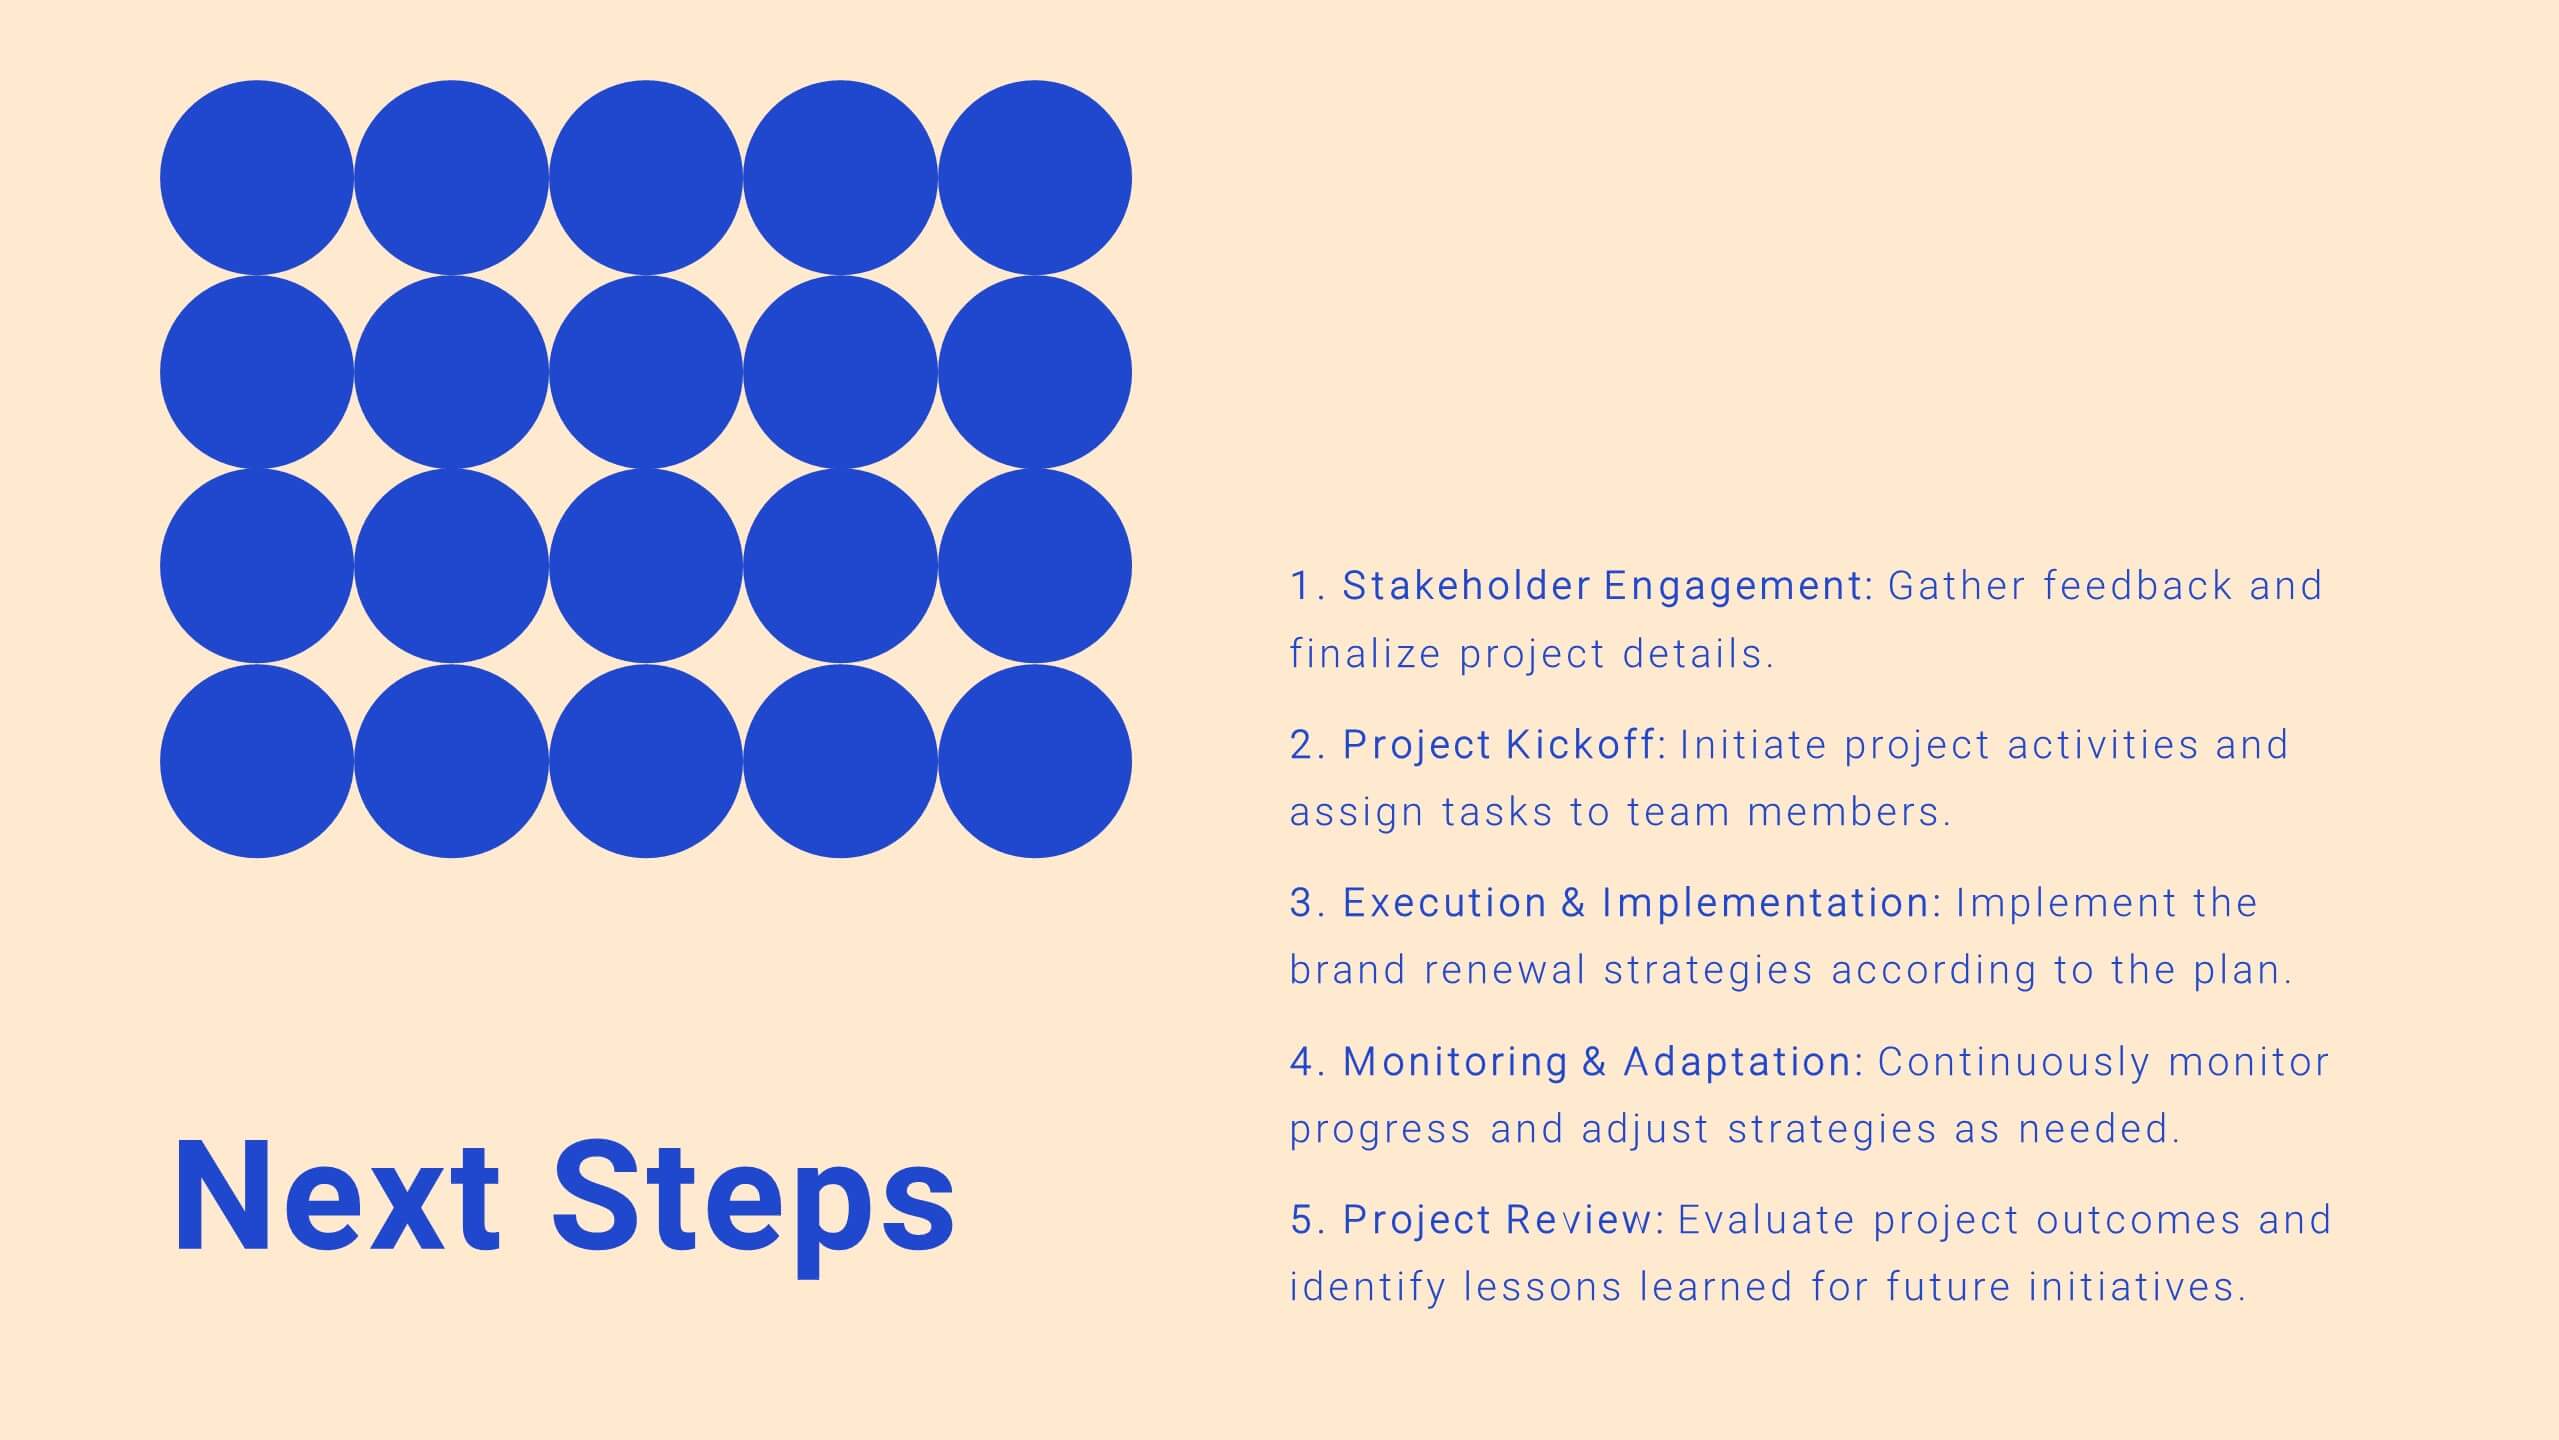
Take control of your projects with this comprehensive project plan template! From introductions to detailed objectives, this template covers scope of work, methodology, timelines, budget breakdowns, and risk management. Ideal for ensuring your project stays on track, it also includes stakeholder analysis and quality assurance plans. Compatible with PowerPoint, Keynote, and Google Slides.


6 slides
Business Roadmap Strategy Presentation
Map your path to success with this Business Roadmap Strategy template. Designed for clarity and impact, it helps you outline goals, milestones, and timelines in a visual journey. Ideal for team planning, strategy meetings, and pitches. Compatible with PowerPoint, Keynote, and Google Slides for seamless editing.


5 slides
Business Workflow Process Presentation
Optimize your operations with the Business Workflow Process template, designed to visually map out tasks and streamline workflows. Perfect for project managers and teams, this template enhances clarity and collaboration. Fully customizable and compatible with PowerPoint, Keynote, and Google Slides, making professional workflow presentations seamless and efficient.


26 slides
Katlina Presentation Template
Everyone wants to be on top of their SEO game. This Katlina presentation template provides a way for you to teach your audience about the importance of Search Engine Optimization. Start creating your own slides with this template. With fun graphics that will also make the information more interesting and easy to understand charts and timelines.This presentation will help your audience see how they can increase their sites visibility in search results. It can also be use for your presentations at work or in class due to it's customizability. Get started today makeing an impact in your industry.


26 slides
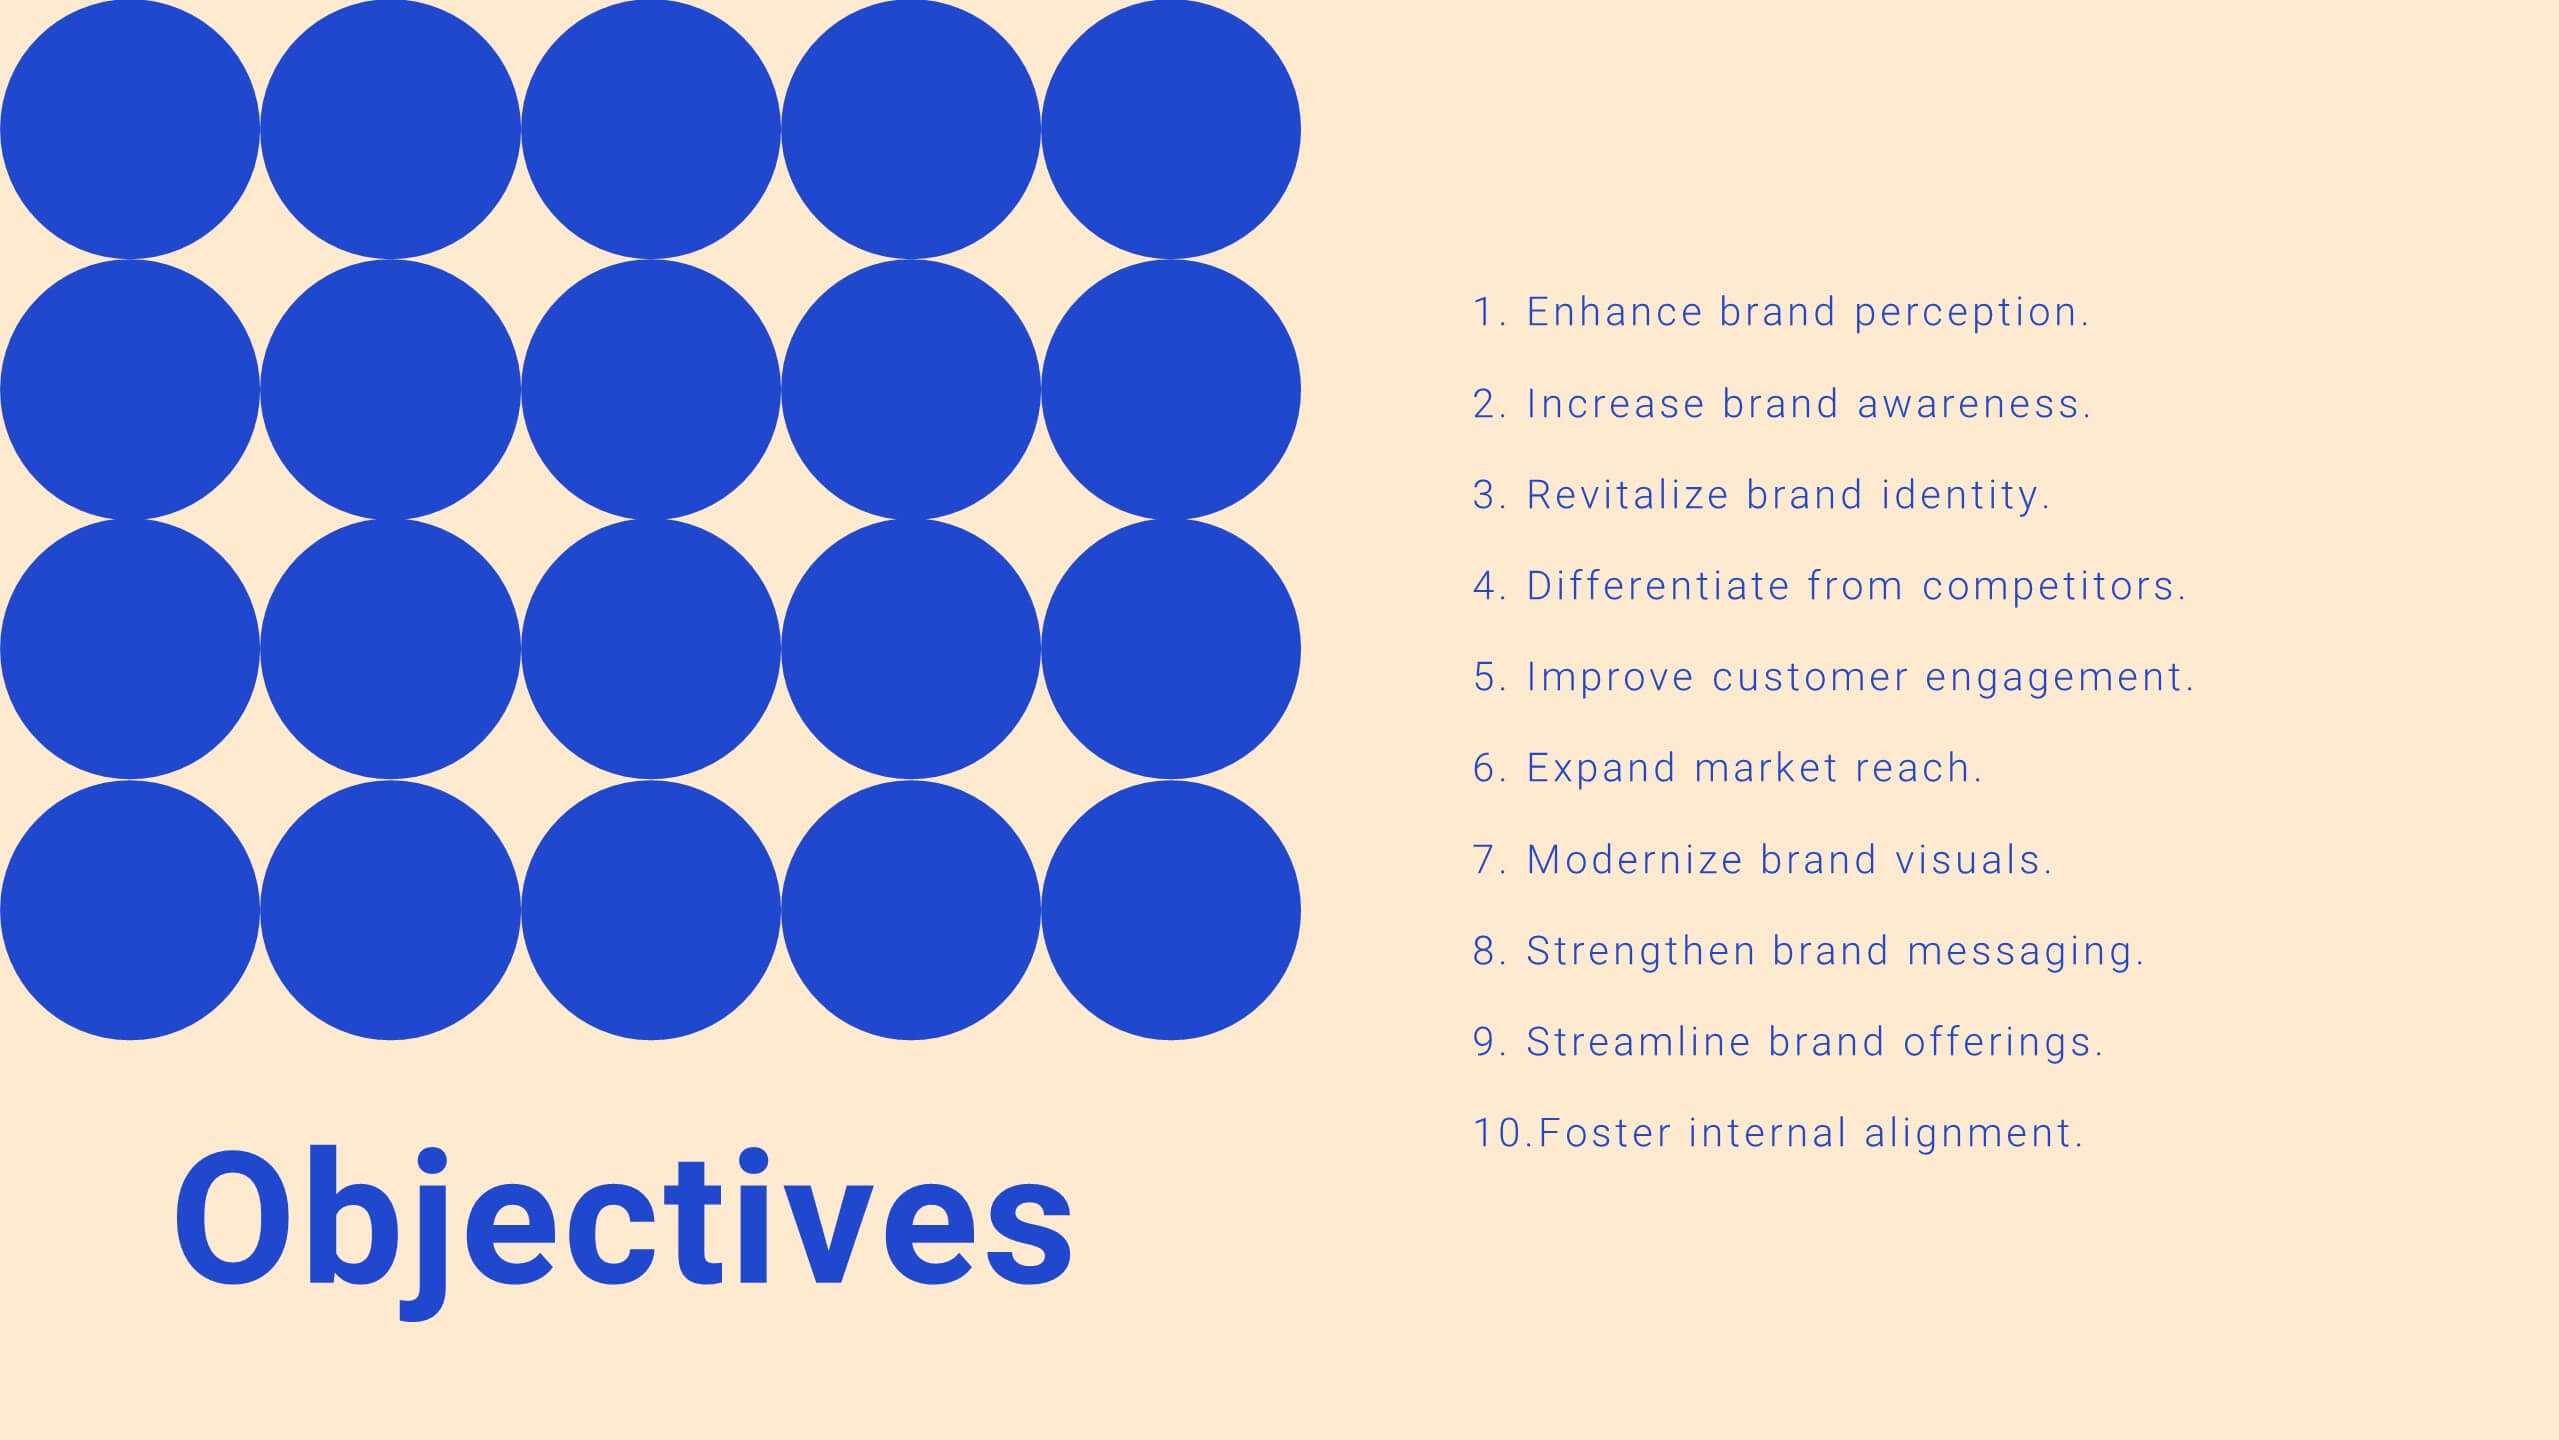
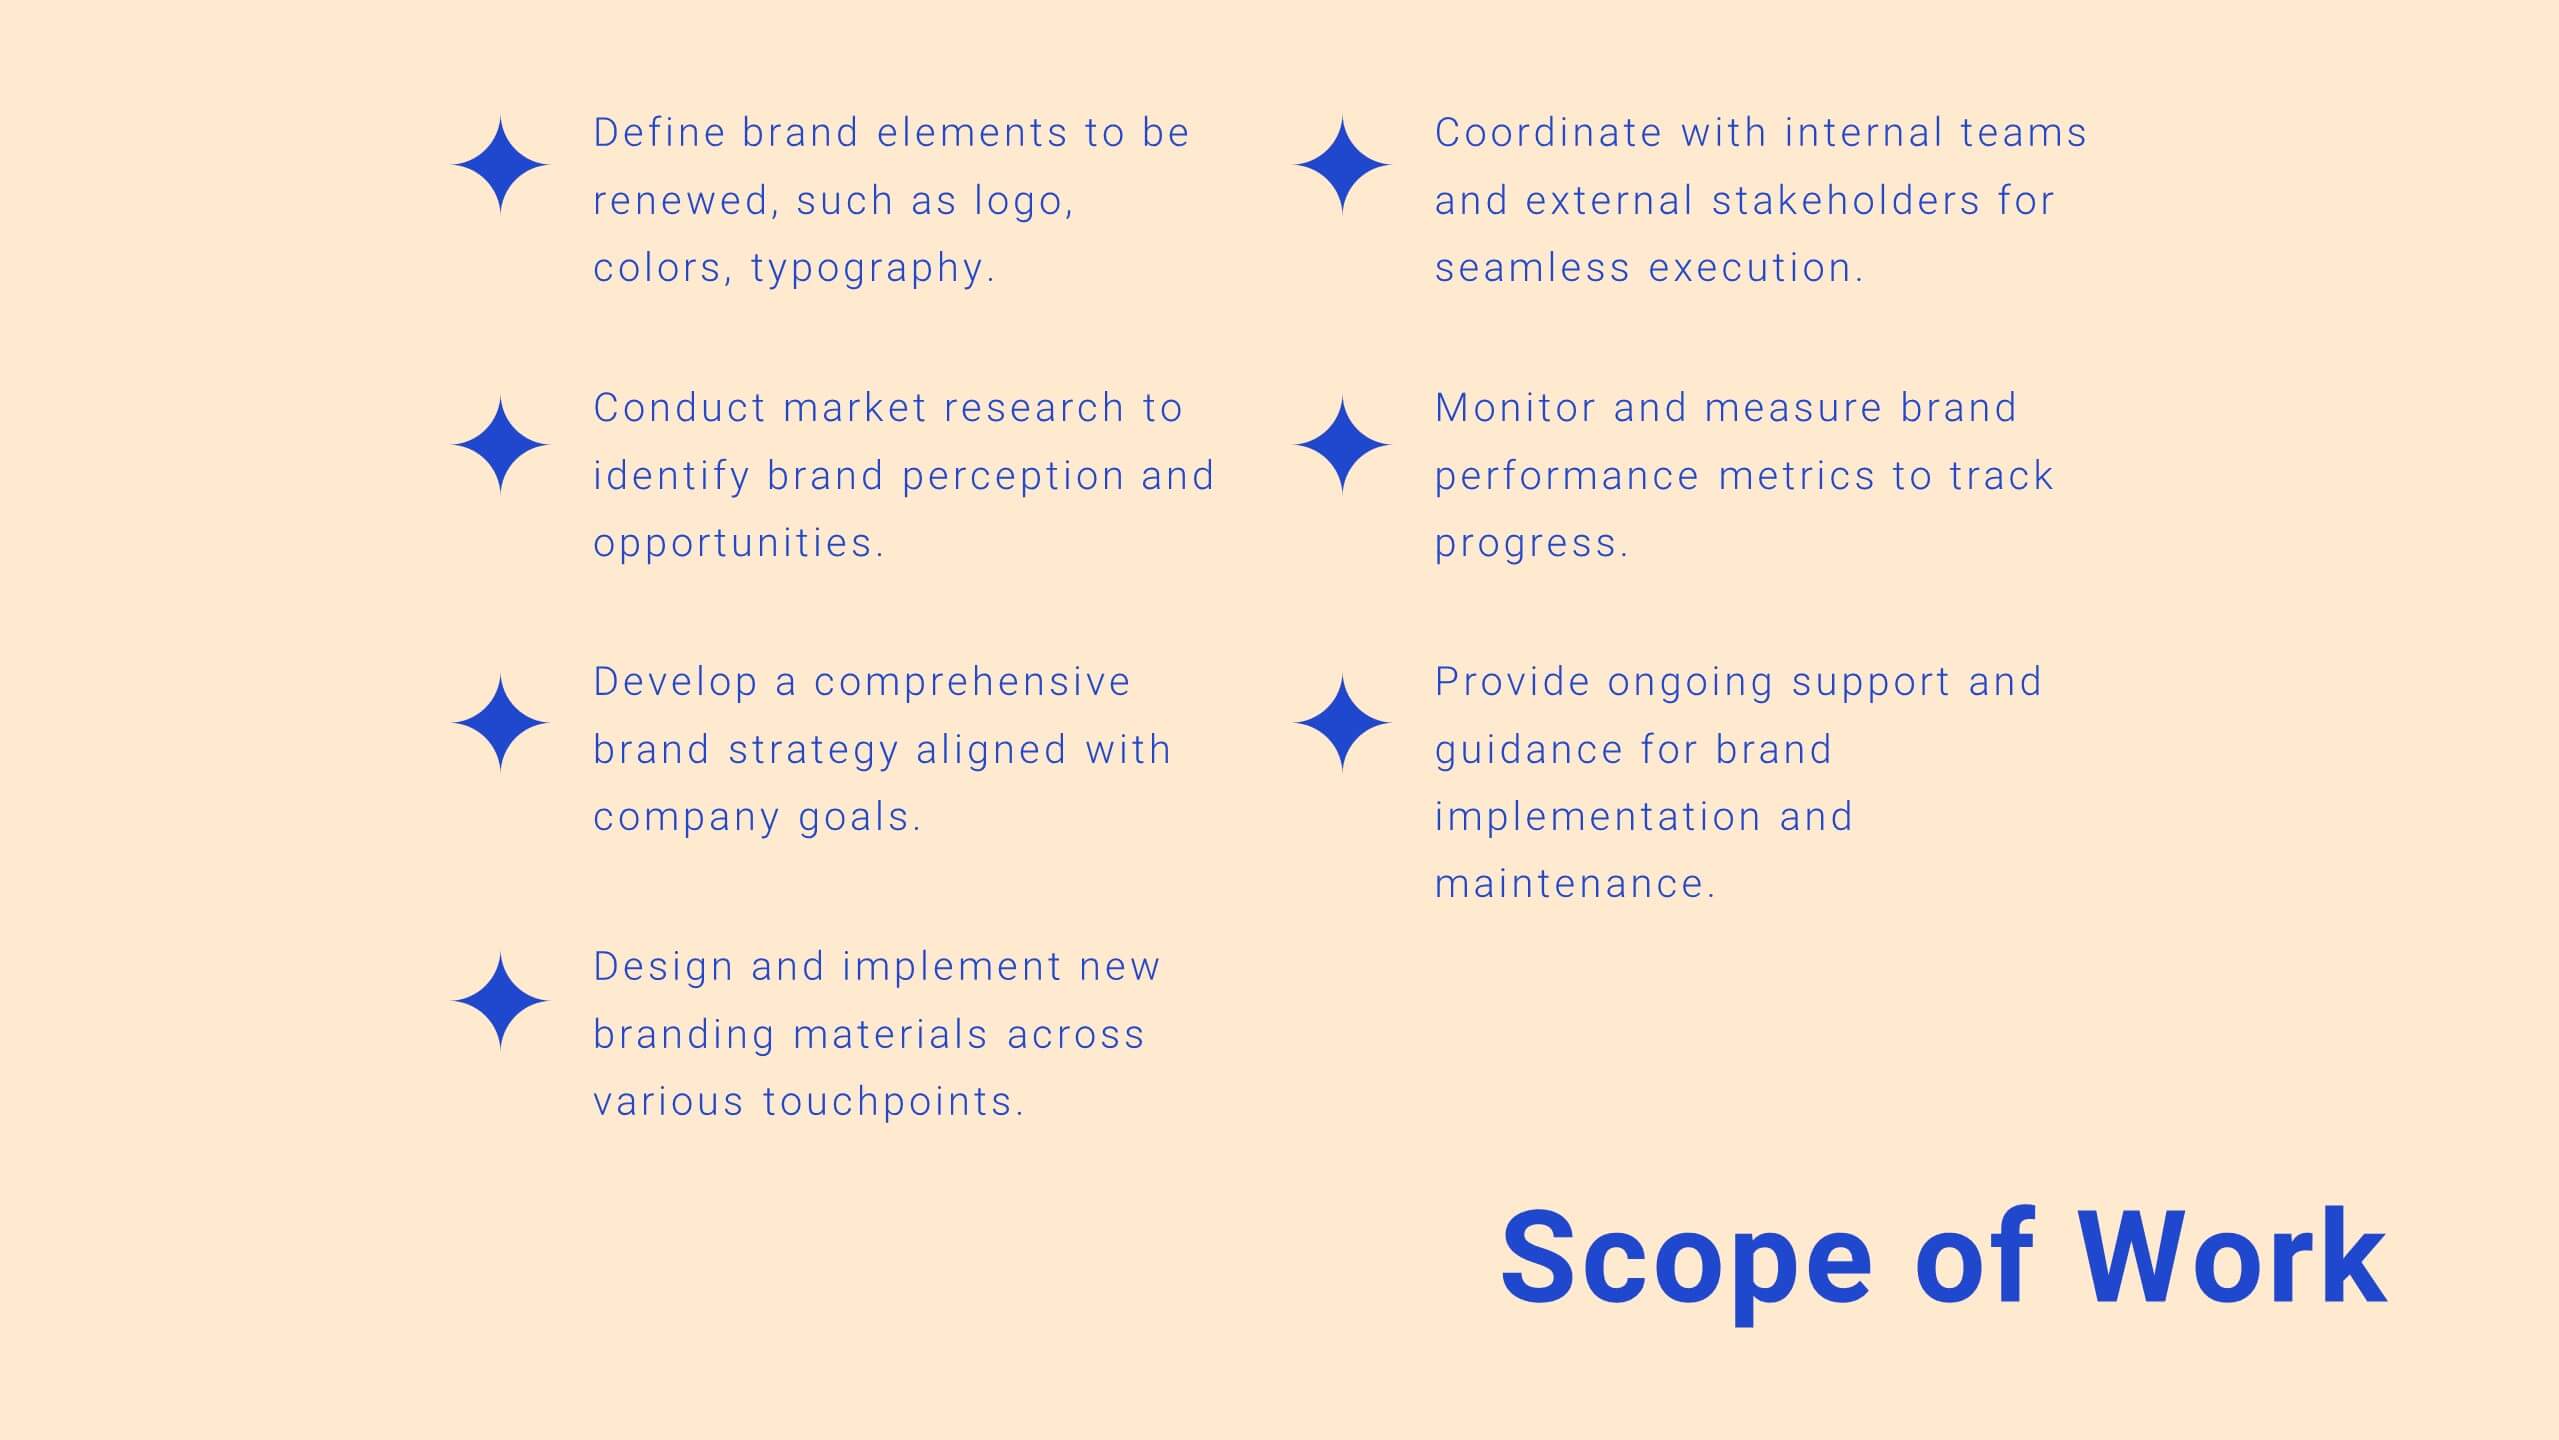
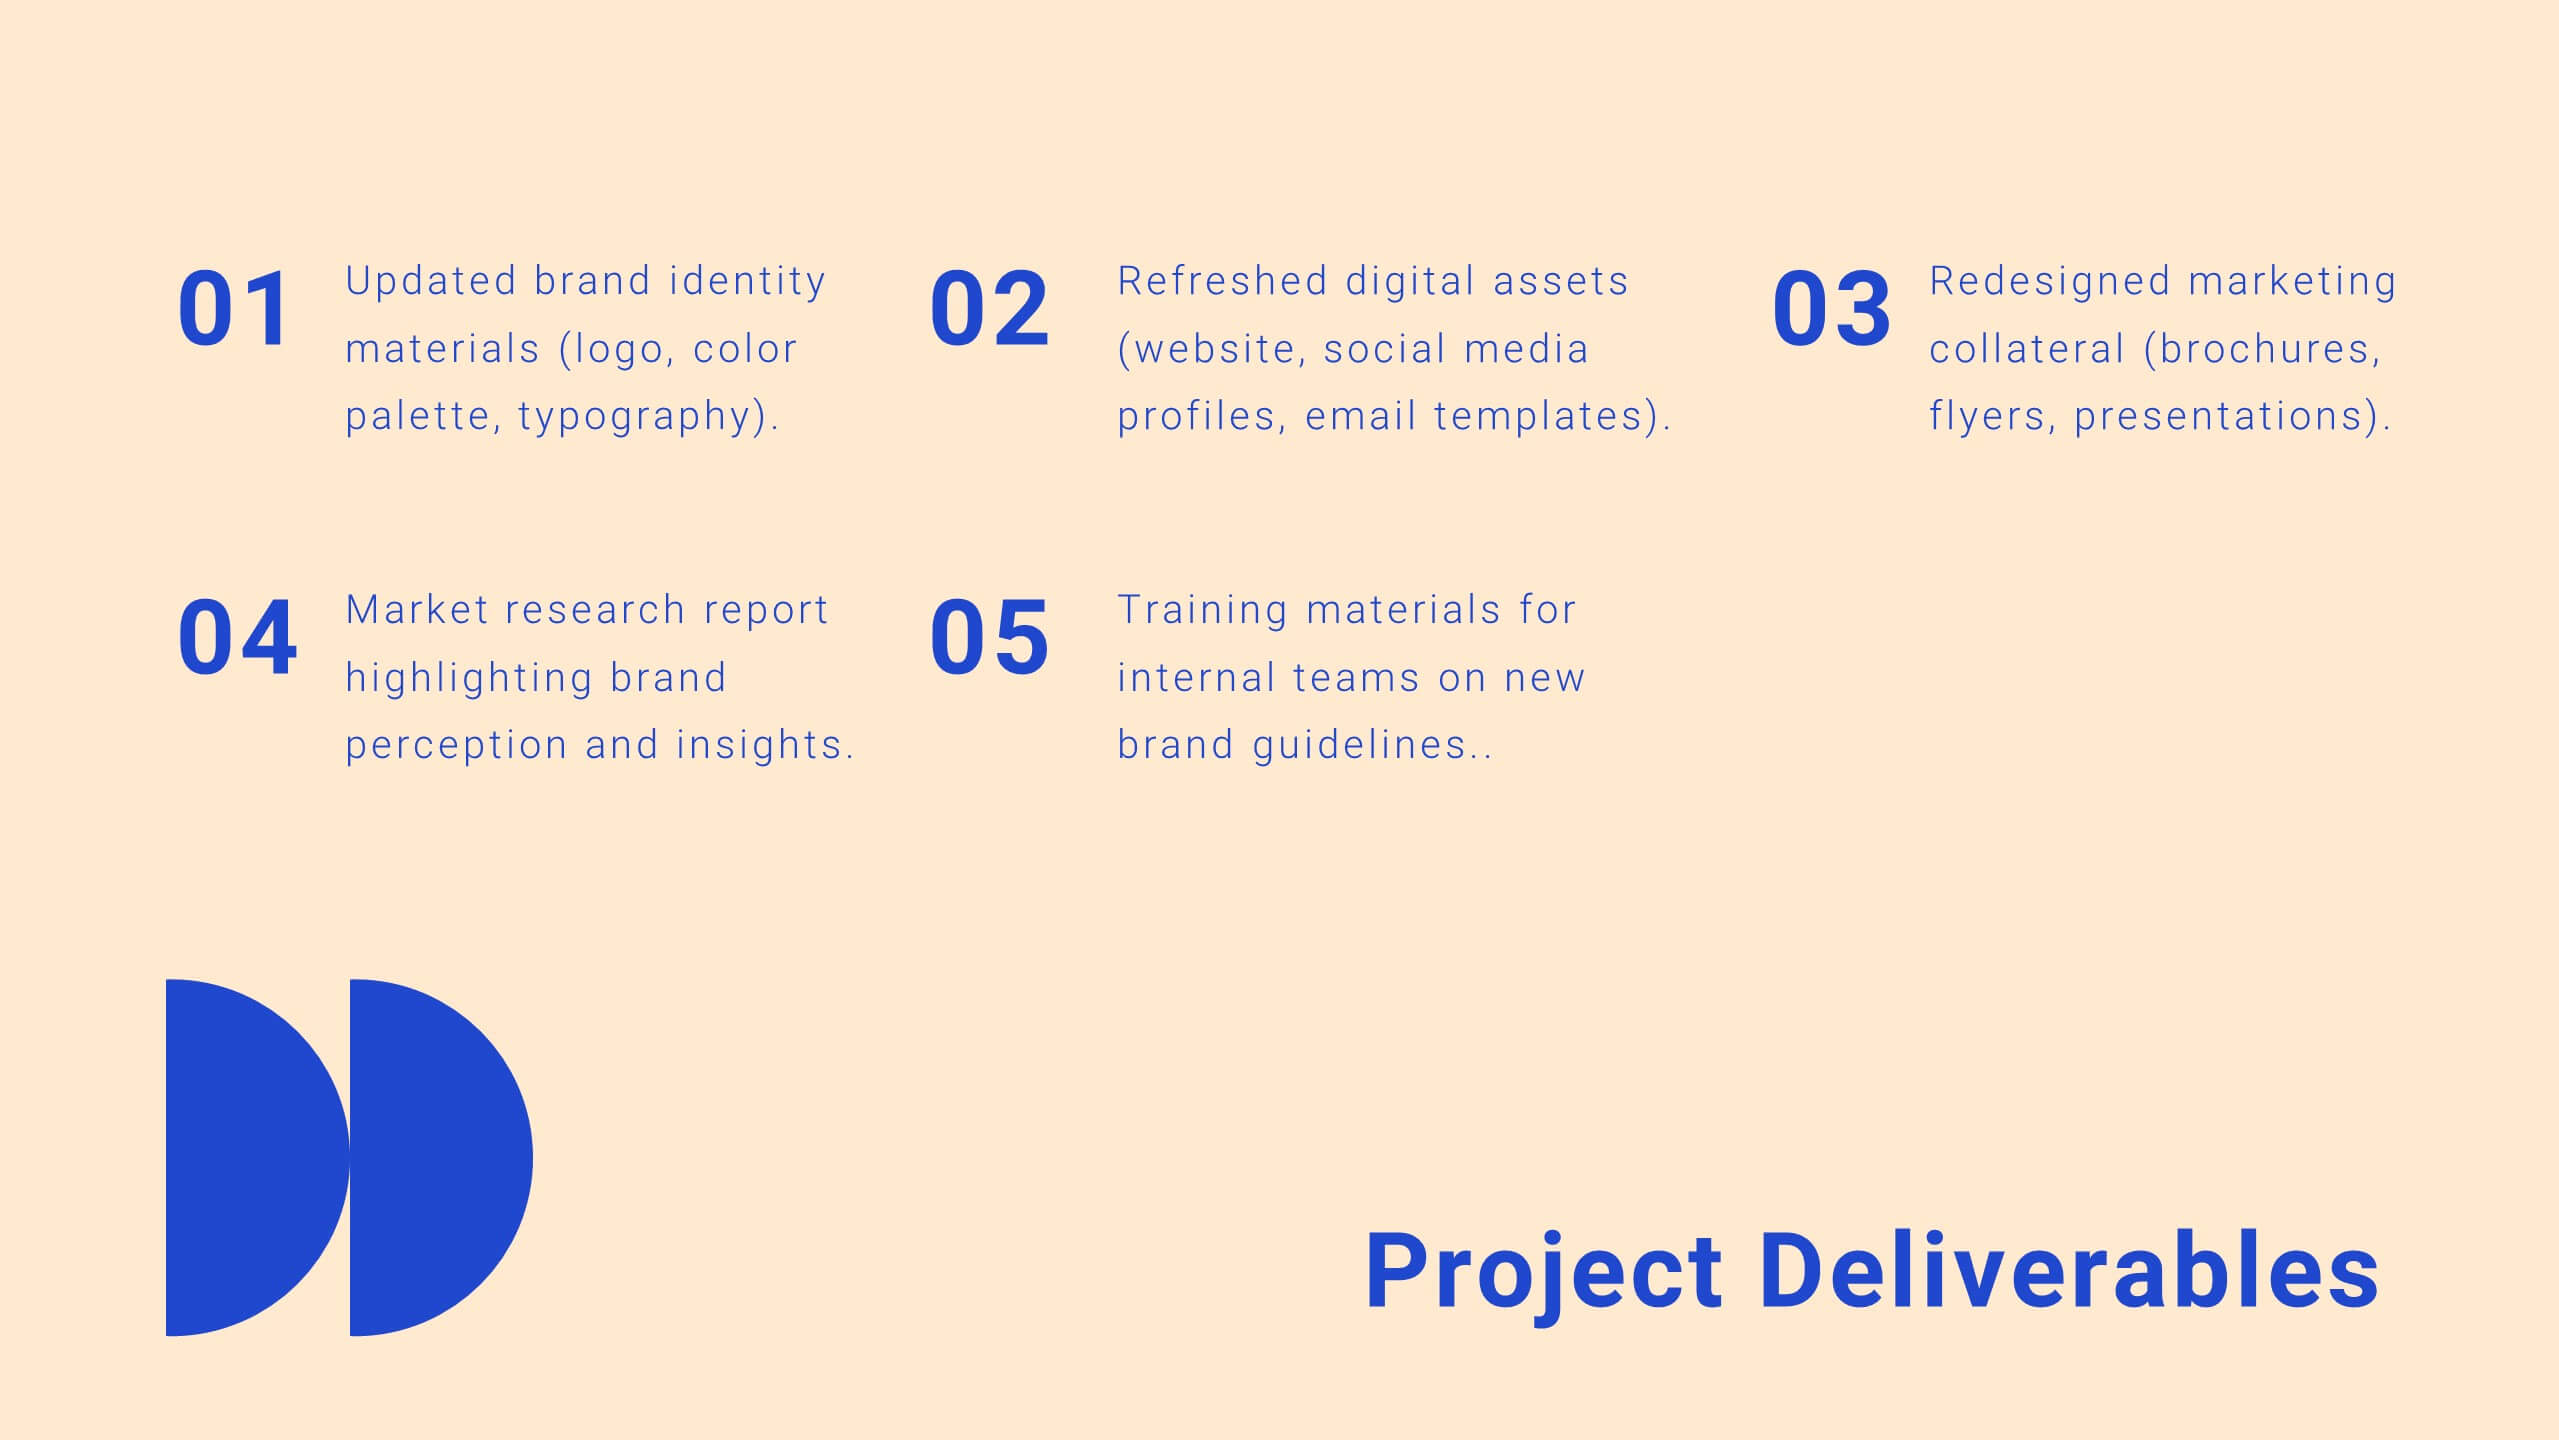
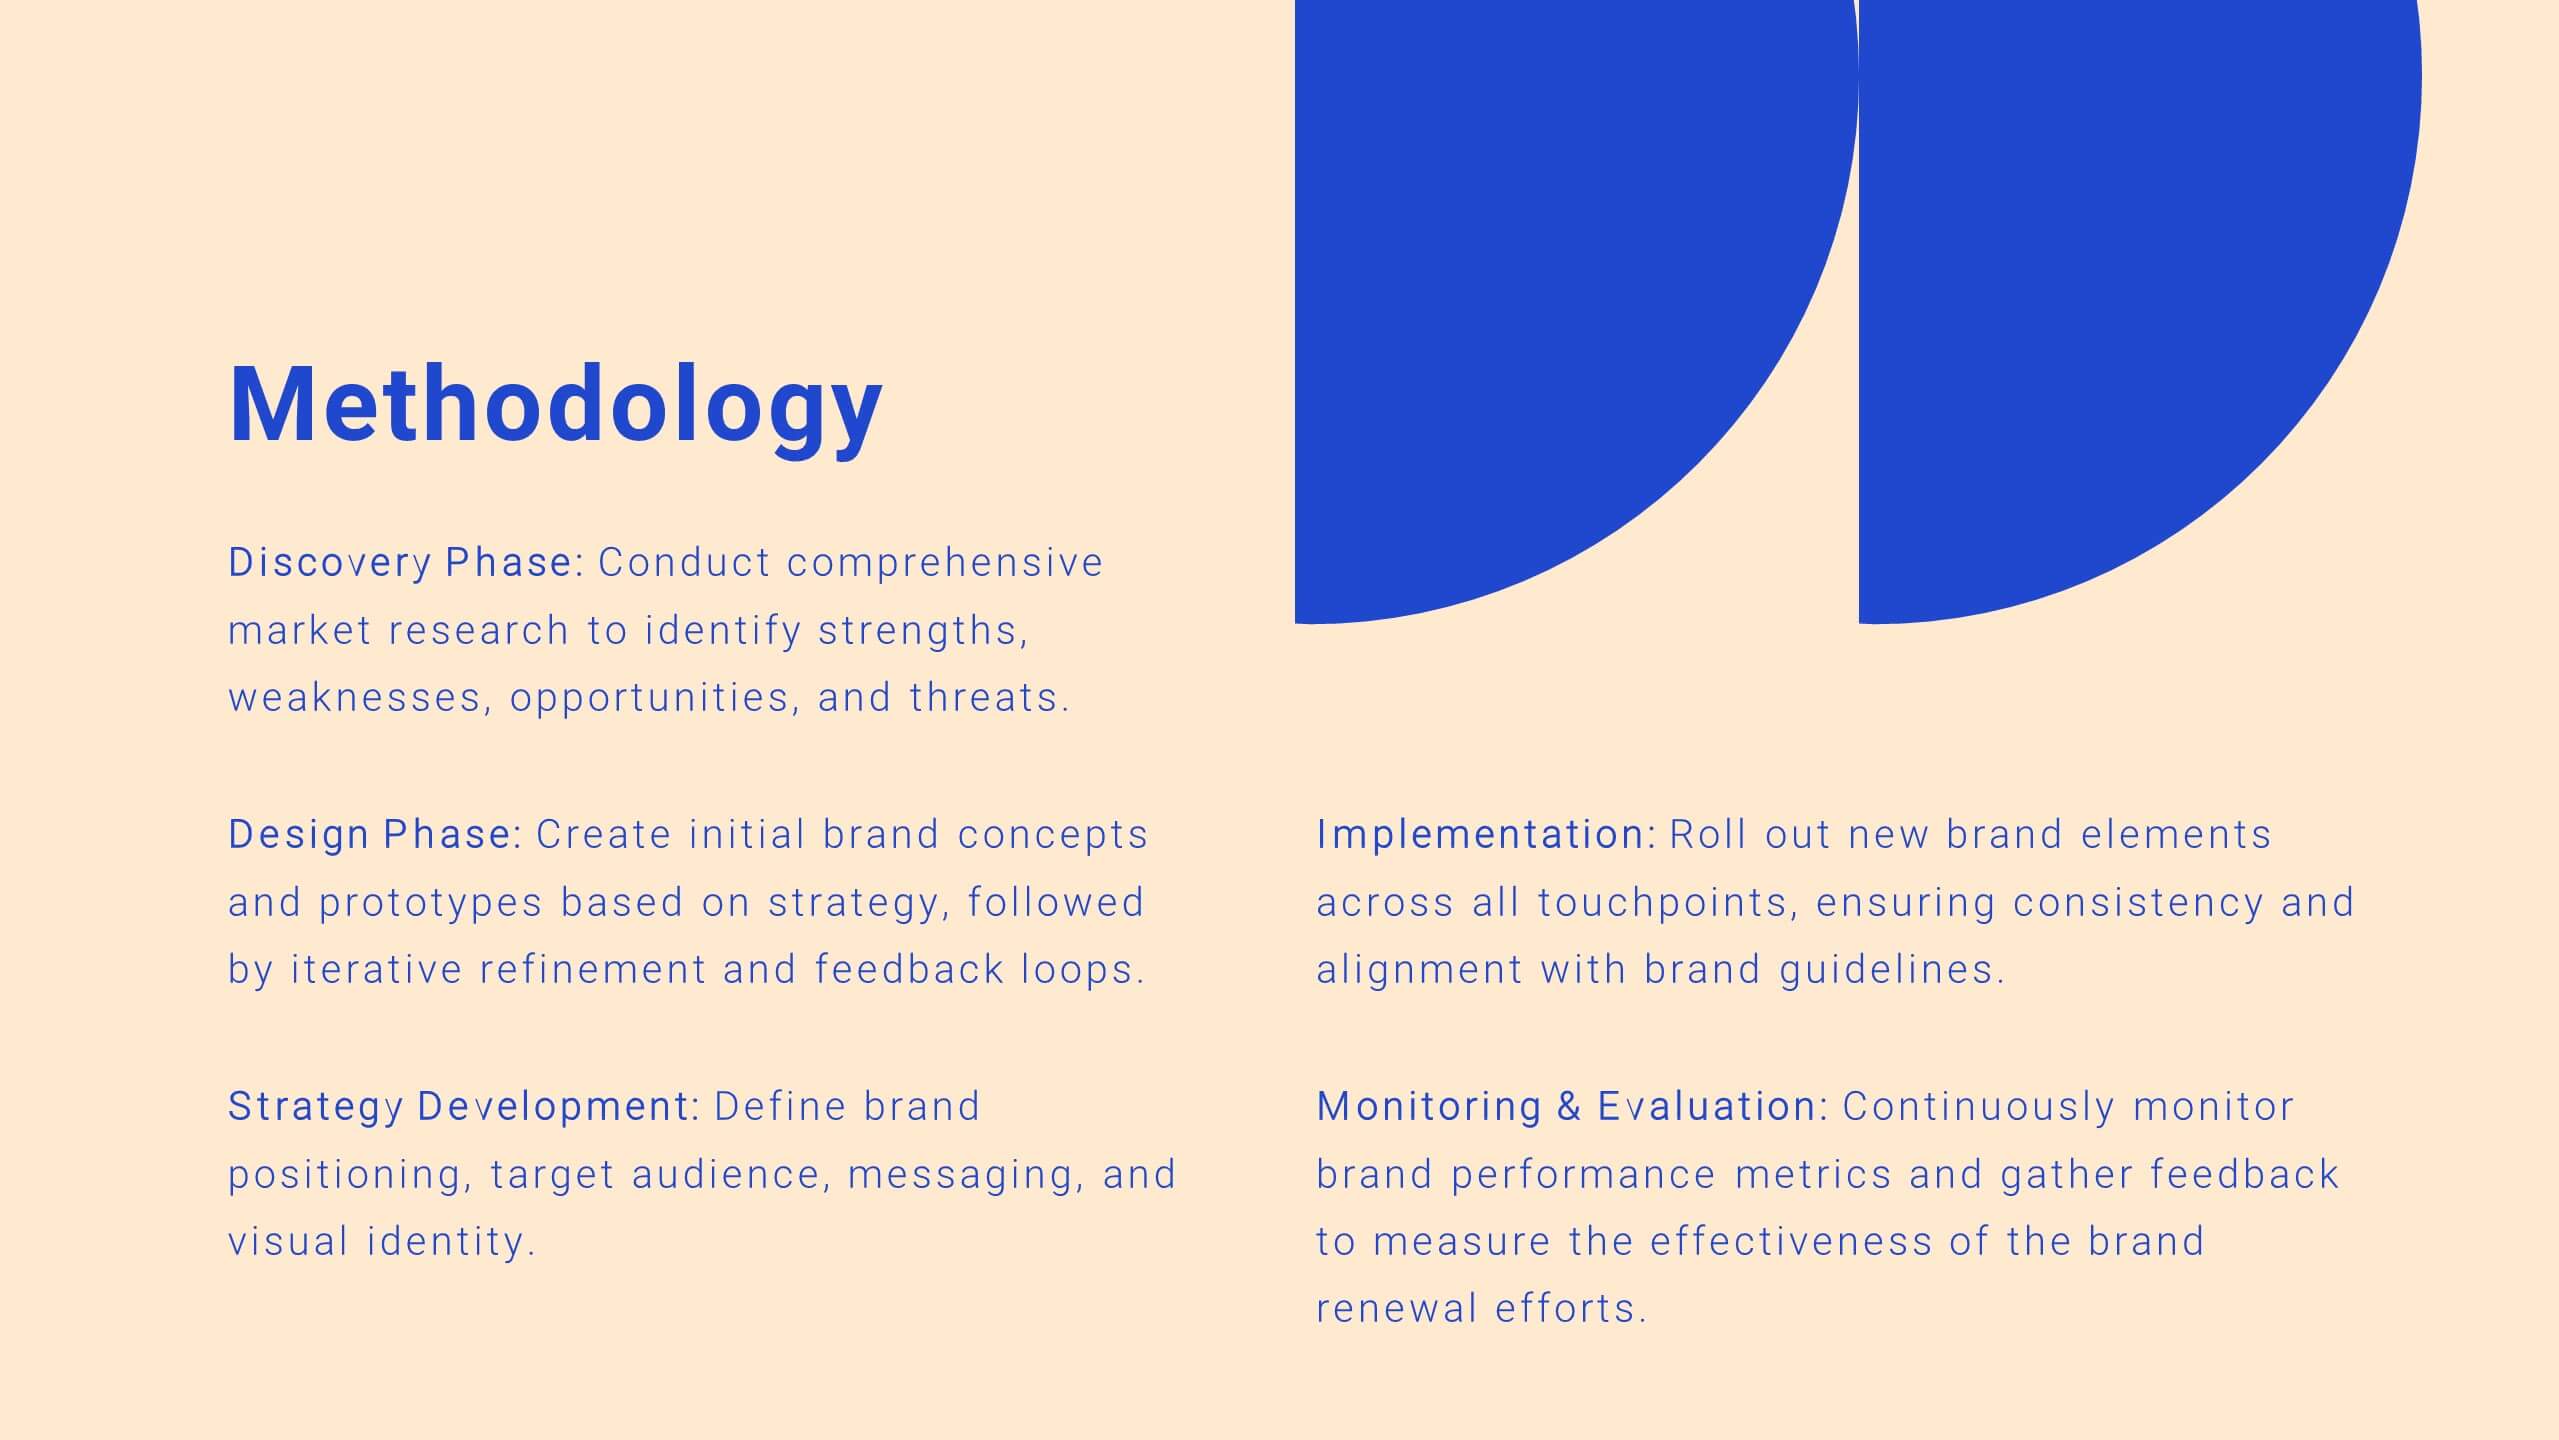
Griffin Rebranding Project Plan Presentation
Unleash the power of branding with this vibrant presentation template! This tool guides you through essential brand elements like identity, voice, and strategy. Perfect for marketers and brand managers aiming to make a memorable impact. Compatible with PowerPoint, Keynote, and Google Slides, it's a must-have for any branding project.


8 slides
Identifying and Addressing Business Problems Presentation
Break down challenges with clarity using this structured 4-step business problem-solving slide. Highlight each issue with its own icon, number, and explanation, making it easy to communicate obstacles and outline solutions. Ideal for team strategy meetings, leadership briefings, or client reports. Fully customizable in PowerPoint, Keynote, and Google Slides.
4 slides
Growth Path Arrow Design Presentation
Rise with momentum as you visualize progress in a clean, modern layout built for showcasing goals, achievements, and forward movement. This presentation highlights each stage in a clear upward path, helping audiences follow your narrative with ease. Fully editable and compatible with PowerPoint, Keynote, and Google Slides.


4 slides
Organizational Hierarchy Chart Presentation
A clear, engaging way to map out team structure, this presentation highlights how roles connect and flow across an organization. It visually simplifies reporting lines, helping audiences quickly understand leadership levels and team responsibilities. Perfect for planning, onboarding, or strategy discussions, and fully compatible with PowerPoint, Keynote, and Google Slides.


5 slides
Workflow Management Diagram Presentation
Simplify your process visuals with a clean, modern layout designed to clarify every step. This presentation helps you map workflows, define responsibilities, and streamline communication across teams. Perfect for project planning and operations, it’s fully compatible with PowerPoint, Keynote, and Google Slides for effortless customization and professional presentation delivery.


5 slides
Leadership and Team Dynamics Strategy Presentation
Highlight team hierarchy and leadership flow with the Leadership and Team Dynamics Strategy Presentation. This visual layout is ideal for mapping roles, responsibilities, or reporting lines. Use it to clarify leadership structures or showcase team development plans. Fully customizable in PowerPoint, Keynote, and Google Slides for seamless strategic communication.

1 slide
Success Roadmap and Personal Achievement Presentation
Visualize your path to success with the Success Roadmap and Personal Achievement Presentation. This stepwise layout guides your audience through key milestones, making it perfect for showcasing personal growth, career progression, or business achievements. Each step features a distinct icon and space for focused insights. Fully editable in Canva, PowerPoint, Keynote, and Google Slides.


19 slides
Prism Design Strategy Proposal Presentation
Bring your design strategy to life with this modern and stylish presentation template! Perfect for showcasing your design concepts, processes, and elements, this template ensures that your ideas are communicated effectively. With a sleek layout for design briefs, mood boards, prototypes, and project timelines, it's the ideal tool for creative professionals. Customize it easily in PowerPoint, Keynote, or Google Slides to make a lasting impression on your audience.


23 slides
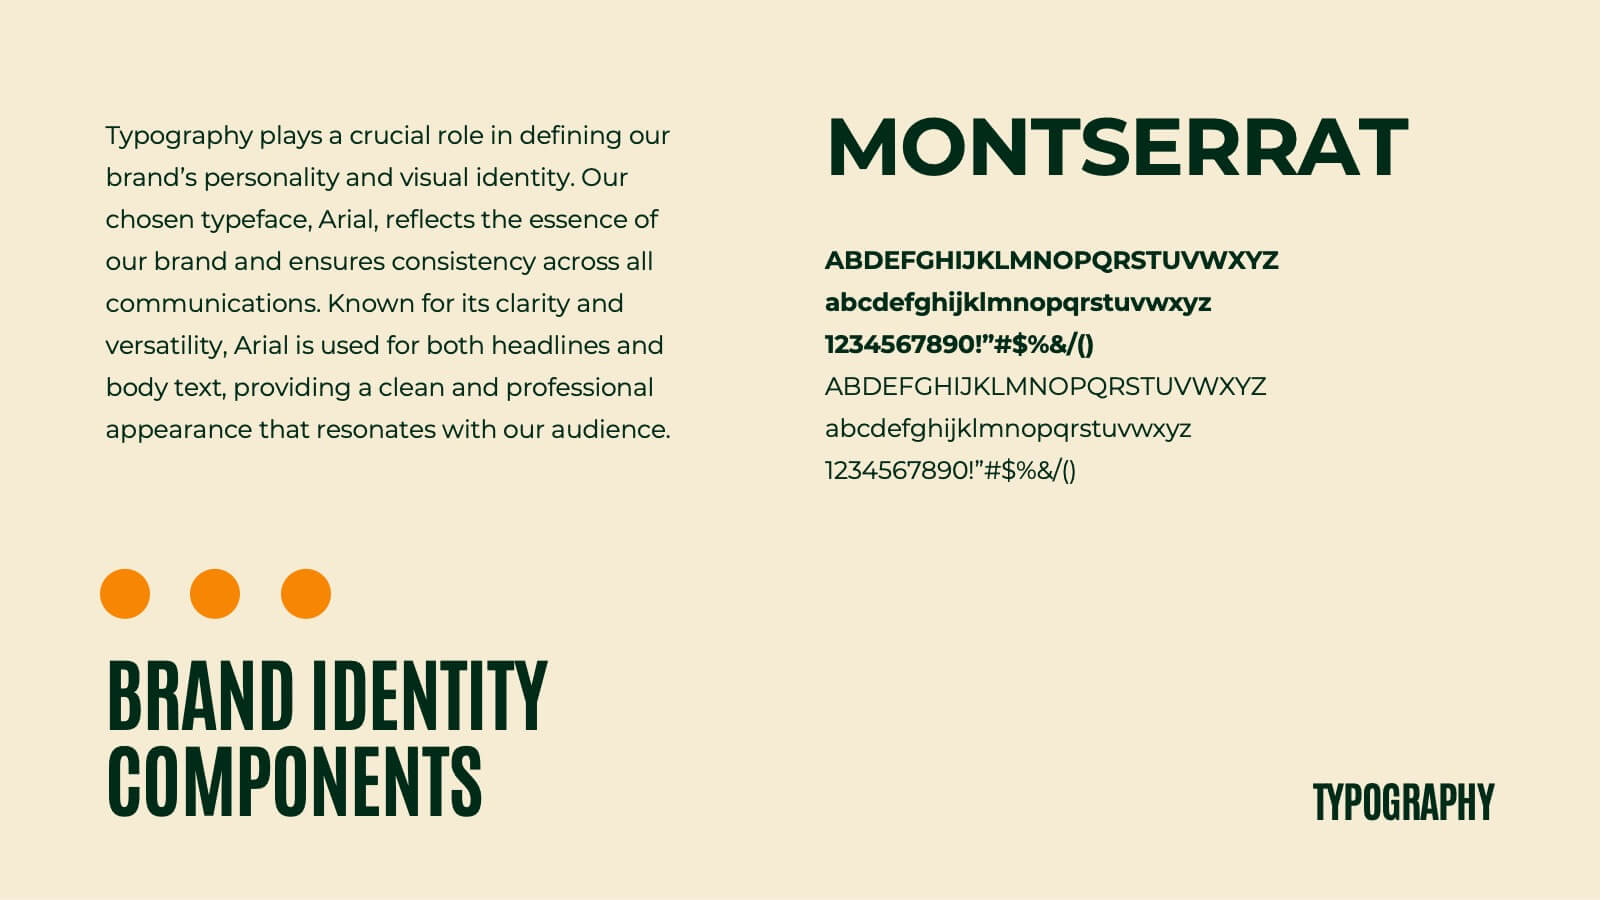
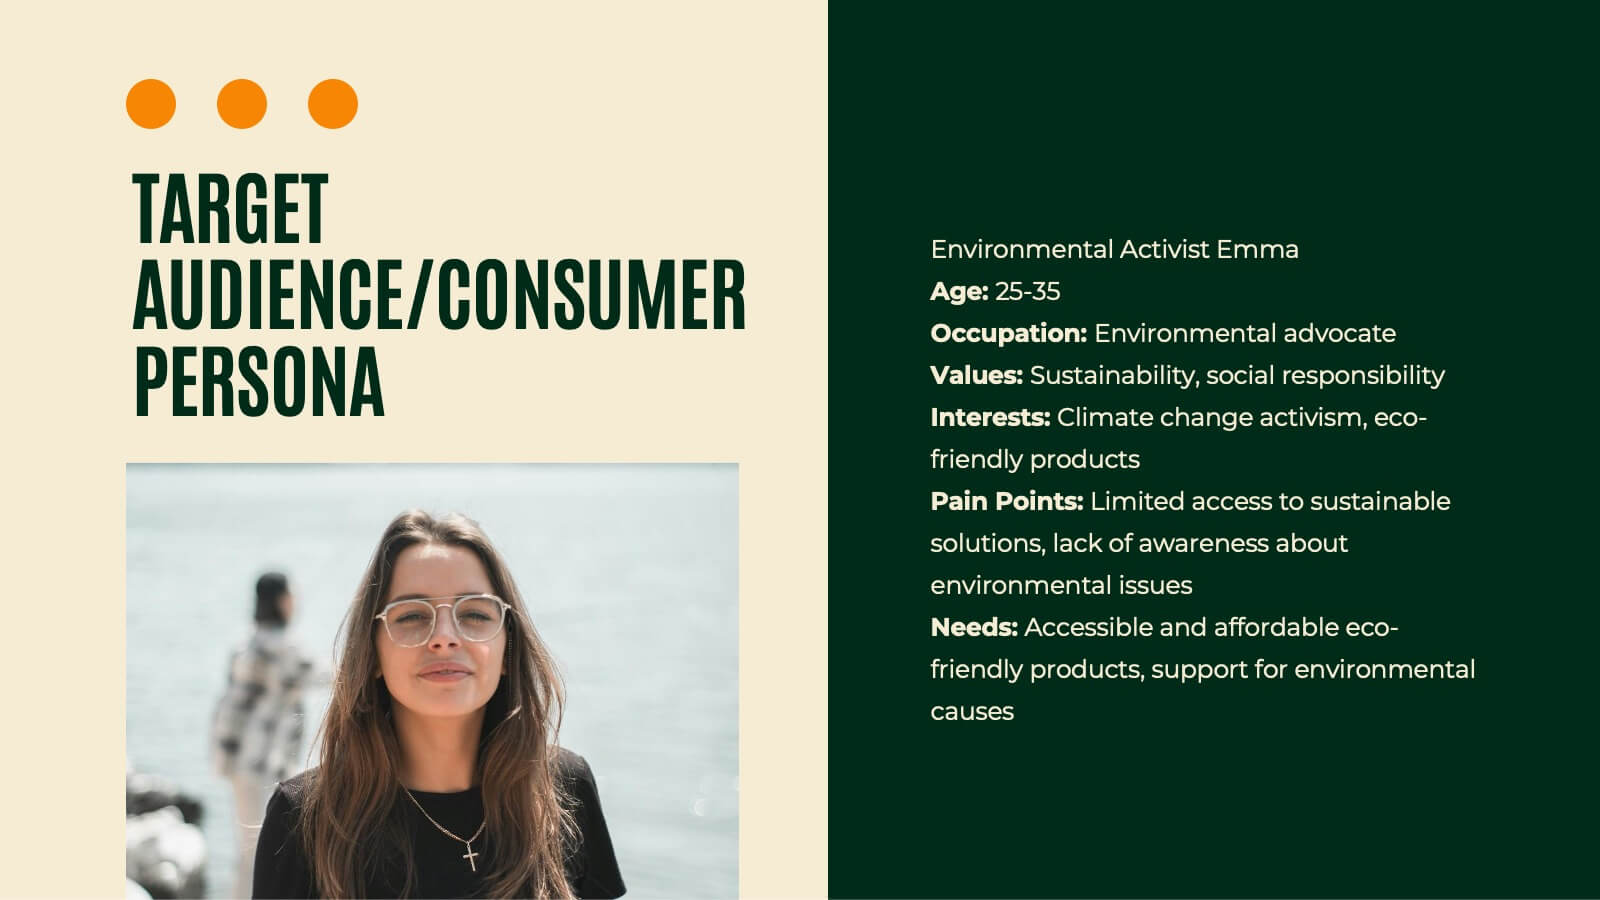
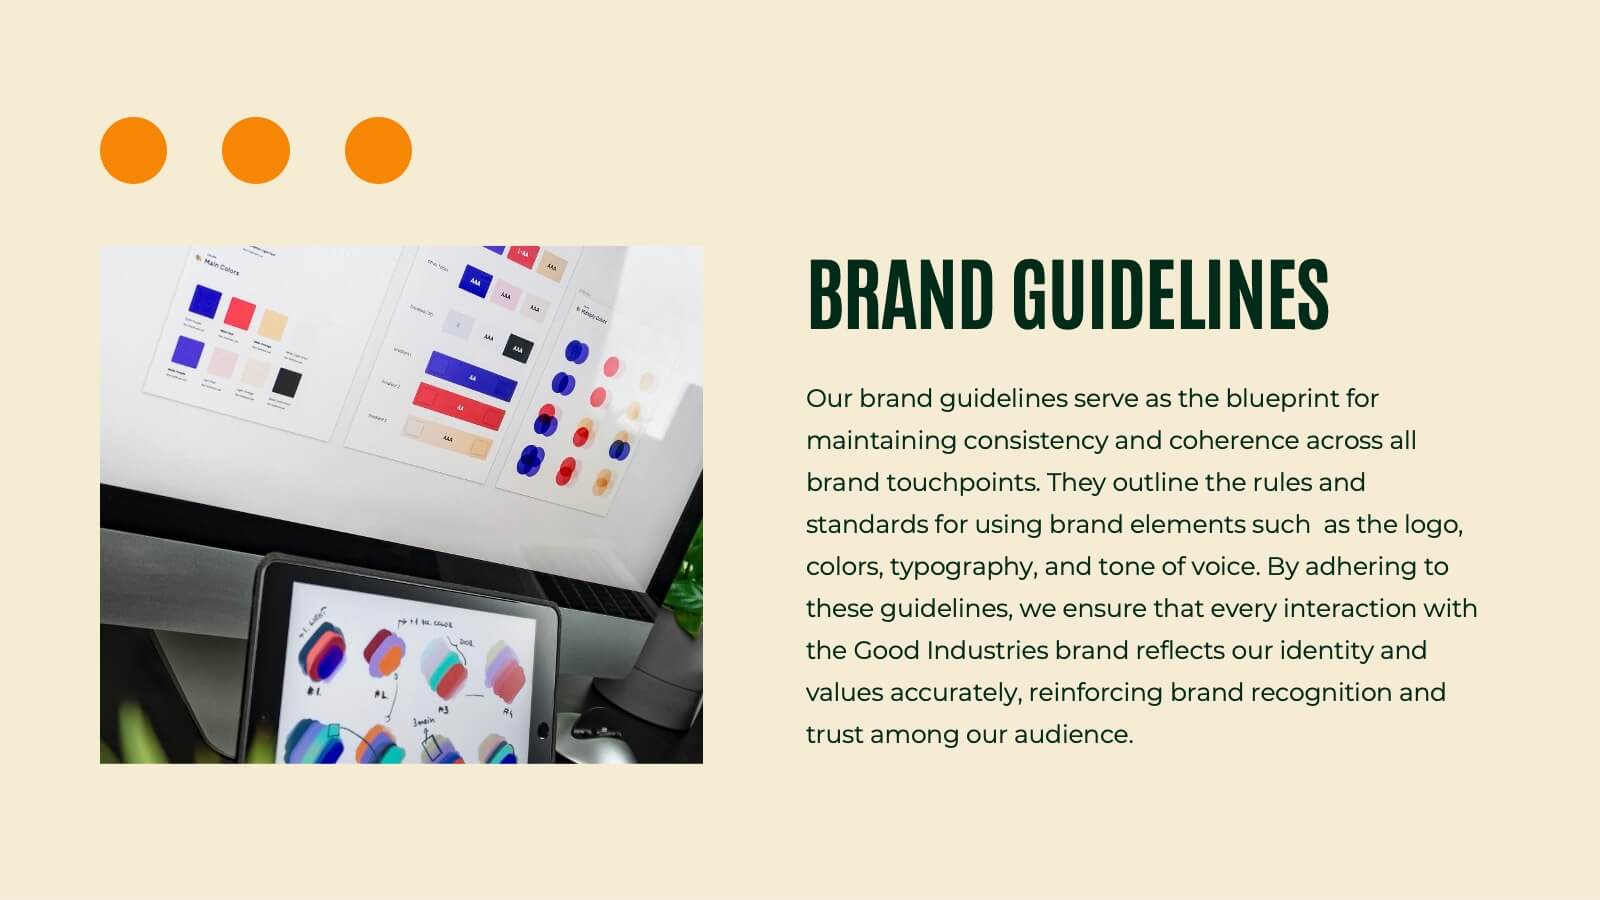
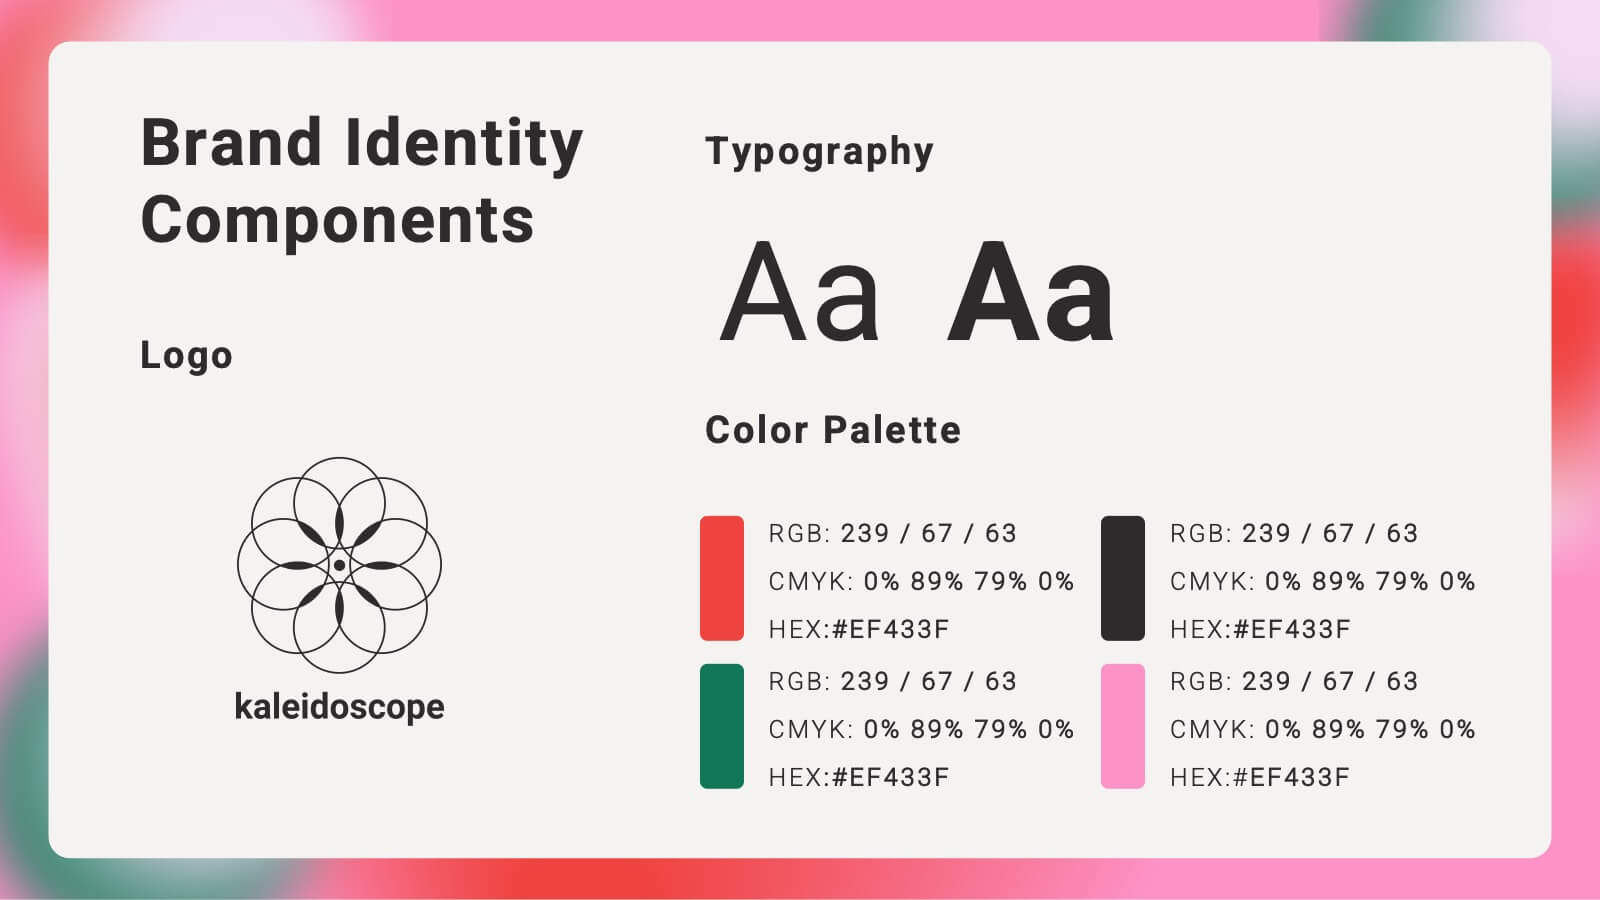
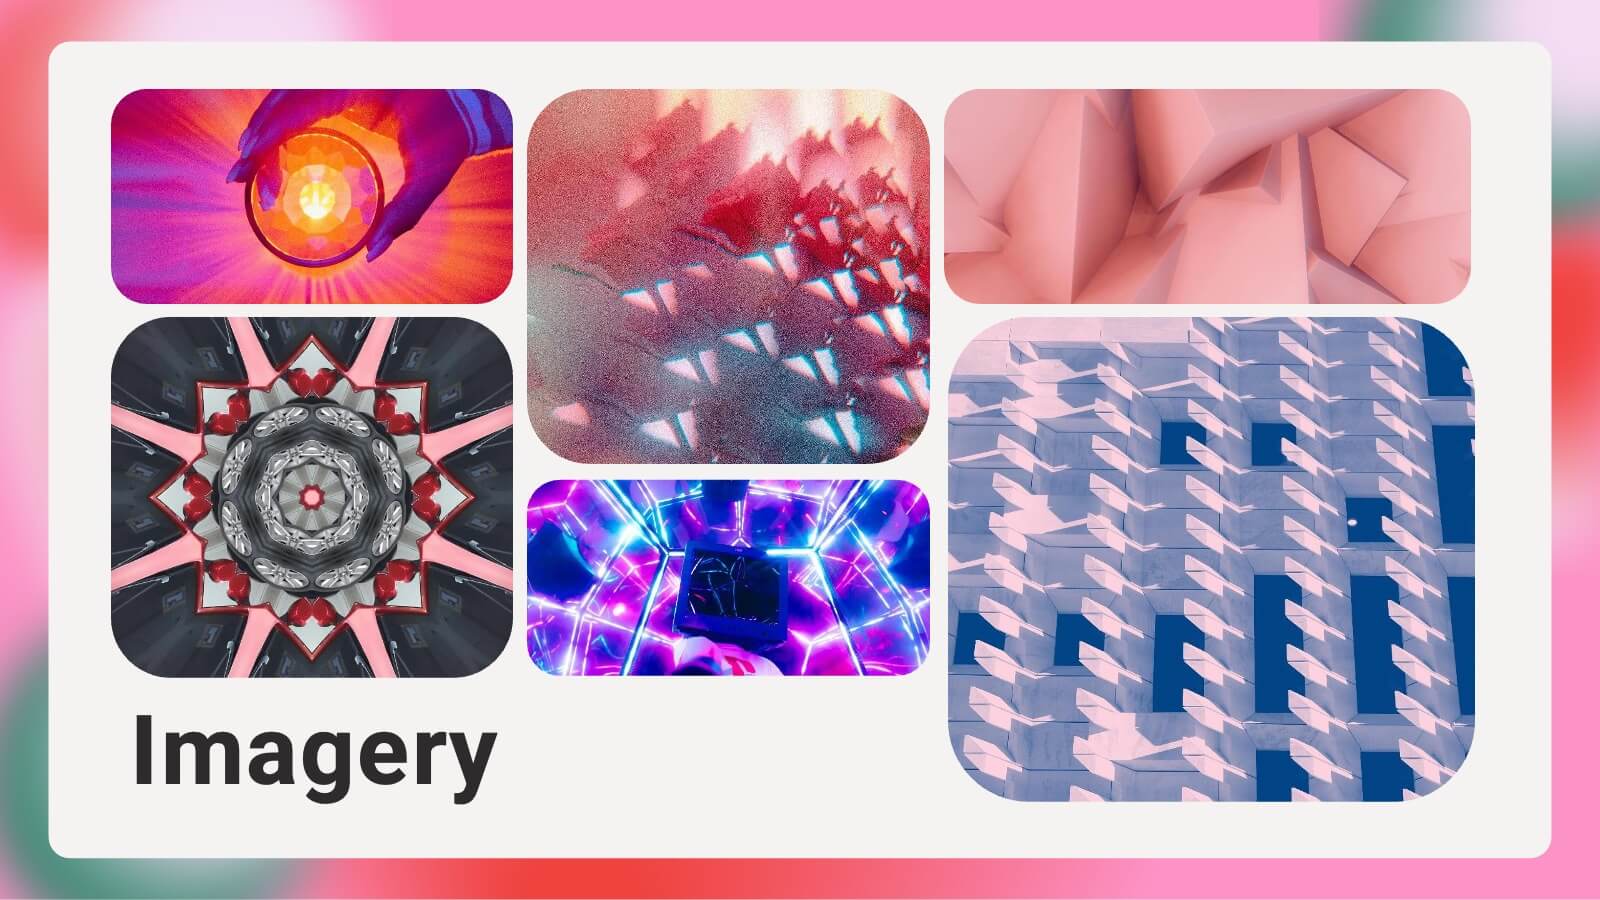
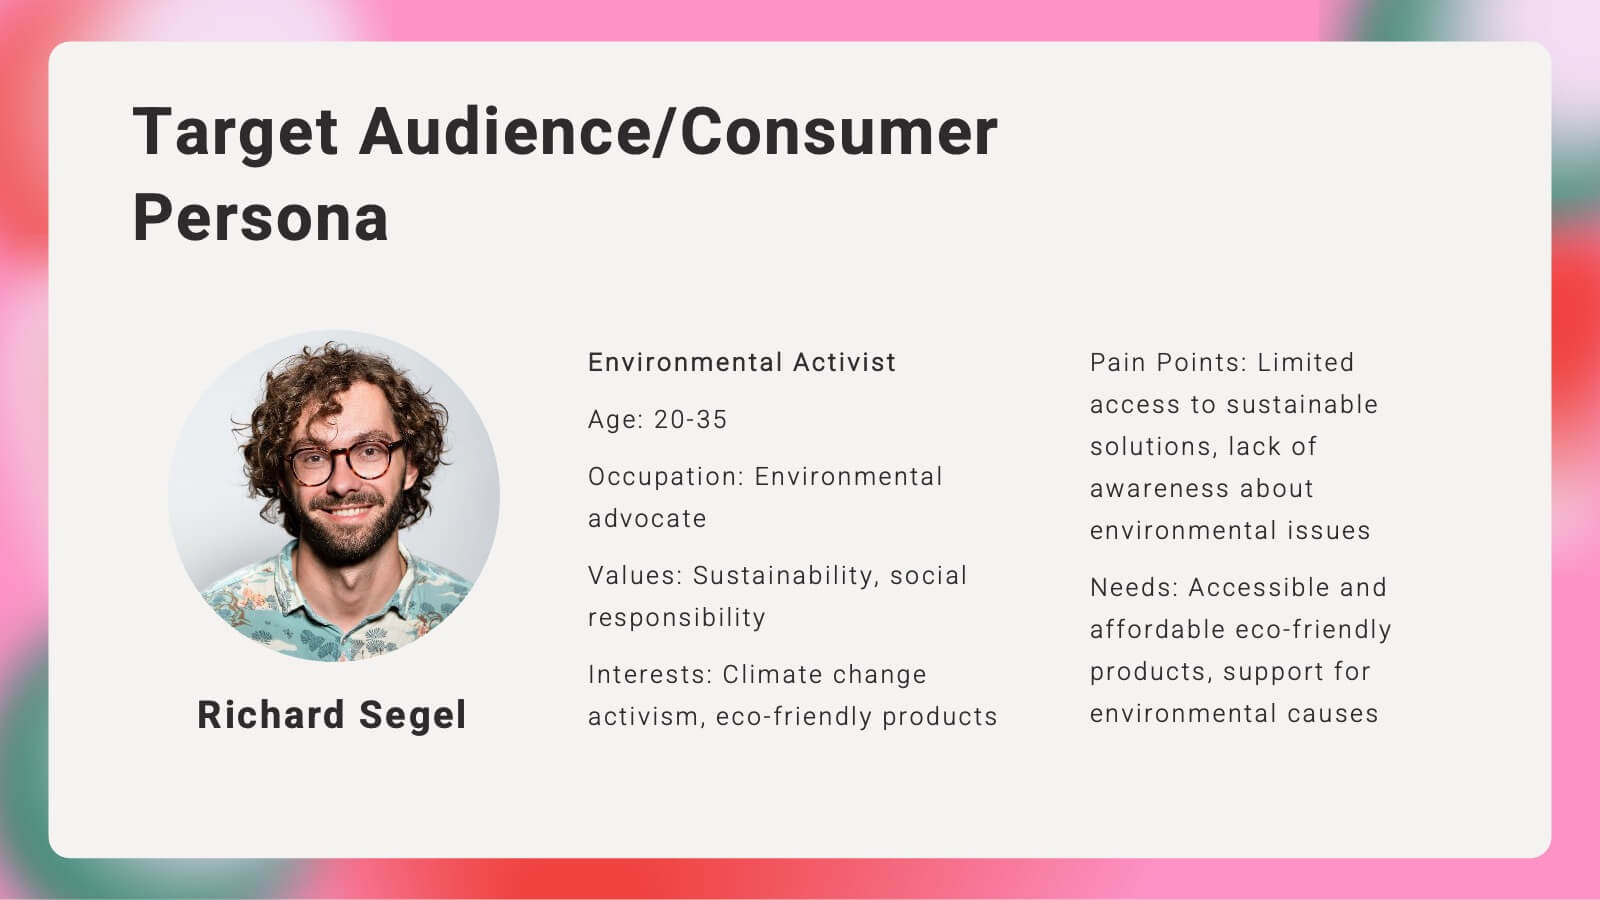
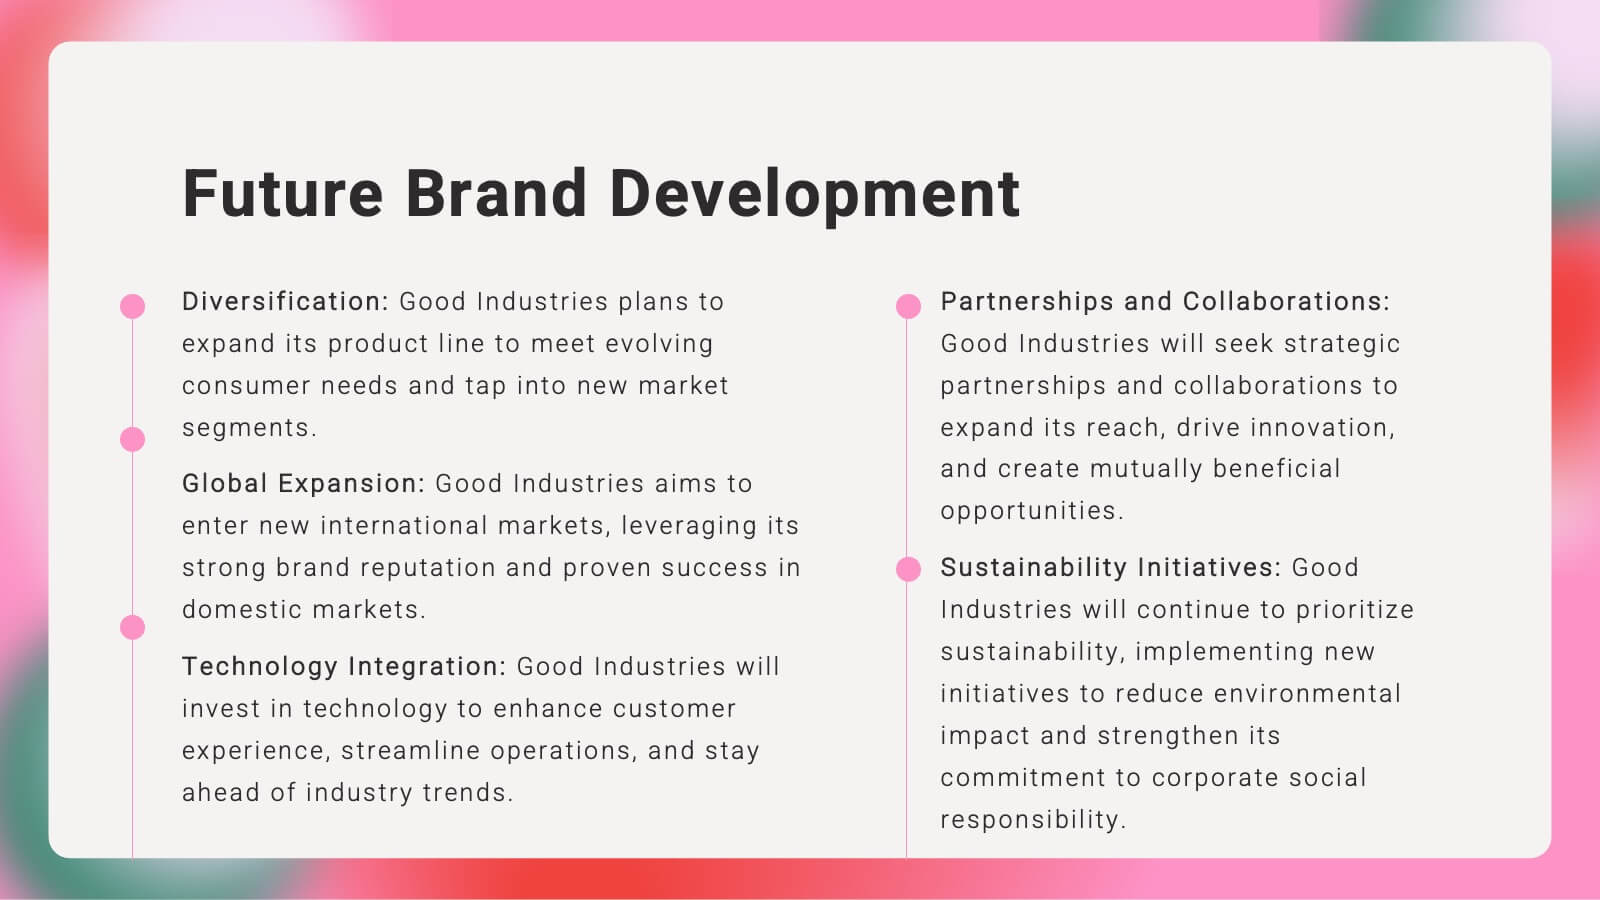
Kaleidoscope Brand Strategy Report Presentation
Craft a compelling narrative for your brand with this vibrant brand strategy presentation template. Designed to cover every facet of brand development, from vision and mission to market analysis and consumer personas, this template is an essential tool for businesses looking to establish a strong brand identity. It incorporates visually engaging slides that outline brand voice, values, and touchpoints, facilitating a thorough understanding of strategic branding. Compatible with platforms like PowerPoint, Google Slides, and Keynote, it is accessible across various devices, making it perfect for collaborative planning and presentations.


21 slides
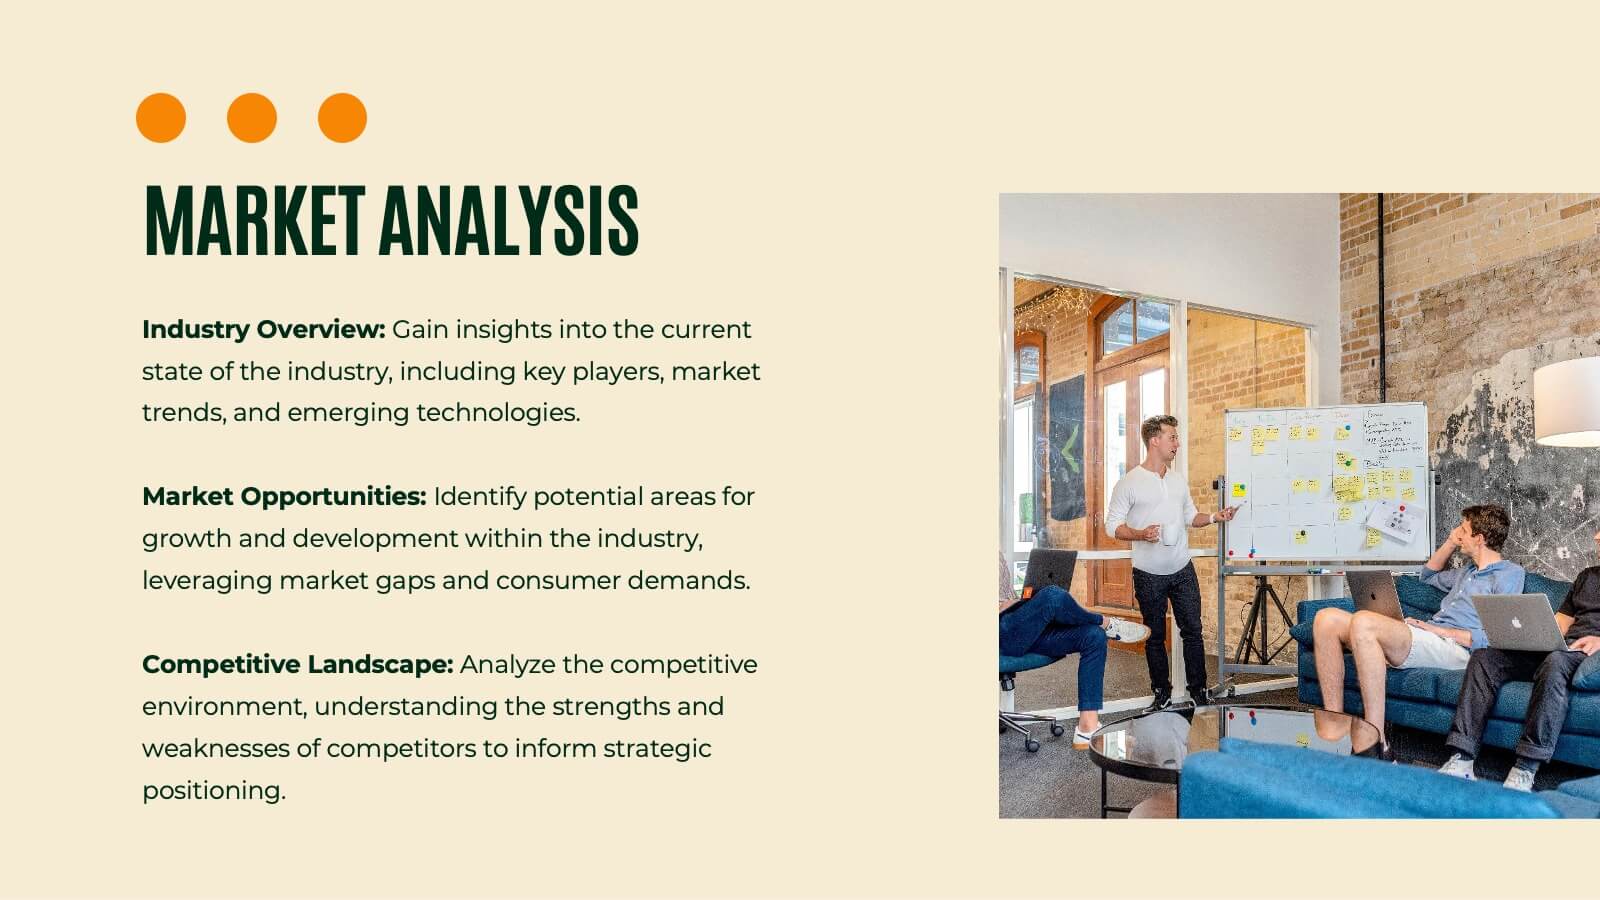
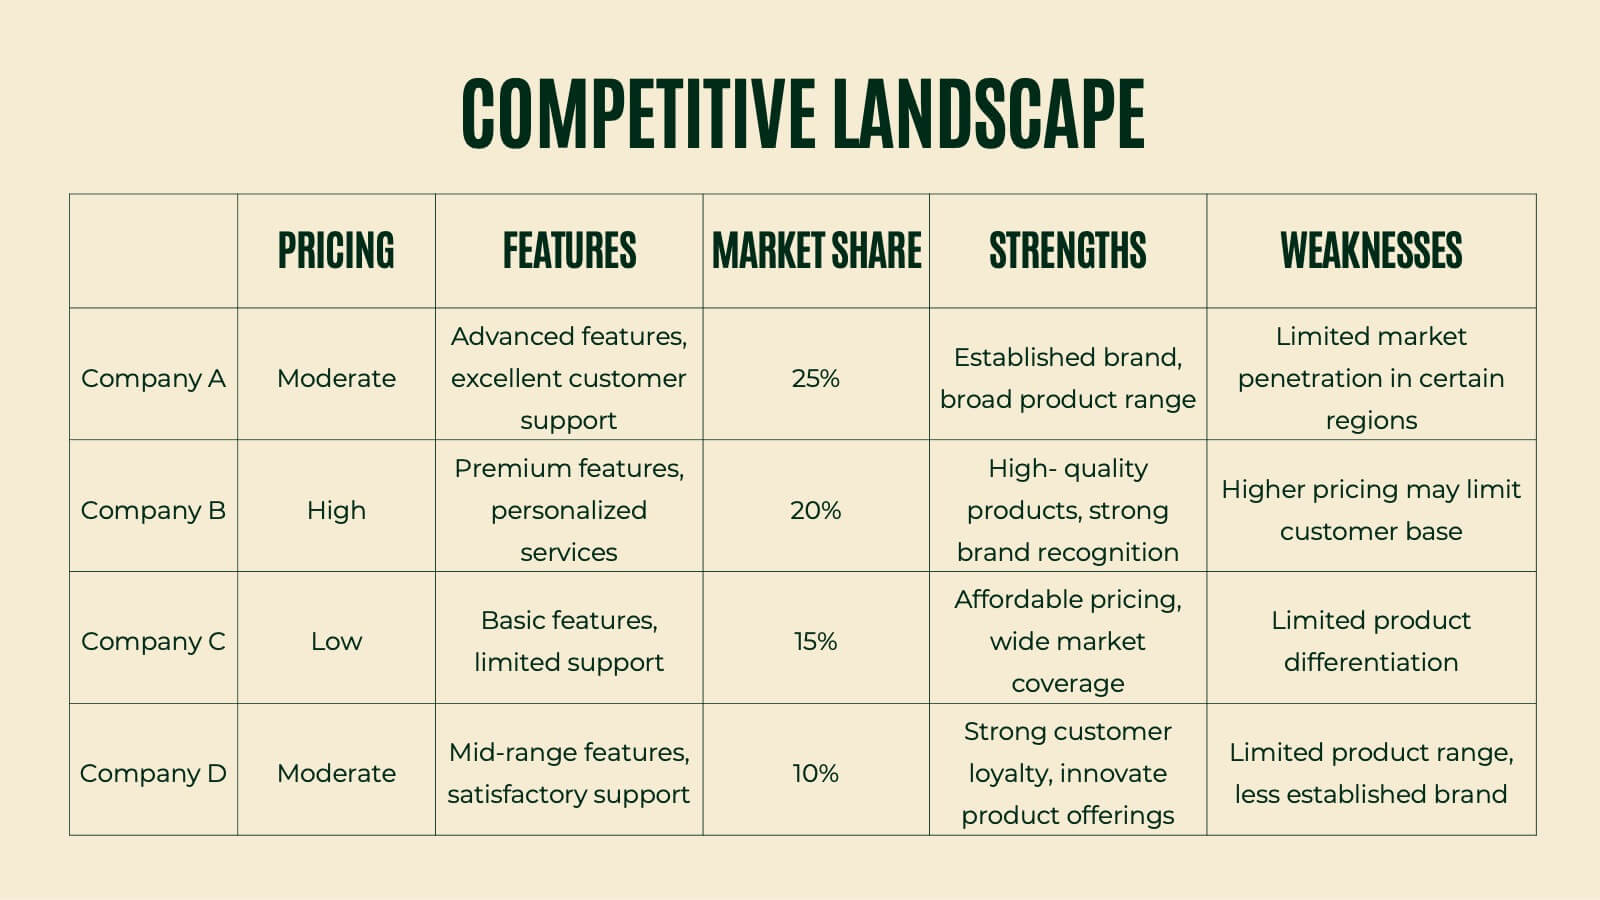
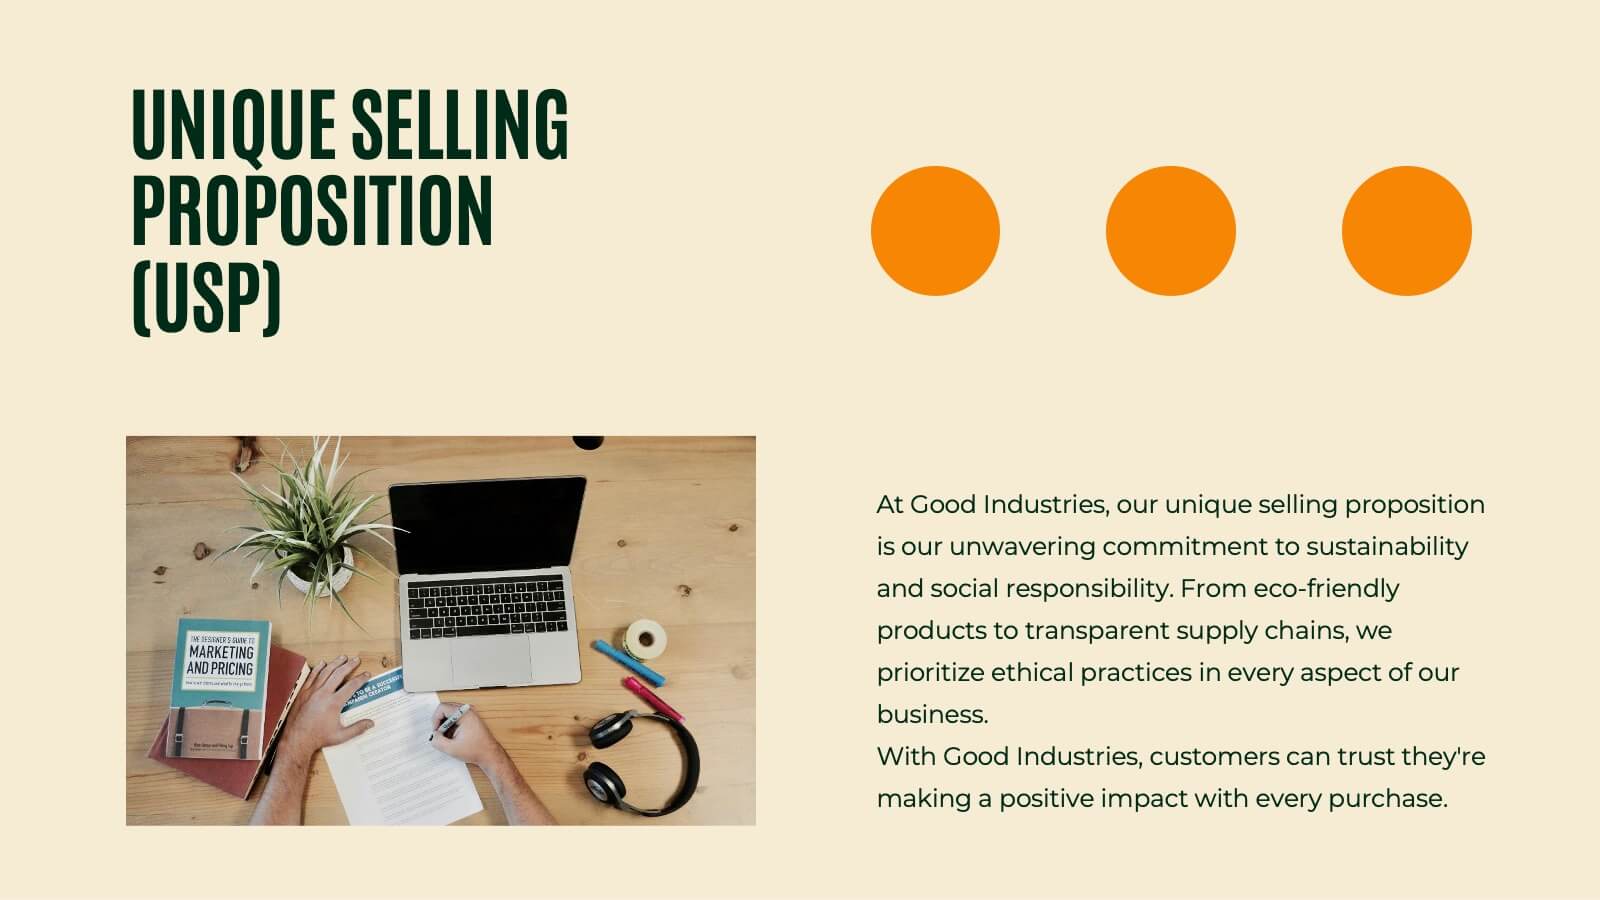
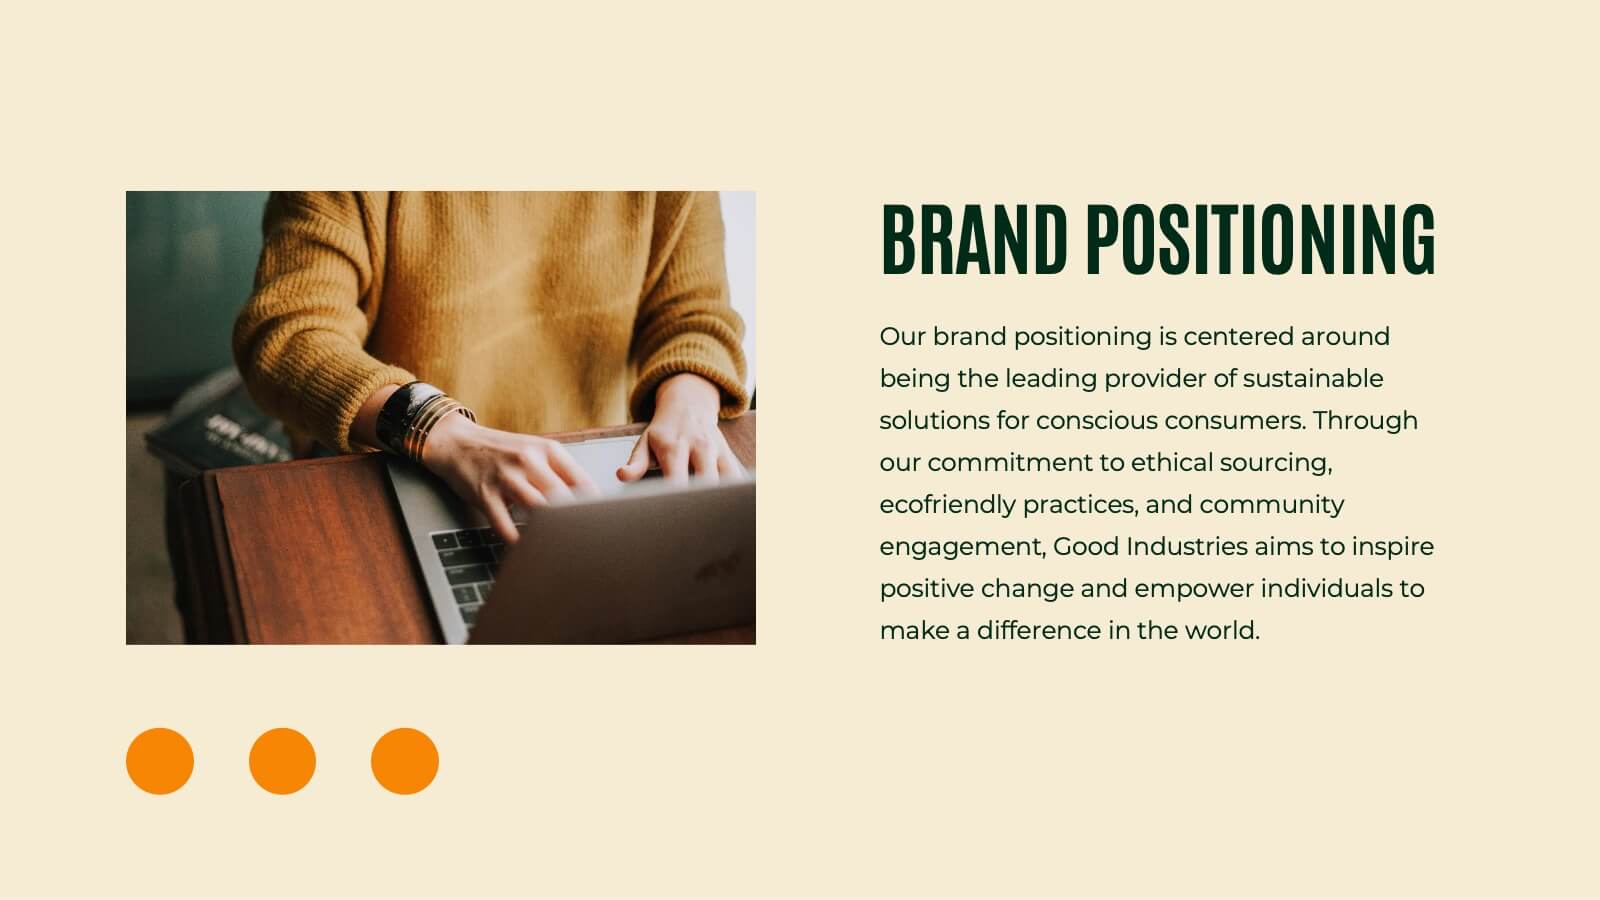
Astromeda Product Launch Presentation
This Product Launch Presentation template offers a clean and modern design to showcase your product effectively. It covers key areas such as market analysis, competitive landscape, pricing strategy, and sales approach. Fully customizable and compatible with PowerPoint, Keynote, and Google Slides, it's perfect for startups and businesses launching new products.


6 slides
Corporate Training Plan Layout Presentation
Bring structure and clarity to your business training process with this clean and professional layout. Each gear-shaped section highlights a key stage in your program, allowing you to present goals, skills, and milestones with precision. Ideal for planning sessions or executive briefings, this template is fully compatible with PowerPoint, Keynote, and Google Slides.


26 slides
Sustainable Business Practices Presentation
Present your eco-friendly business approach with this straightforward template that reflects your commitment to sustainability. It's decked with leafy designs and organic textures that naturally convey your green message. From showcasing your leadership to illustrating growth with intuitive graphs, the template makes it simple to share your vision. Perfect for any platform, like PowerPoint or Google Slides, it’s designed to help you communicate big ideas, like reducing carbon footprints or embracing renewable resources, in a way that’s easy for everyone to grasp. Let this template be the backdrop as you chart a course for a sustainable future, making complex concepts like ‘green initiatives’ and ‘sustainable practices’ clear and actionable.