


Features
- 5 Unique slides
- Fully editable and easy to edit in Microsoft Powerpoint, Keynote and Google Slides
- 16:9 widescreen layout
- Clean and professional designs
- Export to JPG, PDF or send by email


Do you have any questions?
Recommend


4 slides
High-Performance Team Collaboration Presentation
Showcase teamwork, trust, and synergy with this bold, interconnected arms graphic. Ideal for illustrating roles, partnerships, or team frameworks, this infographic is perfect for leadership, HR, or corporate strategy slides. Fully customizable in PowerPoint, Keynote, and Google Slides.


4 slides
Financial Budget Forecasting Presentation
Predict and manage your financial future with our 'Financial Budget Forecasting' template, perfect for visualizing quarterly budget allocations and expectations. This versatile tool aids in creating clear, concise, and visually engaging financial presentations, and is compatible with PowerPoint, Keynote, and Google Slides, making it a must-have for finance professionals and budget planners.


21 slides
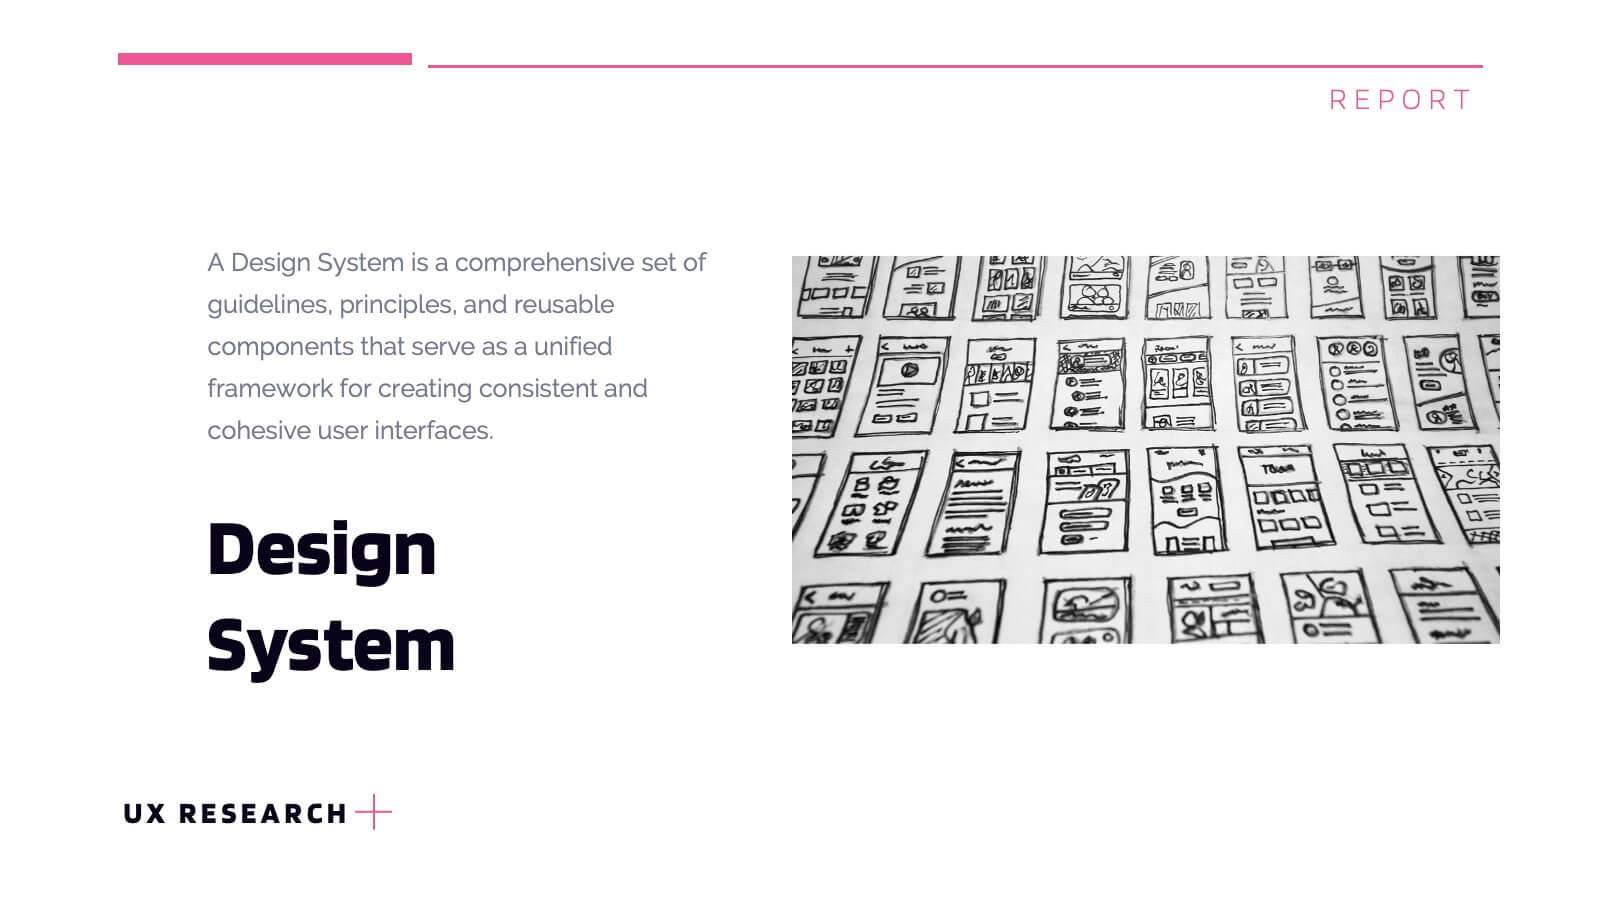
Lumascend UX Research Report Presentation
Present your UX research findings with clarity using this engaging and organized template! Covering key areas like user personas, wireframes, testing, and interaction design, it ensures all aspects of your design process are communicated effectively. Perfect for UX teams, stakeholders, or client presentations, this template works seamlessly with PowerPoint, Keynote, and Google Slides.


6 slides
IT Architecture Enterprise Infographics
Gain insights into Enterprise IT Architecture with our customizable infographic template. This template is fully compatible with popular presentation software like PowerPoint, Keynote, and Google Slides, allowing you to easily customize it to illustrate and communicate various aspects of enterprise IT architecture. The Enterprise IT Architecture infographic template offers a visually engaging platform to explore and explain the architectural components, frameworks, and strategies used in large organizations. Whether you're an IT professional, business leader, or simply interested in enterprise technology, this template provides a user-friendly canvas to create informative presentations and educational materials. Enhance your knowledge of Enterprise IT Architecture with this SEO-optimized infographic template, thoughtfully designed for clarity and ease of use. Customize it to highlight key principles, architectural layers, integration strategies, and best practices, ensuring that your audience gains a comprehensive understanding of this critical field. Start crafting your personalized infographic today to delve into the world of Enterprise IT Architecture.


22 slides
Stormlight Qualitative Research Findings Presentation
This Qualitative Research Presentation Template is a dynamic and structured solution designed to present in-depth research findings, methodologies, and analysis. It covers key sections such as data collection, results interpretation, implications, and recommendations to deliver a comprehensive research overview. Perfect for academic, business, or market research purposes, and fully compatible with PowerPoint, Keynote, and Google Slides for easy customization.


5 slides
Water Crisis Infographics
Navigate the pressing issues of the global water crisis with our water crisis infographics template. Rendered in profound shades of blue, this creative and vertical design emulates the urgency surrounding water-related concerns. It's an essential asset for environmental activists, and educational institutions, facilitating the dissemination of crucial data and impactful stories. Compatible with Powerpoint, Keynote, and Google Slides. This collection integrates striking graphics, thematic icons, and flexible image placeholders, designed to convey complex information on water scarcity, conservation strategies, and global impacts in an accessible, visually engaging manner.
4 slides
Growth Path Arrow Design Presentation
Rise with momentum as you visualize progress in a clean, modern layout built for showcasing goals, achievements, and forward movement. This presentation highlights each stage in a clear upward path, helping audiences follow your narrative with ease. Fully editable and compatible with PowerPoint, Keynote, and Google Slides.


8 slides
Dynamic Pricing Strategies Presentation
Navigate market complexities with our 'Dynamic Pricing Strategies' presentation template, perfect for outlining variable pricing models that respond to market demands. This versatile tool is ideal for businesses looking to adapt and thrive, with designs compatible with PowerPoint, Keynote, and Google Slides.


7 slides
Fishbone Diagram Infographic Presentation Template
A Fishbone diagram, also called a cause-and-effect diagram, is a tool used to identify and analyze the potential causes of a particular problem or issue. It is named for its shape, which looks like a fish skeleton with the problem or effect as the head and the various causes as the bones. This template includes a variety of different fishbone diagrams, which are representations of fish skeletons that help show you the different causes of a problem. This template is easy to use and you can add your own information to make it look just how you want, and show how different causes are connected.


4 slides
Daily Time Planning and Scheduling Presentation
Stay organized and maximize productivity with this Daily Time Planning and Scheduling template. Featuring a structured hourly schedule, task folders for tomorrow’s plans and to-do lists, and a dedicated notes section, this slide is designed for professionals, students, and busy individuals. Customize effortlessly to track daily tasks, set priorities, and manage time effectively. Fully compatible with PowerPoint, Keynote, and Google Slides for seamless integration.


5 slides
Innovation with Design Thinking Framework
Boost creativity and problem-solving with the Innovation with Design Thinking Framework Presentation. This slide features a vertically stacked rocket diagram symbolizing the five key phases of design thinking—perfect for illustrating iterative innovation processes. Each level includes editable text and icons, helping you align stakeholders around empathy, ideation, and prototyping. Ideal for workshops, innovation teams, educators, or product development presentations. Fully customizable in PowerPoint, Keynote, and Google Slides.


4 slides
Insurance Market Trends
Track and present evolving market dynamics with this Insurance Market Trends presentation. Featuring clean, multi-point visual elements, this slide set is perfect for analysts, consultants, and insurance professionals aiming to highlight growth segments, percentages, or trend categories. Fully editable in PowerPoint, Keynote, and Google Slides.


26 slides
The Rise of Smart Cities Presentation
This presentation template is dedicated to urban developers, technology enthusiasts, and policy makers interested in the advancement of smart cities. The template serves as a deep dive into the integration of technology within urban settings to boost sustainability, efficiency, and quality of life. It is designed with a sleek, modern aesthetic, using a color palette that reflects innovation and modernity, which makes it visually appealing and easy to navigate. The content is structured to demystify complex concepts about smart cities, featuring sections on IoT implementations, eco-friendly urban development, and smart public services. It includes varied slide types such as diagrams, infographics, and statistical displays to showcase data and case studies from cities that are pioneers in this domain. The template is compatible with multiple presentation platforms like PowerPoint, Google Slides, and Keynote, ensuring it can be utilized across different devices and settings. This makes it a versatile tool for presentations in educational, professional, and conference contexts, aiming to inspire and educate on the transformative power of smart urban planning.


5 slides
Demographic and Psychographic Segments Presentation
Break down your audience with clarity using the Demographic and Psychographic Segments Presentation. This slide is ideal for showcasing four key consumer dimensions through a centered circular layout and quadrant icons. Perfect for marketing campaigns, branding strategies, and audience targeting. Fully editable in Canva, PowerPoint, Keynote, or Google Slides.


6 slides
Seven Factors for Business Success Presentation
Present key drivers of business success with this visually balanced 7-element diagram. Featuring Systems, Structure, Strategy, Skills, Staff, Style, and Shared Value, this slide is ideal for strategic planning and leadership presentations. Fully customizable in PowerPoint, Keynote, and Google Slides to match your branding and presentation objectives.


21 slides
Creative Sales Pitch Presentation
Boost your sales presentations with this sleek, professional template designed to captivate and inform. With its modern design, clear layout, and strategic use of visuals, this template is perfect for showcasing sales strategies, performance metrics, and future opportunities. Compatible with PowerPoint, Keynote, and Google Slides, it's ideal for seamless use across all devices.


5 slides
Video Games Industry Infographics
The Video Game Industry is a global and rapidly growing sector that encompasses the development and distribution of video games for various platforms, including consoles, PCs, and virtual reality. These infographic templates are perfect for presenting key information and statistics about the video game industry. If you need to deliver a presentation on the gaming market trends, industry analysis, or the impact of video games, this template will help you visually communicate the data, engage your audience, and create a memorable presentation experience. This template is completely customizable and designed to be compatible with PowerPoint, Keynote, and Google Slides.