


Features
- 26 Unique slides
- Fully editable and easy to edit in Microsoft Powerpoint, Keynote and Google Slides
- 16:9 widescreen layout
- Clean and professional designs
- Export to JPG, PDF or send by email.


Do you have any questions?
Recommend


23 slides
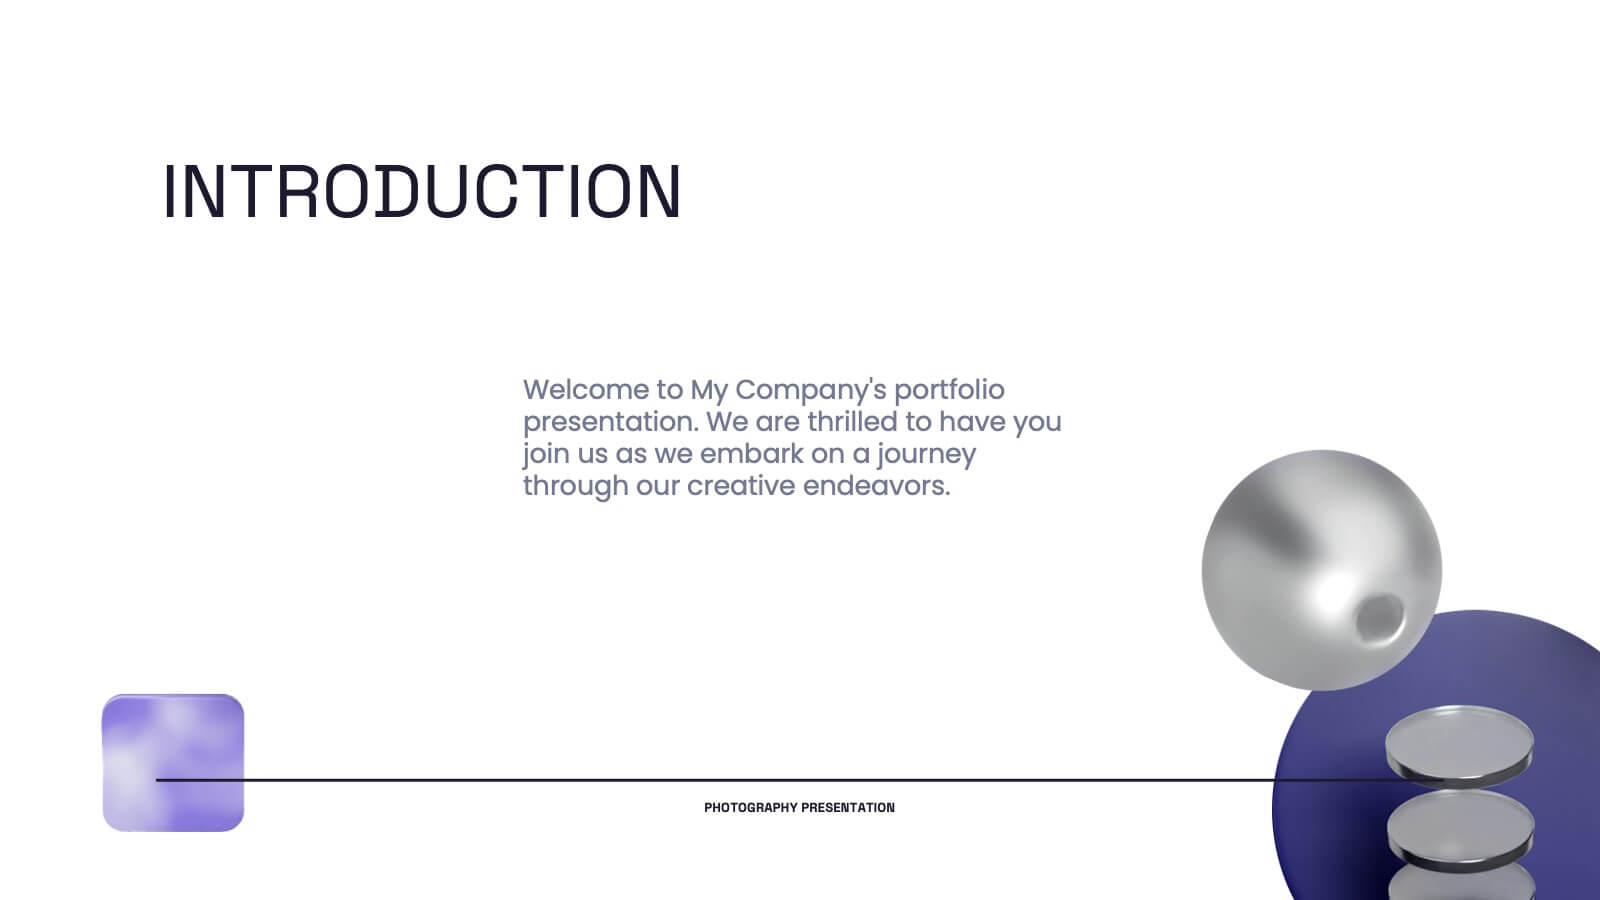
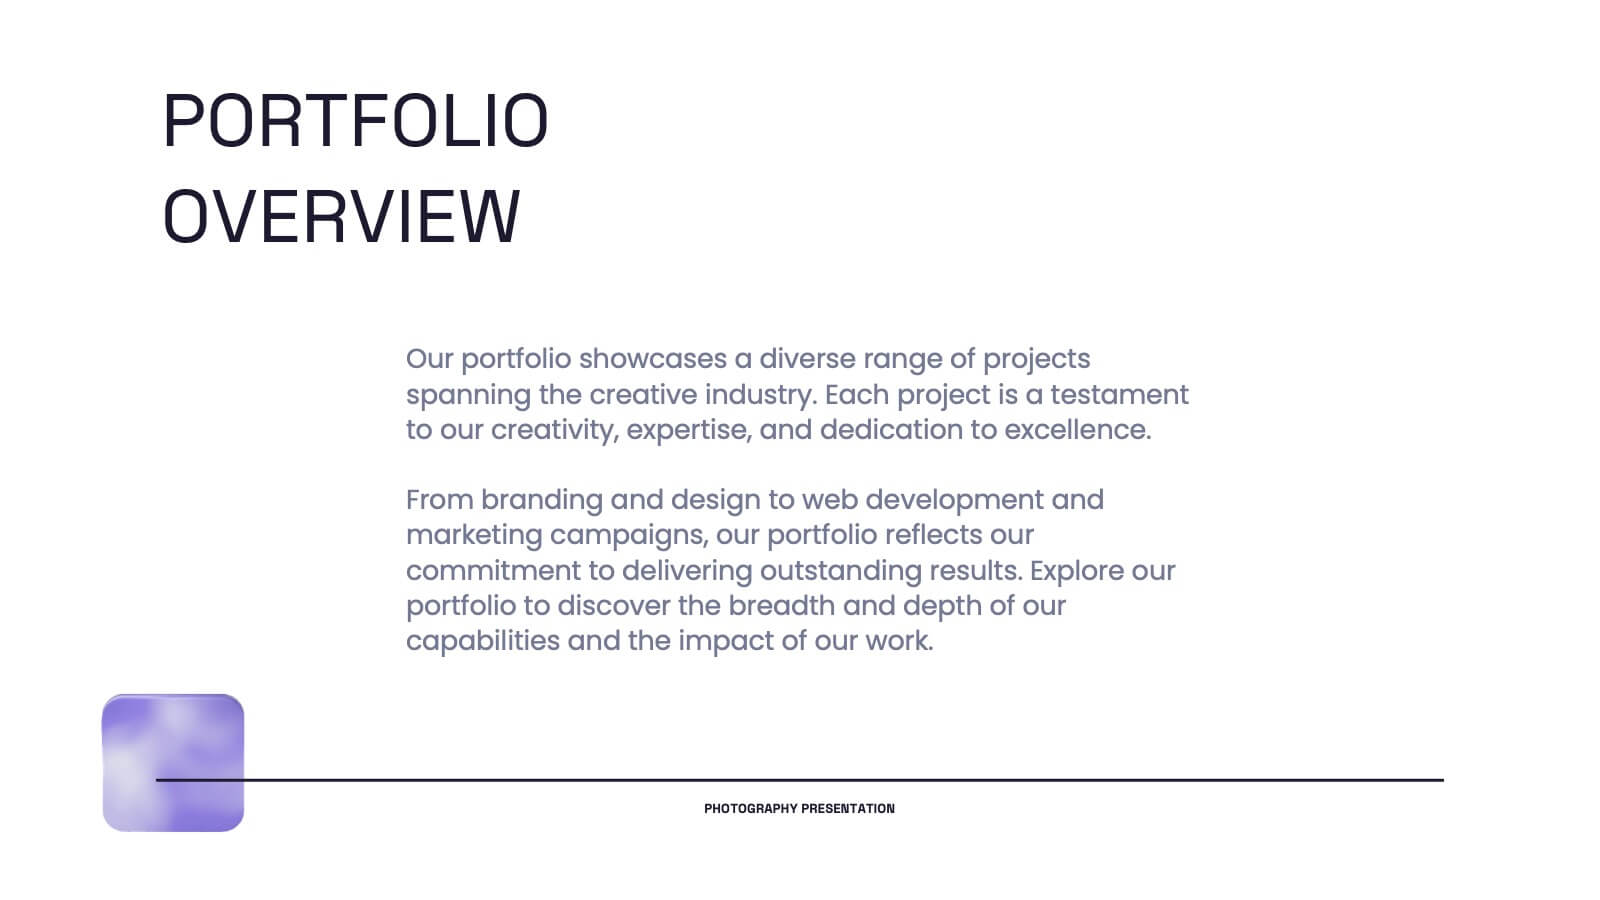
Pyroverse Photography Portfolio Presentation
Showcase your creative work effortlessly with this meticulously designed photography portfolio template. Tailored for photographers, this presentation highlights your style, achievements, and projects in a visually compelling format that speaks to your audience. This portfolio template includes dedicated slides for introducing your philosophy, showcasing your creative process, and presenting your best projects with high-impact layouts. Highlight client testimonials, collaborations, and awards to establish credibility and attract new clients. Additional slides for services, contact information, and social media links make it easier to connect with your audience. Compatible with PowerPoint, Google Slides, and Keynote, this template is fully customizable, allowing you to tailor it to your branding needs. Perfect for professional photographers, freelancers, and studios, this template ensures your portfolio stands out in a competitive market. Present your work with confidence and make a lasting impression with this professional design.


4 slides
Stock Market Insights and Trends Presentation
Visualize complex financial data with ease using the Stock Market Insights and Trends presentation template. This layout features a bold line chart with labeled milestones to highlight key shifts in performance, market patterns, or strategic indicators. Ideal for investment reports, financial briefings, and economic updates. Perfect for analysts, finance professionals, and business strategists. Fully editable and compatible with PowerPoint, Keynote, and Google Slides.


4 slides
Introductory Message with Mission and Vision Presentation
Present your company’s mission and vision with clarity and impact. This professional slide layout includes space for a personalized message and two key highlights. Ideal for strategy decks, company overviews, or leadership presentations—fully editable in Canva, PowerPoint, or Google Slides to match your branding and communication goals.


6 slides
Child Development Psychology Presentation
Bright colors and geometric birds bring this slide to life, making complex concepts easy to follow. This presentation template simplifies the key stages of emotional and psychological growth in children, helping you explain theories and behaviors clearly. Compatible with PowerPoint, Keynote, and Google Slides for seamless use across platforms.


26 slides
Salus Rebranding Project Plan Presentation
This rebranding project plan template offers a clear framework for presenting brand identity transformation. Covering brand values, identity components, target audience, positioning, and guidelines, it’s ideal for companies refreshing their brand. Compatible with PowerPoint, Keynote, and Google Slides, it ensures a streamlined, professional presentation of your rebranding strategy.


27 slides
Creative Business Overview Presentation
Enhance your corporate presentations with our comprehensive Business template. This resource includes detailed slides on SWOT analysis, market opportunities, strategic goals, and product details. Perfect for delivering a complete business overview, it's compatible with PowerPoint, Keynote, and Google Slides for seamless use in various professional settings.


26 slides
Modern Newsletter Presentation
Elevate your presentations with our easy-to-use template for Powerpoint, Google Slides, and Keynote. With a clean red and black design, it's perfect for any topic. You get slides for team intros, big titles, timelines, and more. Simple charts and infographics help you explain ideas clearly. There's a slide for every need: comparing things, showing places on a map, or listing facts. It's also super simple to change it the way you want. This template makes your main points stand out and helps your audience remember them. Great for work, school, or any talk. Make your slides look professional and keep your audience focused on your message. It's ready for you to download and start making great slides right away.


5 slides
Client Engagement Journey Touchpoints
Map out every stage of client interaction with the Client Engagement Journey Touchpoints Presentation. This visual slide template highlights four key customer touchpoints, with a central user icon to emphasize the client-centric approach. Ideal for showcasing brand awareness, first contact, engagement strategies, and conversion steps. Easily customizable in PowerPoint, Keynote, and Google Slides.


26 slides
Vegan Lifestyle for Beginners Presentation
Embark on a journey of wellness and sustainability with our vegan lifestyle for beginners presentation. Infused with the refreshing colors of nature — green, orange, and red — this vibrant template is perfect for individuals stepping into the health-conscious world of veganism. Ideal for nutritionists, health coaches, and culinary instructors. It's packed with inviting graphics, expressive icons, and easy-to-customize image placeholders, all designed to make your transition to a plant-based lifestyle as smooth and enjoyable as possible. Plus, it's fully compatible with PowerPoint, Keynote, and Google Slides, enhancing accessibility and ease of use.


6 slides
6-Factor PESTEL Analysis Slide Deck Presentation
Spark fresh strategic insights with a vibrant hexagon layout that turns complex external factors into a clear, engaging story. This presentation helps teams explore key influences, compare trends, and guide smarter decision-making with confidence. Easy to edit and fully compatible with PowerPoint, Keynote, and Google Slides.


23 slides
Drift UX Case Study Presentation
Ready to wow your audience with a stunning showcase of your UX and UI design brilliance? This UX Case Study template is your secret weapon to turn heads and leave a lasting impression! Bursting with sleek, modern designs, it’s tailored to guide your audience through every thrilling step of your design process—from initial research and user personas to wireframes, prototypes, and polished final products. Highlight your innovative thinking, showcase your creative problem-solving, and bring your design stories to life in a way that's not just informative, but truly inspiring. Whether you’re pitching to a client, presenting to stakeholders, or sharing your vision with the world, this template ensures your ideas shine bright. Fully compatible with PowerPoint, Keynote, and Google Slides, it's the perfect tool to captivate, engage, and inspire your audience at every slide!


4 slides
Decision-Making Models and Strategies Presentation
Break down complex decision-making processes into clear, visual steps with the Decision-Making Models and Strategies presentation slide. This template uses a 3D staircase layout paired with data percentages to illustrate phases, criteria, or strategy distribution. It's perfect for business analysts, consultants, or strategic planning teams. Fully editable in PowerPoint, Keynote, and Google Slides for quick customization.


22 slides
Muse UX Case Study Presentation
Deliver compelling UX case studies with a sleek presentation template designed to highlight your design journey and results. Ideal for showcasing your user-centered approach, it includes dedicated slides for project overview, user research, personas, journey mapping, wireframes, prototyping, and user testing. Clearly communicate your design principles and decision-making processes with visual design elements and brand guidelines. With specific sections for feedback, accessibility considerations, and project outcomes, this template ensures every aspect of your UX process is captured in a structured and visually engaging manner. Whether you're presenting to clients, stakeholders, or design teams, this template is fully editable and compatible with PowerPoint, Google Slides, and Keynote. Its modern design and professional layout provide an effortless way to convey the value of your UX work, making a lasting impact on your audience. Tailor it to your brand, and elevate your case studies today!


5 slides
Company Success Story Timeline Presentation
Highlight your journey with the Company Success Story Timeline Presentation. This modern, mountain-style layout helps you break down your company’s key milestones, phases, or achievements step by step. With five customizable stages and icons, it’s ideal for visual storytelling, growth metrics, or project retrospectives. Fully editable in Canva, PowerPoint, Keynote, and Google Slides.


10 slides
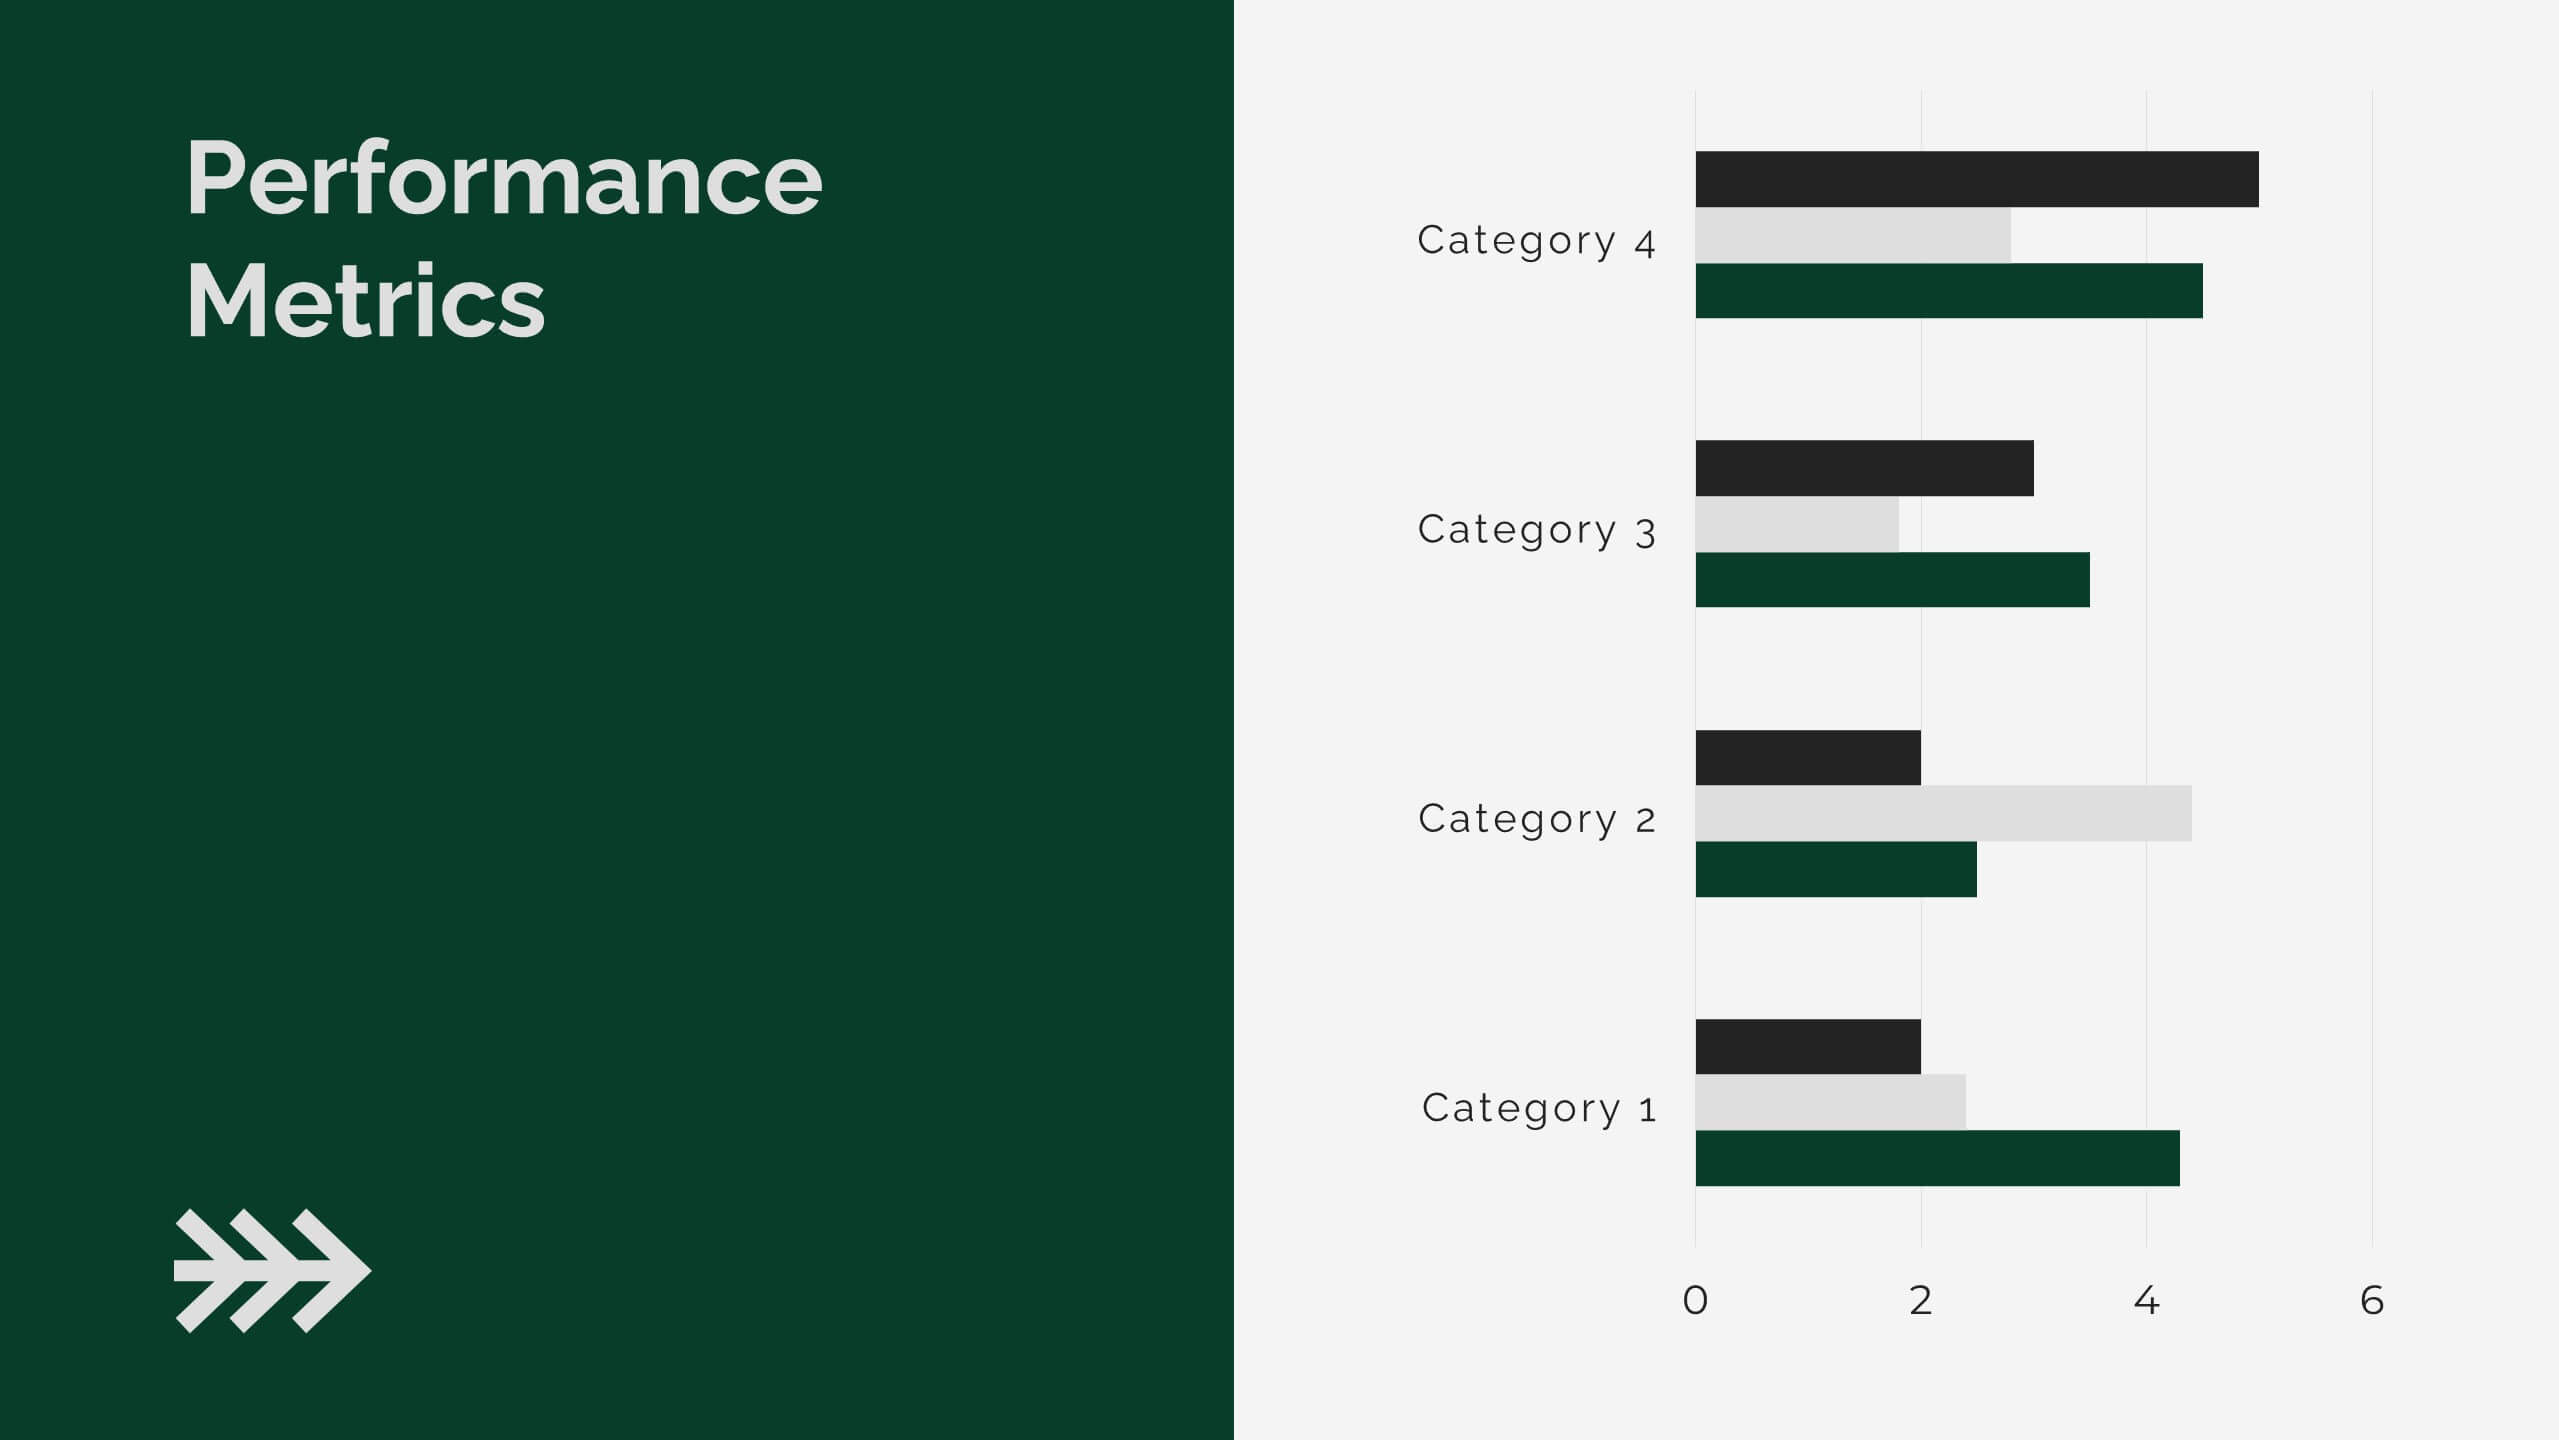
Business Performance Metrics Presentation
Track and display your business metrics effectively with the "Business Performance Metrics" presentation templates. These visually engaging slides are designed to help you present key performance indicators in a clear and structured manner, enhancing understanding and decision-making. Ideal for corporate presentations, these templates are fully compatible with PowerPoint, Keynote, and Google Slides, ensuring seamless integration into your workflow.


4 slides
Team and Department Setup Structure Presentation
Organize your team with clarity using the Team and Department Setup Structure Presentation. This template is perfect for showcasing internal team hierarchies, departmental layouts, or functional groupings in a clean and professional layout. Each slide is fully customizable, allowing you to edit icons, titles, and structure to suit your organization. Compatible with Canva, PowerPoint, Keynote, and Google Slides.


4 slides
Professional Team Member Slides Presentation
Meet your team in a fresh, dynamic way with a layout that highlights personalities, roles, and key contributions at a glance. This presentation helps introduce members clearly, supporting stronger collaboration and professional communication across any project. Fully customizable and compatible with PowerPoint, Keynote, and Google Slides.