


Features
- 5 Unique slides
- Fully editable and easy to edit in Microsoft Powerpoint, Keynote and Google Slides
- 16:9 widescreen layout
- Clean and professional designs
- Export to JPG, PDF or send by email


Do you have any questions?
Recommend


4 slides
Product & Pricing Plan Matrix Presentation
Simplify complex pricing and product details with the Product & Pricing Plan Matrix Presentation. This structured grid layout is ideal for comparing multiple service tiers, packages, or feature sets side-by-side. Easily customizable, each block allows you to highlight key offerings, benefits, and pricing strategies. Compatible with Canva, PowerPoint, Keynote, and Google Slides.


6 slides
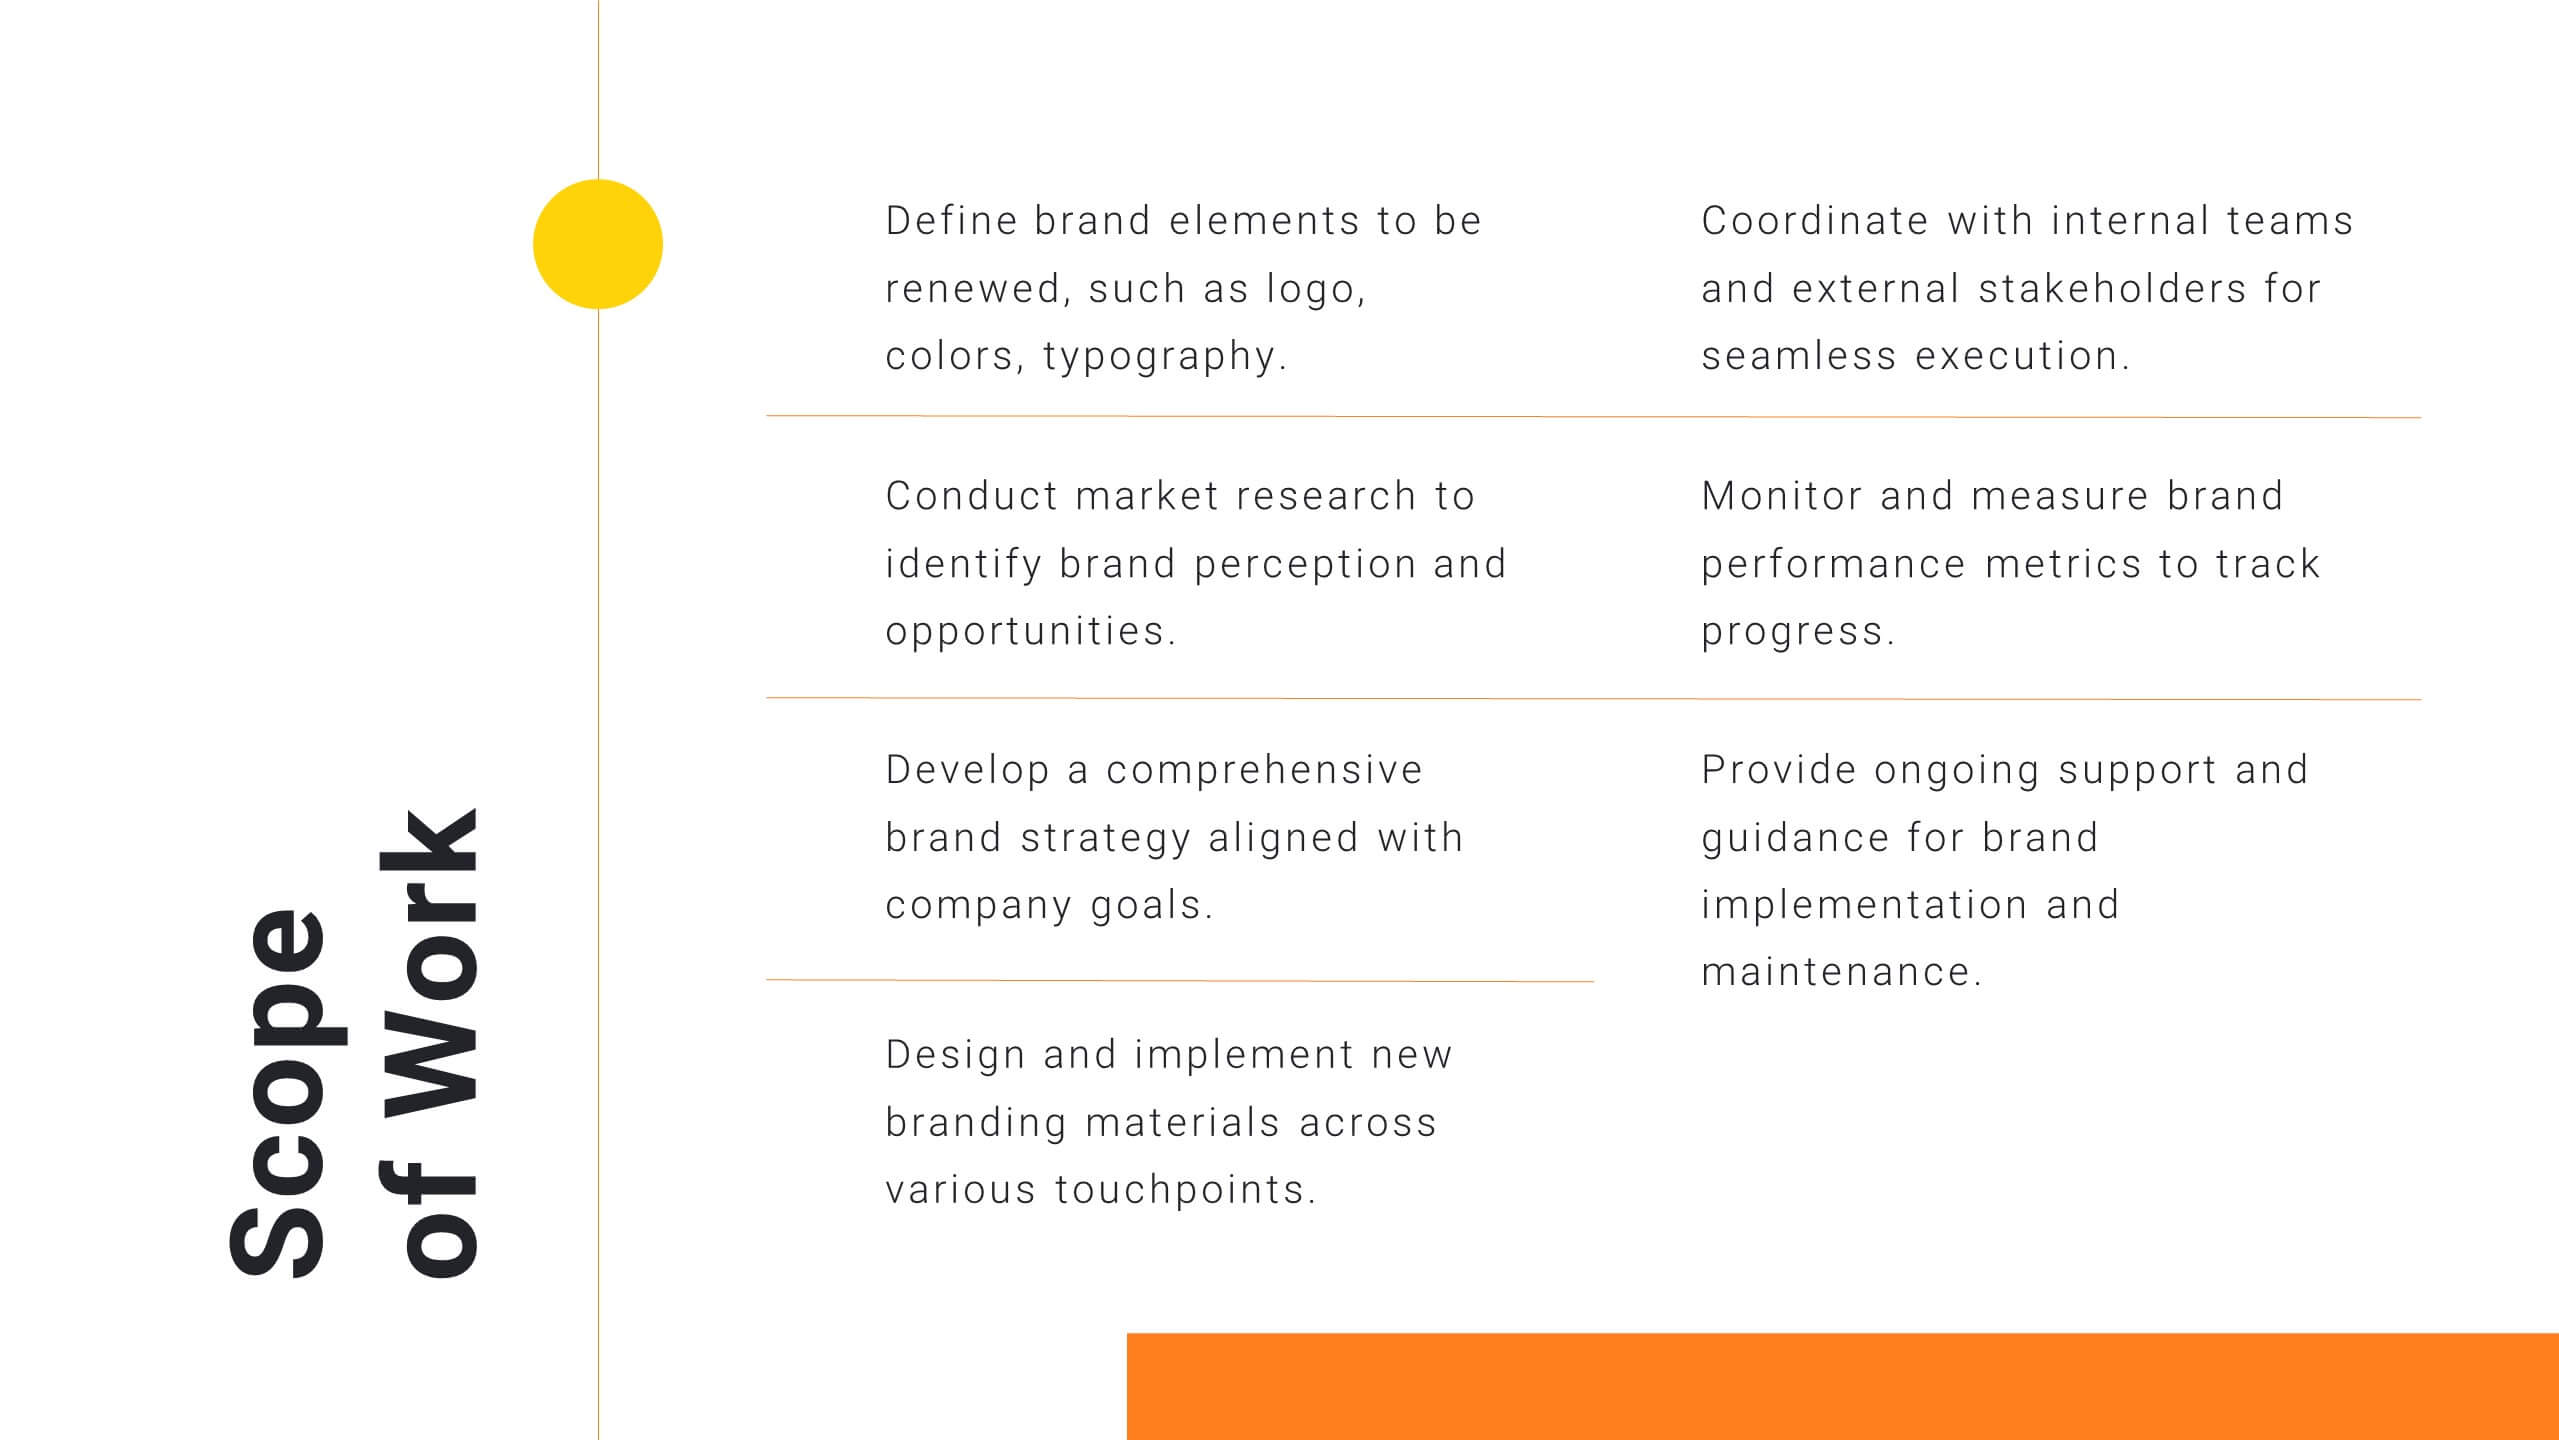
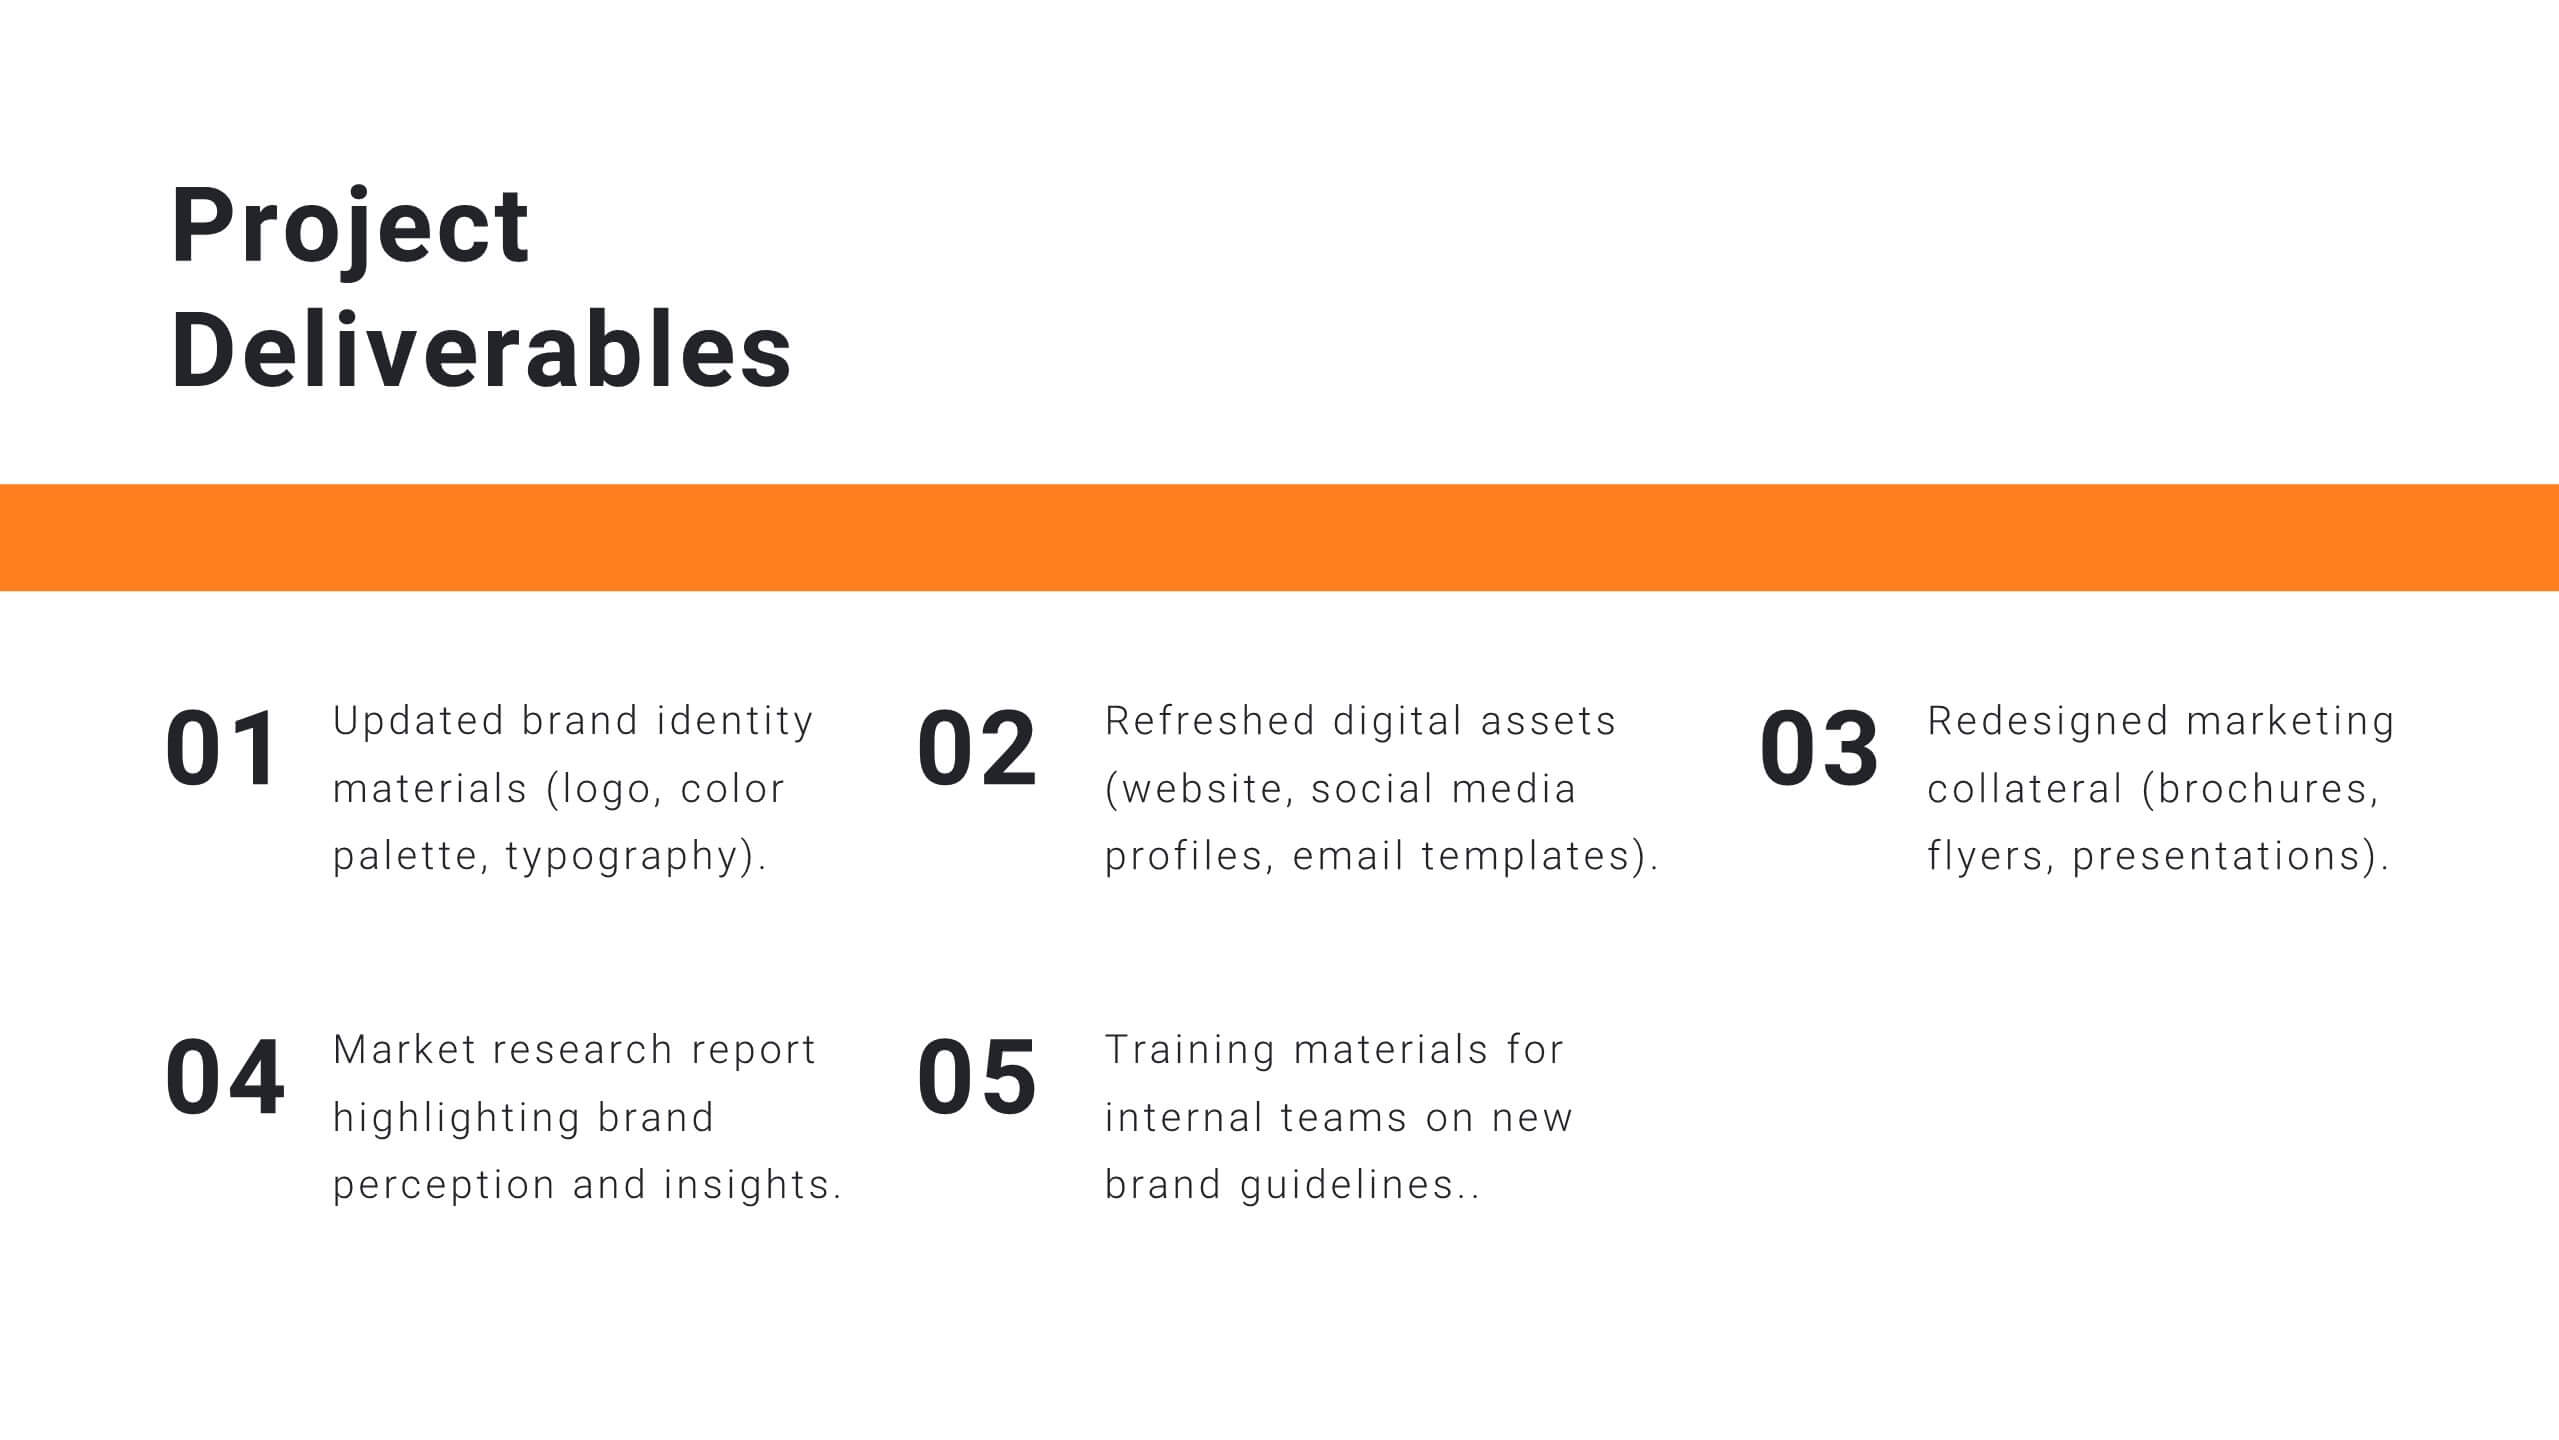
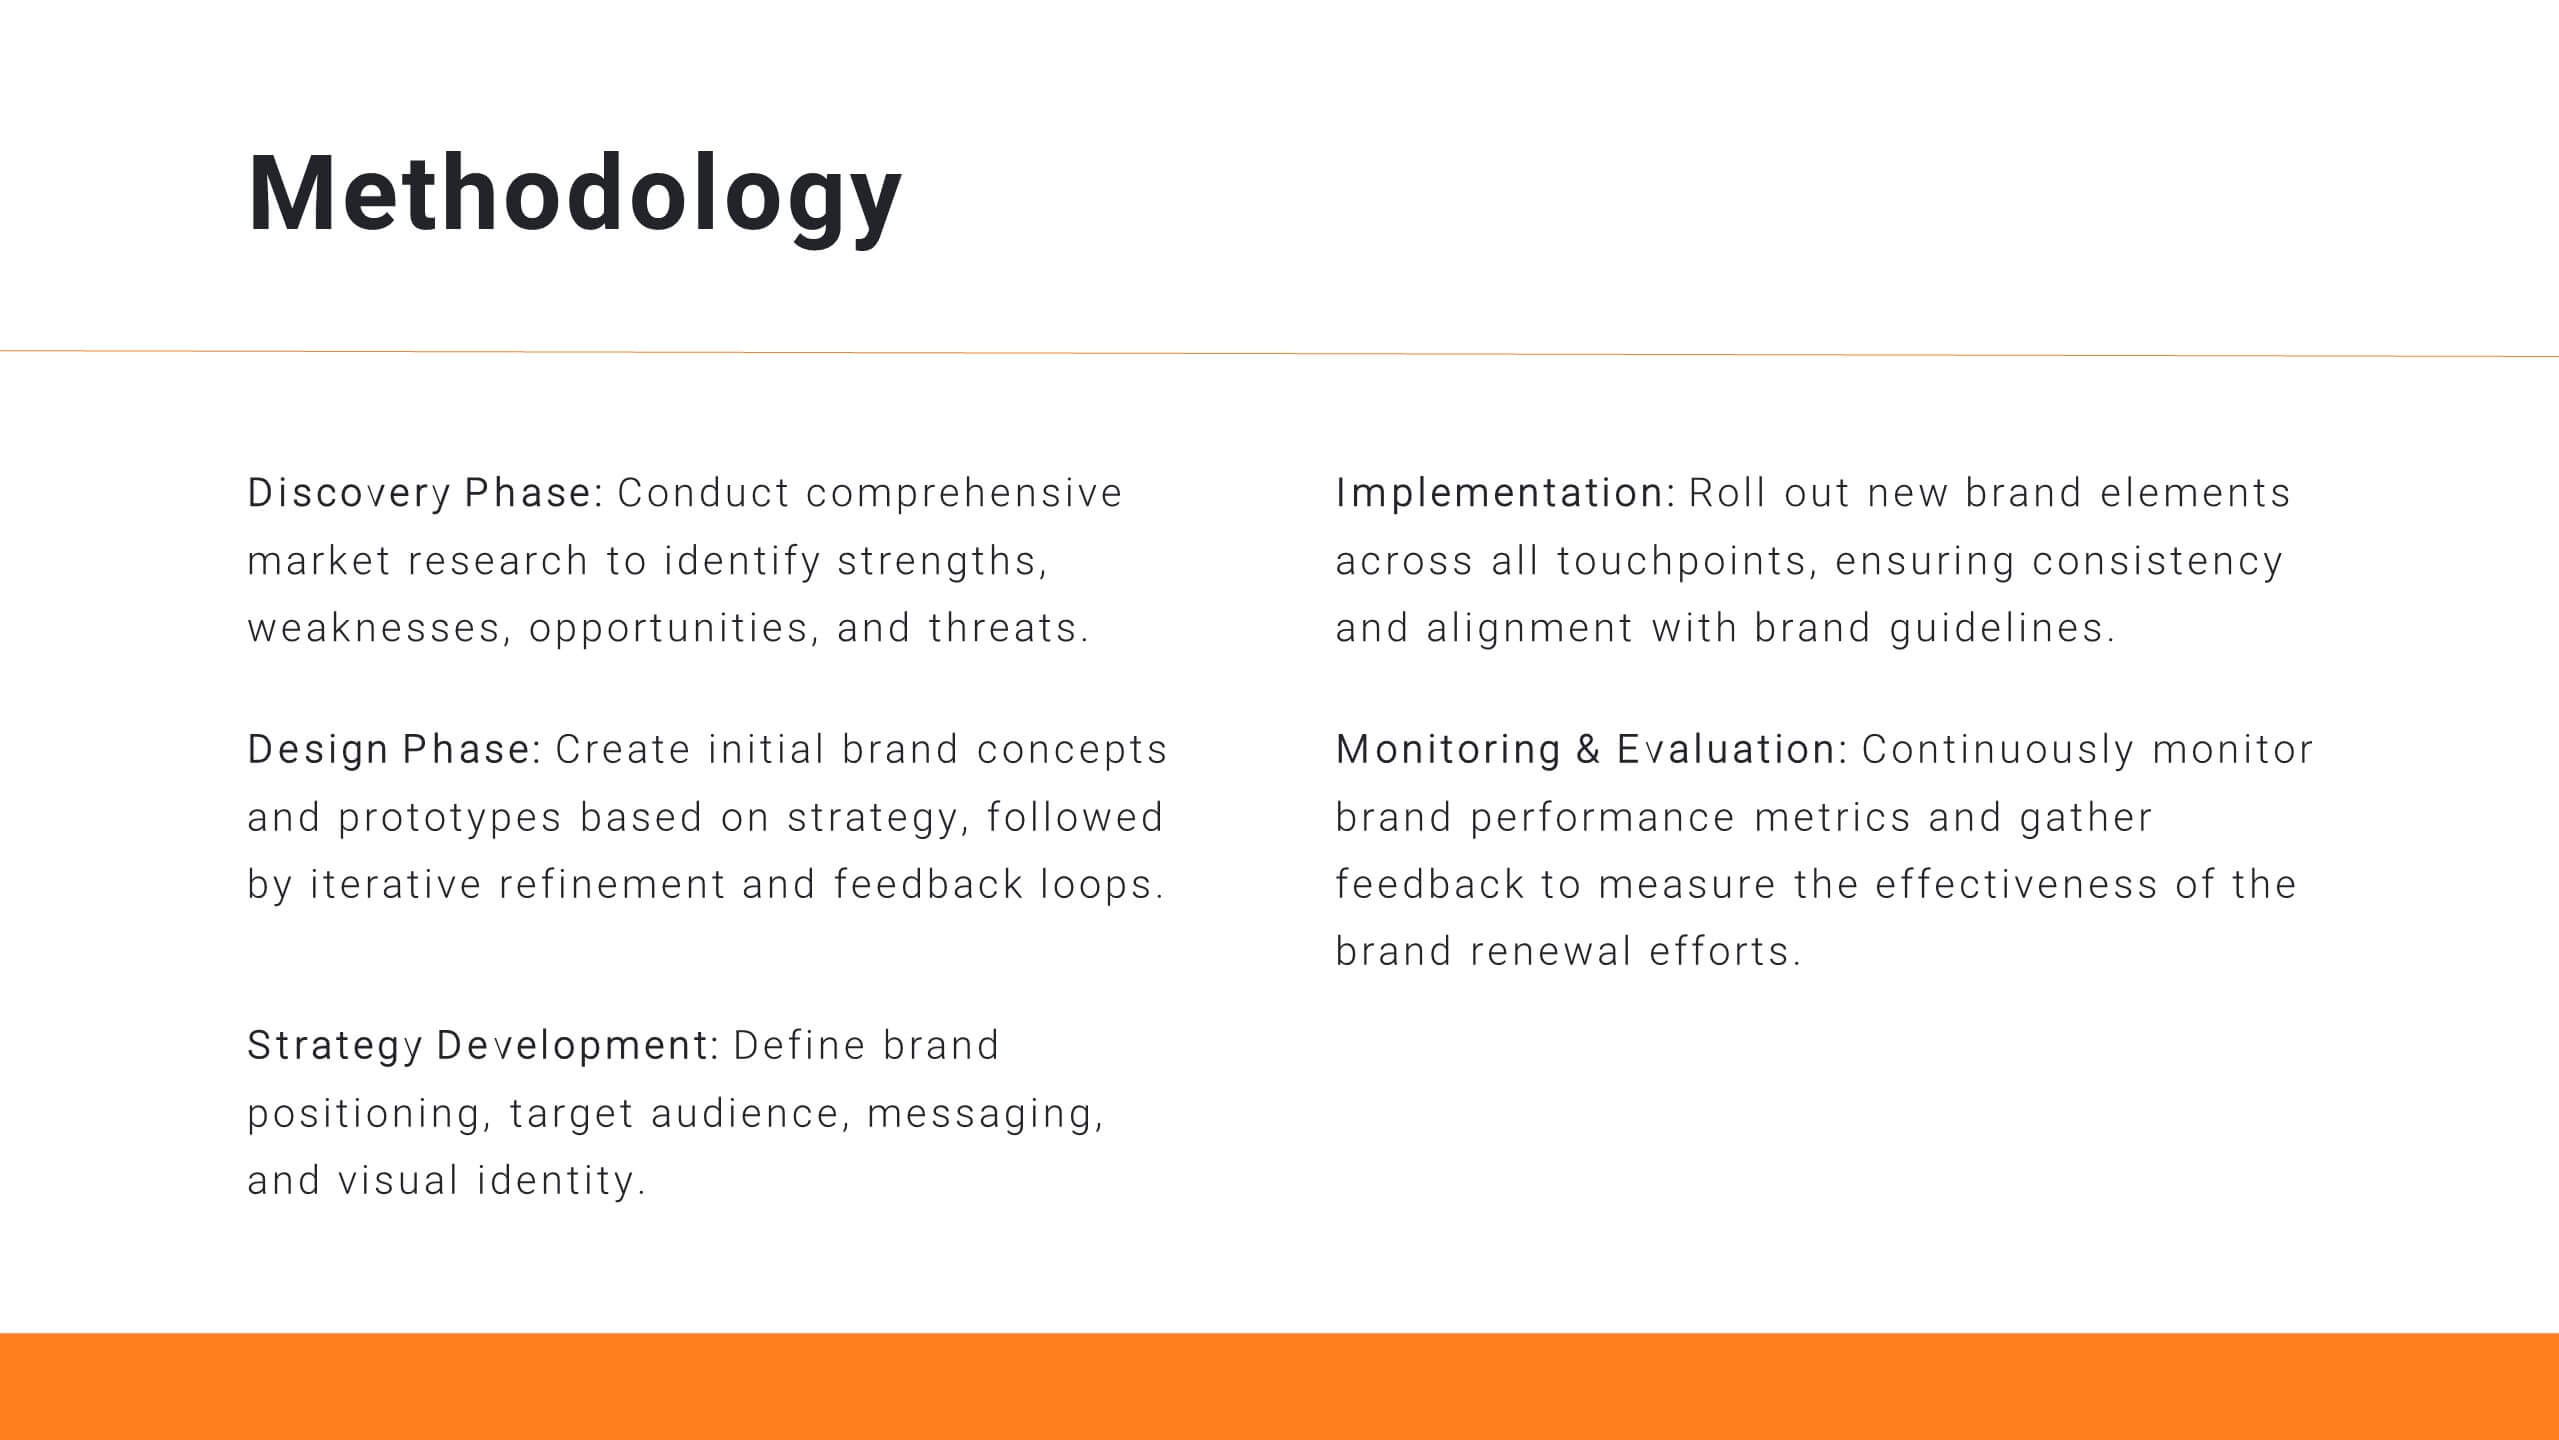
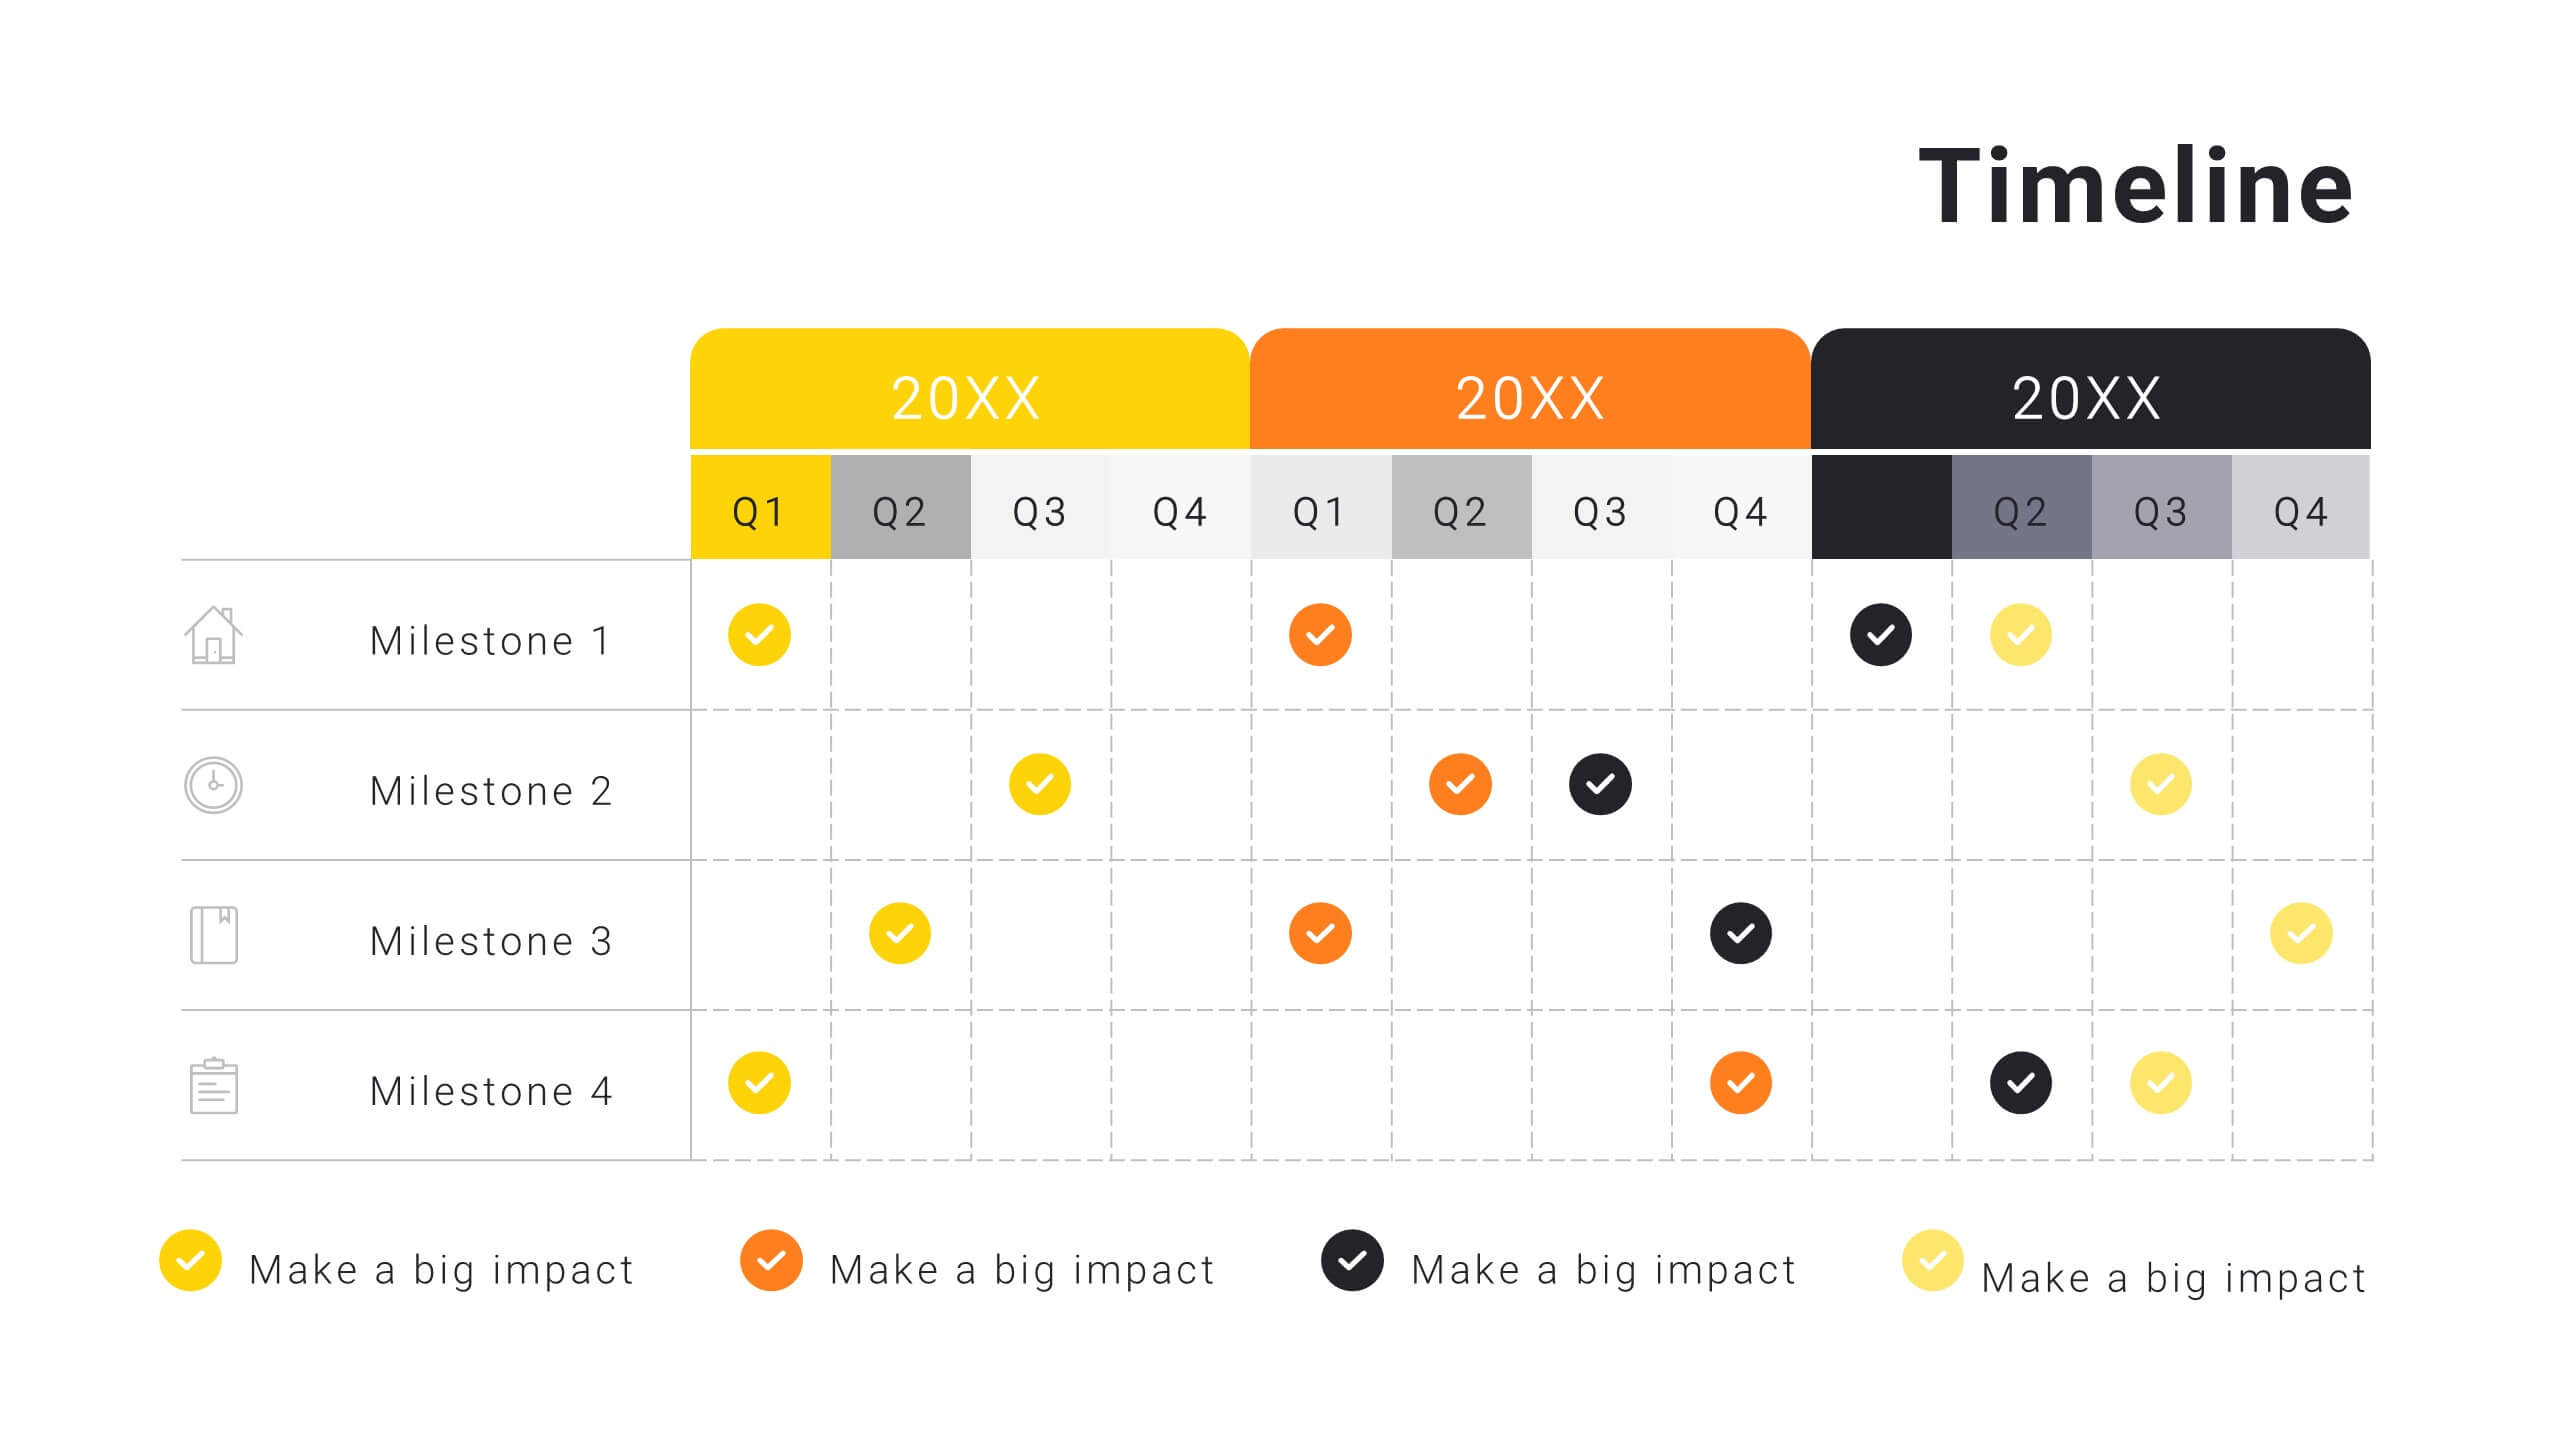
Strategic Project Proposal Overview
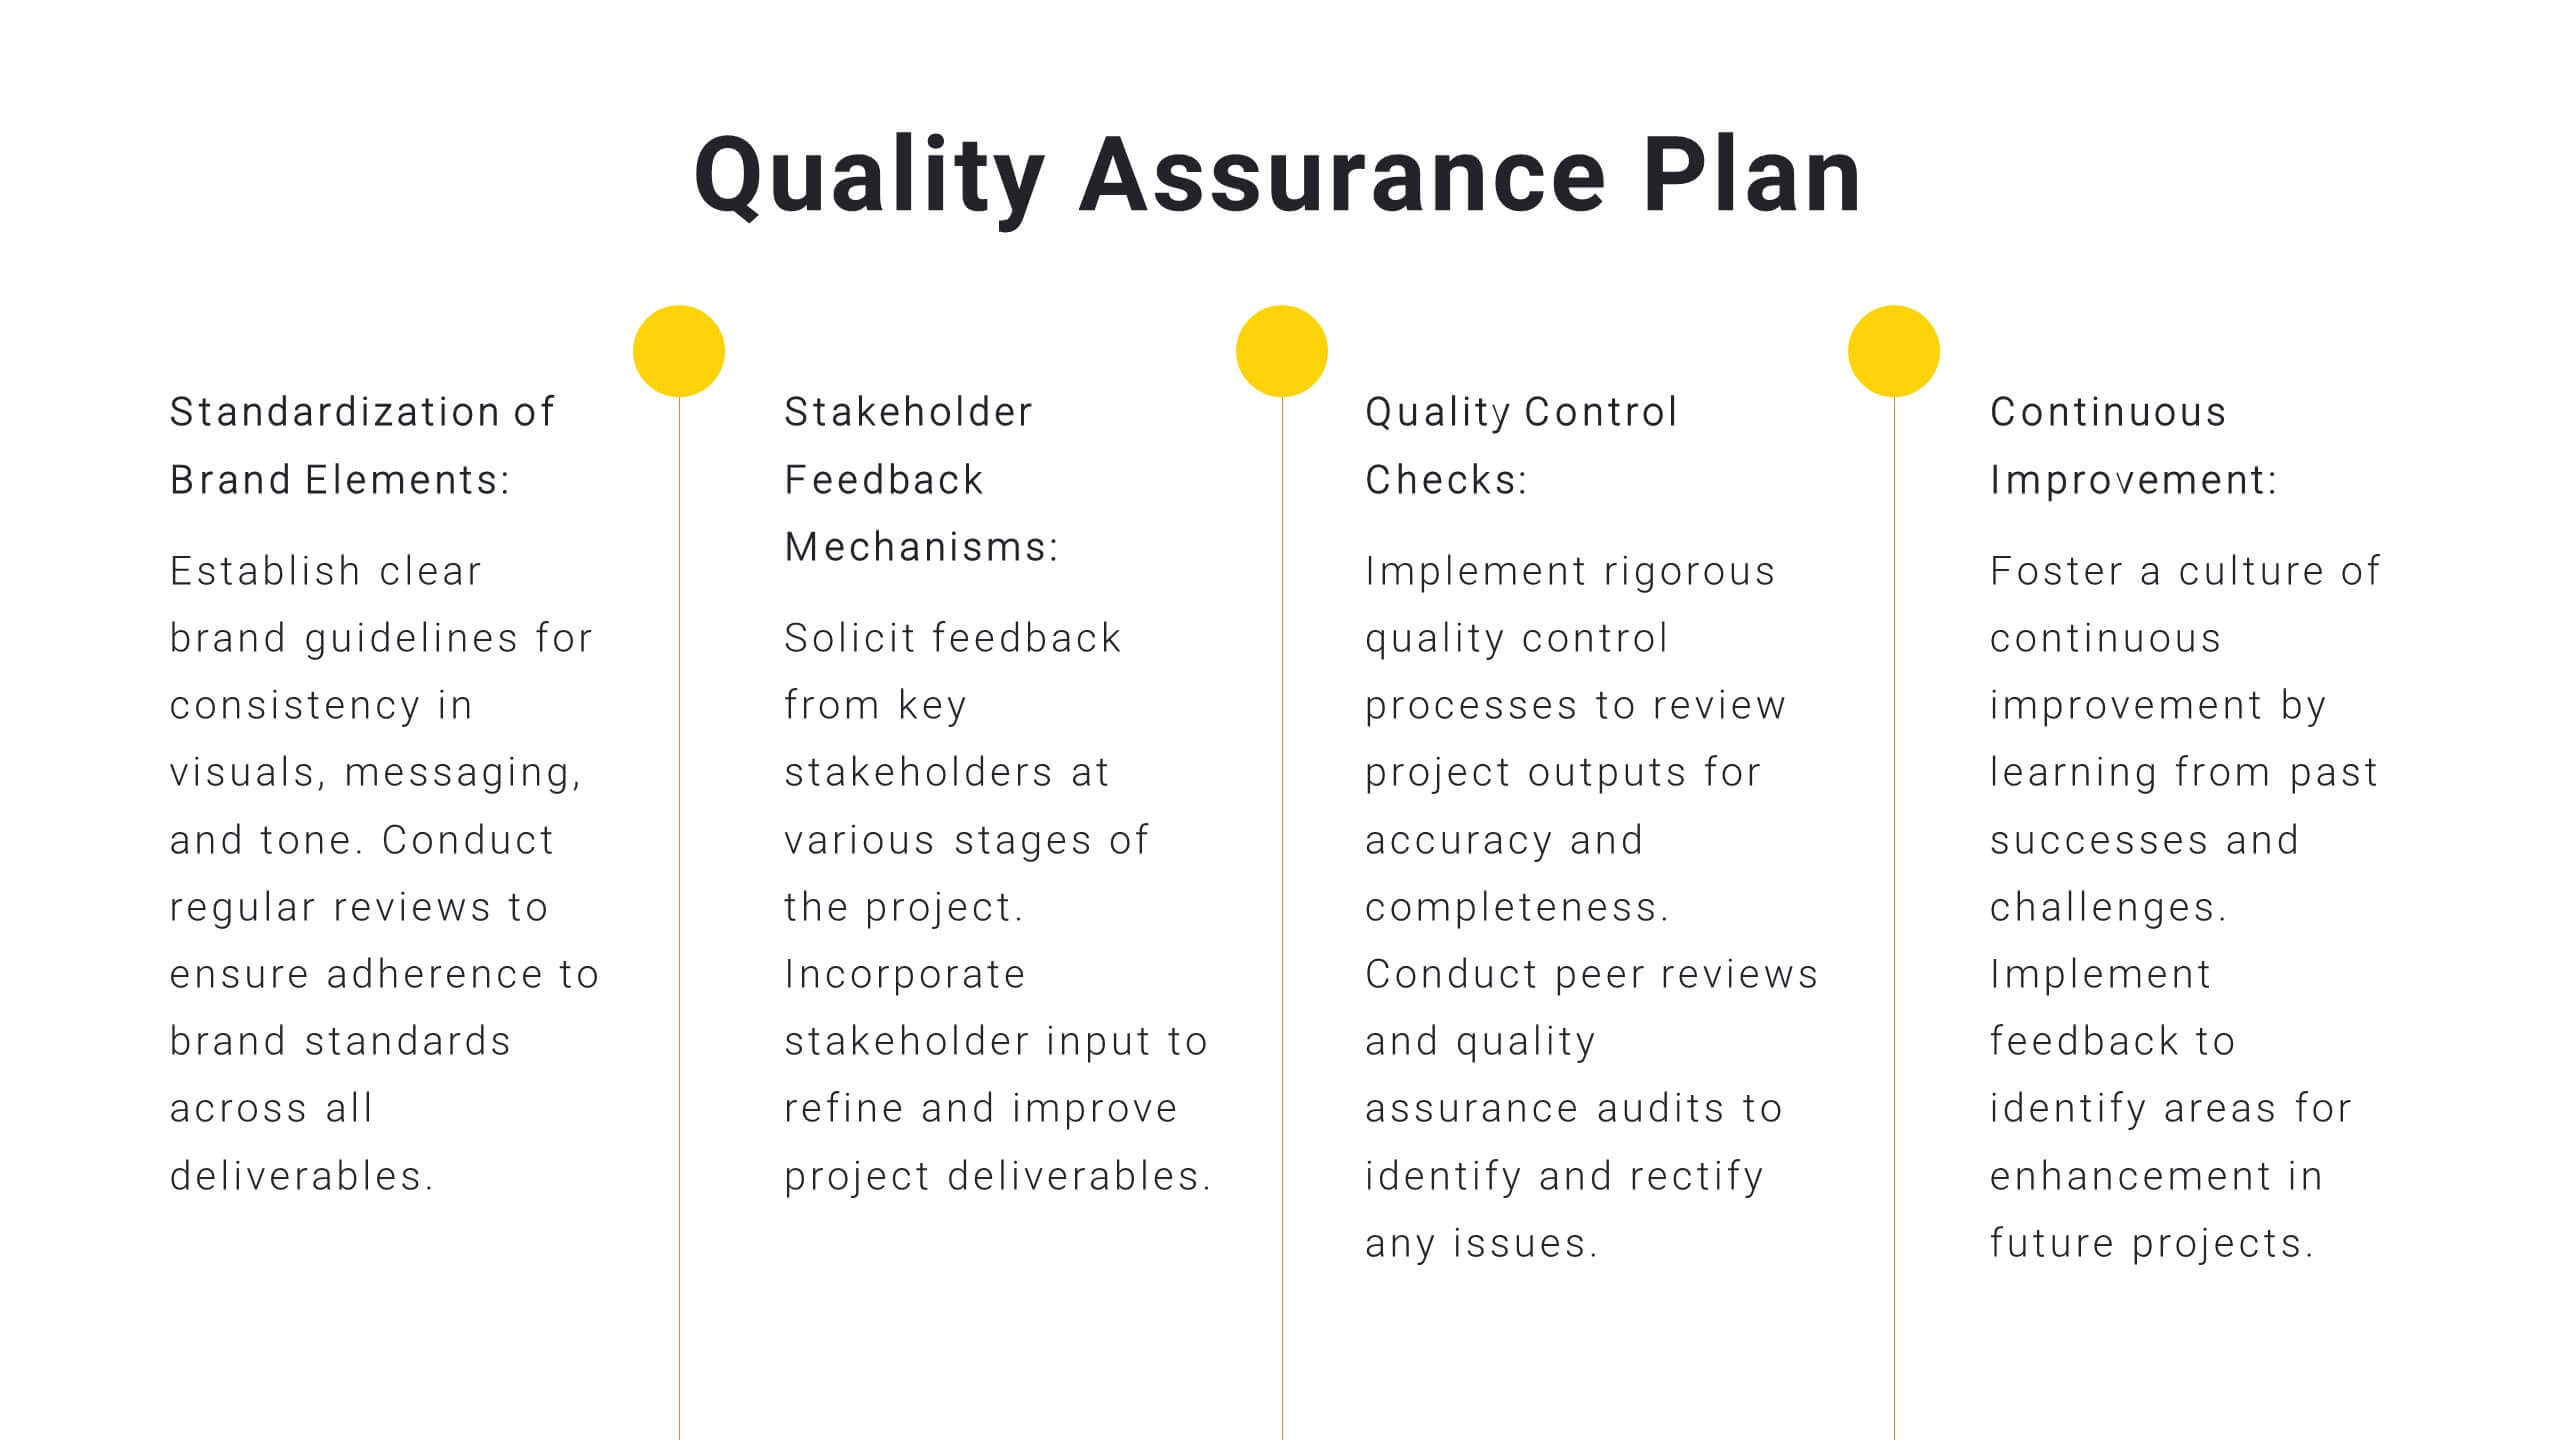
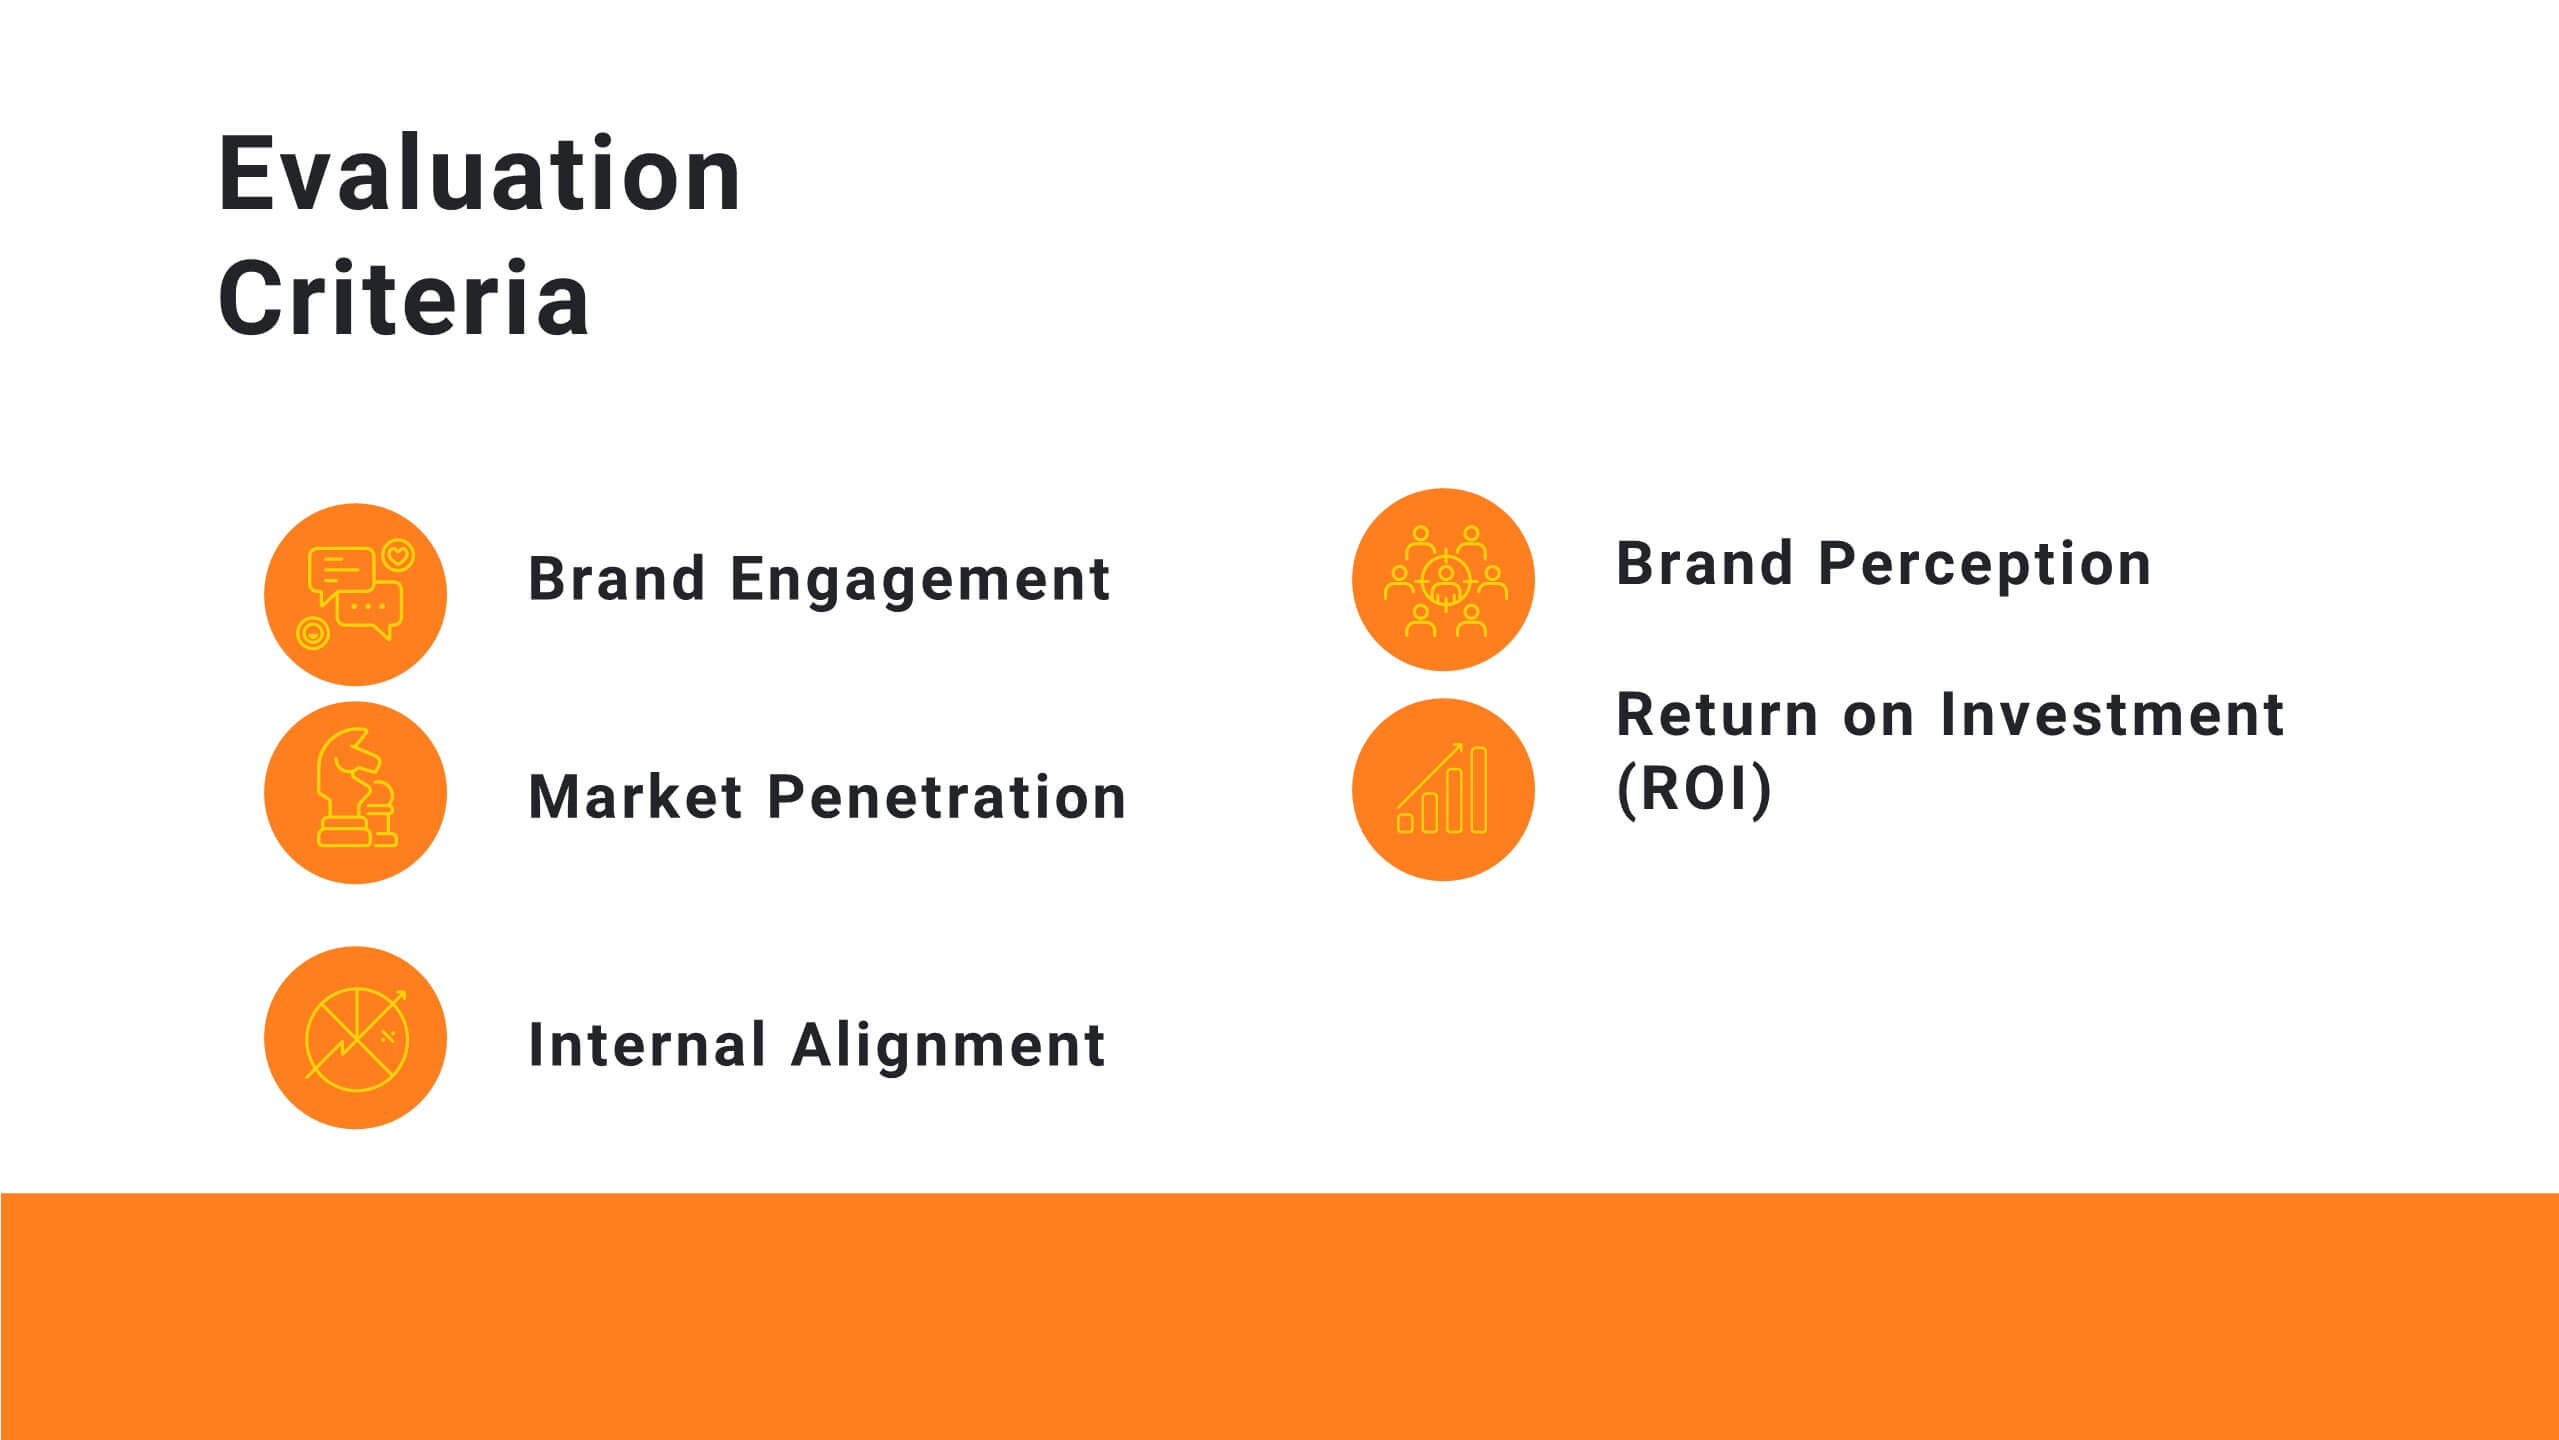
Present your project priorities with clarity using this bold and colorful Strategic Project Proposal slide. With five stacked segments, it’s ideal for outlining phases, features, or deliverables in a structured format. Fully editable in PowerPoint, Keynote, and Google Slides to suit any industry or workflow.


6 slides
Tree Diagram for Process Mapping
Visualize workflows with clarity using this Tree Diagram slide. Designed to map six key process steps branching from a central trunk, it's ideal for illustrating strategic plans, organizational flows, or project lifecycles. Fully editable in PowerPoint, Keynote, and Google Slides for cross-platform flexibility.


6 slides
Modern 3D Infographic Presentation
Add a fresh, dimensional twist to your data storytelling with this clean and modern pyramid layout. Ideal for showcasing layered structures, hierarchical information, or process stages, it’s designed to make your visuals pop. Fully editable and compatible with PowerPoint, Keynote, and Google Slides for easy customization.


7 slides
Mental Agility Training Infographic
Embark on the enlightening path of training with our intricately designed mental agility training infographic. Illuminated by the motivation of yellow, the growth of green, and the depth of blue, our template effectively outlines training methodologies and outcomes. Adorned with precision-focused infographics, intuitive icons, and adaptable image placeholders, it renders complex training data into an easily digestible format. Expertly sculpted for Powerpoint, Keynote, or Google Slides. A quintessential tool for trainers, HR professionals, or any organization aiming to elevate its training regimen. Enlighten your audience; let every slide be a step towards mastery.


21 slides
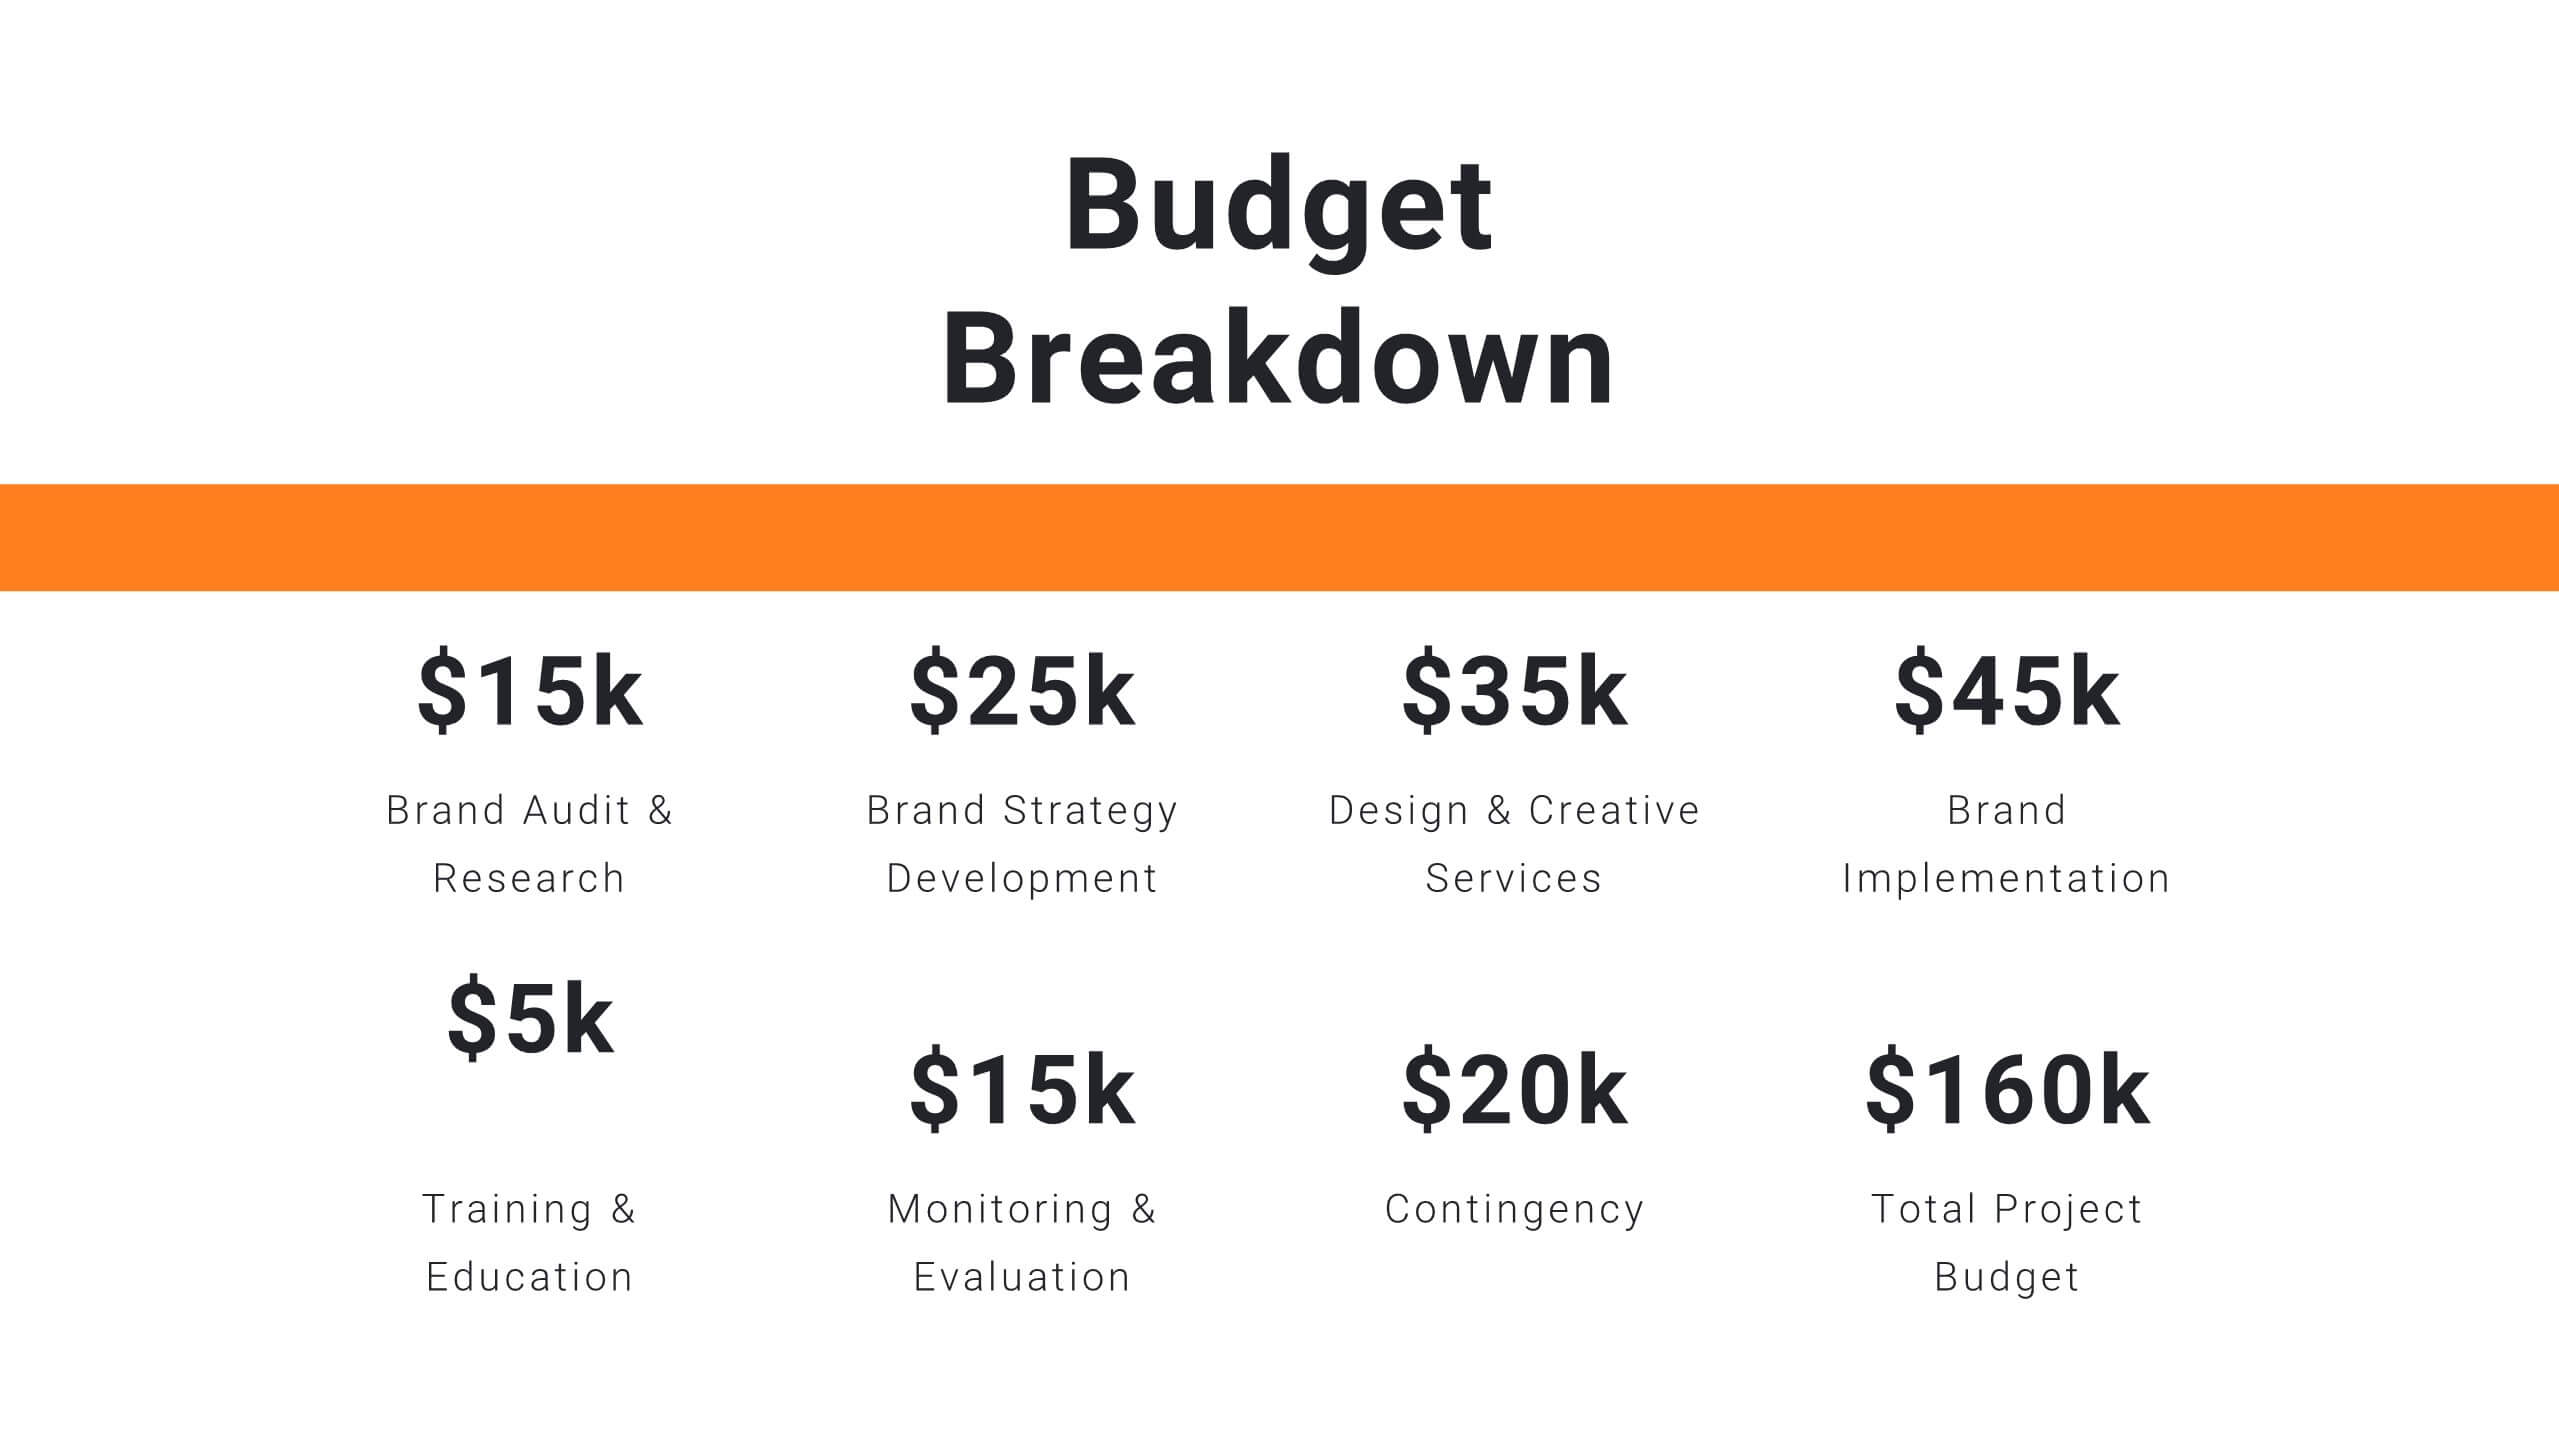
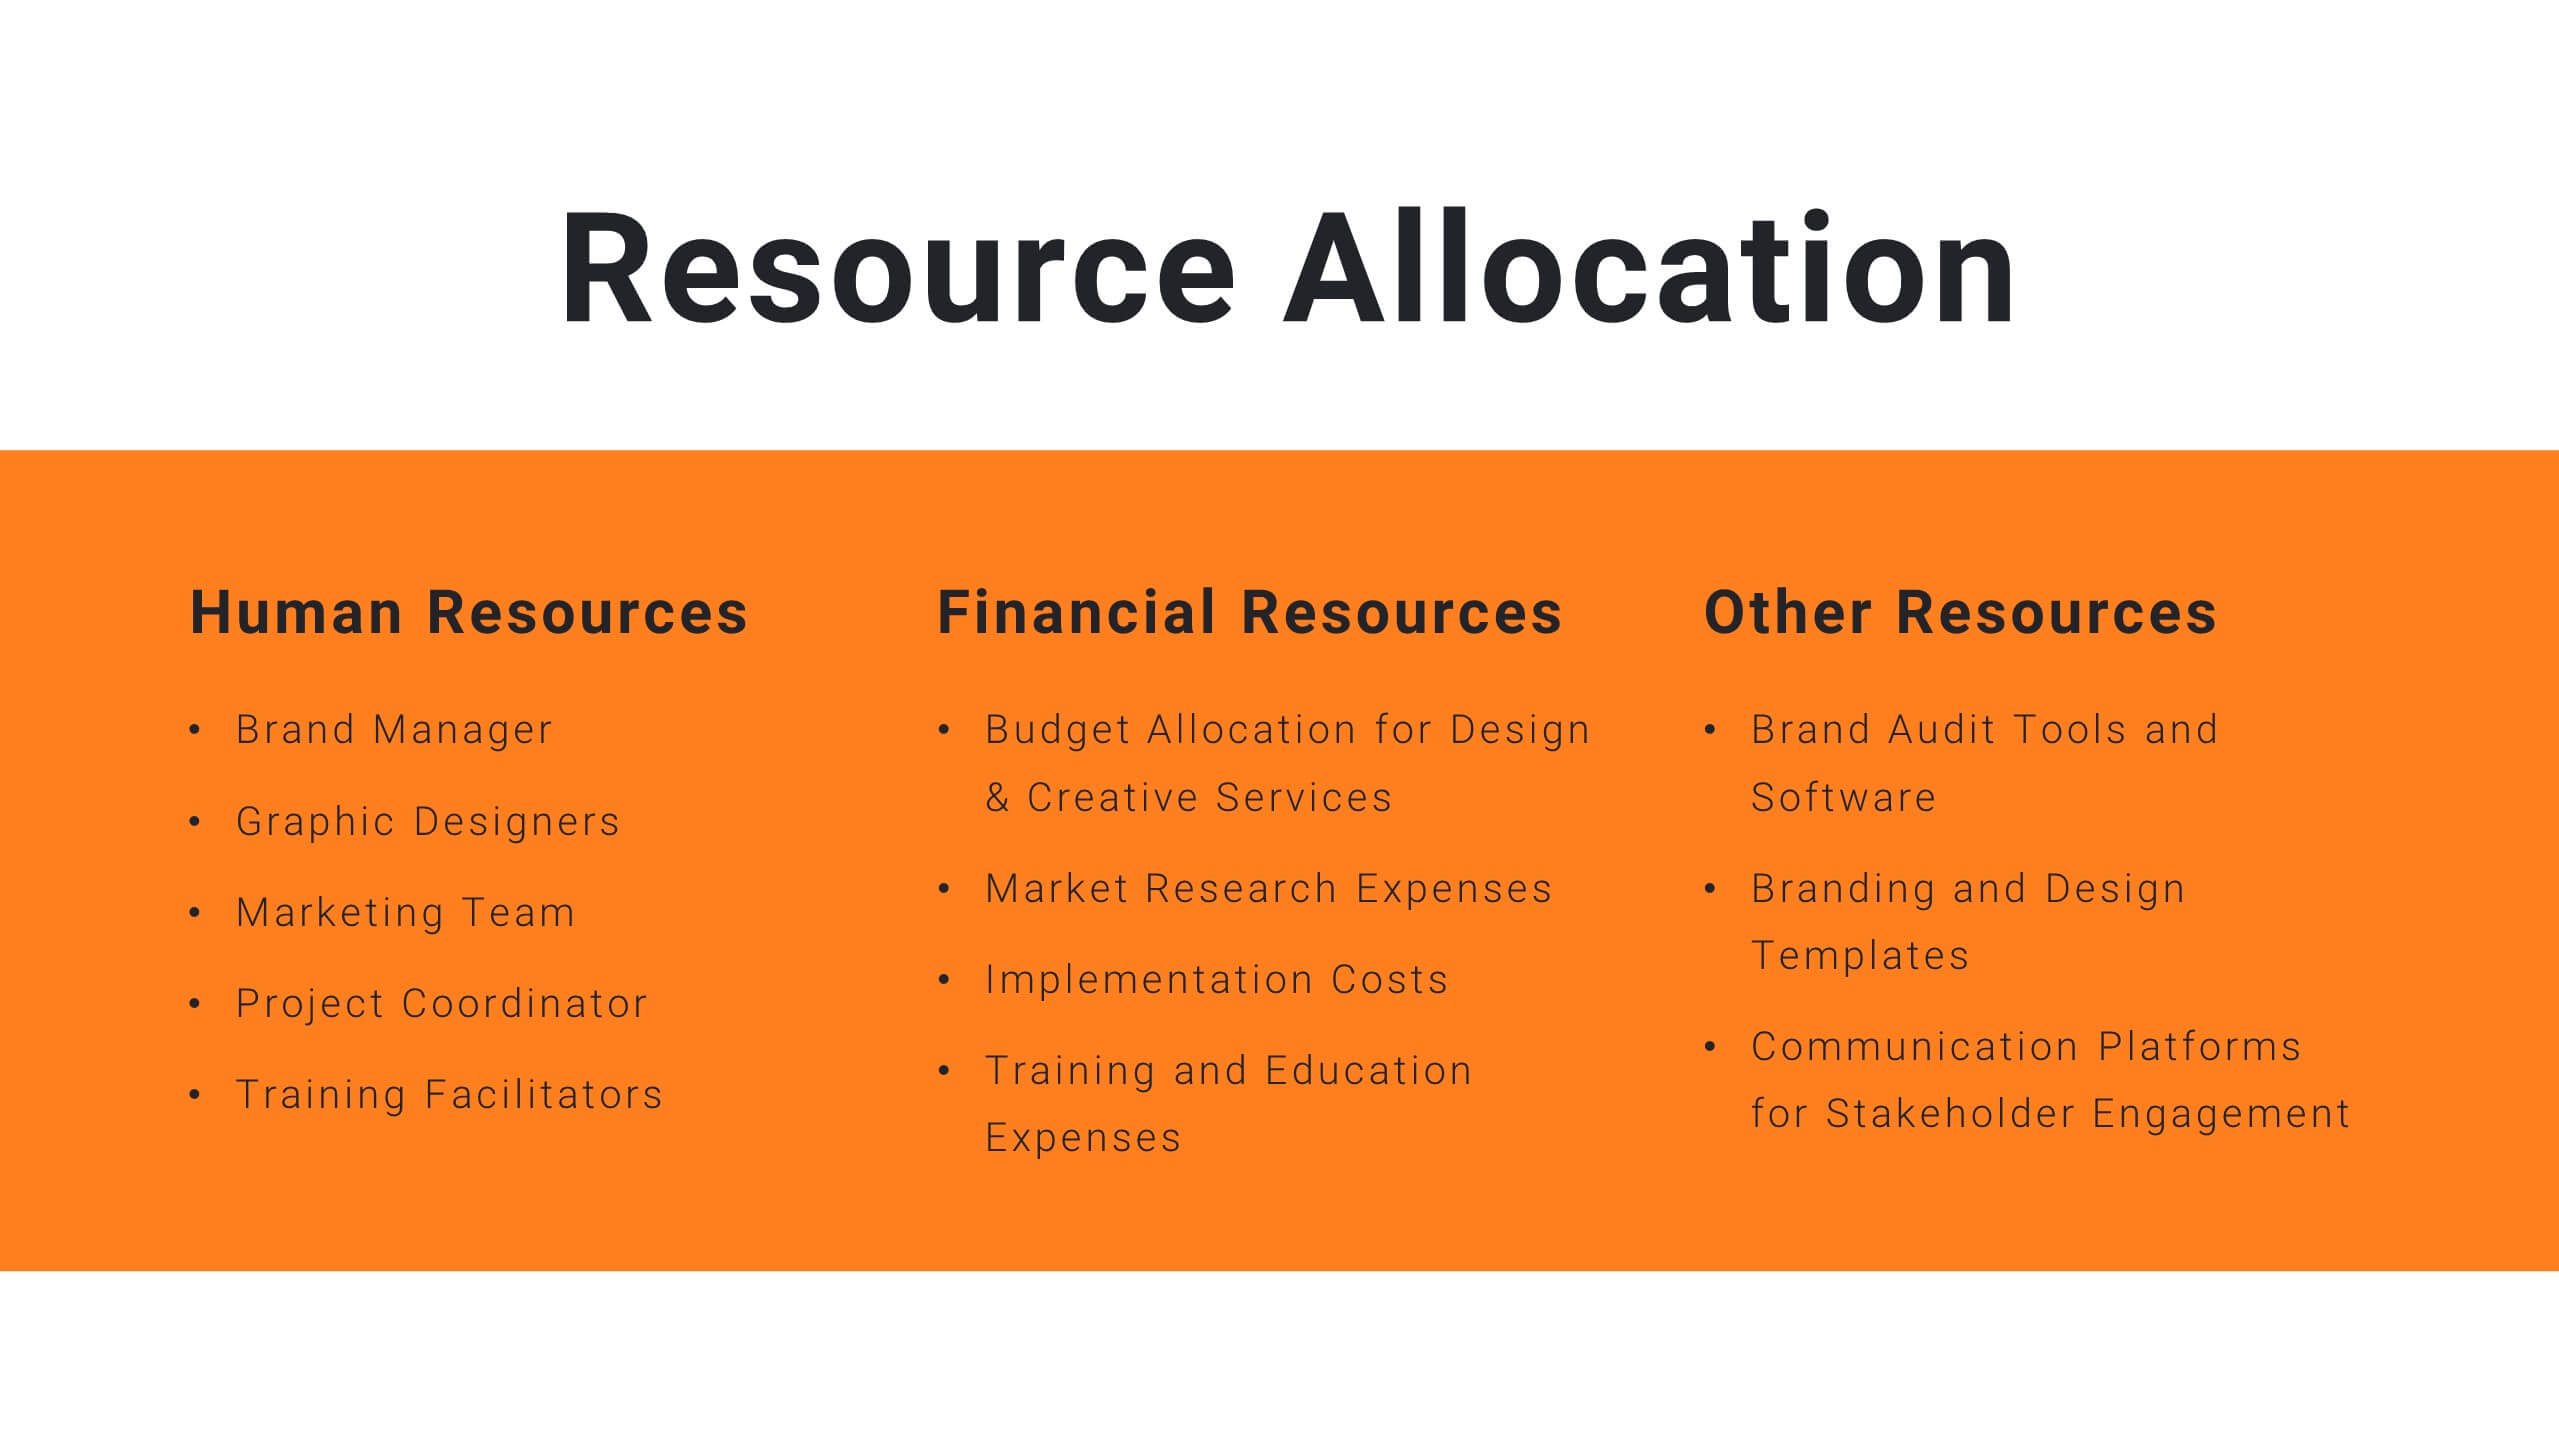
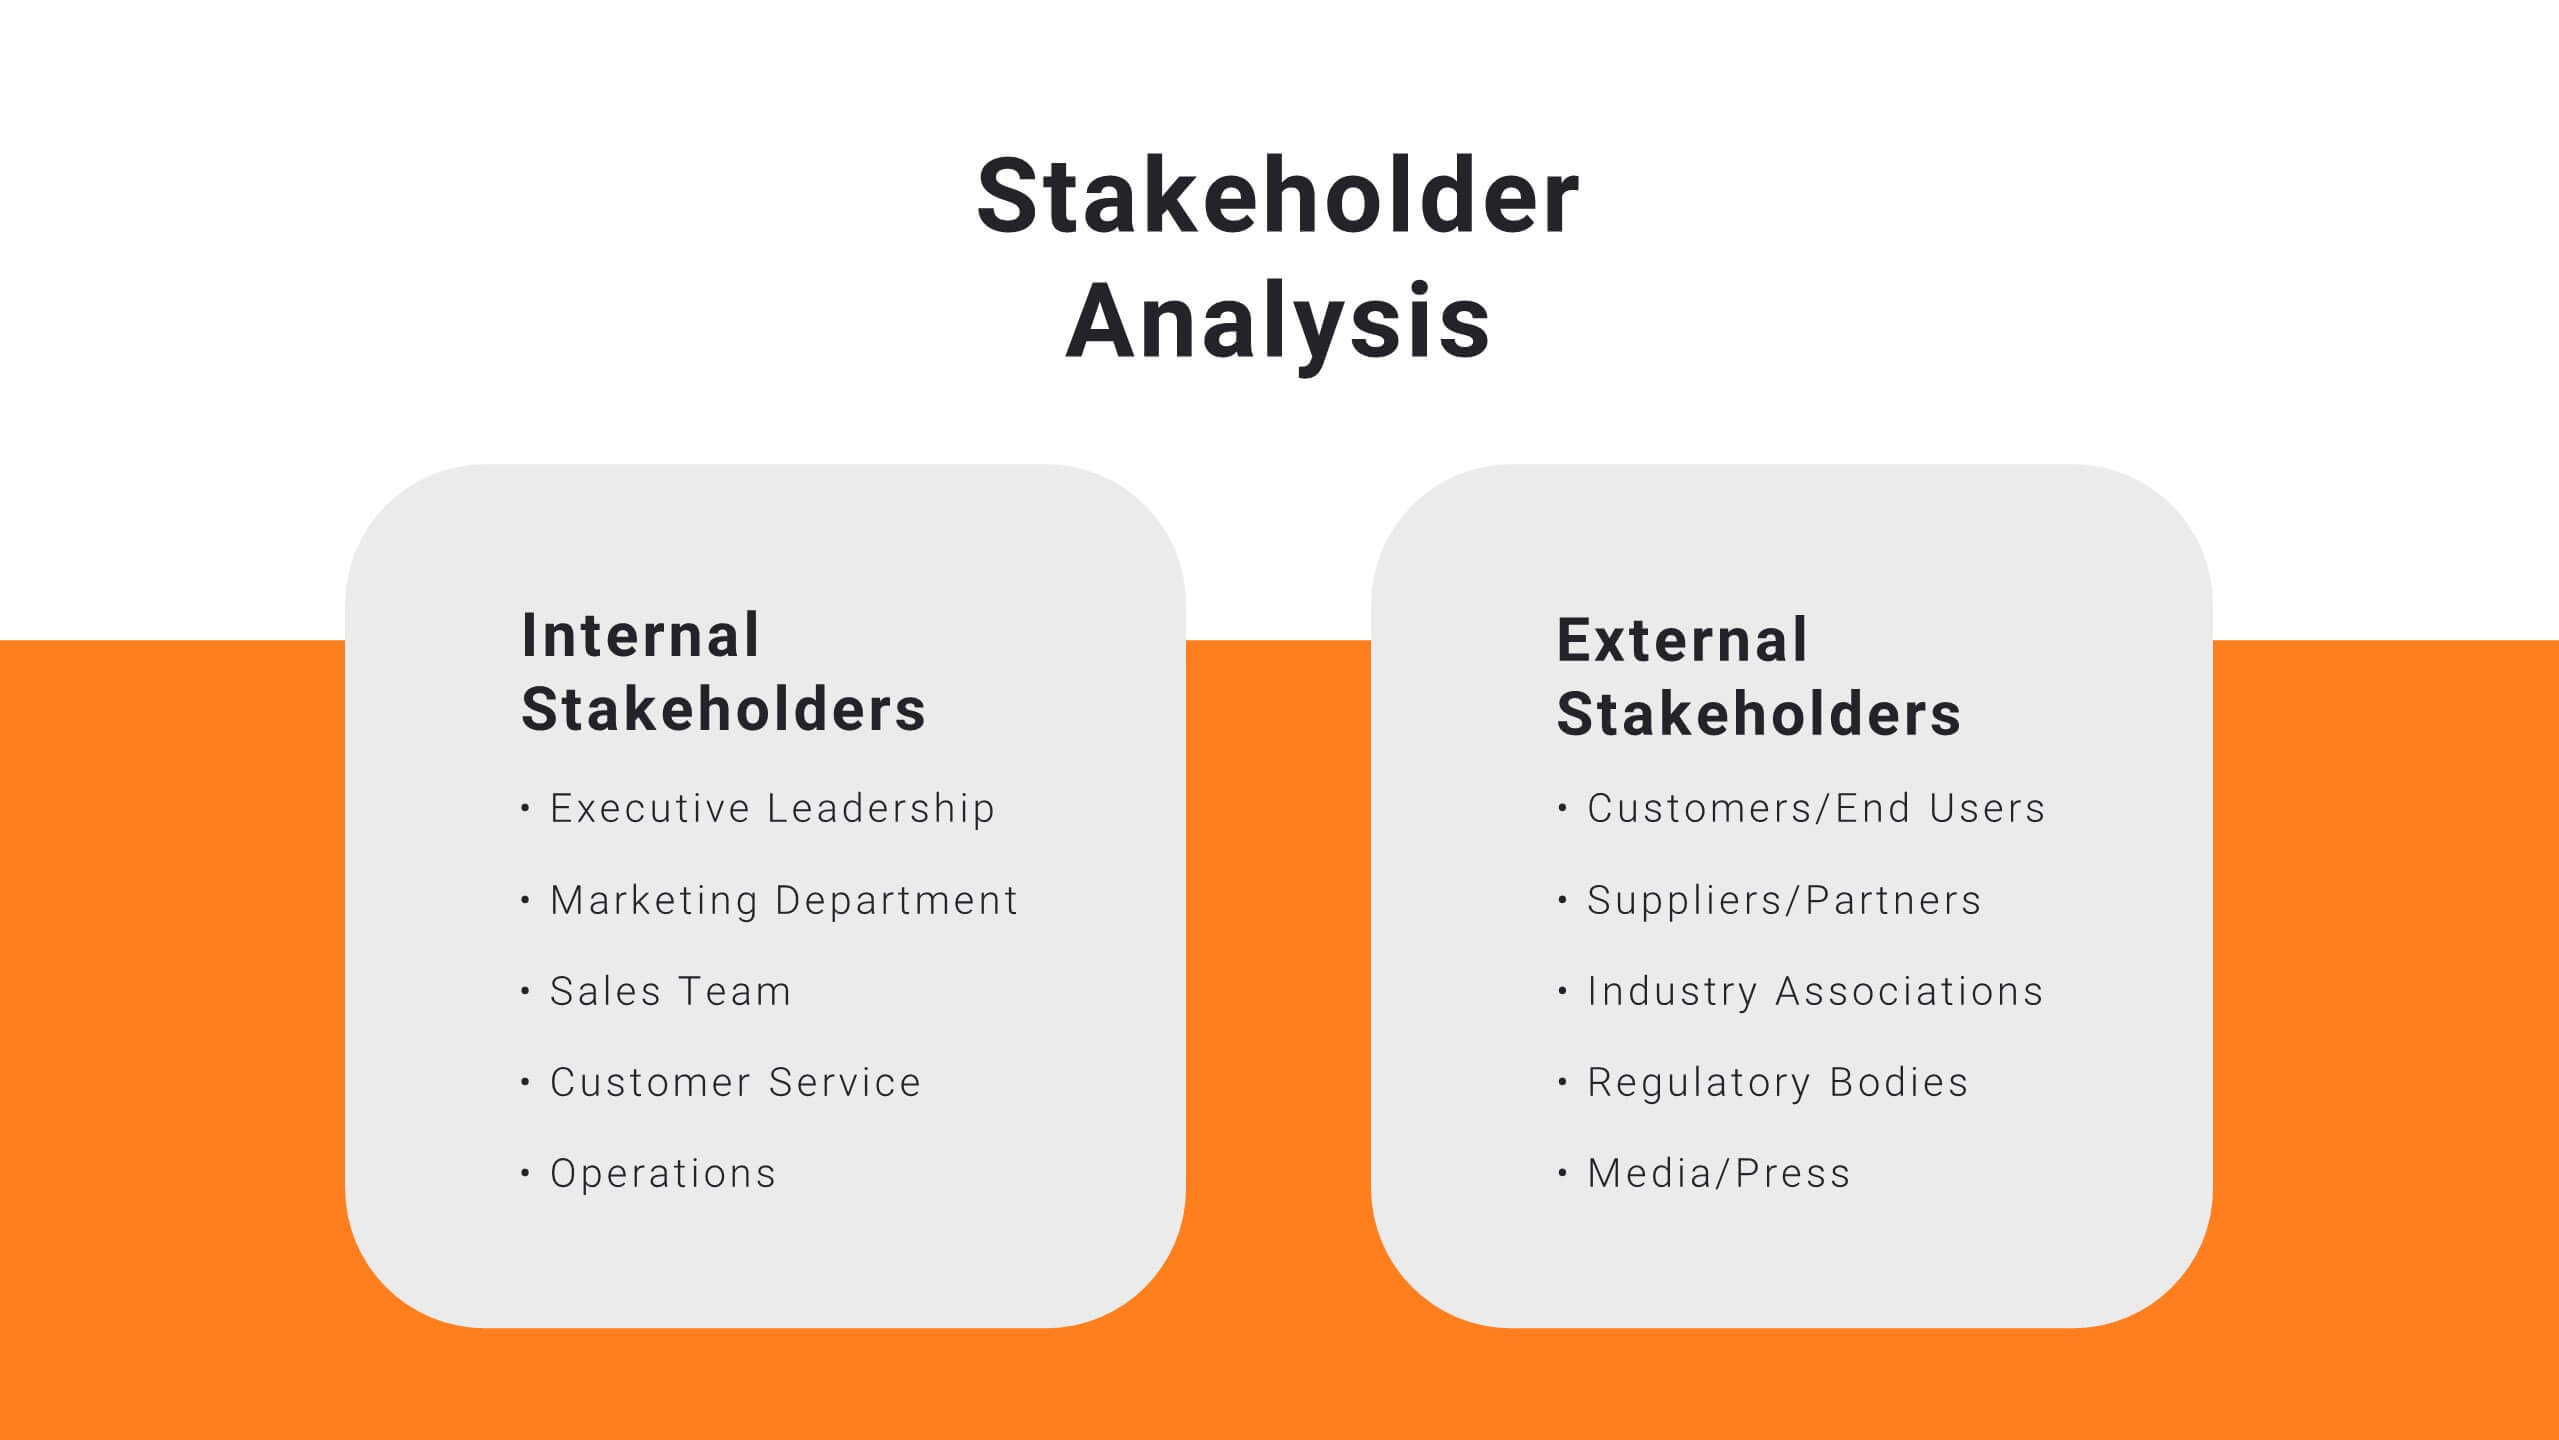
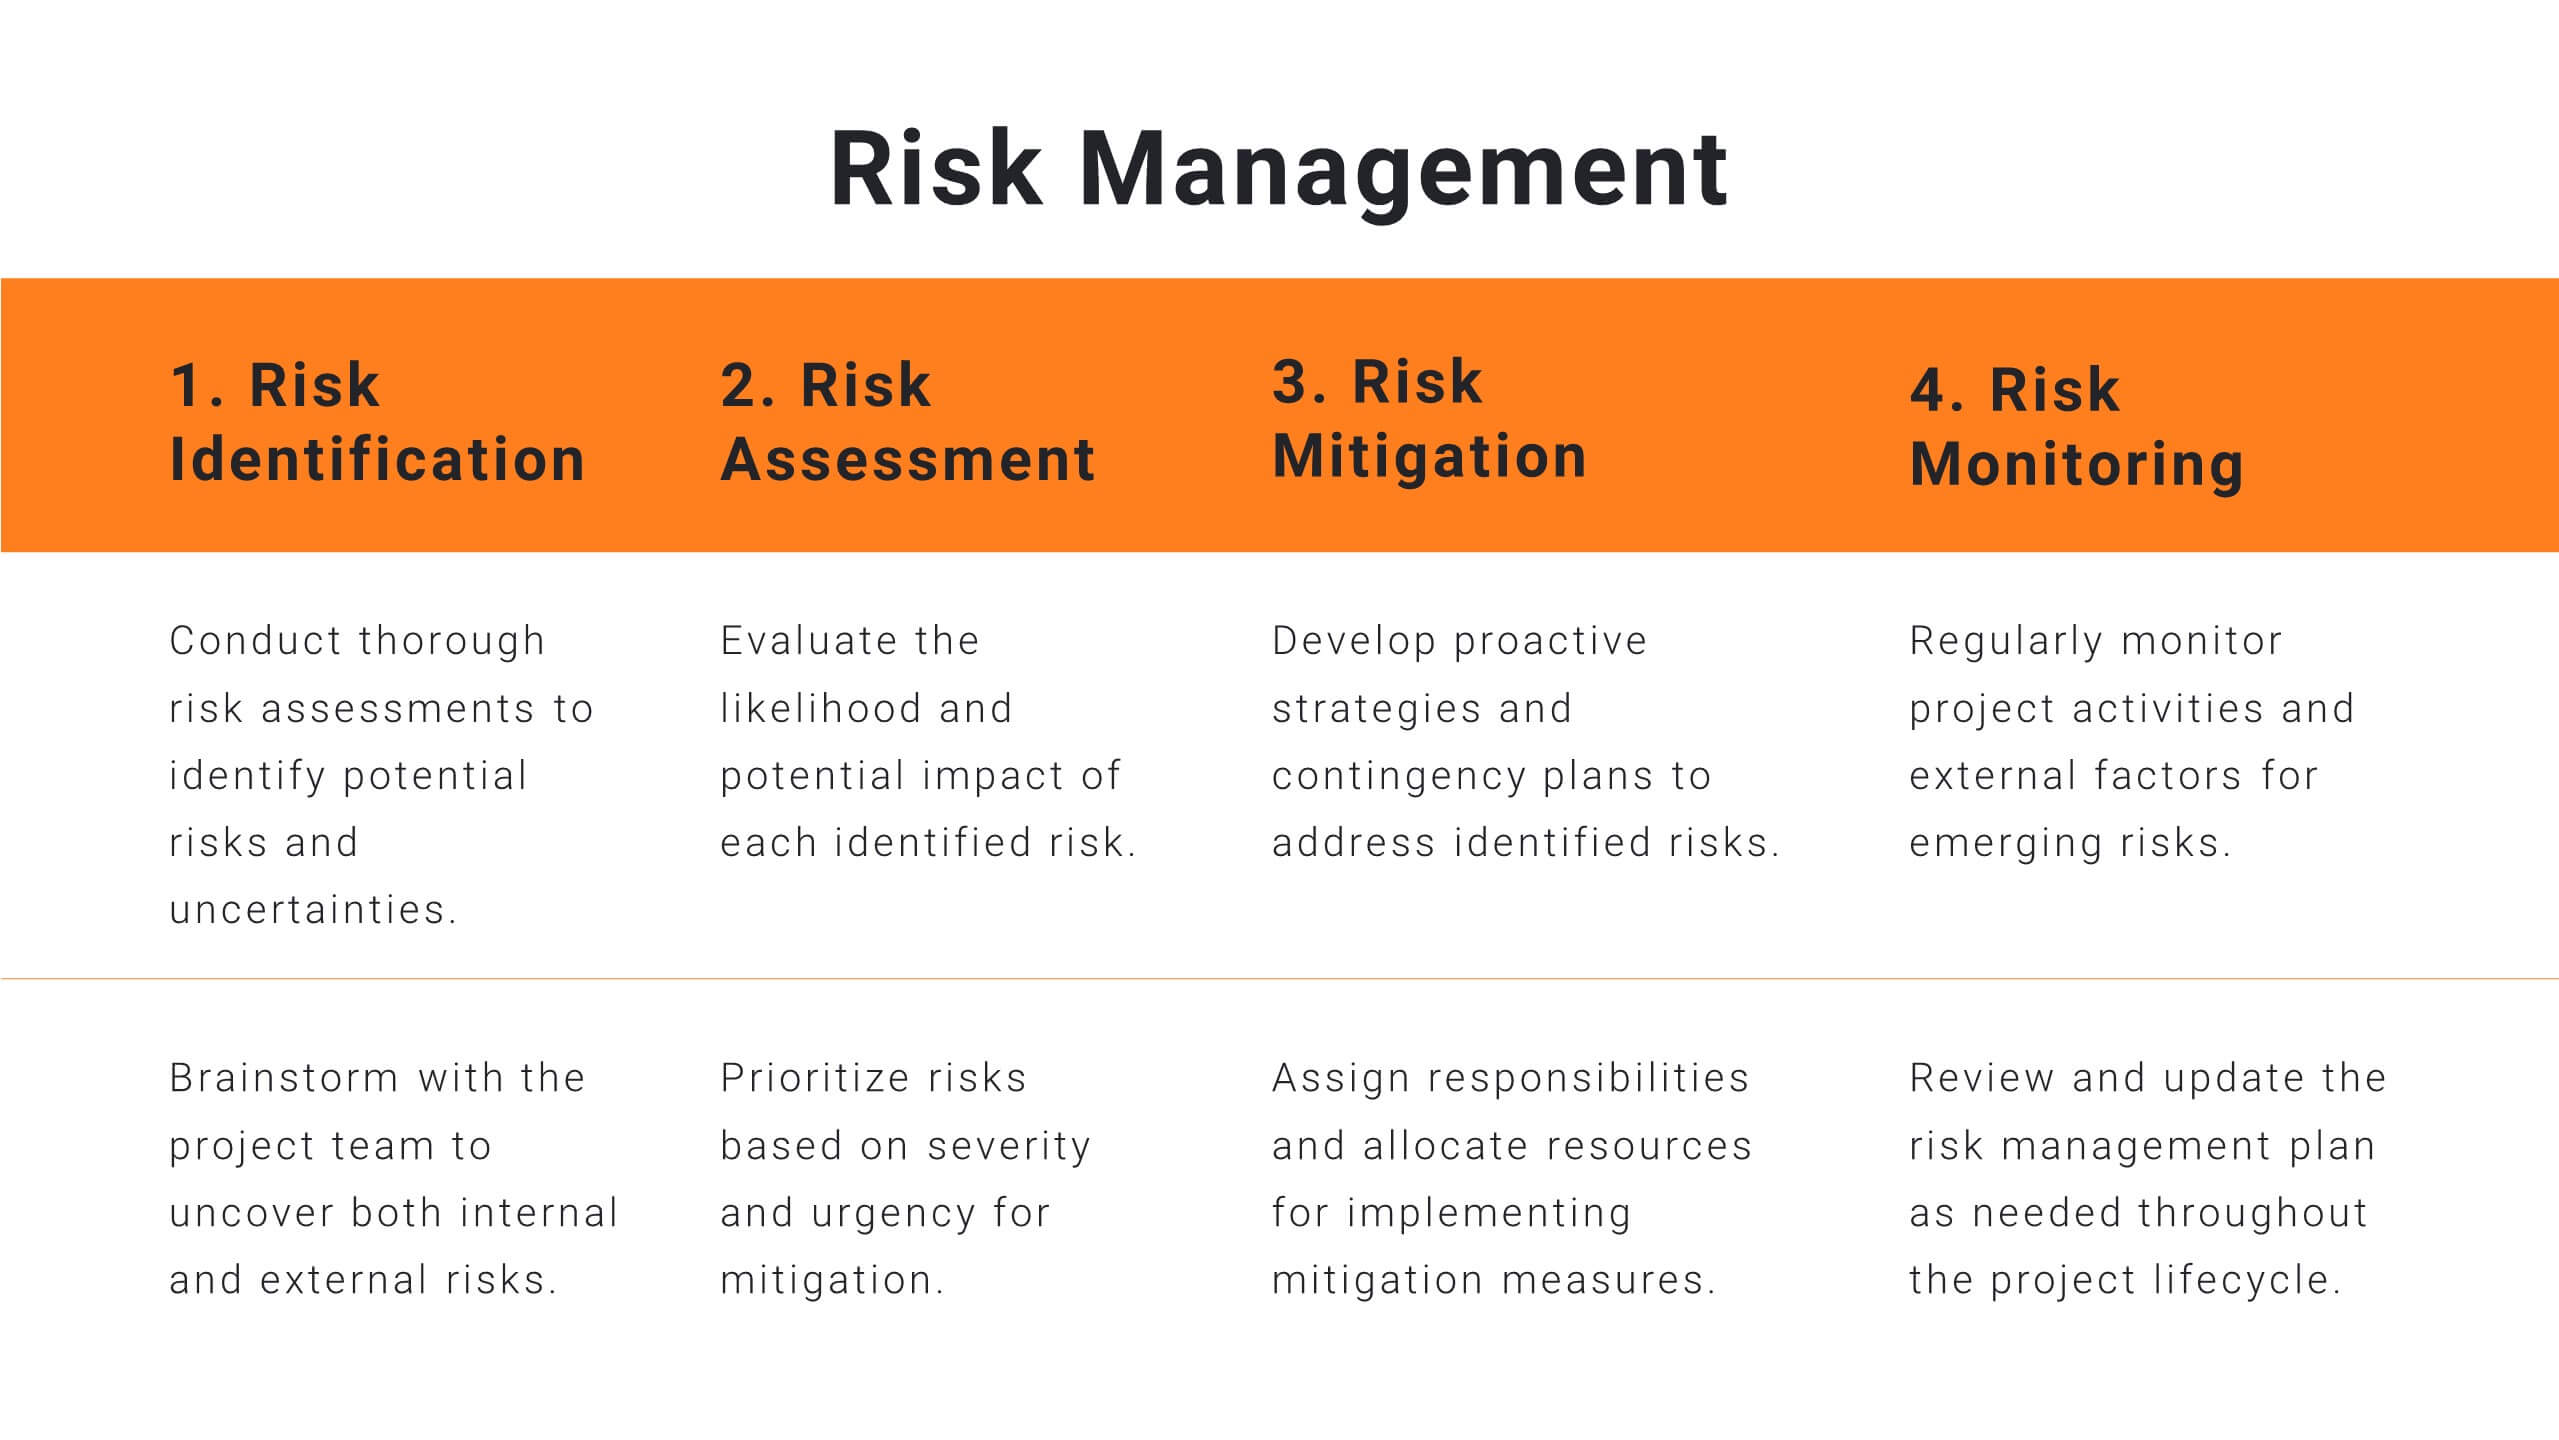
Harmony Project Management Plan Presentation
Plan your project efficiently with this comprehensive project management plan template! It covers all essential aspects including timeline, budget, resource allocation, and risk management. Ensure smooth project execution and achieve your objectives. Compatible with PowerPoint, Keynote, and Google Slides, it's designed to streamline your project planning and management process.


7 slides
Hierarchy Needs Infographic
The Hierarchy of Needs, is a framework that categorizes human needs into five levels, often depicted as a pyramid. This visually engaging infographic template lays out the psychological journey each individual undertakes, climbing the pyramid of needs towards a successful life. Compatible with Powerpoint, Keynote, and Google Slides. Utilize visual elements to guide your audience in understanding their unique journey through the hierarchy, highlighting the importance of each stage. This template will guide you through the layers of hierarchy within organizations, providing an understanding of leadership and organizational structure.


2 slides
Startup Company Illustrations
Ignite your startup spirit with our startup company illustrations pack! These are an exhilarating collection of visuals designed to infuse your presentations with the electrifying energy of new beginnings and innovation. Fully compatible with Powerpoint, Keynote, and Google Slides. Get ready to turbocharge your designs with the infectious excitement of startup culture. Infuse your designs with the boundless possibilities of the startup universe—download our startup company illustrations pack today!


8 slides
Economic Improvement in South America Map Presentation
Highlight regional performance with this South America economic growth map. Featuring 3D bar charts and country-specific markers, it’s ideal for visualizing financial progress, investments, or development trends. Fully editable in PowerPoint, Google Slides, and Keynote, this layout is perfect for reports, forecasts, and business reviews with a geographic focus.


6 slides
Digital Marketing Agency Infographic
Digital marketing refers to the use of digital channels, platforms, and technologies to promote products, services, or brands to a target audience. This infographic can help showcase the services your agency offers, your expertise, and the benefits of choosing your agency for digital marketing needs. This template is fully customizable and compatible with Powerpoint, Keynote, and Google Slides. Use icons, illustrations, and images to represent different digital marketing services and concepts. Create sections that detail the various digital marketing services your agency provides.


7 slides
Stakeholder Strategy Infographic
Empower your organization's approach to its stakeholders with our stakeholder strategy infographic. Colored in a mix of vibrant orange, crisp white, and bold red, this infographic not only informs but also captures attention. Ideal for business strategists, project managers, and team leaders, it visually dissects the intricate layers of stakeholder engagement and strategy. Its design includes specialized graphics, tailored icons, and strategic image placeholders to guide your storytelling. Whether you're presenting in PowerPoint, Keynote, or Google Slides, this template is your key to a well-orchestrated stakeholder communication.


5 slides
Education Jobs Infographics
Education Jobs encompass a wide range of roles and responsibilities focused on providing education, training, and support to learners of all ages. This template is designed to showcase the diverse range of careers available in the education sector. Use this template to inform and inspire individuals interested in pursuing a career in education, whether as teachers, administrators, counselors, researchers, or other specialized roles. With its visually engaging design and comprehensive information, this template will help your audience navigate the world of education jobs and make informed career decisions.


7 slides
Leadership Infographic Presentation Template
Leadership is a vital function of management. It helps to direct an organization's resources toward improved efficiency and the achievement of goals. While leadership can be defined in many ways, it is best explained as the ability to motivate and inspire others through example, providing them with direction and being a source of inspiration for those under your authority. This template is designed for you to build the key skills of leadership. Leadership is important for the success of any organization. This template will help you identify your leadership strengths and how to use them.


5 slides
Conference Agenda Slide Presentation
Keep your sessions structured and engaging with the Conference Agenda Slide Presentation. Designed with a visual screen-style format, it showcases a 4-part schedule using color-coded blocks for clarity. Perfect for corporate events, speaker lineups, or workshops. Fully editable in PowerPoint, Keynote, and Google Slides.


5 slides
Digital Marketing Agency Infographics
Elevate your agency's presentation game with our digital marketing agency infographics template. Designed in a vibrant palette of pink, white, and blue, this vertical infographic is a powerhouse tool tailored for marketing professionals, digital agencies, and consultants aiming to showcase their services, success stories, and unique strategies effectively. The template is a visual feast, featuring compelling graphics, diverse icons, and designated spaces for images that capture the essence of digital trends and marketing breakthroughs. Its intuitive design aids in breaking down complex information, ensuring your agency's innovative solutions are client-ready.


5 slides
Healthcare Industry Report
Deliver key medical insights with this modern, stethoscope-themed slide. Ideal for showcasing health metrics, clinical data, or medical updates, the layout includes four sections with health icons and clear callouts for easy readability. Fully customizable in PowerPoint, Keynote, and Google Slides.


5 slides
Organ Structure Breakdown Slide Presentation
Bring your anatomy data to life with this clear and engaging organ breakdown slide. Designed to visually map out key organ functions or statistics, this layout makes complex info feel simple. Whether you're teaching biology or sharing medical research, it's editable and works with PowerPoint, Keynote, and Google Slides.