


Features
- 5 Unique Slides
- Fully editable and easy to edit in Microsoft Powerpoint, Keynote and Google Slides
- 16:9 widescreen layout
- Clean and professional designs
- Export to JPG, PDF or send by email


Do you have any questions?
Recommend


5 slides
Editable World Map Infographic Presentation
Bring your global insights to life with this clean, modern presentation designed to explain international data in a clear, engaging way. Visual markers and simple layouts help you highlight key regions, trends, and comparisons with ease. Fully compatible with PowerPoint, Keynote, and Google Slides.


8 slides
Market Expansion Strategies in North America Map Presentation
Visualize your market growth plans with this strategic North America map slide. Highlight four regional expansion points with vibrant markers and customizable labels. Perfect for showcasing entry strategies, regional goals, or sales plans. Fully editable in PowerPoint, Keynote, and Google Slides—ideal for professional business and marketing presentations.


22 slides
Athena Creative Design Report Presentation
Showcase your creative projects with this vibrant design report template! Highlight objectives, concept development, prototypes, and design iterations with sleek visuals. Perfect for designers and creative teams. Compatible with PowerPoint, Keynote, and Google Slides.


6 slides
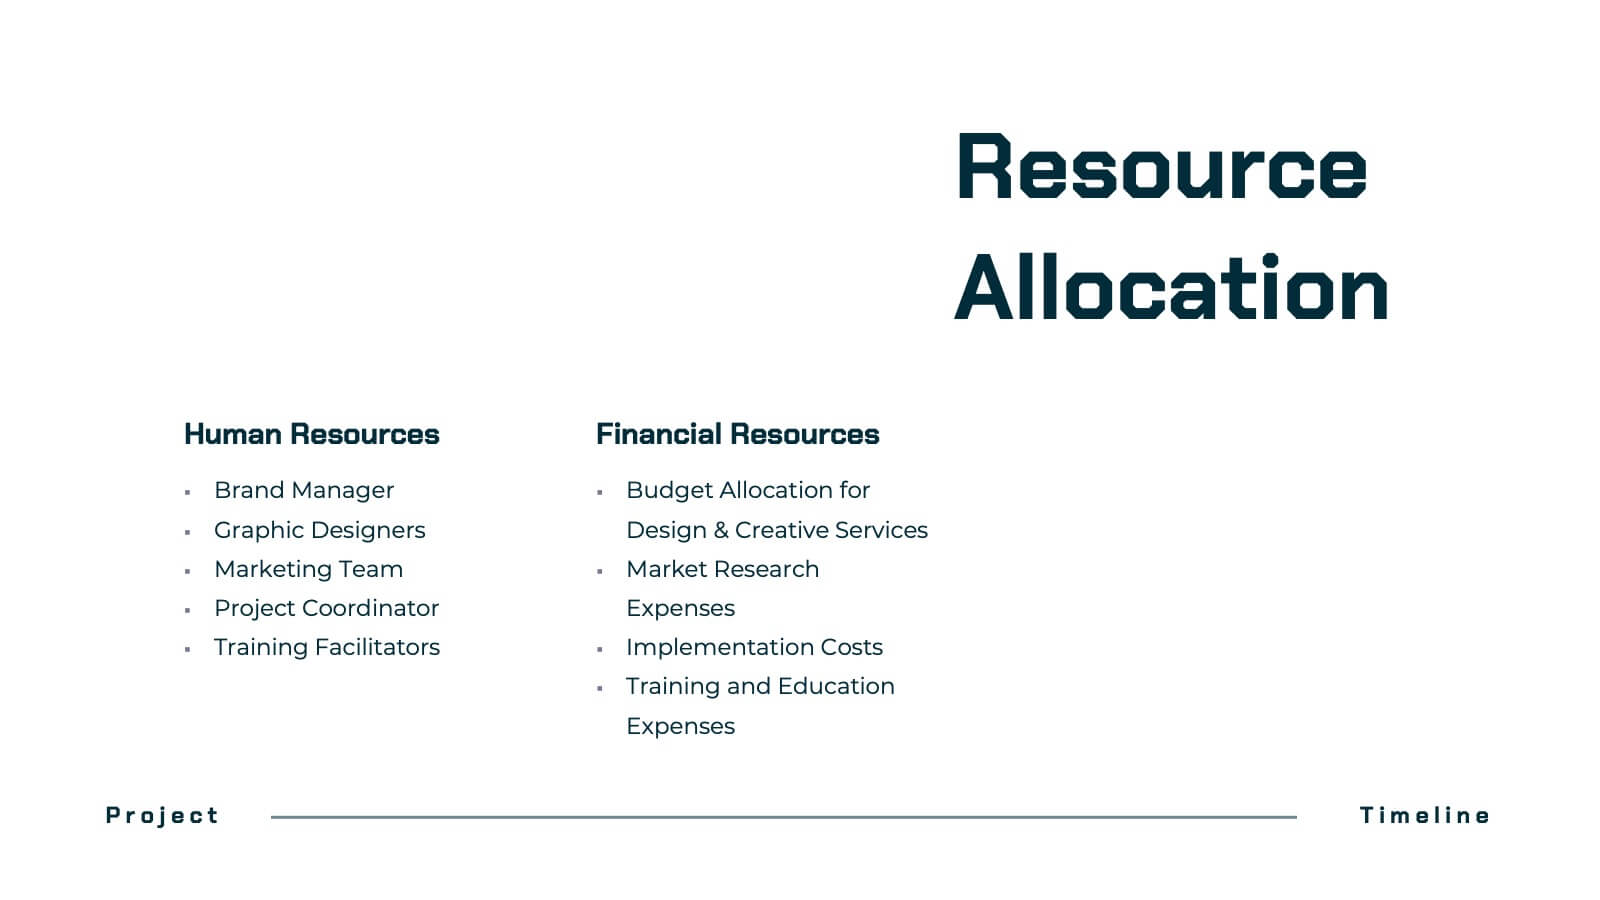
Project Timeline Infographic Presentation
Streamline your workflow with this Project Timeline Infographic template. Perfect for visualizing milestones, tracking progress, and organizing tasks, this design is fully editable to suit any project needs. Adjust colors, icons, and text effortlessly. Compatible with PowerPoint, Keynote, and Google Slides for smooth presentations and collaboration.


3 slides
Digital Course Planning and LMS Strategy Presentation
Design your online courses like a pro with this clean, easy-to-follow visual. Ideal for mapping course flow, LMS strategy, and learner journeys, this presentation template breaks down complex processes into digestible steps. Fully customizable and compatible with PowerPoint, Keynote, and Google Slides for flexible e-learning presentation creation.


5 slides
Project Task Management Presentation
Stay on top of your workflow with this visually organized project task management slide. It features a clear table layout with editable fields for subject, priority level, due date, task status, progress percentage, and last modified date. Ideal for teams managing multiple tasks and deadlines. Use color-coded status bars and icons to communicate task progress at a glance. Perfect for project managers and team leaders. Compatible with PowerPoint, Keynote, and Google Slides.


6 slides
Asia Market Map Infographic
Asia is the largest and most populous continent on Earth, covering a vast area that includes diverse landscapes, cultures, and countries. This map infographic displays the countries, capitals, major cities, rivers, mountain ranges, and other Asia geographical features. This template can be used for various purposes, such as market research presentations, business reports, and marketing materials. This template showcases the business and economic landscape in the Asian market. This provides valuable insights into the economic landscape of various Asian countries and help businesses make informed decisions for market expansion and opportunities in the region.


22 slides
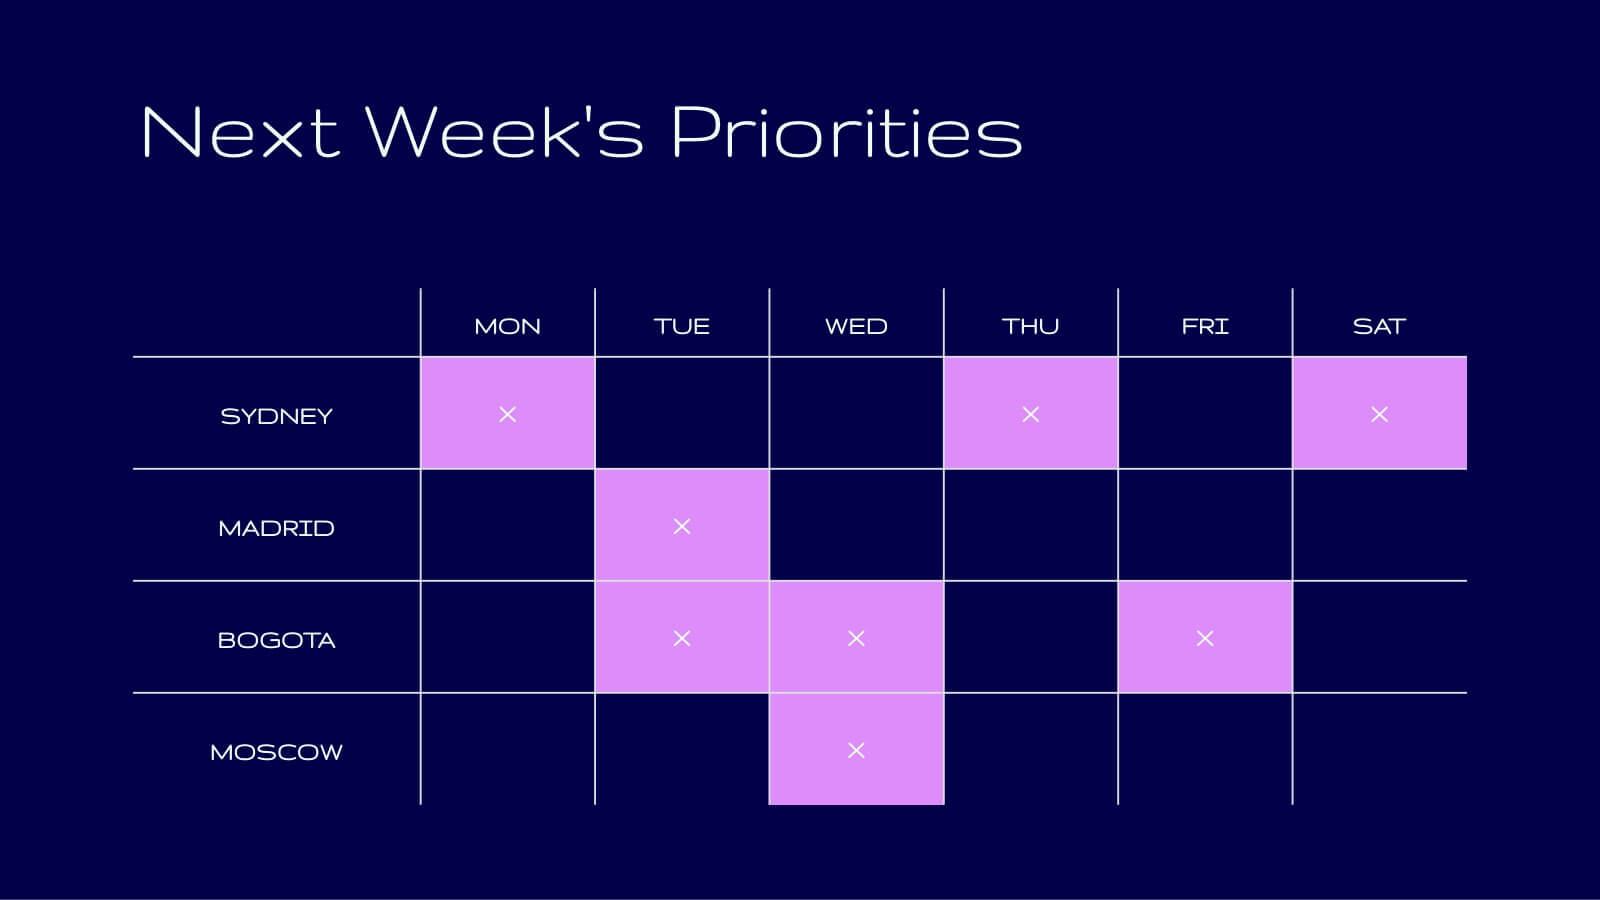
Tidal Research Findings Report Presentation
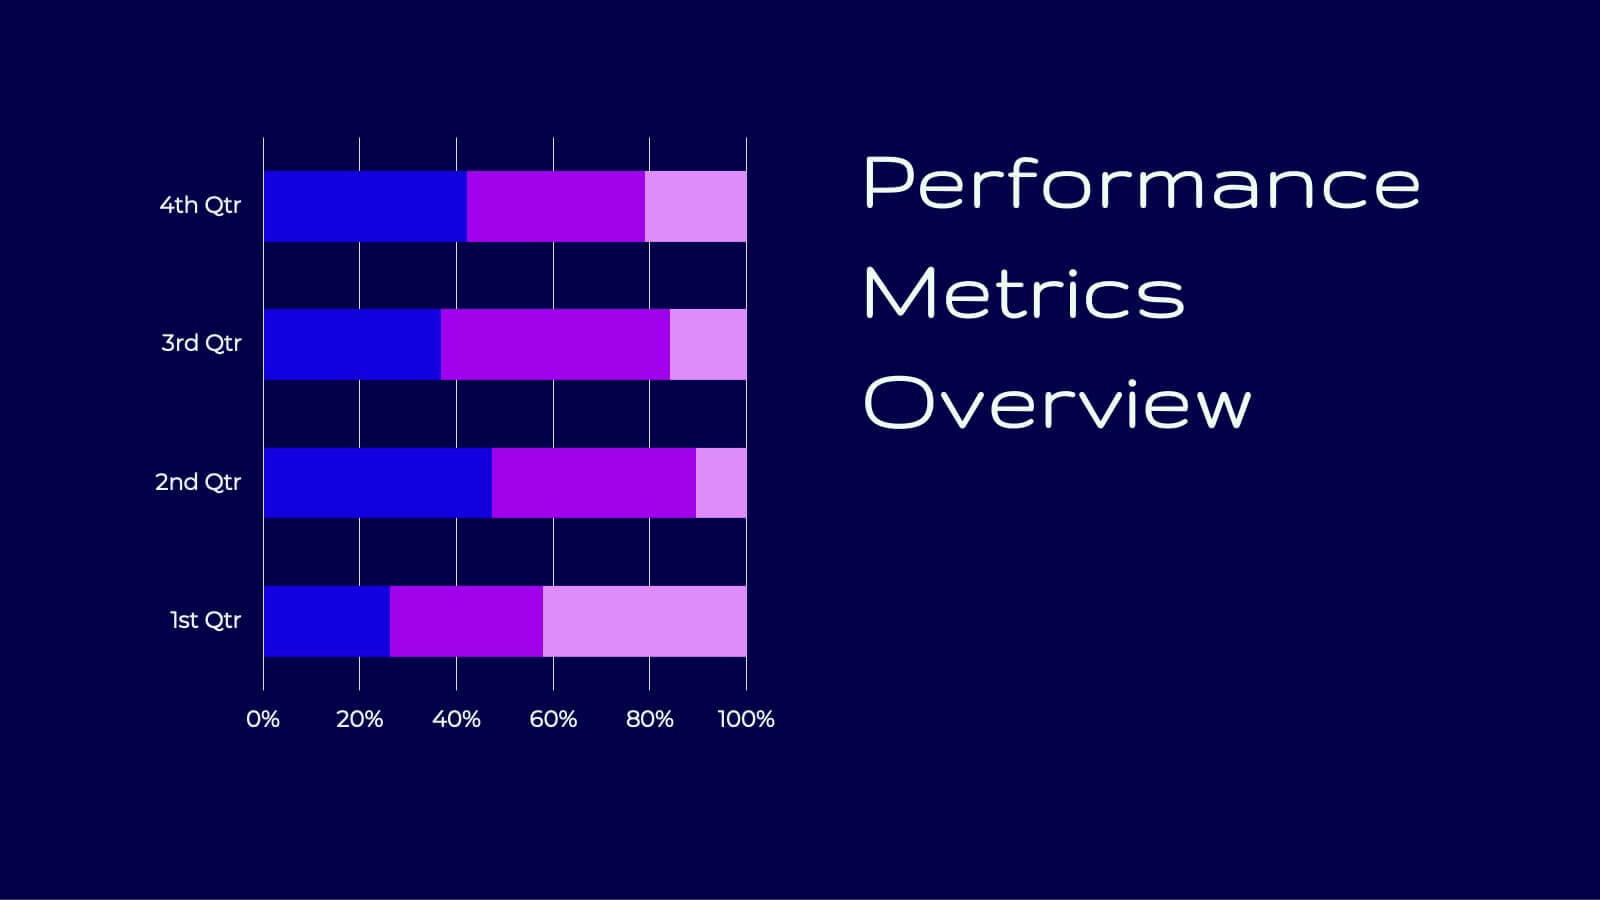
Deliver your research findings with impact using this sleek and modern report template! It covers key highlights, performance metrics, project progress, and competitor insights, making it ideal for clear, professional presentations. Perfect for summarizing challenges, solutions, and strategic initiatives. Compatible with PowerPoint, Keynote, and Google Slides for seamless reporting.


7 slides
Remote Work Guidelines and Setup Presentation
Bring clarity to your remote work setup with this sleek visual guide—designed to communicate processes, tools, and best practices in one easy-to-follow layout. Whether you're onboarding a team or streamlining operations, this slide helps break it all down step by step. Fully compatible with PowerPoint, Keynote, and Google Slides.


4 slides
Comparison Table Slide Presentation
Quickly highlight the differences between options with the Comparison Table Slide Presentation. This layout features a clean, structured table with checkmarks and Xs to visually compare features, services, or product tiers. Ideal for pricing plans, feature breakdowns, or side-by-side evaluations. Each column is color-coded for clarity and impact. Fully customizable in PowerPoint, Keynote, and Google Slides.


6 slides
Virtual Meeting Best Practices Presentation
Master your online meetings with this sleek, illustrated layout featuring a character graphic and clear content blocks. Designed to share virtual etiquette, tools, or steps for effective communication, it’s ideal for remote team briefings and onboarding. Fully editable and compatible with PowerPoint, Keynote, and Google Slides.


7 slides
Business Decision-Making Questions Presentation
Streamline your decision-making process with this engaging and structured presentation slide. Featuring a lightbulb and question mark design, this template effectively illustrates problem-solving and strategic choices in a professional and visually appealing way. Ideal for business strategy, consulting, and brainstorming sessions, it is fully editable, allowing you to customize text, colors, and layout to fit your needs. Compatible with PowerPoint, Keynote, and Google Slides for seamless use.


7 slides
Root Cause Protocol Infographic Presentation
A Root Cause Infographic is a visual tool that is used to analyze and identify the underlying causes of a problem or issue. This template is perfect to use for quality control, project management, or problem-solving processes to help organizations identify the root cause of an issue and develop effective solutions. This infographic includes a series of interconnected elements or components, with the central element representing the problem or issue being analyzed. This template includes text, icons, and other graphic elements to help illustrate the relationships between different components.


7 slides
Pyramid Scheme Infographic Presentation
A Pyramid Infographic is a great way to organize, highlight, and illustrate your ideas and content. This design uses visual hierarchy and colors to convey key information in an attractive way. The Pyramid incorporates colorful diagrams to allows your text to stand out while it is set against a white background. This is a simple, engaging design that can be easily edited. This is great for analyzing data and it is the perfect choice to impress the audience. It will surely help you convey your message in a much better way. It's a great way to communicate the key points of your Infographic.


20 slides
Dynastream Project Timeline Presentation
Stay on track with this detailed and well-organized project plan presentation designed for success! Covering essential areas like scope, objectives, timeline, budget breakdown, and risk management, it ensures every aspect of your project is clear and actionable. Perfect for team meetings or stakeholder updates, this template is fully compatible with PowerPoint, Keynote, and Google Slides.


4 slides
RACI Matrix Roles and Responsibilities Presentation
Bring clarity to complex workflows with a vibrant, easy-to-follow layout designed to map roles, responsibilities, and decision-making at a glance. This presentation helps teams understand who leads, supports, approves, and informs across key tasks, making collaboration smoother. Fully editable and ready to use in PowerPoint, Keynote, and Google Slides.


5 slides
Hierarchical Pyramid Chart Presentation
Bring structure to your ideas with a clean, layered visual that makes complexity feel easy to navigate. This presentation helps you explain levels, priorities, and organizational breakdowns with clarity and flow. Ideal for planning, strategy, and reporting. Fully compatible with PowerPoint, Keynote, and Google Slides.