


Features
- 4 Unique slides
- Fully editable and easy to edit in Microsoft Powerpoint, Keynote and Google Slides
- 16:9 widescreen layout
- Clean and professional designs
- Export to JPG, PDF or send by email


Do you have any questions?
Recommend


7 slides
Product Life Cycle Model Infographic
Navigate the evolution of any product with our vibrant product life cycle model infographic. Utilizing a vivid color palette of purple, blue, green, and pink, this design masterfully illustrates each phase of a product's journey, from inception to decline. Ideal for marketers, product managers, and business educators, this infographic serves as a visual guide to understand and optimize a product's life span. With its sleek design, it can effortlessly engage audiences in presentations and discussions. And with seamless compatibility across PowerPoint, Keynote, and Google Slides, presenting this dynamic process is both effortless and impactful.


26 slides
Maev Presentation Template
Maev is a perfect modern template with a clean and professional feel. Maev was designed by professionals to help businesses connect with their audience. This template has a modern, chic aesthetic and very detailed look which is extremely appealing. The colors are fresh which help keep the look clean and easy to read. The theme comes packed with features to target your audience and help you get your message across. Charts, timelines and easy to edit text, this template is perfect for businesses seeking to make an impression on their audience. by demonstrating they are transparent and reliable.


5 slides
The History of Beer Infographics
Beer has a long and fascinating history that dates back thousands of years, throughout its history beer has played a significant role in social, cultural, and economic contexts. These engaging infographics take viewers on a journey through the fascinating history of beer. It provides a comprehensive overview of the origins, evolution, and cultural significance of beer throughout different eras and regions. This visual resource is perfect for beer enthusiasts, historians, and anyone interested in the cultural and historical aspects of this beloved beverage. Compatible with Powerpoint, Keynote, and Google Slides.


4 slides
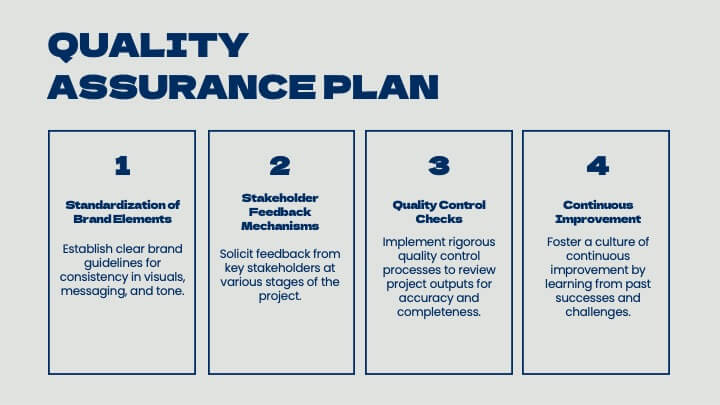
Risk and Reality Iceberg Diagram Presentation
Reveal underlying threats with this Risk and Reality Iceberg Diagram presentation. Ideal for risk analysis, strategic planning, or operations mapping, this slide visualizes visible vs. hidden challenges in a business or project. Fully editable in Canva, PowerPoint, and Google Slides—perfect for impactful and professional presentations.


21 slides
Techne Strategic Planning Report Presentation
Streamline your strategic planning process with this meticulously crafted presentation template, designed for professionals seeking clarity and structure. Featuring slides dedicated to market trends, SWOT analysis, target audience profiling, and competitive insights, this template ensures your strategy is well-rounded and impactful. The clean and modern design accommodates sections for defining objectives, key challenges, and resource allocation, allowing your team to focus on actionable solutions. Performance metrics and risk management slides help you track progress and address uncertainties effectively. Whether presenting to stakeholders or internal teams, this tool simplifies complex data into easily digestible visuals. Fully editable and compatible with PowerPoint, Google Slides, and Keynote, this template provides the flexibility to adapt to various needs. Perfect for organizations aiming to communicate strategic initiatives and actionable plans with precision and professionalism. Take your strategic planning reports to the next level with this essential template.


4 slides
Wheel of Progress Planning Tool Presentation
Visualize goals, track development stages, or outline key initiatives with the Wheel of Progress Planning Tool Presentation. This dynamic circular design divides progress into four customizable quadrants (A–D), perfect for strategic planning, KPI tracking, or team milestone updates. Each segment features editable labels and supporting descriptions. Ideal for PowerPoint, Keynote, and Google Slides.


21 slides
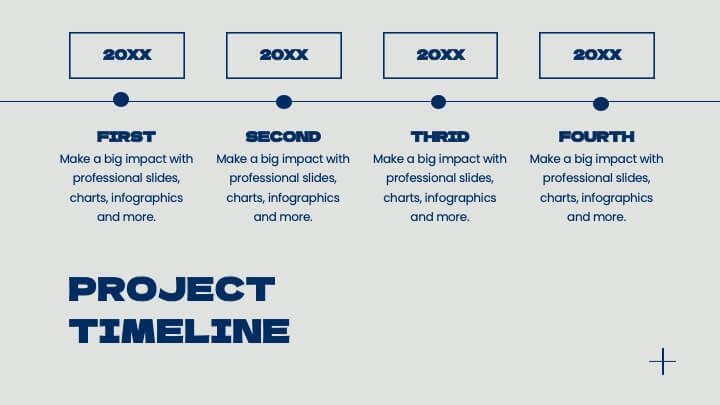
Minoan Project Timeline Presentation
Step back in time with this beautifully crafted Minoan-inspired presentation, perfect for outlining your project timeline! With an elegant design and clear structure, this template helps you showcase key milestones, deadlines, and deliverables in a visually stunning way. Keep your project on track. Compatible with PowerPoint, Keynote, and Google Slides.


6 slides
Strategic Business Case Study
Present detailed business case analyses with this layered castle-style layout, ideal for step-by-step storytelling. Each section visually represents a different stage or insight, helping you build a clear and convincing narrative. Fully editable and compatible with PowerPoint, Keynote, and Google Slides.


4 slides
Sports Metrics and Training Goals Presentation
Track, analyze, and present athletic performance with the Sports Metrics and Training Goals template. Featuring bar charts and a sports court graphic, this design is ideal for visualizing statistics, strategies, and progress. Fully customizable in Canva, PowerPoint, and Google Slides to align with your team’s branding and performance objectives.


4 slides
Personal and Business Insurance Plans
Clearly present your insurance tiers with this easy-to-read comparison layout. Ideal for showcasing plan options for individuals, families, and businesses, this template highlights pricing, benefits, and coverage icons side-by-side. Clean and professional, it’s fully editable in PowerPoint, Keynote, and Google Slides.


3 slides
Market Size and Scaling Insights Presentation
Understand your market potential with the Market Size and Scaling Insights Diagram. This visually engaging template helps you analyze market segments, growth trends, and scaling opportunities with clarity. Ideal for business strategists, analysts, and investors, this slide ensures a concise and professional presentation of key market data. Fully customizable and compatible with PowerPoint, Keynote, and Google Slides.


10 slides
Customer Survey Feedback Insights Presentation
Highlight key takeaways from your reviews with the Customer Survey Feedback Insights Presentation. This sleek layout uses a vertical timeline with icons and star ratings to present customer input clearly and professionally. Ideal for showcasing survey results, testimonials, or product improvement insights. Fully editable in Canva, PowerPoint, Google Slides, and Keynote.


4 slides
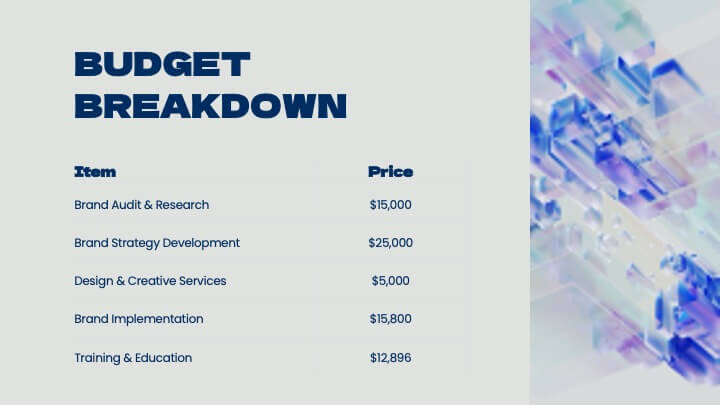
Financial Table Layout Presentation
Bring your numbers to life with a clear, colorful layout that makes financial details easy to compare at a glance. This presentation helps you organize pricing tiers, budget insights, or account summaries with clean structure and smooth readability. Fully compatible with PowerPoint, Keynote, and Google Slides.


26 slides
Jewelry Elegant Company Profile Presentation
Immerse yourself in the dazzling world of jewelry, where gems and craftsmanship create timeless elegance. Our template, exuding luxury in shades of brown and orange, embodies the modern elegance and aesthetic charm of fine jewelry. Enhanced with chic graphics, bespoke icons, and evocative image placeholders, it mirrors the allure of precious metals and stones. Seamlessly adapted for Powerpoint, Keynote, or Google Slides. A shimmering choice for jewelry brands, boutique owners, designers, or anyone seeking to showcase the sparkle and artistry of jewelry. Illuminate your brand; let each jewel tell its story.


22 slides
Stormlight Qualitative Research Findings Presentation
This Qualitative Research Presentation Template is a dynamic and structured solution designed to present in-depth research findings, methodologies, and analysis. It covers key sections such as data collection, results interpretation, implications, and recommendations to deliver a comprehensive research overview. Perfect for academic, business, or market research purposes, and fully compatible with PowerPoint, Keynote, and Google Slides for easy customization.


5 slides
Live Sports Infographics
Immerse in the dynamic realm of athletics with our live sports infographics. Crafted in a medley of energetic blue, spirited yellow, and various vivid hues, this template radiates the inherent in the world of sports. Its creative and vertical layout, optimized for impact, is perfect for sports journalists. Compatible with Powerpoint, Keynote, and Google Slides. The compelling graphics, icons, and dedicated image placeholders are specifically tailored to encapsulate the pulse-pounding moments and diverse statistics of live sports events. This visually striking, data-centric tool is indispensable for those seeking to convey complex sports information.


5 slides
Circular Wheel for Process Flow Presentation
Visualize your workflow with clarity using this 5-step circular process diagram. Perfect for illustrating continuous improvement, feedback loops, or operational stages. Each segment is color-coded and numbered for easy navigation and understanding. Fully editable in PowerPoint, Keynote, and Google Slides—customize icons, colors, and text to suit your message.