


Features
- 10 Unique slides
- Fully editable and easy to edit in Microsoft Powerpoint, Keynote and Google Slides
- 16:9 widescreen layout
- Clean and professional designs
- Export to JPG, PDF or send by email


Do you have any questions?
Recommend


7 slides
Geometric Series Infographic
Geometric series have various applications in mathematics, physics, engineering, economics, and other fields. Get ready for a joyful expedition into the world of numbers, shapes, and patterns with our geometric series infographic. This template is a celebration of mathematical elegance, presented with a burst of enthusiasm to make learning a delightful adventure. This is fully customizable and compatible with Powerpoint, Keynote, and Google Slides. This allows you to paint a vivid picture by relating geometric series to real-life scenarios. Showcase how these mathematical visuals resonates in unexpected places.


7 slides
Social Media Engagement Infographic
Social media is the most influential tool in today's world. This infographic template is a great way to share the benefits of your services in an easy-to-read format that's sure to get your audience excited about what you have to offer. Whether you're looking to promote a new product line or simply want to provide information to your customers so they can make informed decisions, this infographic will be perfect for your needs. This infographic will help you understand how to use social media to engage with your audience and drive traffic to your site. Fully customizable and compatible with Powerpoint, Keynote, and Google Slides.


4 slides
Digital Payment and Card Services Presentation
Step into the world of contactless commerce with this clean, modern slide design. It’s built to help you present how digital payment systems and card-based services are transforming transactions in today’s economy. Perfect for fintech updates, product walkthroughs, or training decks. Fully compatible with PowerPoint, Keynote, and Google Slides.


20 slides
Solstice Product Launch Presentation
Introducing our product launch template! Highlight your product’s features, target audience, and unique selling proposition with a sleek, modern design. Showcase marketing strategies, distribution channels, and competitive landscape effortlessly. Ideal for sales teams and marketers. Compatible with PowerPoint, Keynote, and Google Slides.


9 slides
Statistics Dashboard Infographic
Dive into data with this comprehensive Statistics Dashboard Infographic, perfectly tailored for analysts, marketers, and business professionals. This dashboard provides a clear, visual representation of various statistical data through an assortment of charts, graphs, and metrics. The template features multiple panels, each dedicated to different aspects such as sales performance, customer behavior, financial health, and marketing results. Its design combines vibrant colors with a clean layout to highlight key information, making it easy to compare figures and track trends. Whether you need to present quarterly results, monitor project progress, or analyze marketing effectiveness, this infographic is an invaluable tool. It simplifies complex data into manageable visualizations, helping you convey critical insights effectively and make informed decisions based on solid statistical analysis.


23 slides
Nightspire Strategic Planning Report Presentation
Streamline your strategic planning process with this professionally designed presentation template. Covering key areas such as market analysis, SWOT assessment, milestones, and resource allocation, this template is ideal for businesses and project teams. Fully editable and compatible with PowerPoint, Keynote, and Google Slides.


26 slides
Real Estate Company Profile Presentation
Step into the world of real estate, where every brick tells a story and every home harbors a dream. Our warm and bold template, draped in varying shades of brown, encapsulates the essence of properties, from cozy homes to towering skyscrapers. Boasting tailored graphics, detailed icons, and versatile image placeholders, it's more than just a visual aid; it's an experience. Seamless compatibility ensures it's ready for Powerpoint, Keynote, or Google Slides. An invaluable asset for realtors, property managers, housing agencies, or anyone looking to make an impact in the real estate market. Present with confidence; let every property shine.


8 slides
Modern Pricing Table Design Presentation
Turn heads and highlight value with this sleek, modern layout that makes pricing clear and compelling. Perfect for showcasing service tiers or subscription plans, this clean design uses bold icons and structured comparisons to guide decisions. Fully compatible with PowerPoint, Keynote, and Google Slides for easy customization and professional pricing presentations.


8 slides
Checklist and Action Item List
Bring order to your tasks with this modern checklist design, ideal for highlighting project milestones, team assignments, or key deliverables. Featuring three editable points with accompanying icons, this layout ensures clarity and professionalism in every update. Fully customizable in PowerPoint, Keynote, and Google Slides.


24 slides
Brand Overview Presentation
Enhance your brand storytelling with our Brand Presentation template. Perfect for showcasing brand vision, values, and strategies, this template includes diverse slides for audience targeting and brand touchpoints. Suitable for all professional settings, it's compatible with PowerPoint, Keynote, and Google Slides.


7 slides
Flow Chart Diagram Presentation
Flow charts are important because they provide a visual representation of a process or system, which helps to simplify complex information and make it easier to understand. Our Infographic flow charts are easy to use because they combine visual elements such as icons, and colors with concise text, making complex information more digestible and memorable. These highly adaptable flow charts are ideal due to their complete customizability, allowing for universal utilization to cater to the unique requirements of any individual. Do not waste any more precious time and get started right away.


5 slides
History of Photography Infographics
The History of Photography traces back to the early 19th century when the concept of capturing and preserving images through a camera was first realized. These infographic templates provide a visually stunning format to showcase the key milestones, influential photographers, and technological advancements that shaped the history of photography. The template consists of vertical infographics, making it easy to present information in a visually appealing and organized manner. It is compatible with Powerpoint, Keynote, and Google Slides, ensuring seamless customization and adaptability to your specific needs.


5 slides
Product Marketing Slide Presentation
Spark interest instantly with a bold, circular layout that transforms product insights into a clean, memorable story. This presentation helps you explain features, audience needs, and value propositions in an organized, visual flow that keeps attention on what matters most. Fully customizable for PowerPoint, Keynote, and Google Slides.


6 slides
Construction Project Timeline and Stages Presentation
Map out your project from groundbreaking to completion with the Construction Project Timeline and Stages Presentation. This visual timeline uses illustrated trucks to represent key construction phases—ideal for progress reports, planning reviews, or contractor briefings. Fully editable in PowerPoint, Keynote, and Google Slides.


7 slides
Supply Chain Stock Infographic Presentation
A Supply Chain Infographic is a visual representation of information related to the flow of goods and services from suppliers to customers. This template is perfect for businesses and organizations involved in supply chain management, logistics, and procurement who want to communicate complex information in a clear way. This infographic can help engage stakeholders, promote understanding of supply chain-related issues, and drive positive change in the industry. Compatible with Powerpoint, Keynote, and Google Slides this template can be easily edited with different colors, fonts, and text.


20 slides
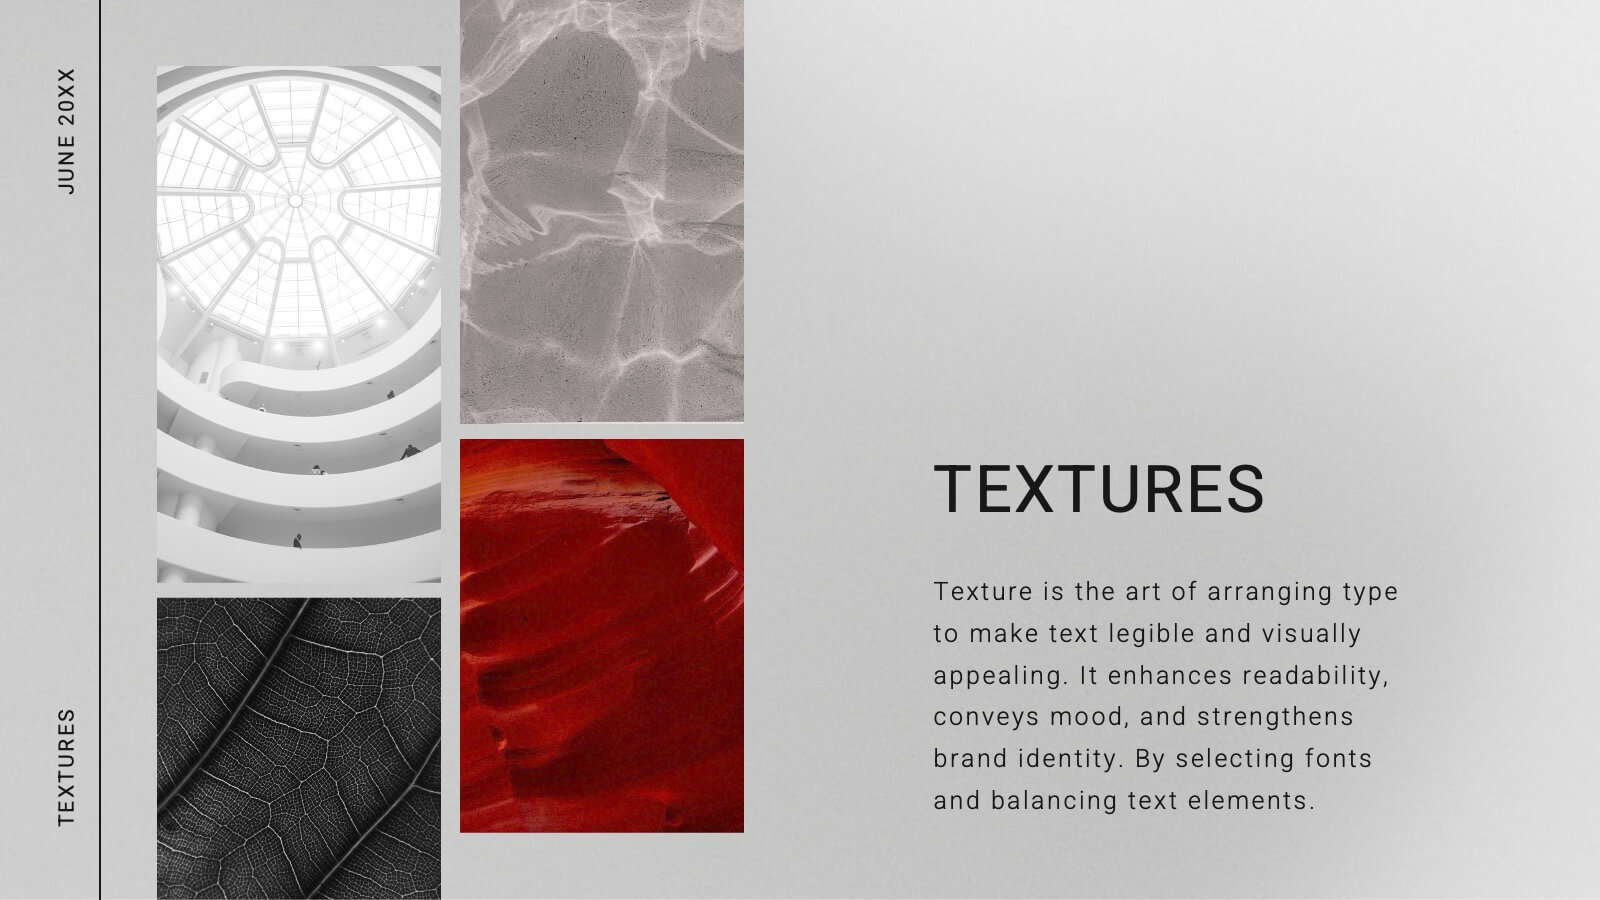
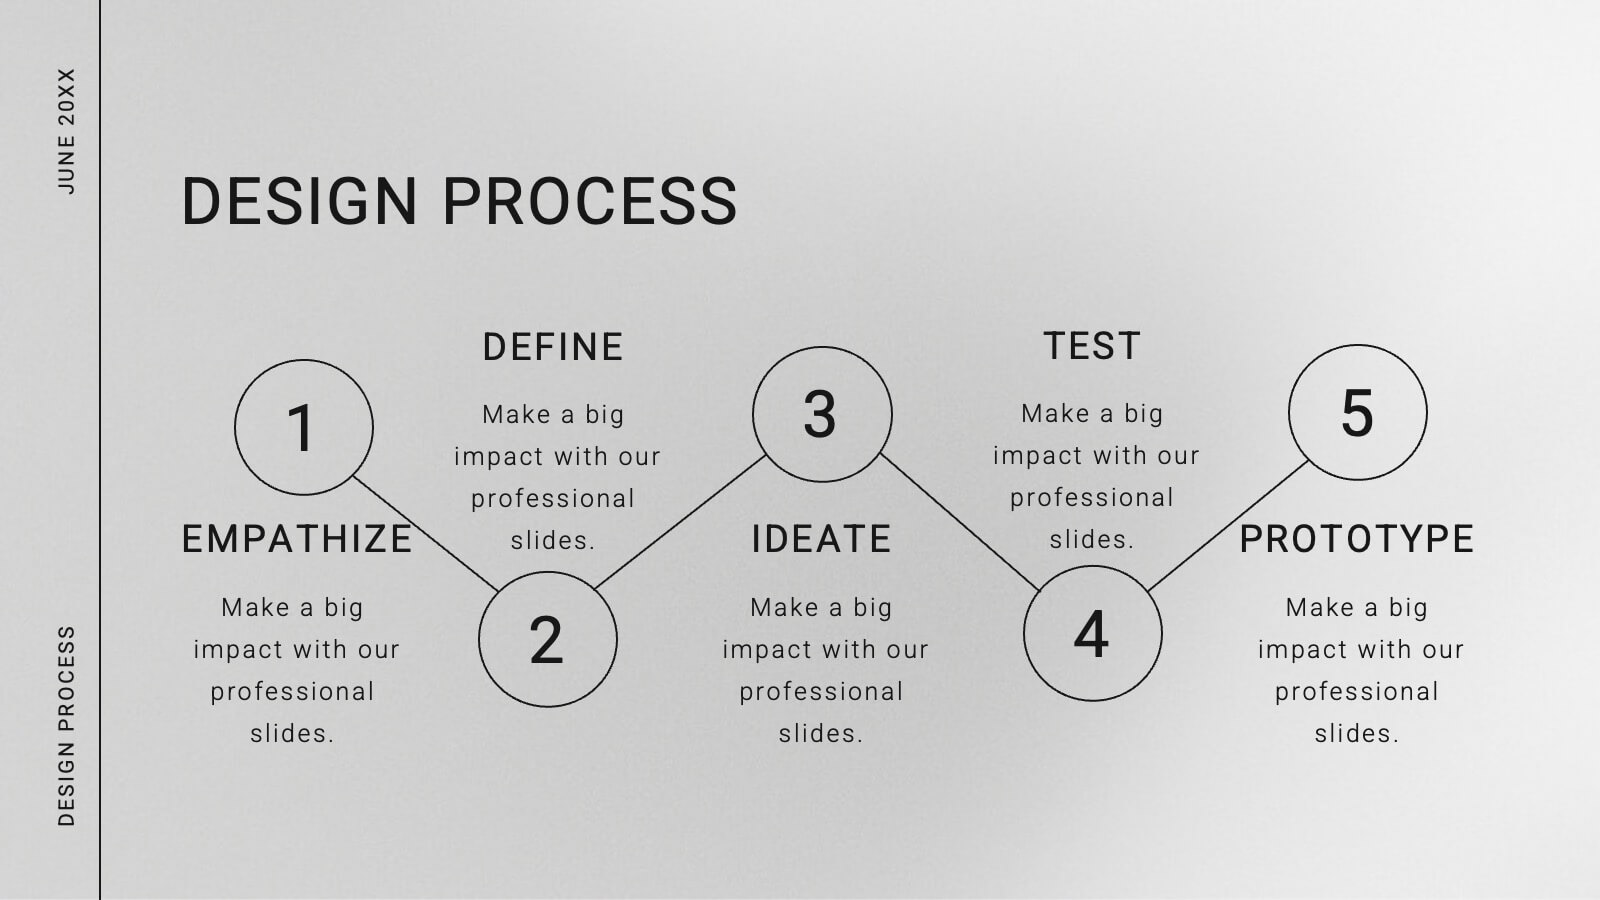
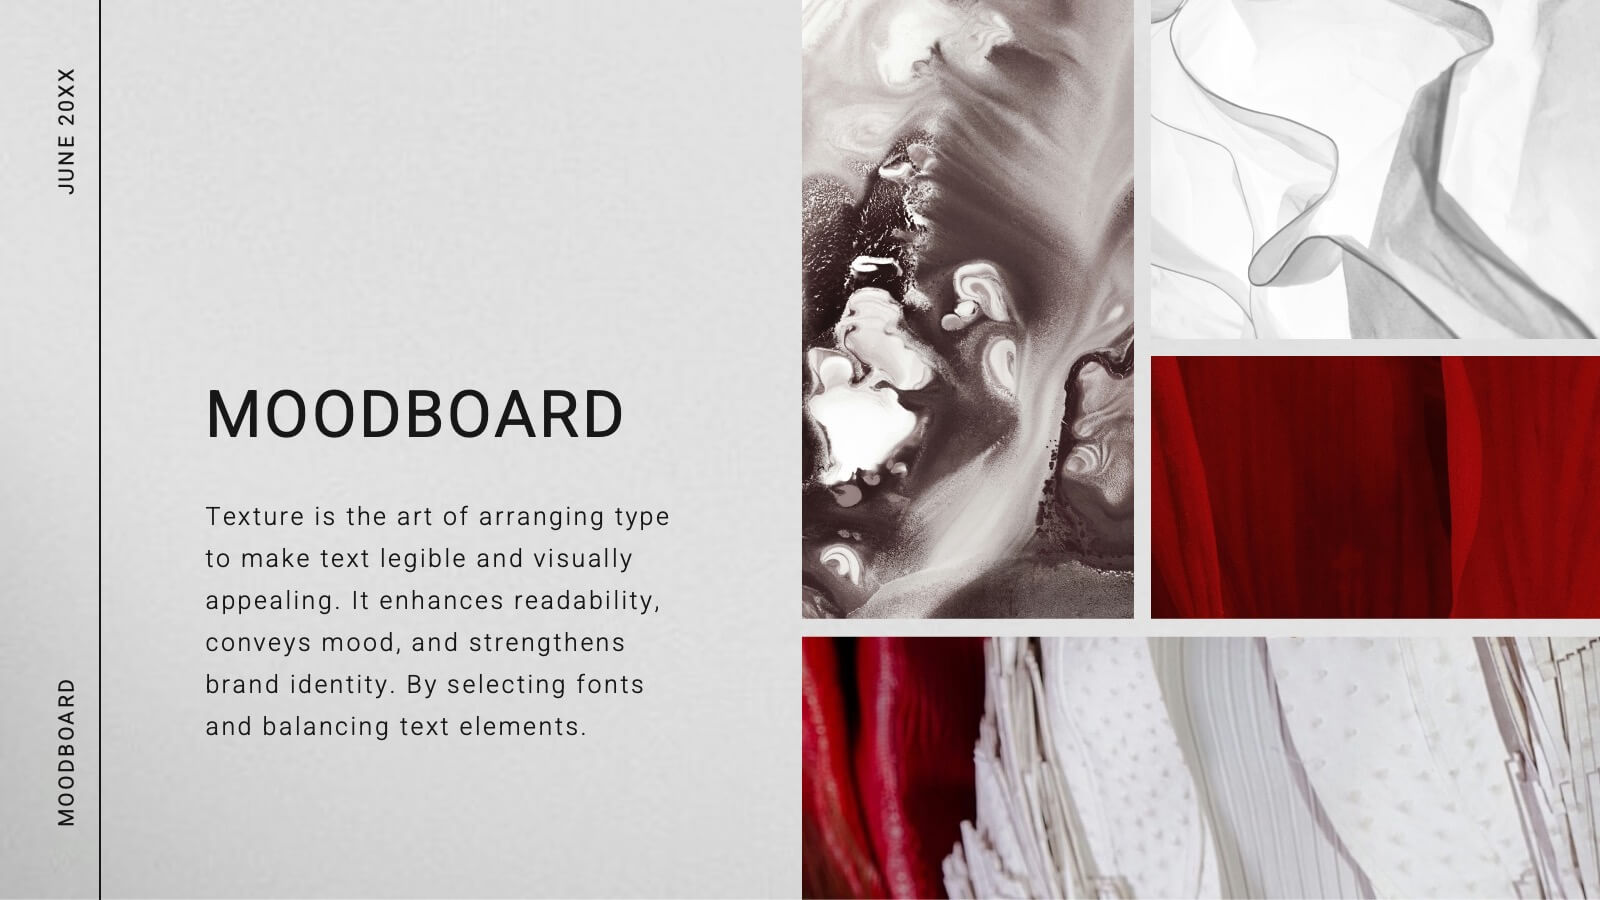
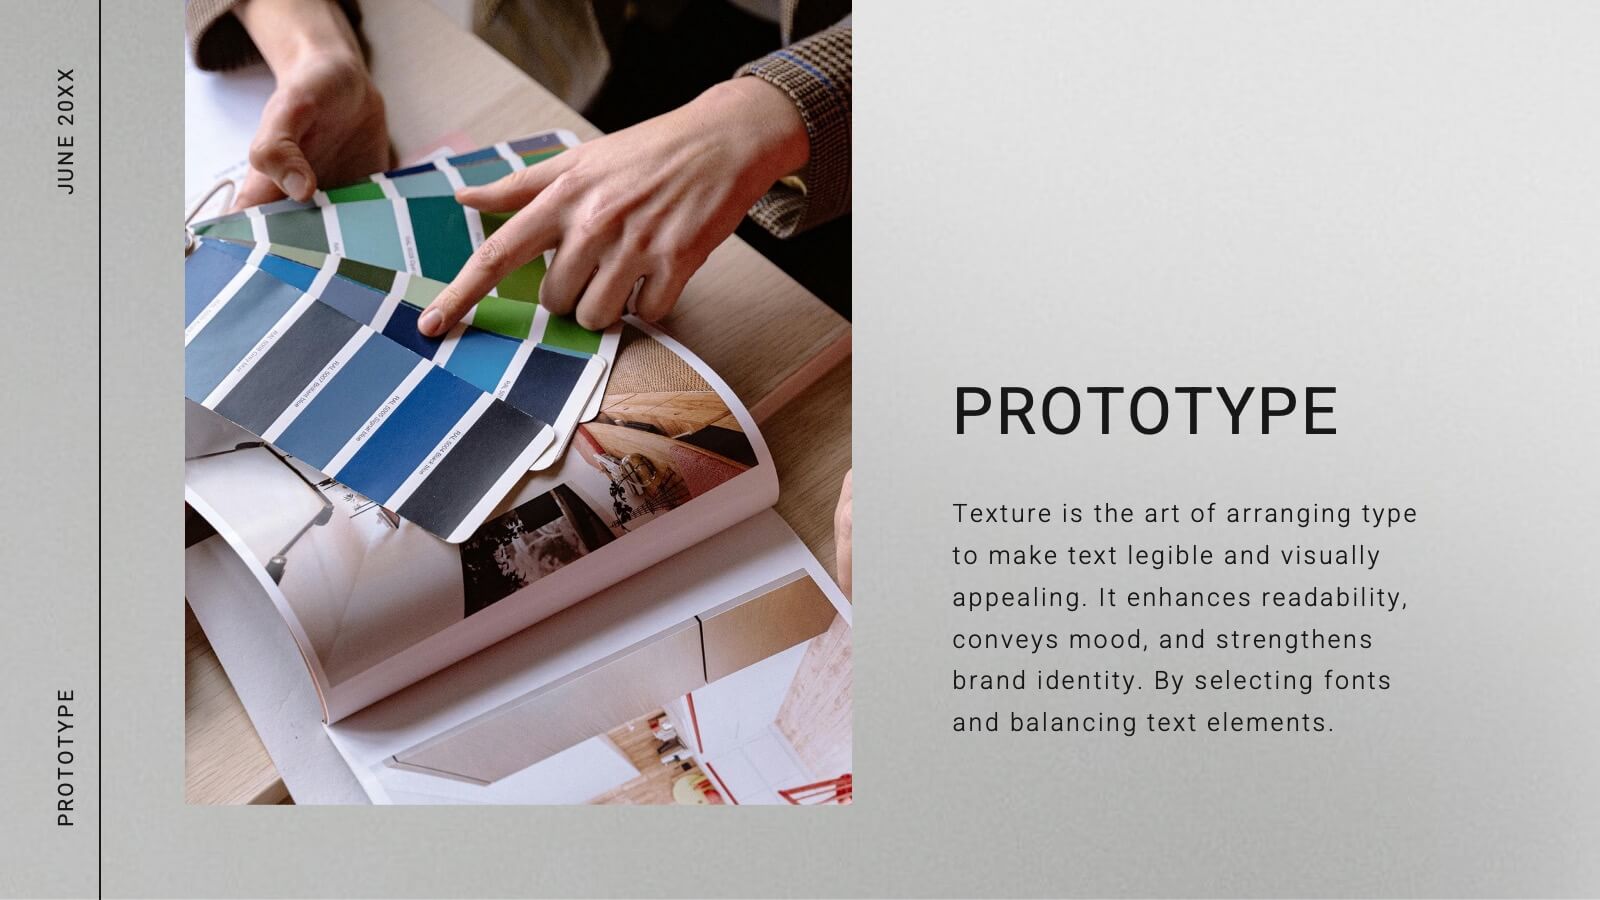
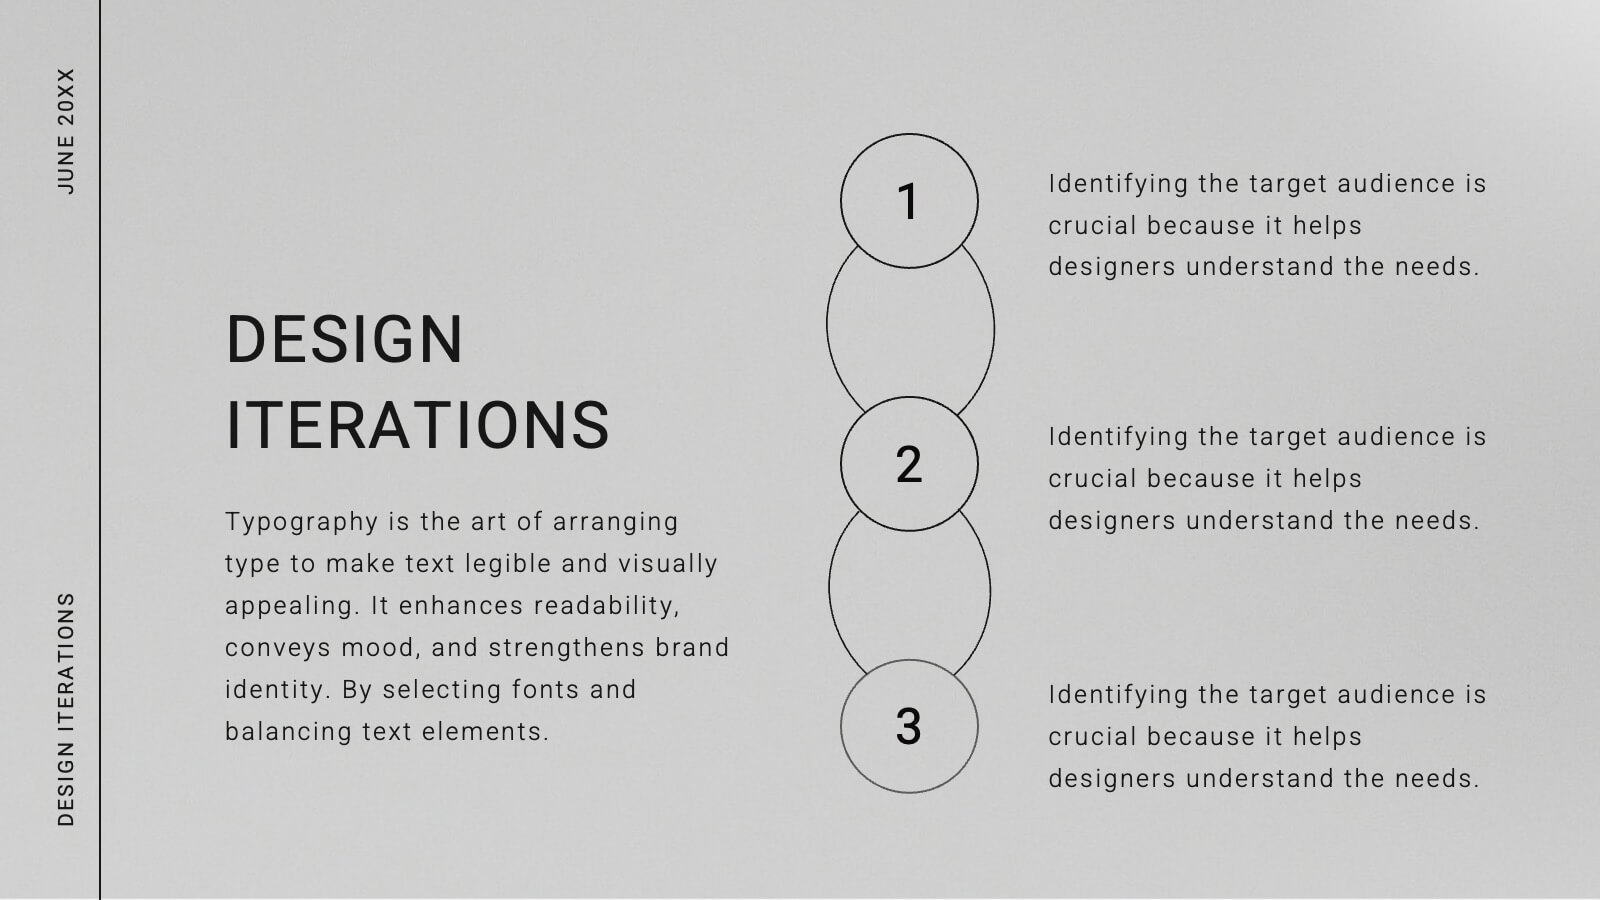
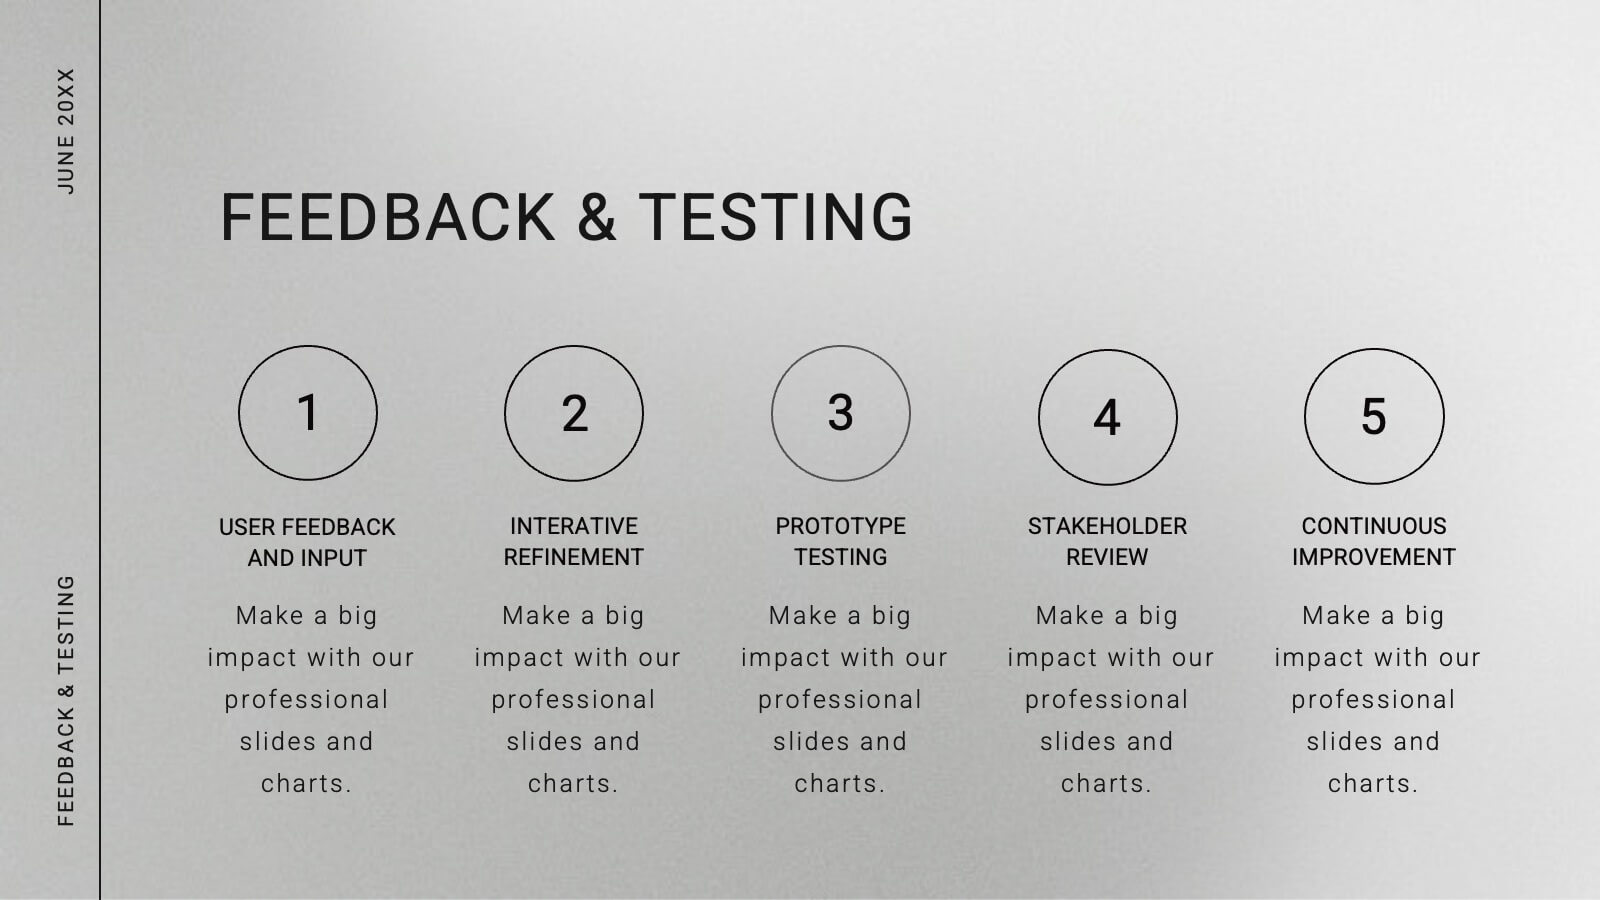
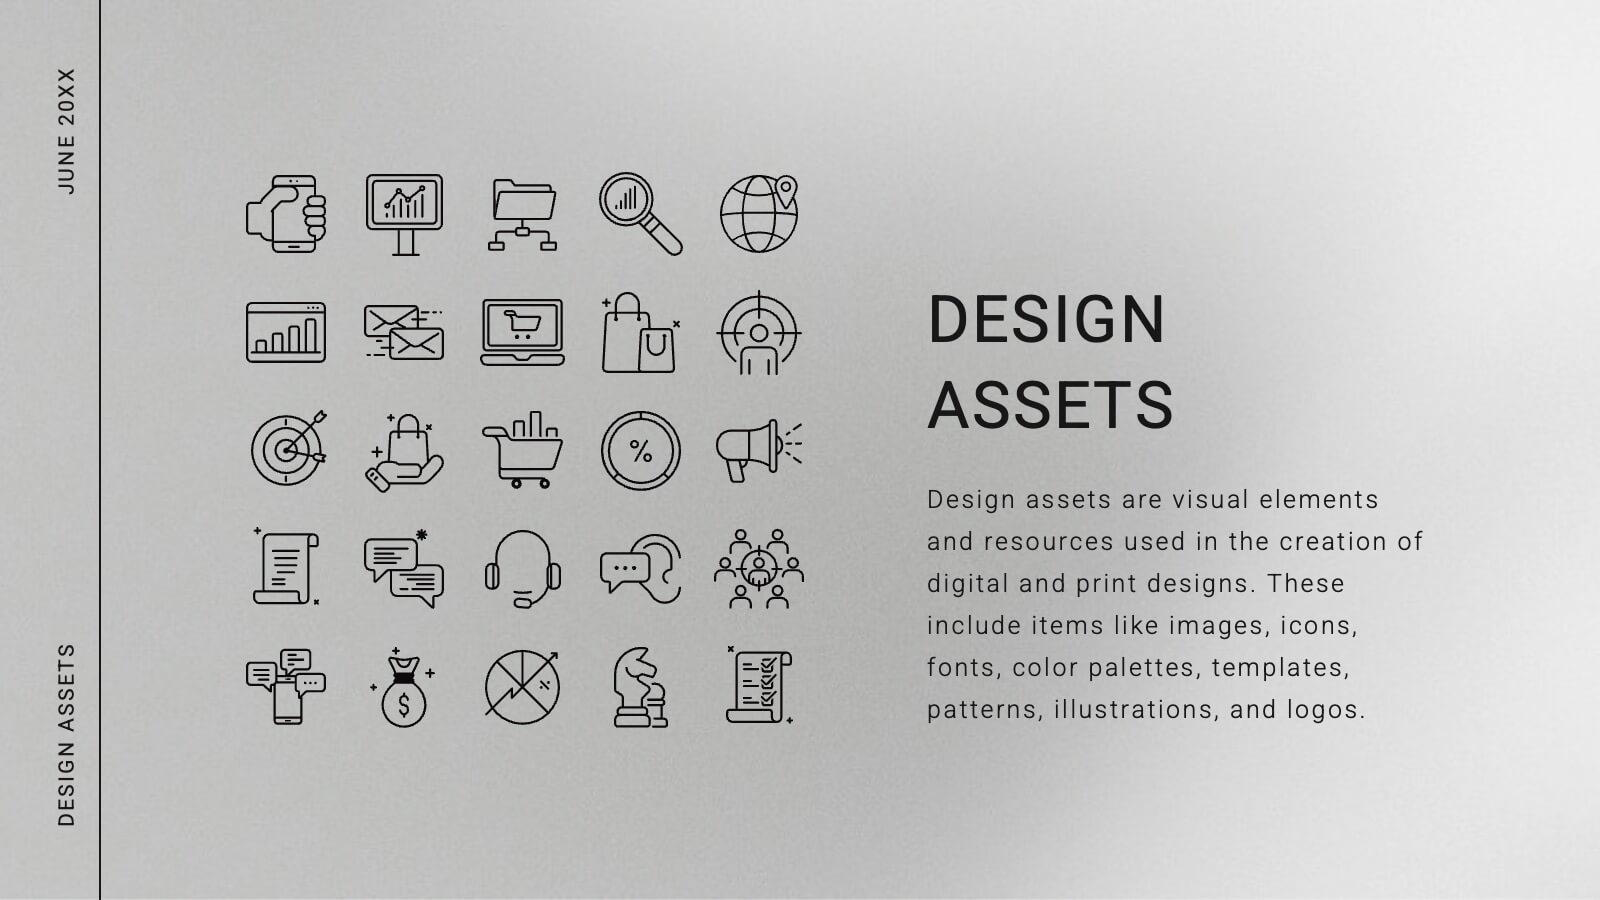
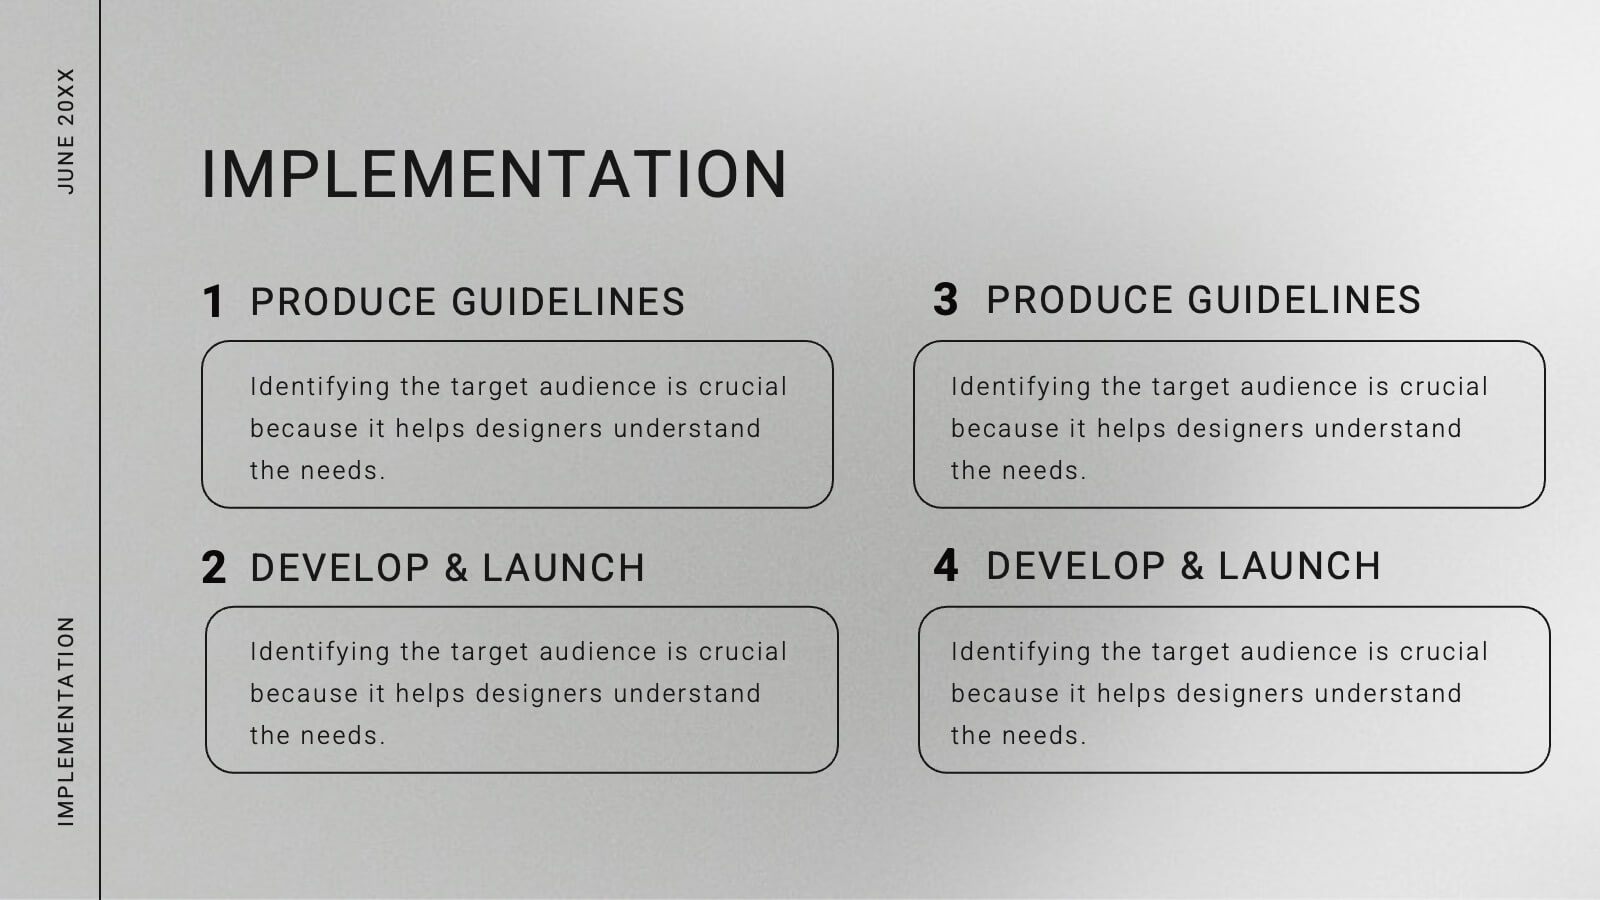
Comet Graphic Design Project Plan Presentation
Craft stunning design project presentations with this elegant template. Showcase objectives, processes, mood boards, and final designs effectively. Ideal for creative teams and clients. Fully compatible with PowerPoint, Keynote, and Google Slides.


10 slides
Competitive Advantage Through Value Chain Presentation
Gain a Competitive Edge with Strategic Value Chain Optimization! This Competitive Advantage Through Value Chain presentation template is designed to help businesses map, analyze, and enhance their value chain for increased efficiency and profitability. Featuring a structured layout with dynamic elements, this template allows you to showcase key business activities, identify strengths, and optimize processes for sustainable competitive advantage. Perfect for consultants, business strategists, and executives, this template is fully editable and compatible with PowerPoint, Keynote, and Google Slides for seamless customization.