


Features
- 6 Unique slides
- Fully editable and easy to edit in Microsoft Powerpoint, Keynote and Google Slides
- 16:9 widescreen layout
- Clean and professional designs
- Export to JPG, PDF or send by email


Do you have any questions?
Recommend


6 slides
Executive Summary Research Infographics
Efficiently convey key research findings with our Executive Summary Research infographic template. This template is fully compatible with popular presentation software like PowerPoint, Keynote, and Google Slides, allowing you to effortlessly customize it to encapsulate essential research insights. The Executive Summary Research infographic template serves as a concise and visually engaging platform for summarizing research objectives, methodologies, and critical findings. Whether you're a researcher, project manager, or involved in data analysis, this template provides a user-friendly canvas to create compelling executive summaries for your research projects. Optimize your research communication with this SEO-optimized Executive Summary Research infographic template, thoughtfully designed for clarity and ease of use. Customize it to highlight key data points, conclusions, and recommendations, ensuring your audience grasps the essence of your research quickly and effectively. Start crafting your personalized infographic today to make your research stand out.


7 slides
Decision Infographic Presentation Template
Our decision Infographic template is a fast and easy way to create an informative decision making presentation. Use it to present your ideas and get feedback from your team in an effective way. This template is designed to present results and make them easy to read. It is suitable for any presentation about decisions or influence. A great choice for educators, business collaboration or advertising. Use this to make a decision and support your investments in a new direction. This presentation template allows you to outline key points and conclusions, as well as include charts and tables.


7 slides
Strategic Highlights Executive Summary Presentation
Showcase your business priorities with the Strategic Highlights Executive Summary Presentation. This layout features up to seven colorful, clearly labeled content blocks—perfect for summarizing goals, KPIs, initiatives, or focus areas. Easy to edit in PowerPoint, Keynote, Google Slides, or Canva for quick customization and clean executive reporting.


12 slides
Startup Investor Pitch Deck Presentation
Craft a compelling pitch with this Startup Investor Pitch Deck template. Featuring a structured layout, it helps showcase your startup’s vision, market potential, and financial projections. Designed for clarity and engagement, this template ensures a persuasive investor presentation. Fully compatible with PowerPoint, Keynote, and Google Slides for seamless customization.


21 slides
Kyanite Small Business Pitch Deck Presentation
Make your business pitch stand out with this vibrant and engaging presentation! Featuring sections like project overviews, team updates, performance metrics, and collaboration opportunities, it helps convey your ideas with clarity and impact. Whether for internal reviews or investor pitches, this template works seamlessly with PowerPoint, Keynote, and Google Slides.


10 slides
Startup Executive Overview Template Presentation
Bring your startup’s big picture to life in one smart, visual swoop! This infographic presentation template helps you map out key insights and milestones in a clean, modern layout. Ideal for pitching ideas, aligning teams, or showcasing growth strategies. Fully compatible with PowerPoint, Keynote, and Google Slides for easy editing.


5 slides
Progress and Performance Yearly Review Presentation
Highlight key milestones along your business journey with this winding roadmap-style slide. Designed for annual reviews, it features five flag markers for progress tracking, goals, or achievements. Ideal for reports or team updates. Fully customizable in PowerPoint, Keynote, and Google Slides for seamless adaptation to your yearly metrics.


5 slides
Business Report Summary Slide Presentation
Deliver key metrics and insights with confidence using this Business Report Summary Slide. Featuring segmented graphs, percentage indicators, and a 6-part breakdown, this layout helps you highlight performance trends and action items clearly. Ideal for reporting, monthly reviews, or executive briefings. Fully editable in PowerPoint, Keynote, and Google Slides.


4 slides
Economic Growth in South America Map Presentation
Gain insights into regional development with the Economic Growth in South America Map template, designed to visualize financial data and economic trends across different areas of the continent. It features a clear map highlighting specific countries, accompanied by customizable bars representing economic indicators in dollar values. This template is excellent for presentations analyzing economic performance and growth opportunities within the continent.


7 slides
Performance Summary Infographic
Boost your reporting capabilities with our Infographic Templates, designed to deliver exceptional clarity and impact. This series is perfectly suited for professionals seeking to present performance data compellingly and concisely. With a variety of designs including radial graphs, tiered lists, and comparative bars, these templates allow for an informative and aesthetically pleasing showcase of critical metrics. Each template is customizable, letting you adjust the color schemes and text to fit your corporate style, enhancing both visual appeal and brand consistency. Whether used in PowerPoint, Google Slides, or Keynote, these tools are vital for anyone looking to articulate achievements, assess comparative results, and plan based on solid data insights. They are indispensable for consultants, managers, and team leaders who require clear, persuasive presentation resources to drive decisions and highlight successes.


5 slides
Construction Equipment Infographics
Dive into the industrial world with our construction equipment infographics template. This collection, rich with vivid reds, greens, and purples, breaks down intricate machinery details into digestible visual content, perfect for professionals in the construction industry, equipment manufacturers, and trade school educators. Compatible with Powerpoint, Keynote, and Google Slides. The creative, vertical style packed with high-quality graphics and icons, facilitates the easy assembly of data and processes, enhancing presentations, or educational content. Equip yourself to convey the dynamism of construction equipment through this visually compelling tool.


7 slides
Target Market Profiles Infographic
A Target Market Profile, also known as a customer profile or buyer persona, is a detailed description of a specific segment of a broader market that a business aims to target with its products or services. This infographic is a vibrant and insightful template designed to help you understand your audience better and enhance your marketing strategies. Explore the essence of audience segmentation and empower your marketing endeavors with a clear understanding of your target market. Compatible with Powerpoint, Keynote, and Google Slides. This infographic explores the world of targeted marketing and revolutionize your strategies.


5 slides
Business Model Canvas Overview Presentation
Streamline your business strategy with the Business Model Canvas Overview Presentation. Designed for entrepreneurs, startups, and strategists, this template visualizes key partners, activities, value propositions, customer segments, revenue streams, and more. Fully editable for PowerPoint, Keynote, and Google Slides, ensuring a structured and professional business plan presentation.


20 slides
Odyssey Marketing Proposal Presentation
Pitch your ideas confidently with this modern and visually striking marketing proposal presentation template. Featuring sections for project summary, goals, timeline, budget breakdown, and team expertise, it’s designed to engage and inform stakeholders. Fully compatible with PowerPoint, Keynote, and Google Slides for a seamless presentation experience.


8 slides
Health and Safety Training
Create impactful safety briefings with this visual slide designed around a caution-sign layout. Perfect for outlining training modules, compliance steps, or workplace hazard procedures, it presents four key points using icons and color-coded elements. Fully customizable in PowerPoint, Keynote, and Google Slides.


5 slides
Vaccine Myths Infographic
Vaccine Myths are false or misleading claims about vaccines that can contribute to vaccine hesitancy and misinformation. These infographic templates are designed to debunk common misconceptions and myths surrounding vaccines. These visually appealing and informative templates are ideal for healthcare professionals, educators, and organizations aiming to promote accurate information about vaccines and combat vaccine hesitancy. These infographics aim to educate and empower individuals to make informed decisions about vaccination and contribute to public health efforts. Compatible with Powerpoint, Keynote, and Google Slides.


26 slides
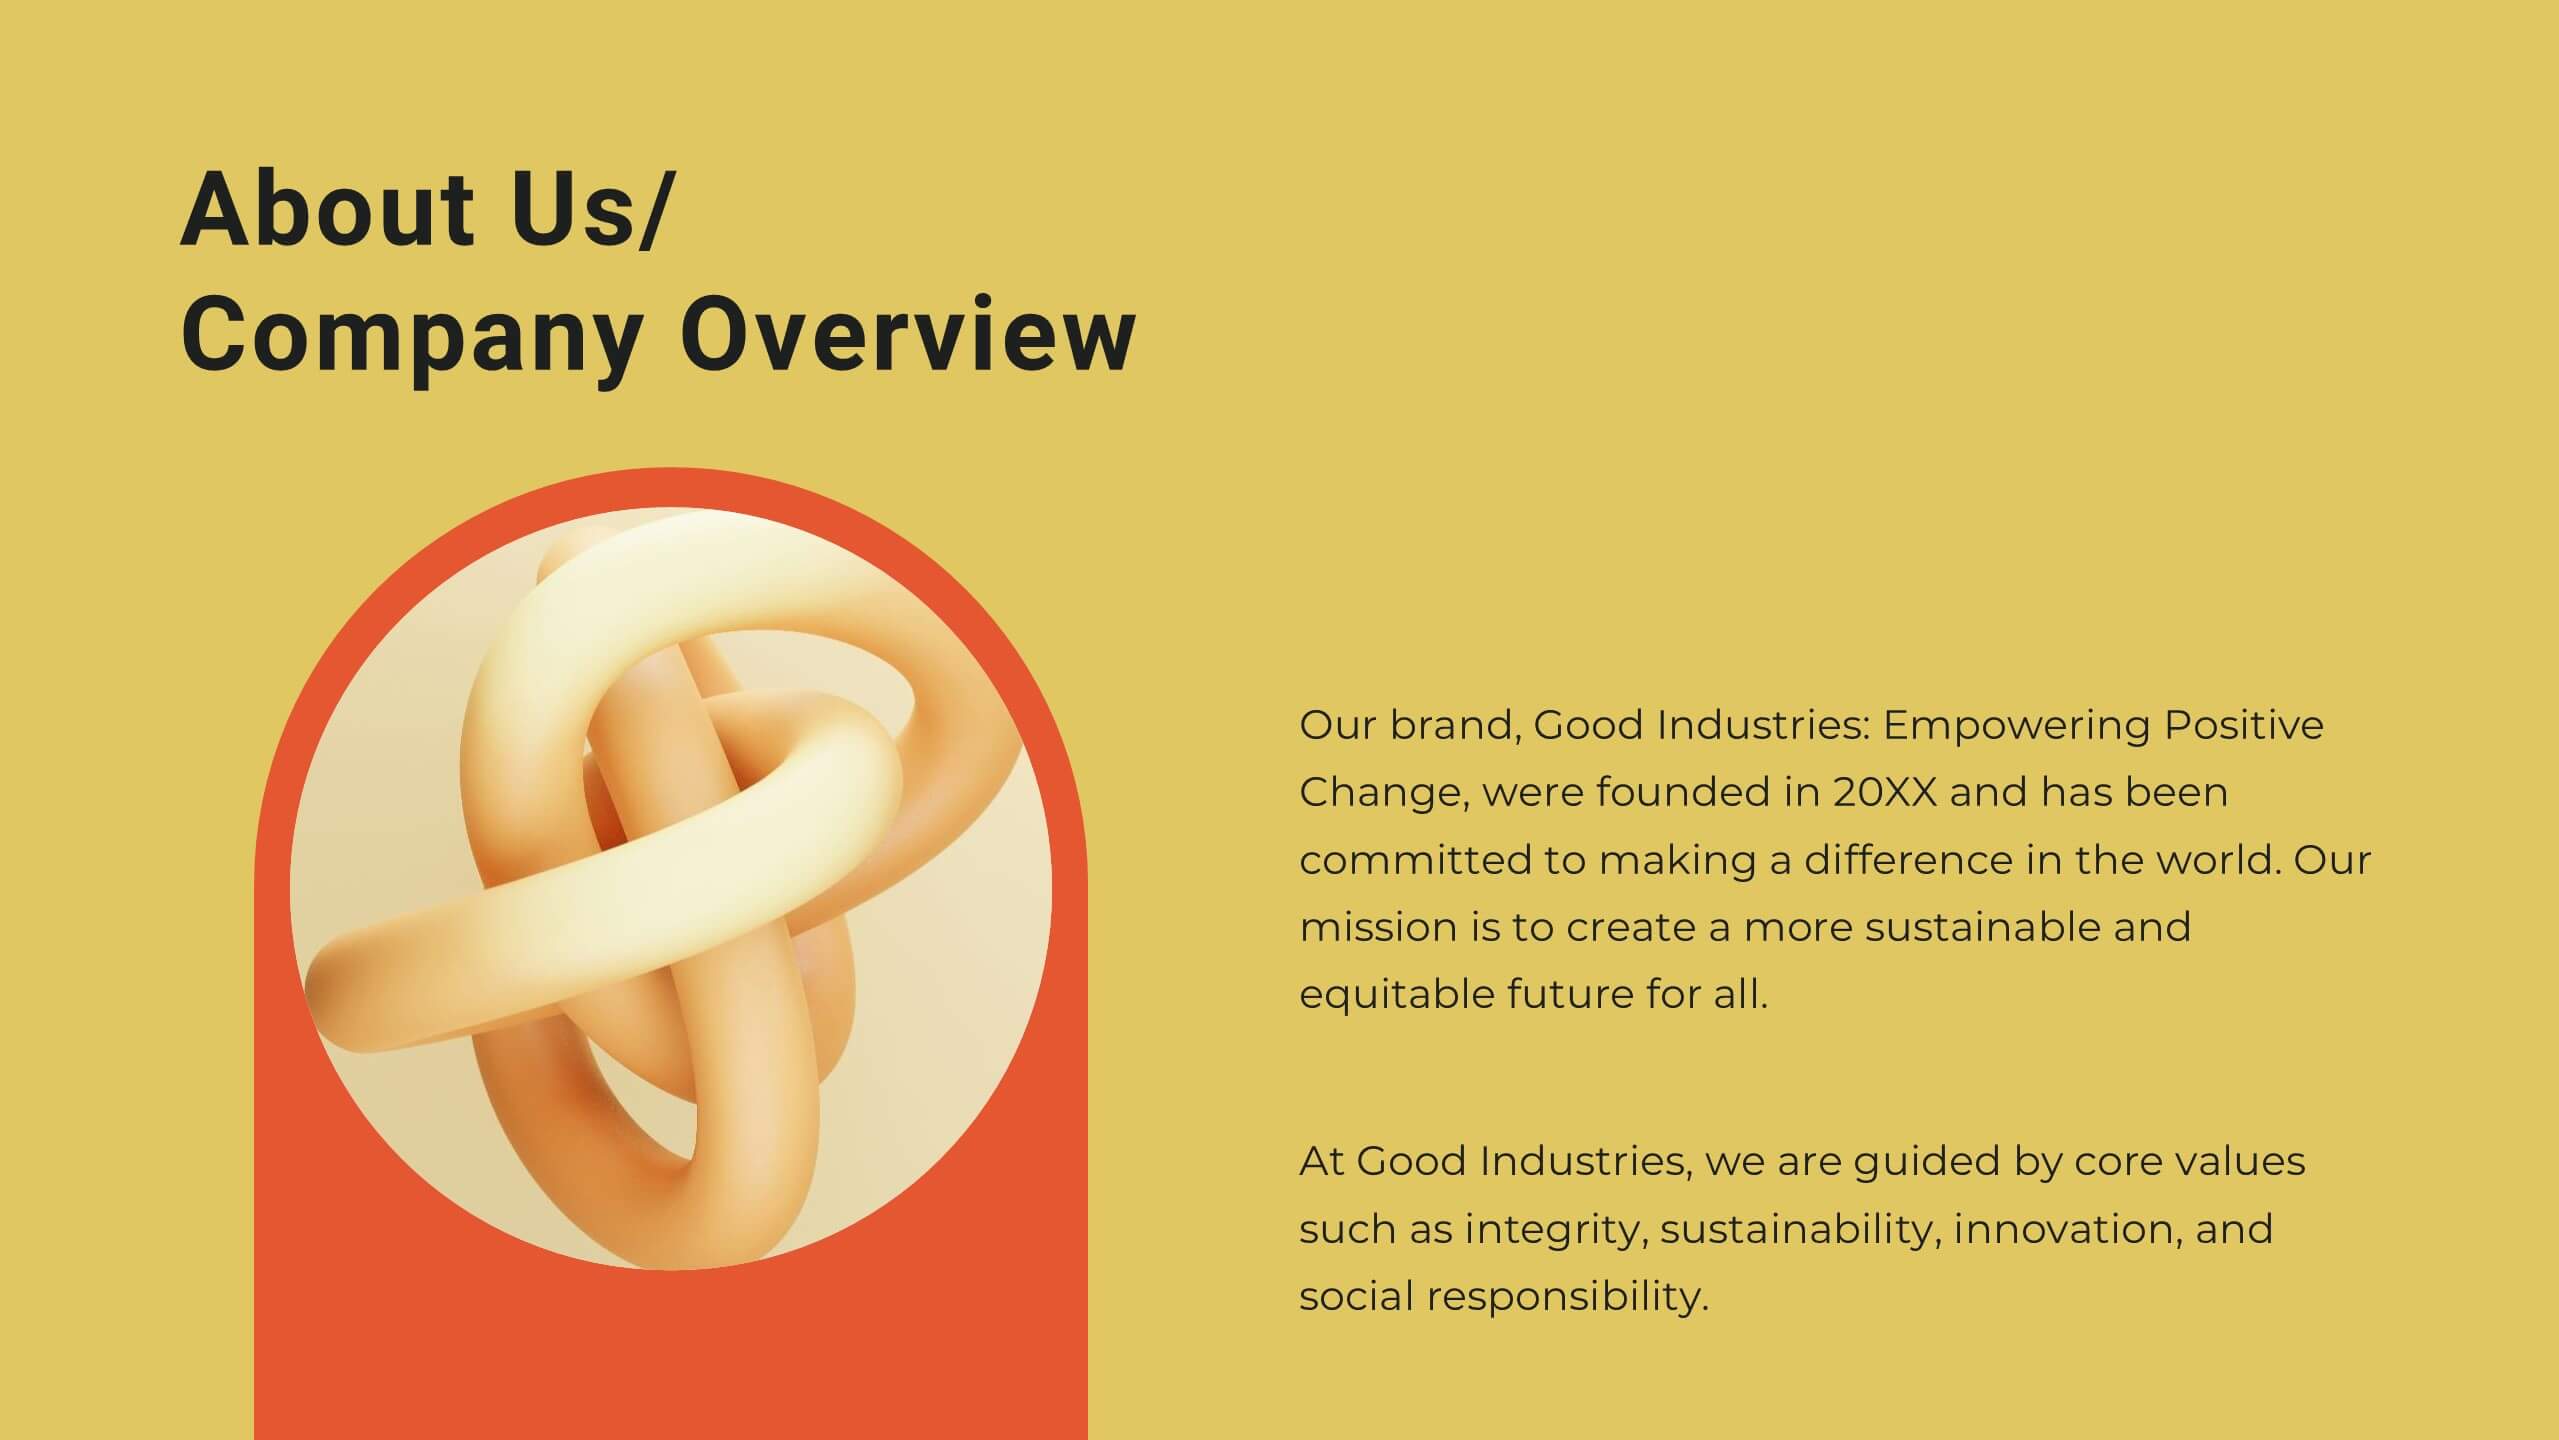
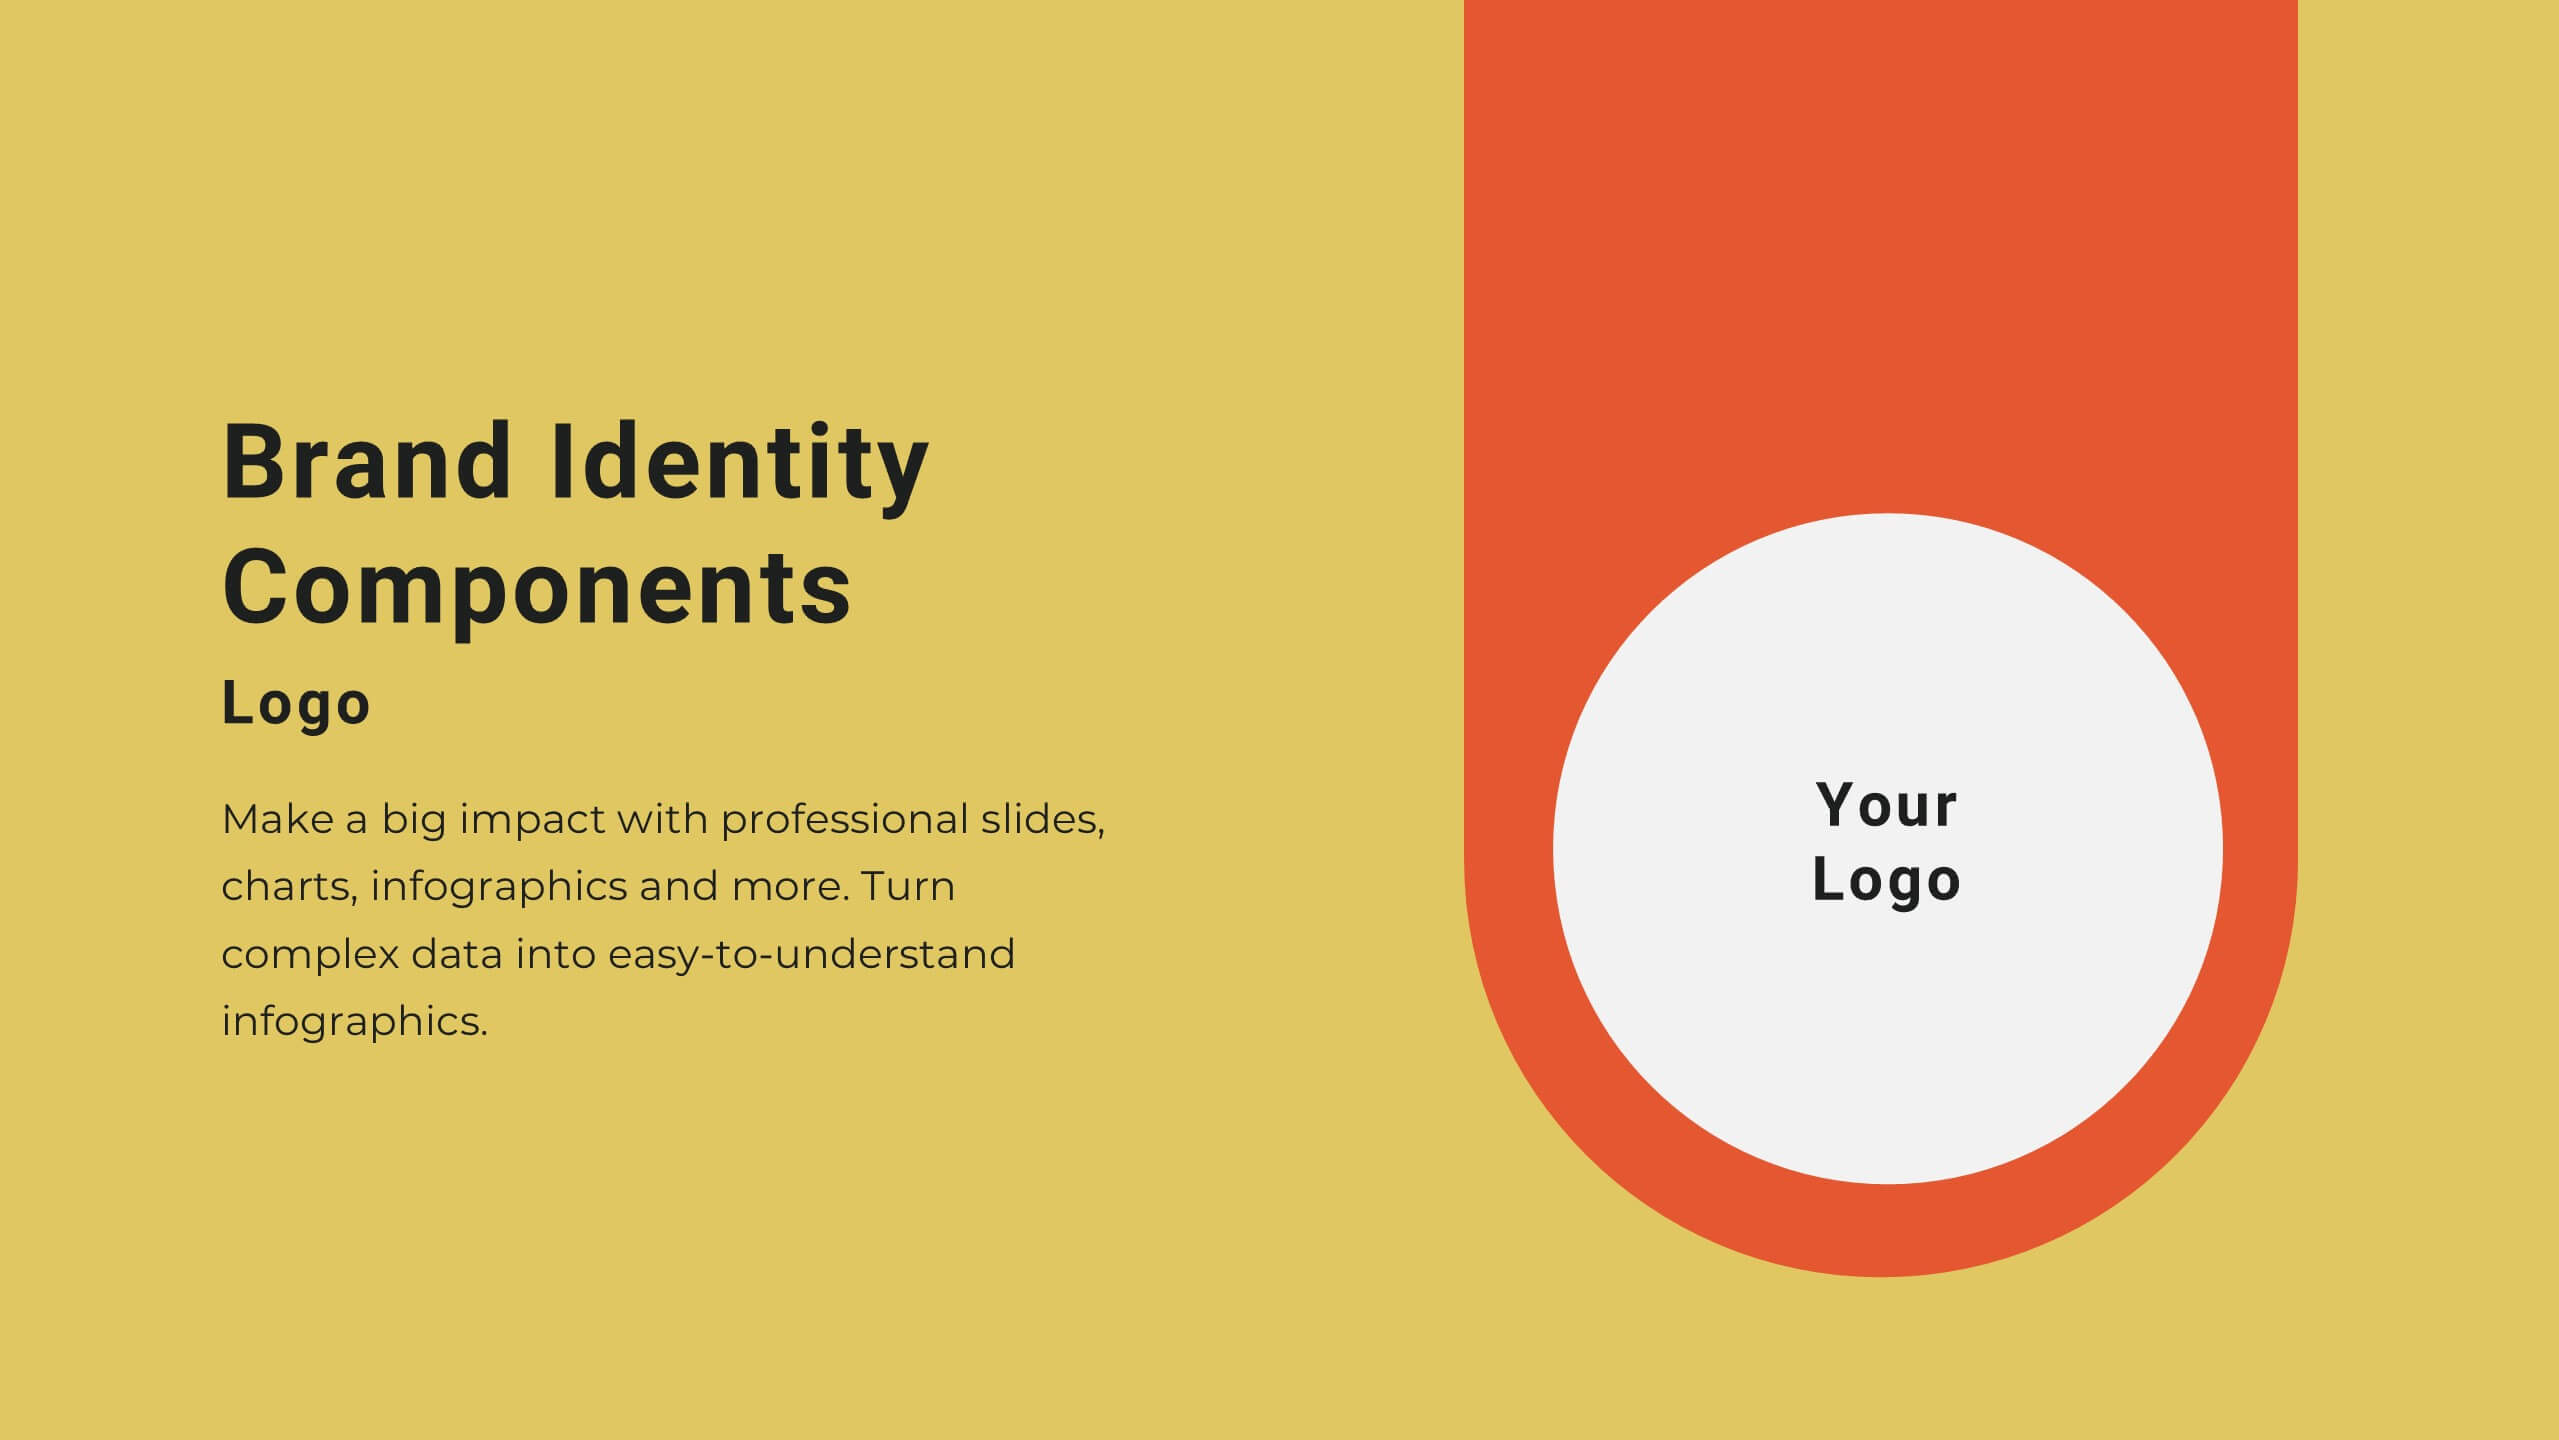
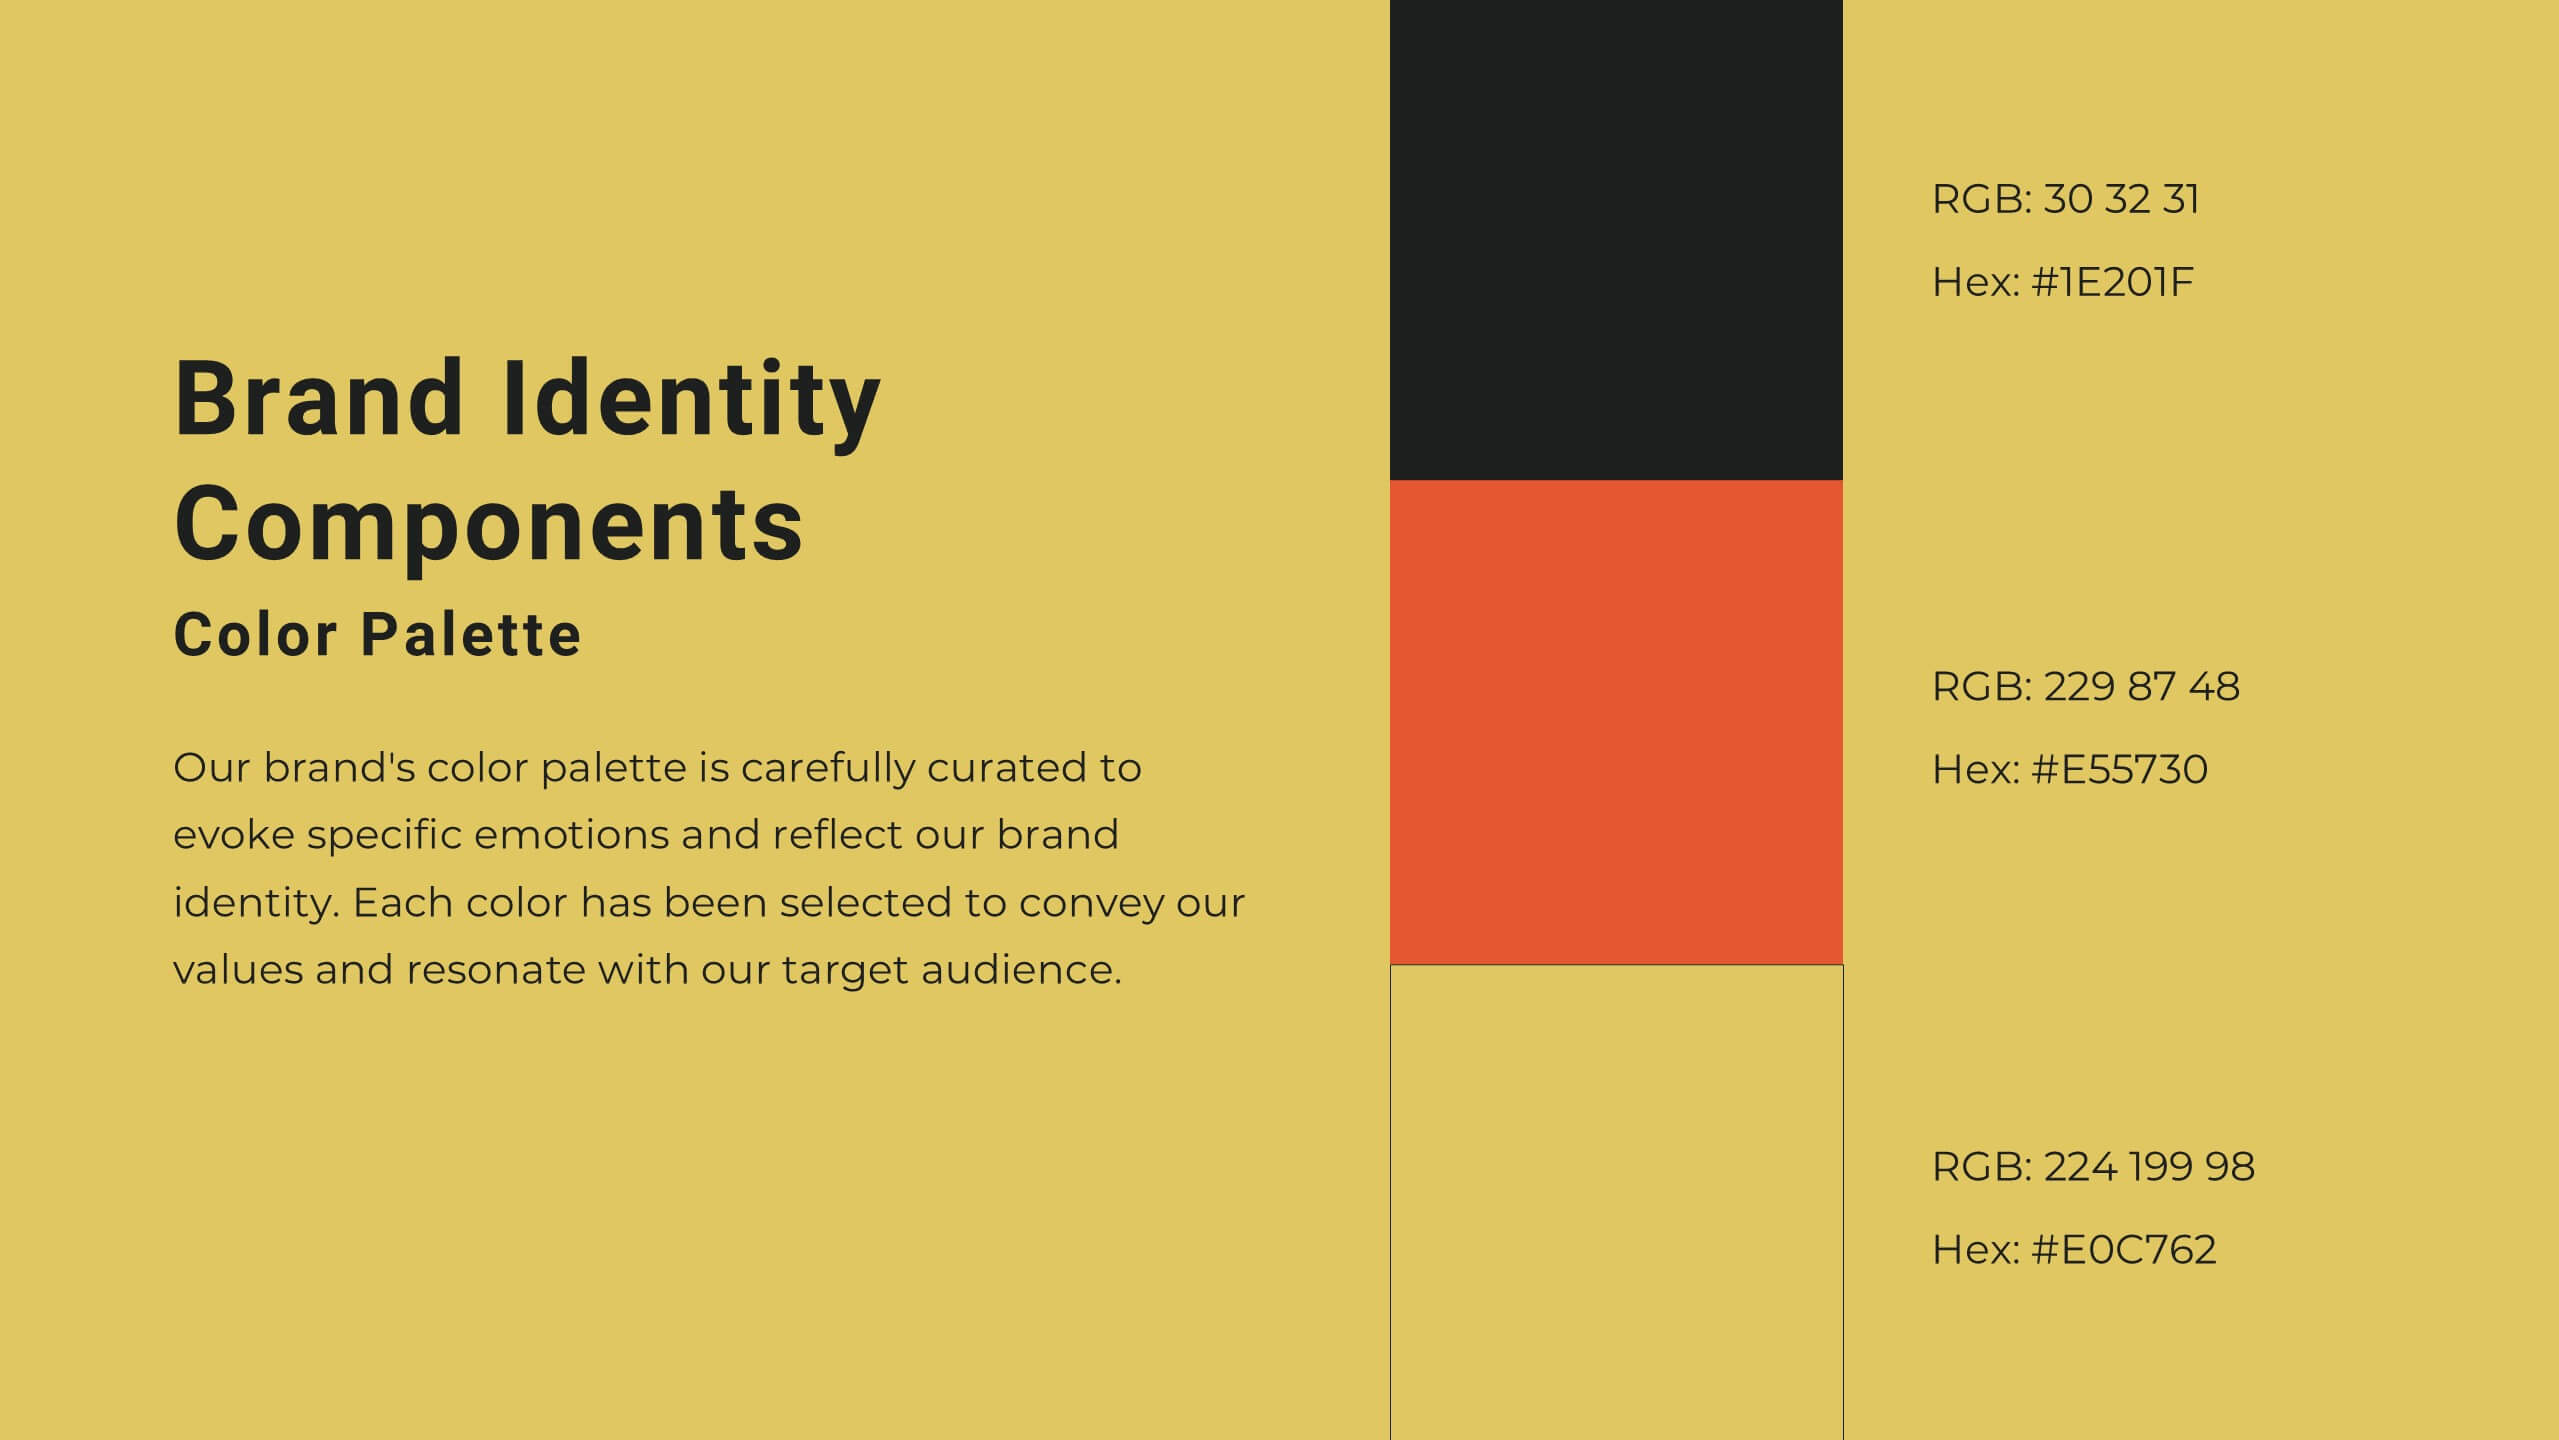
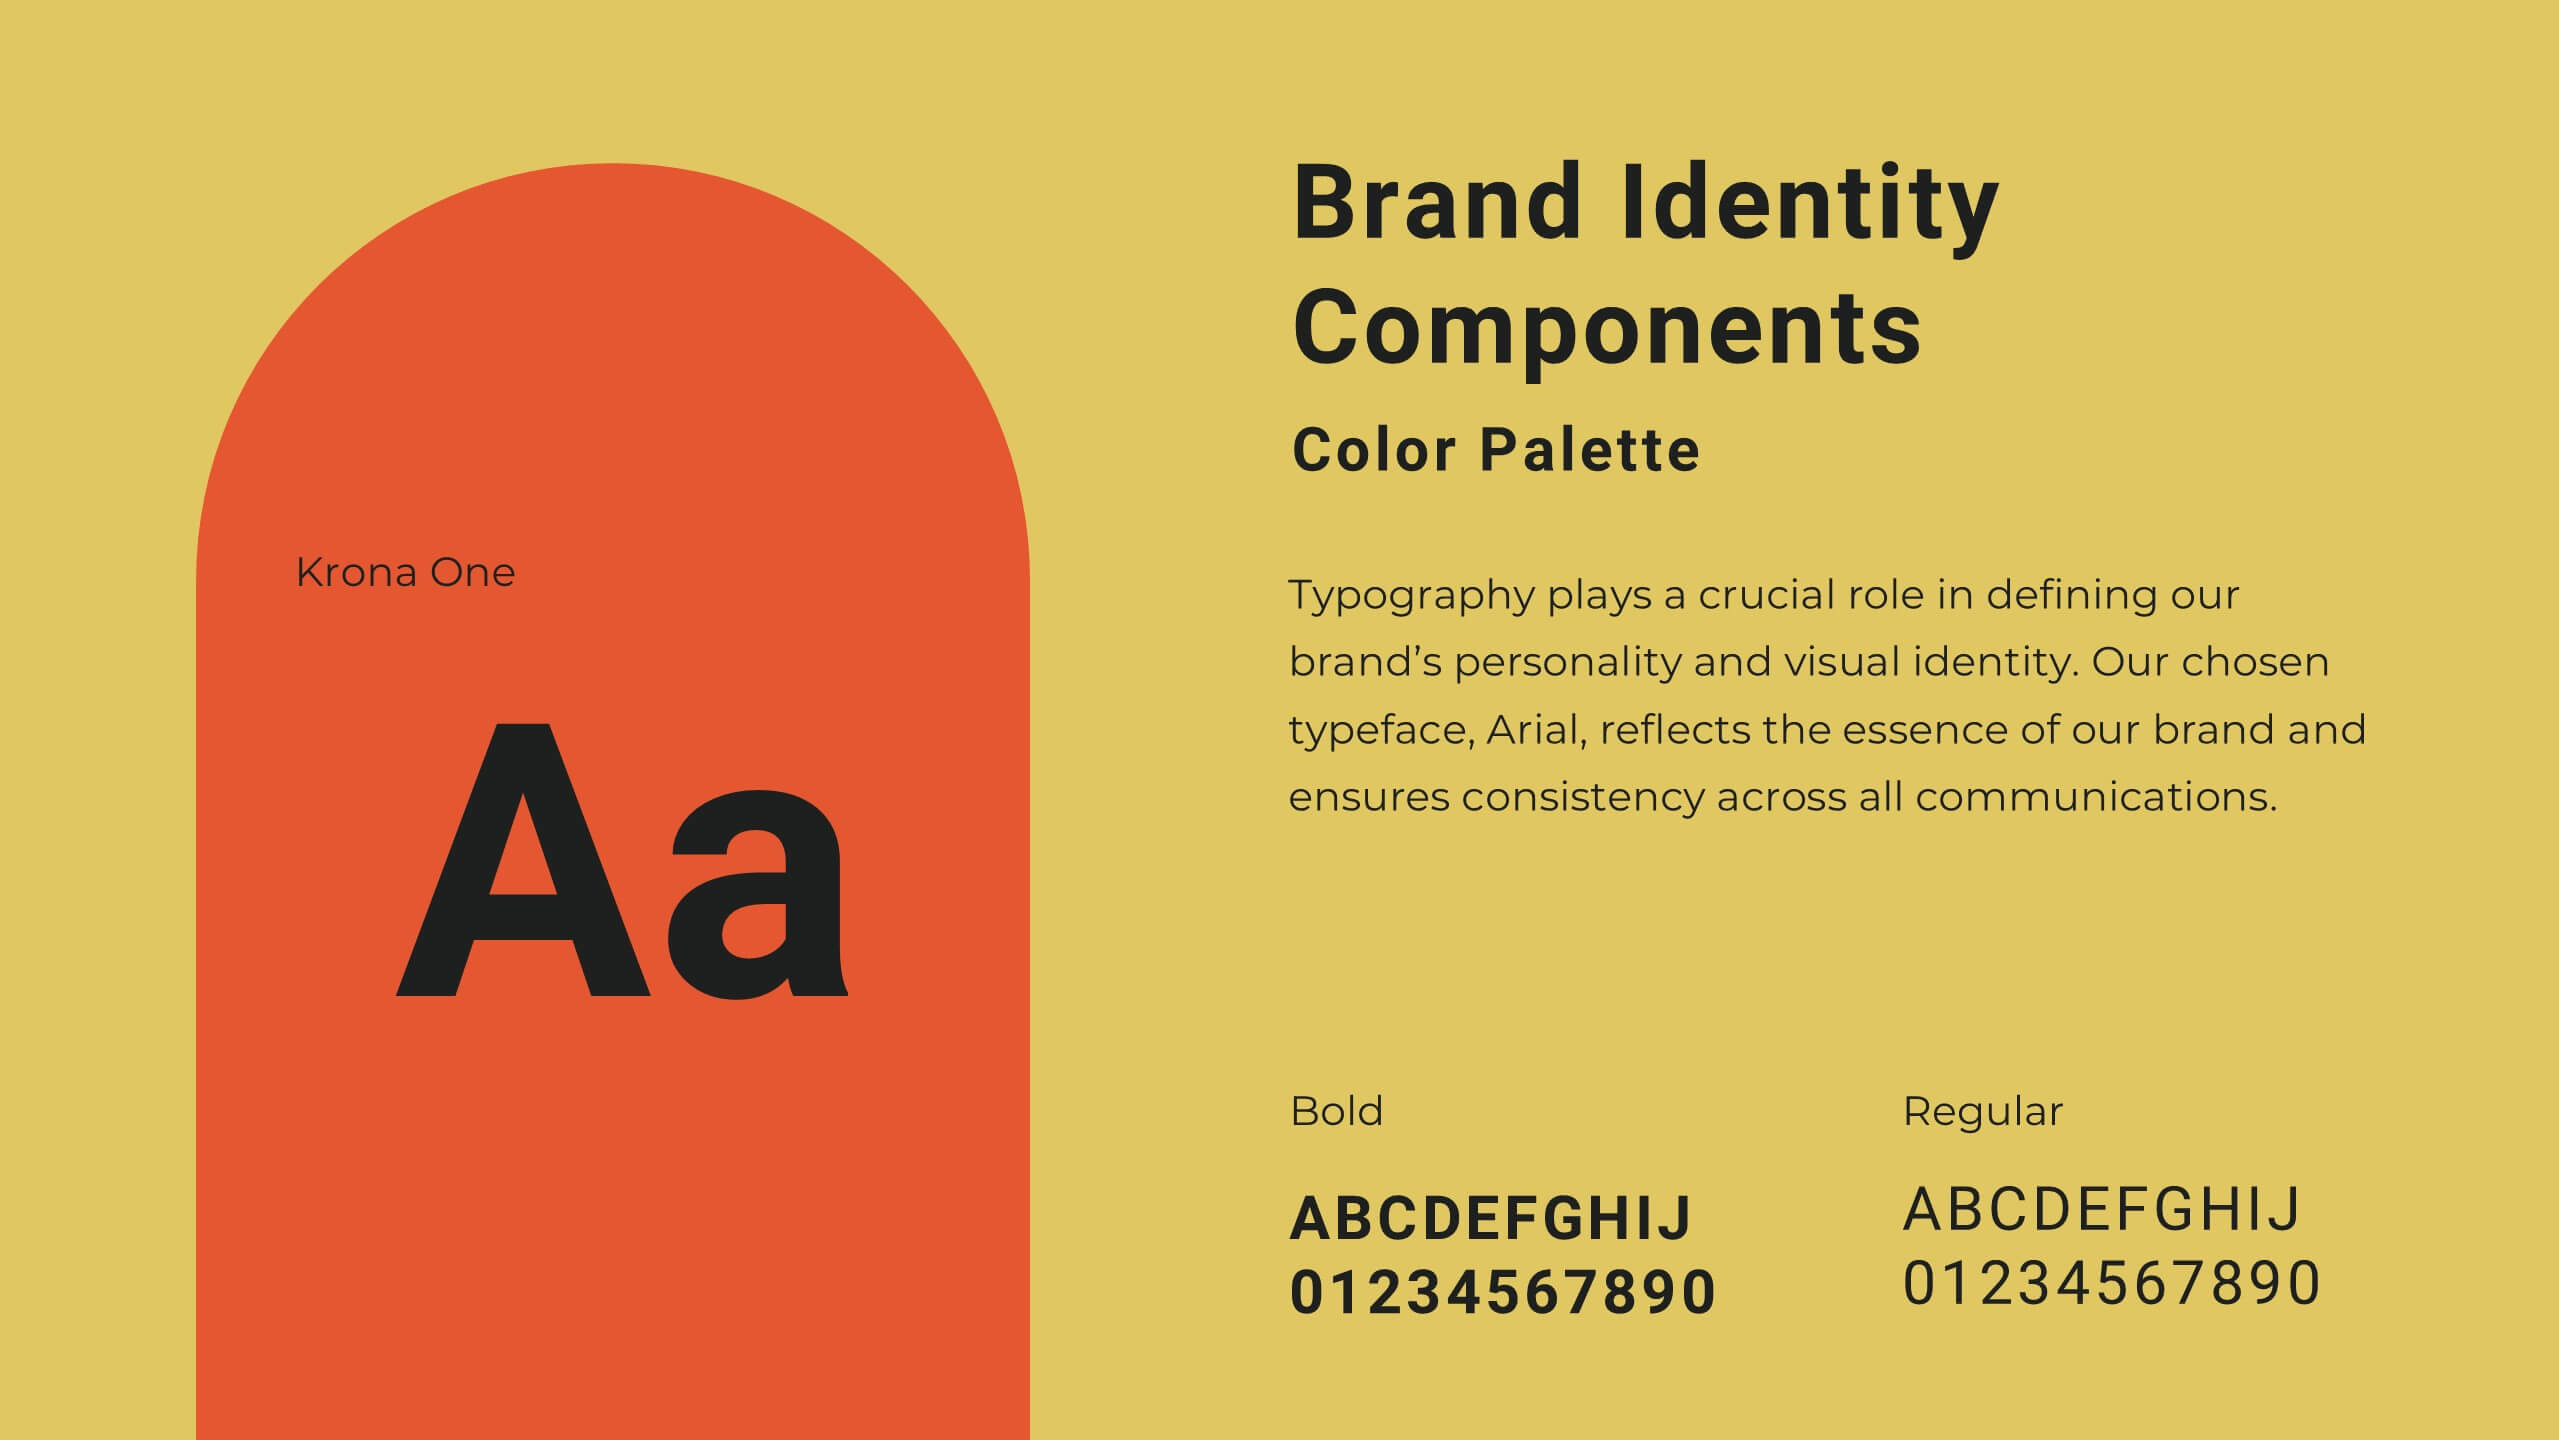
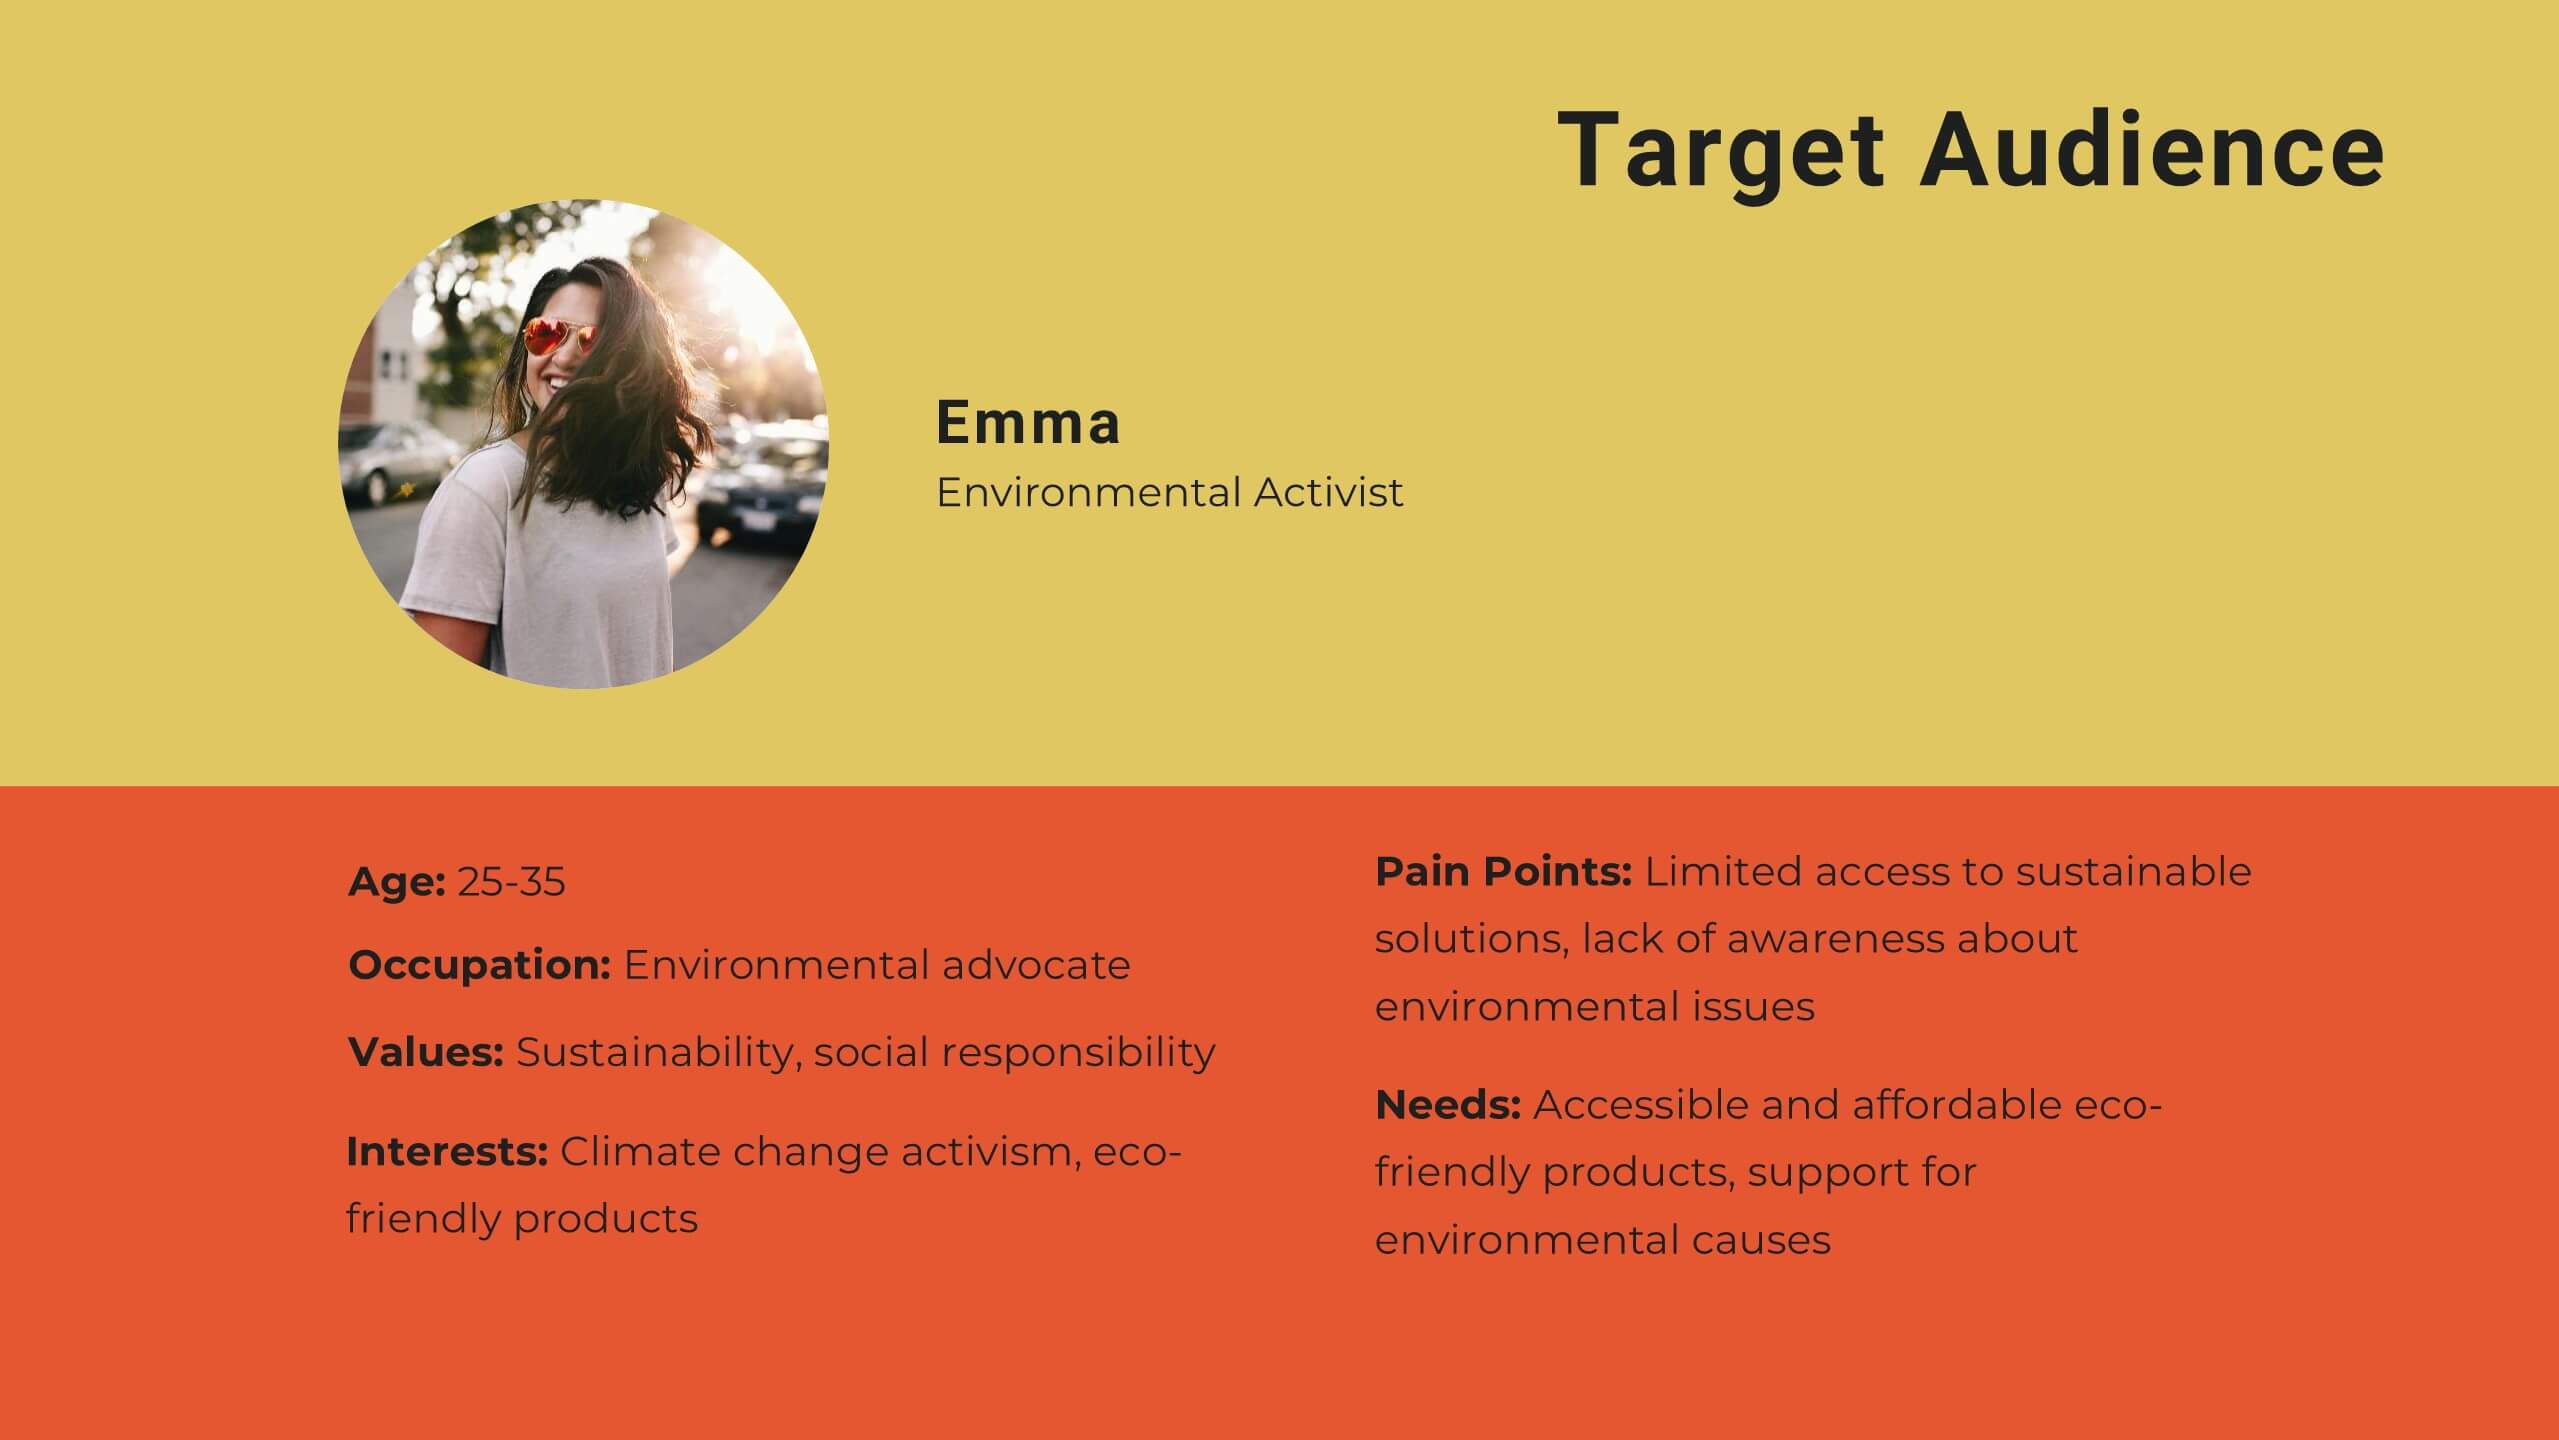
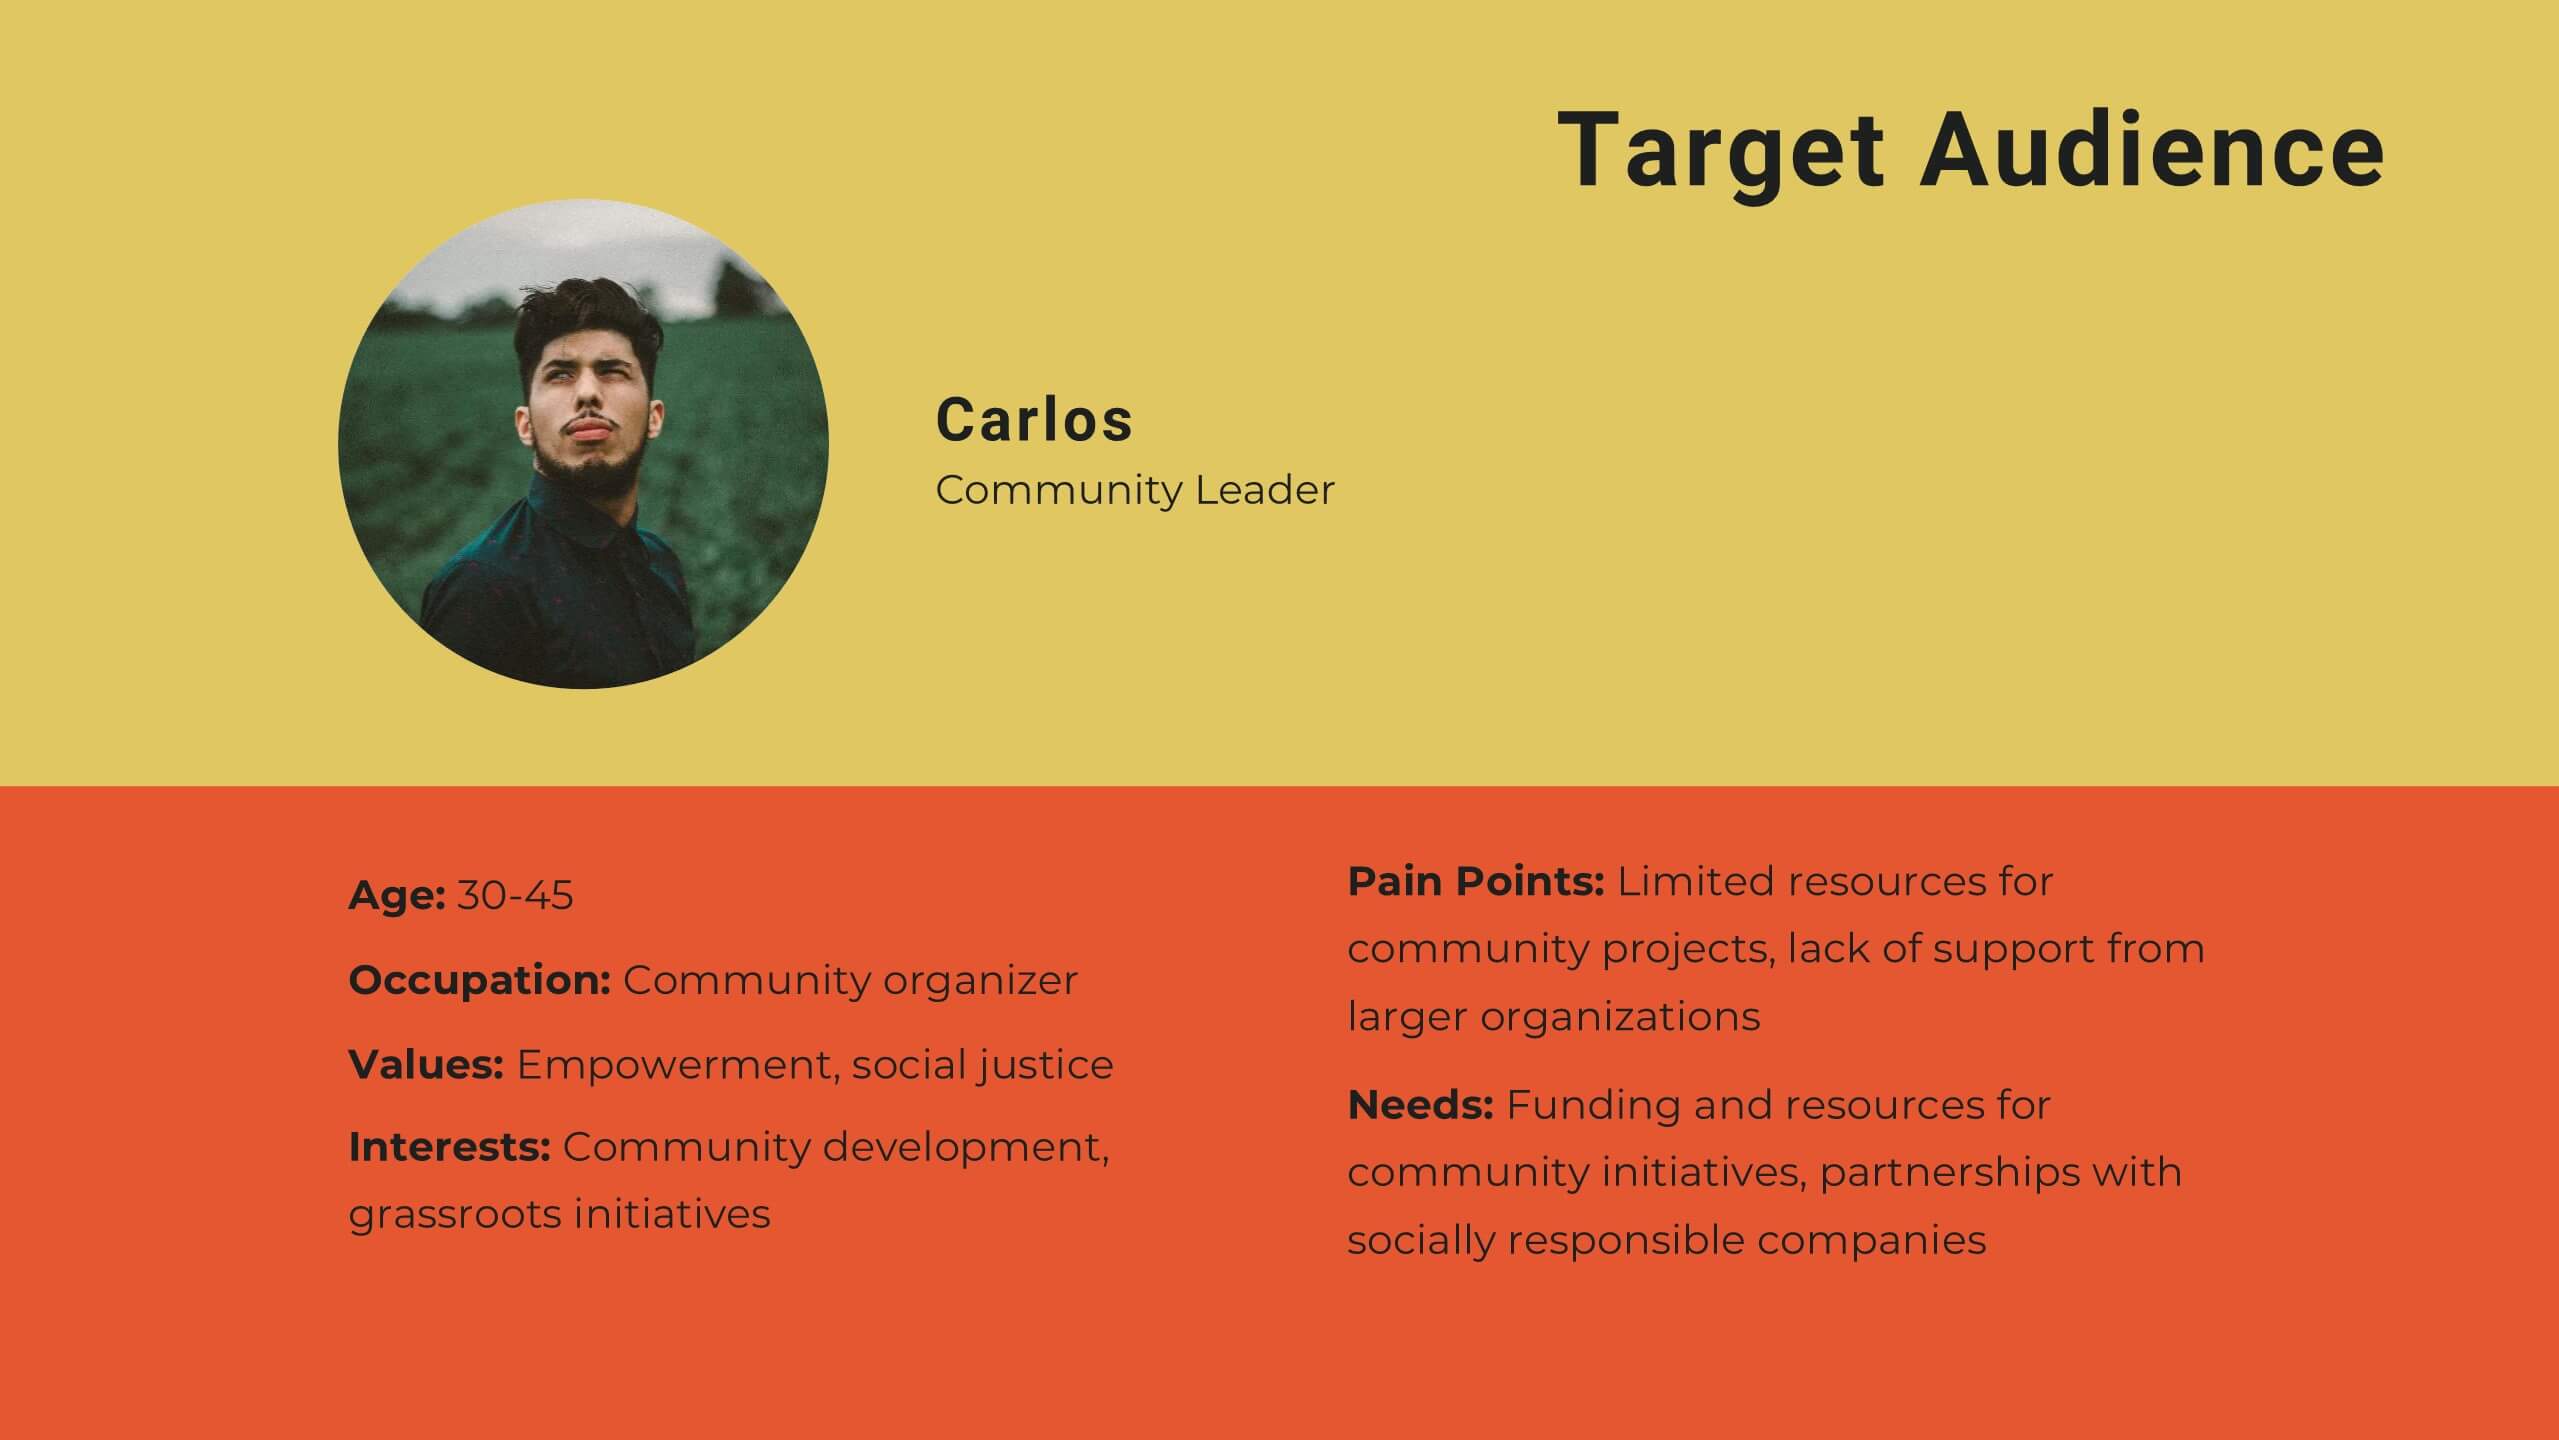
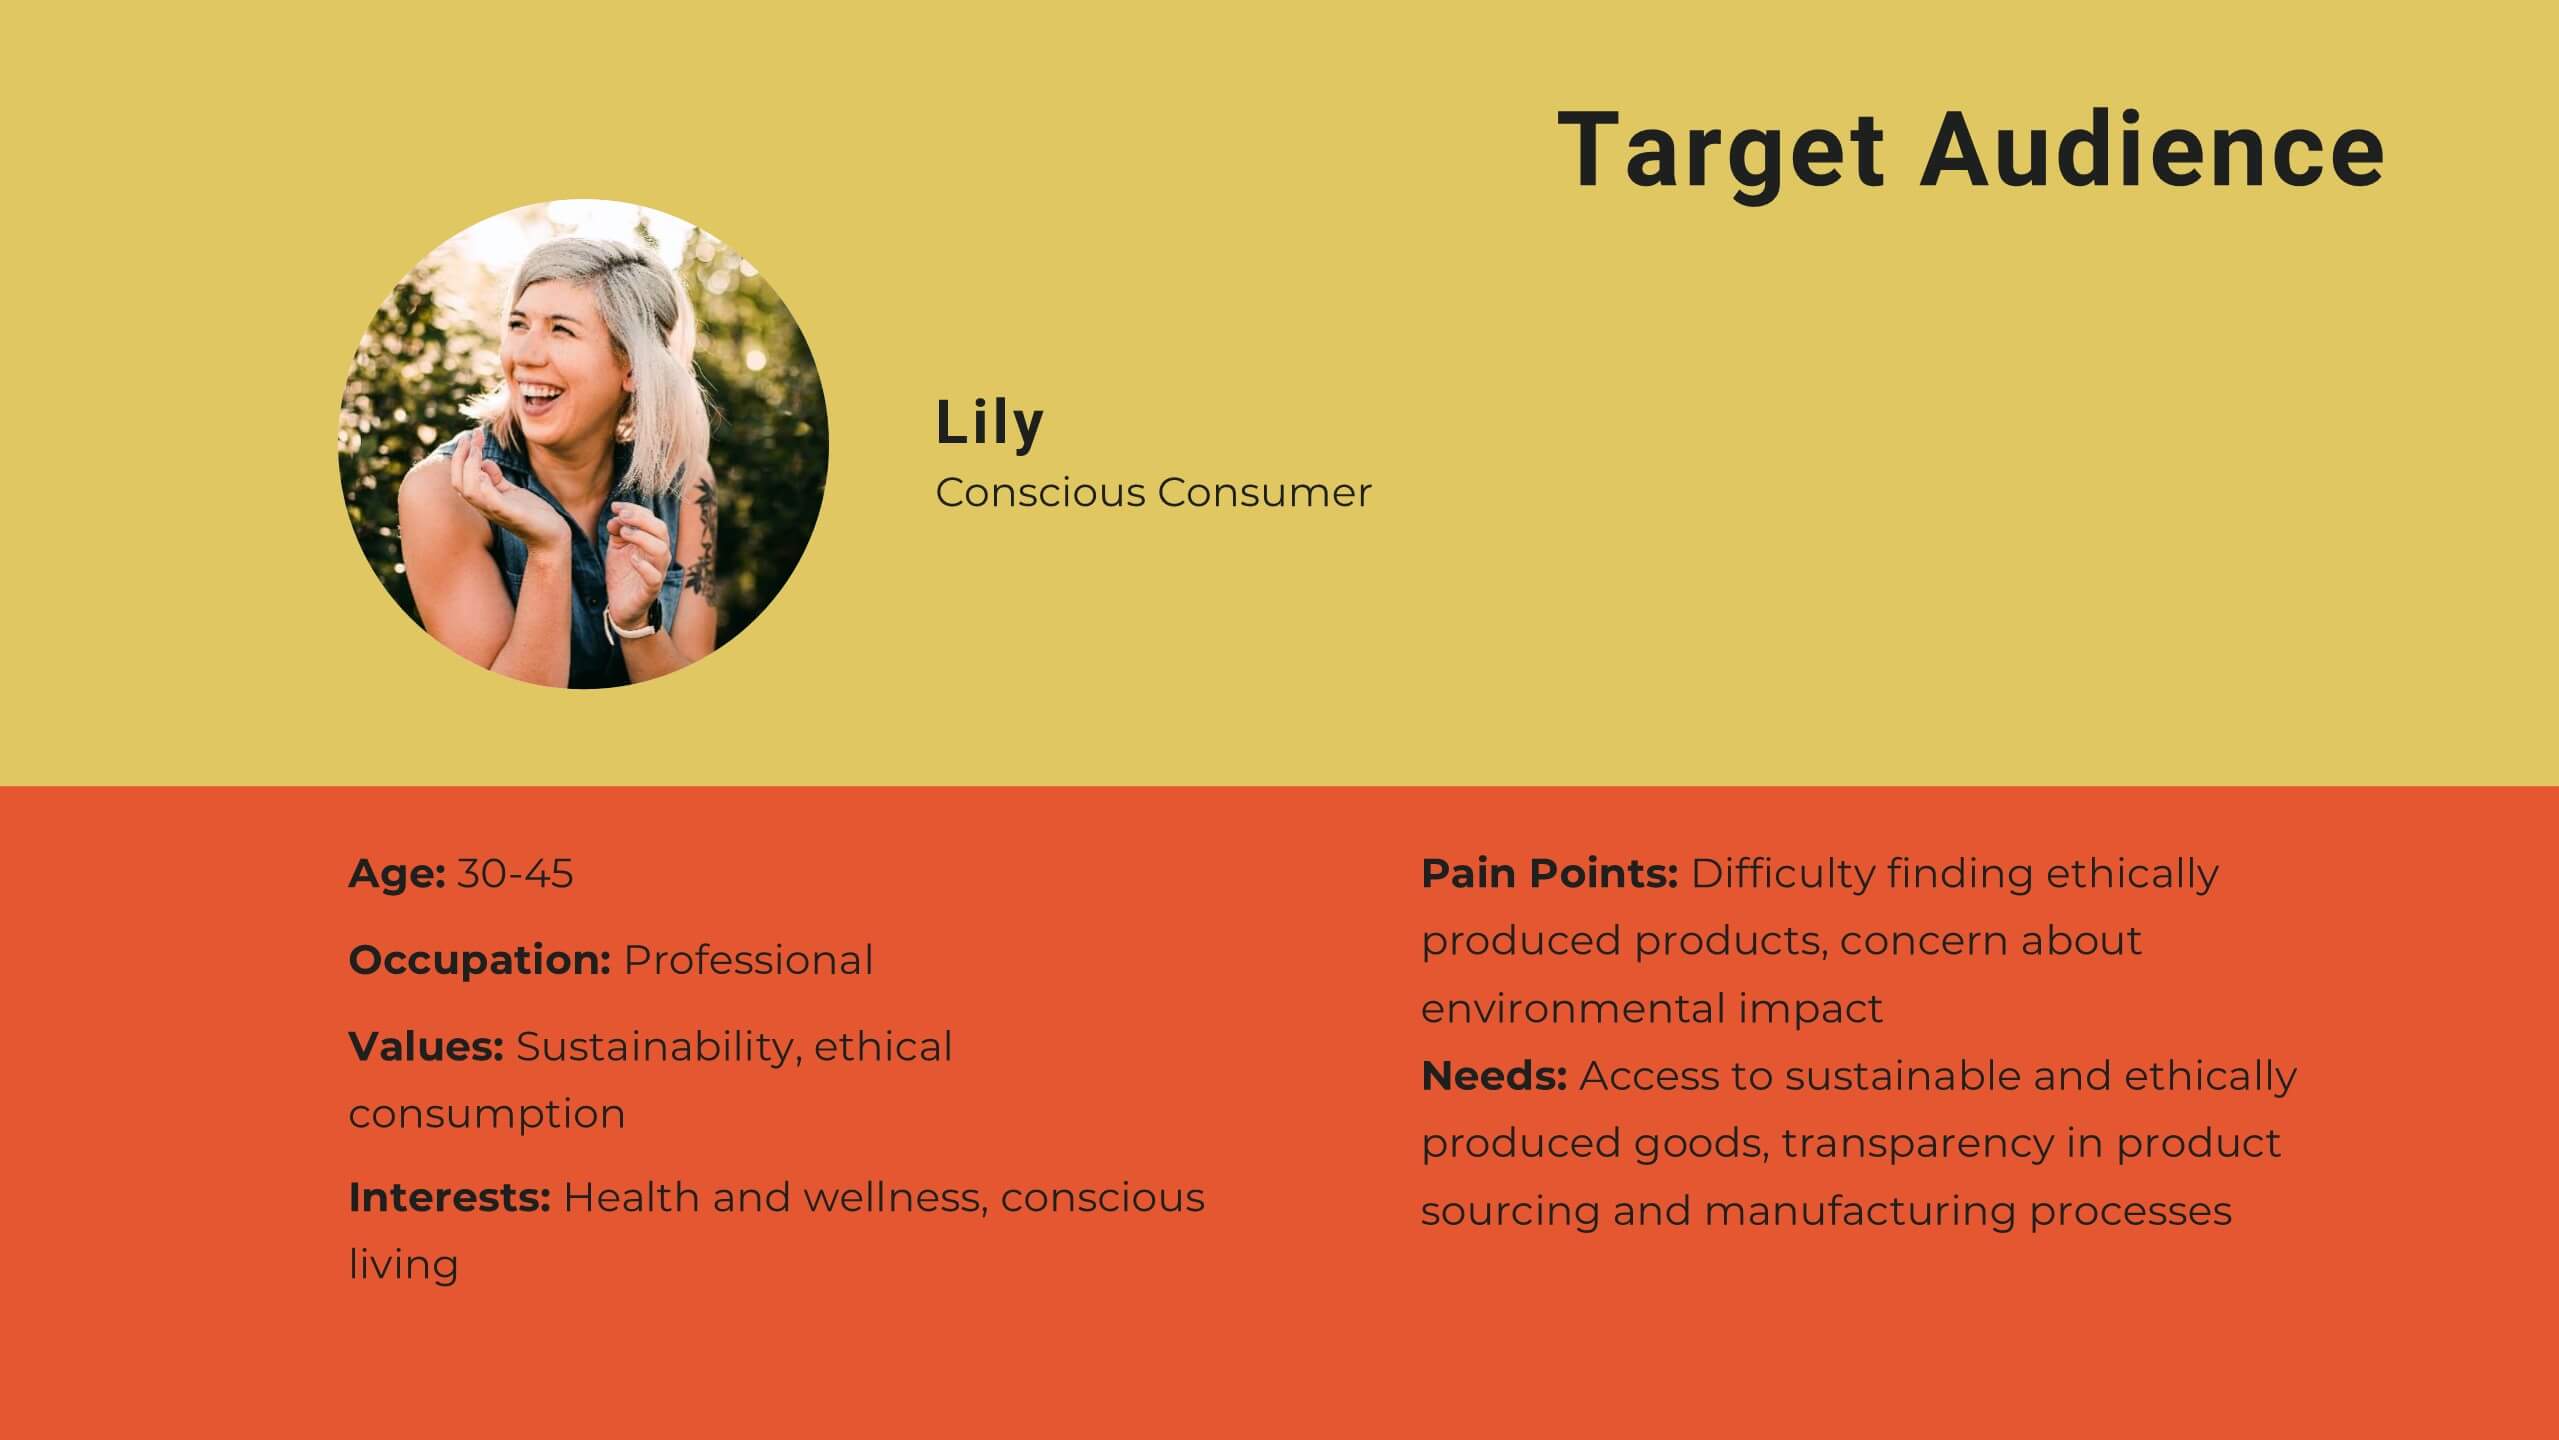
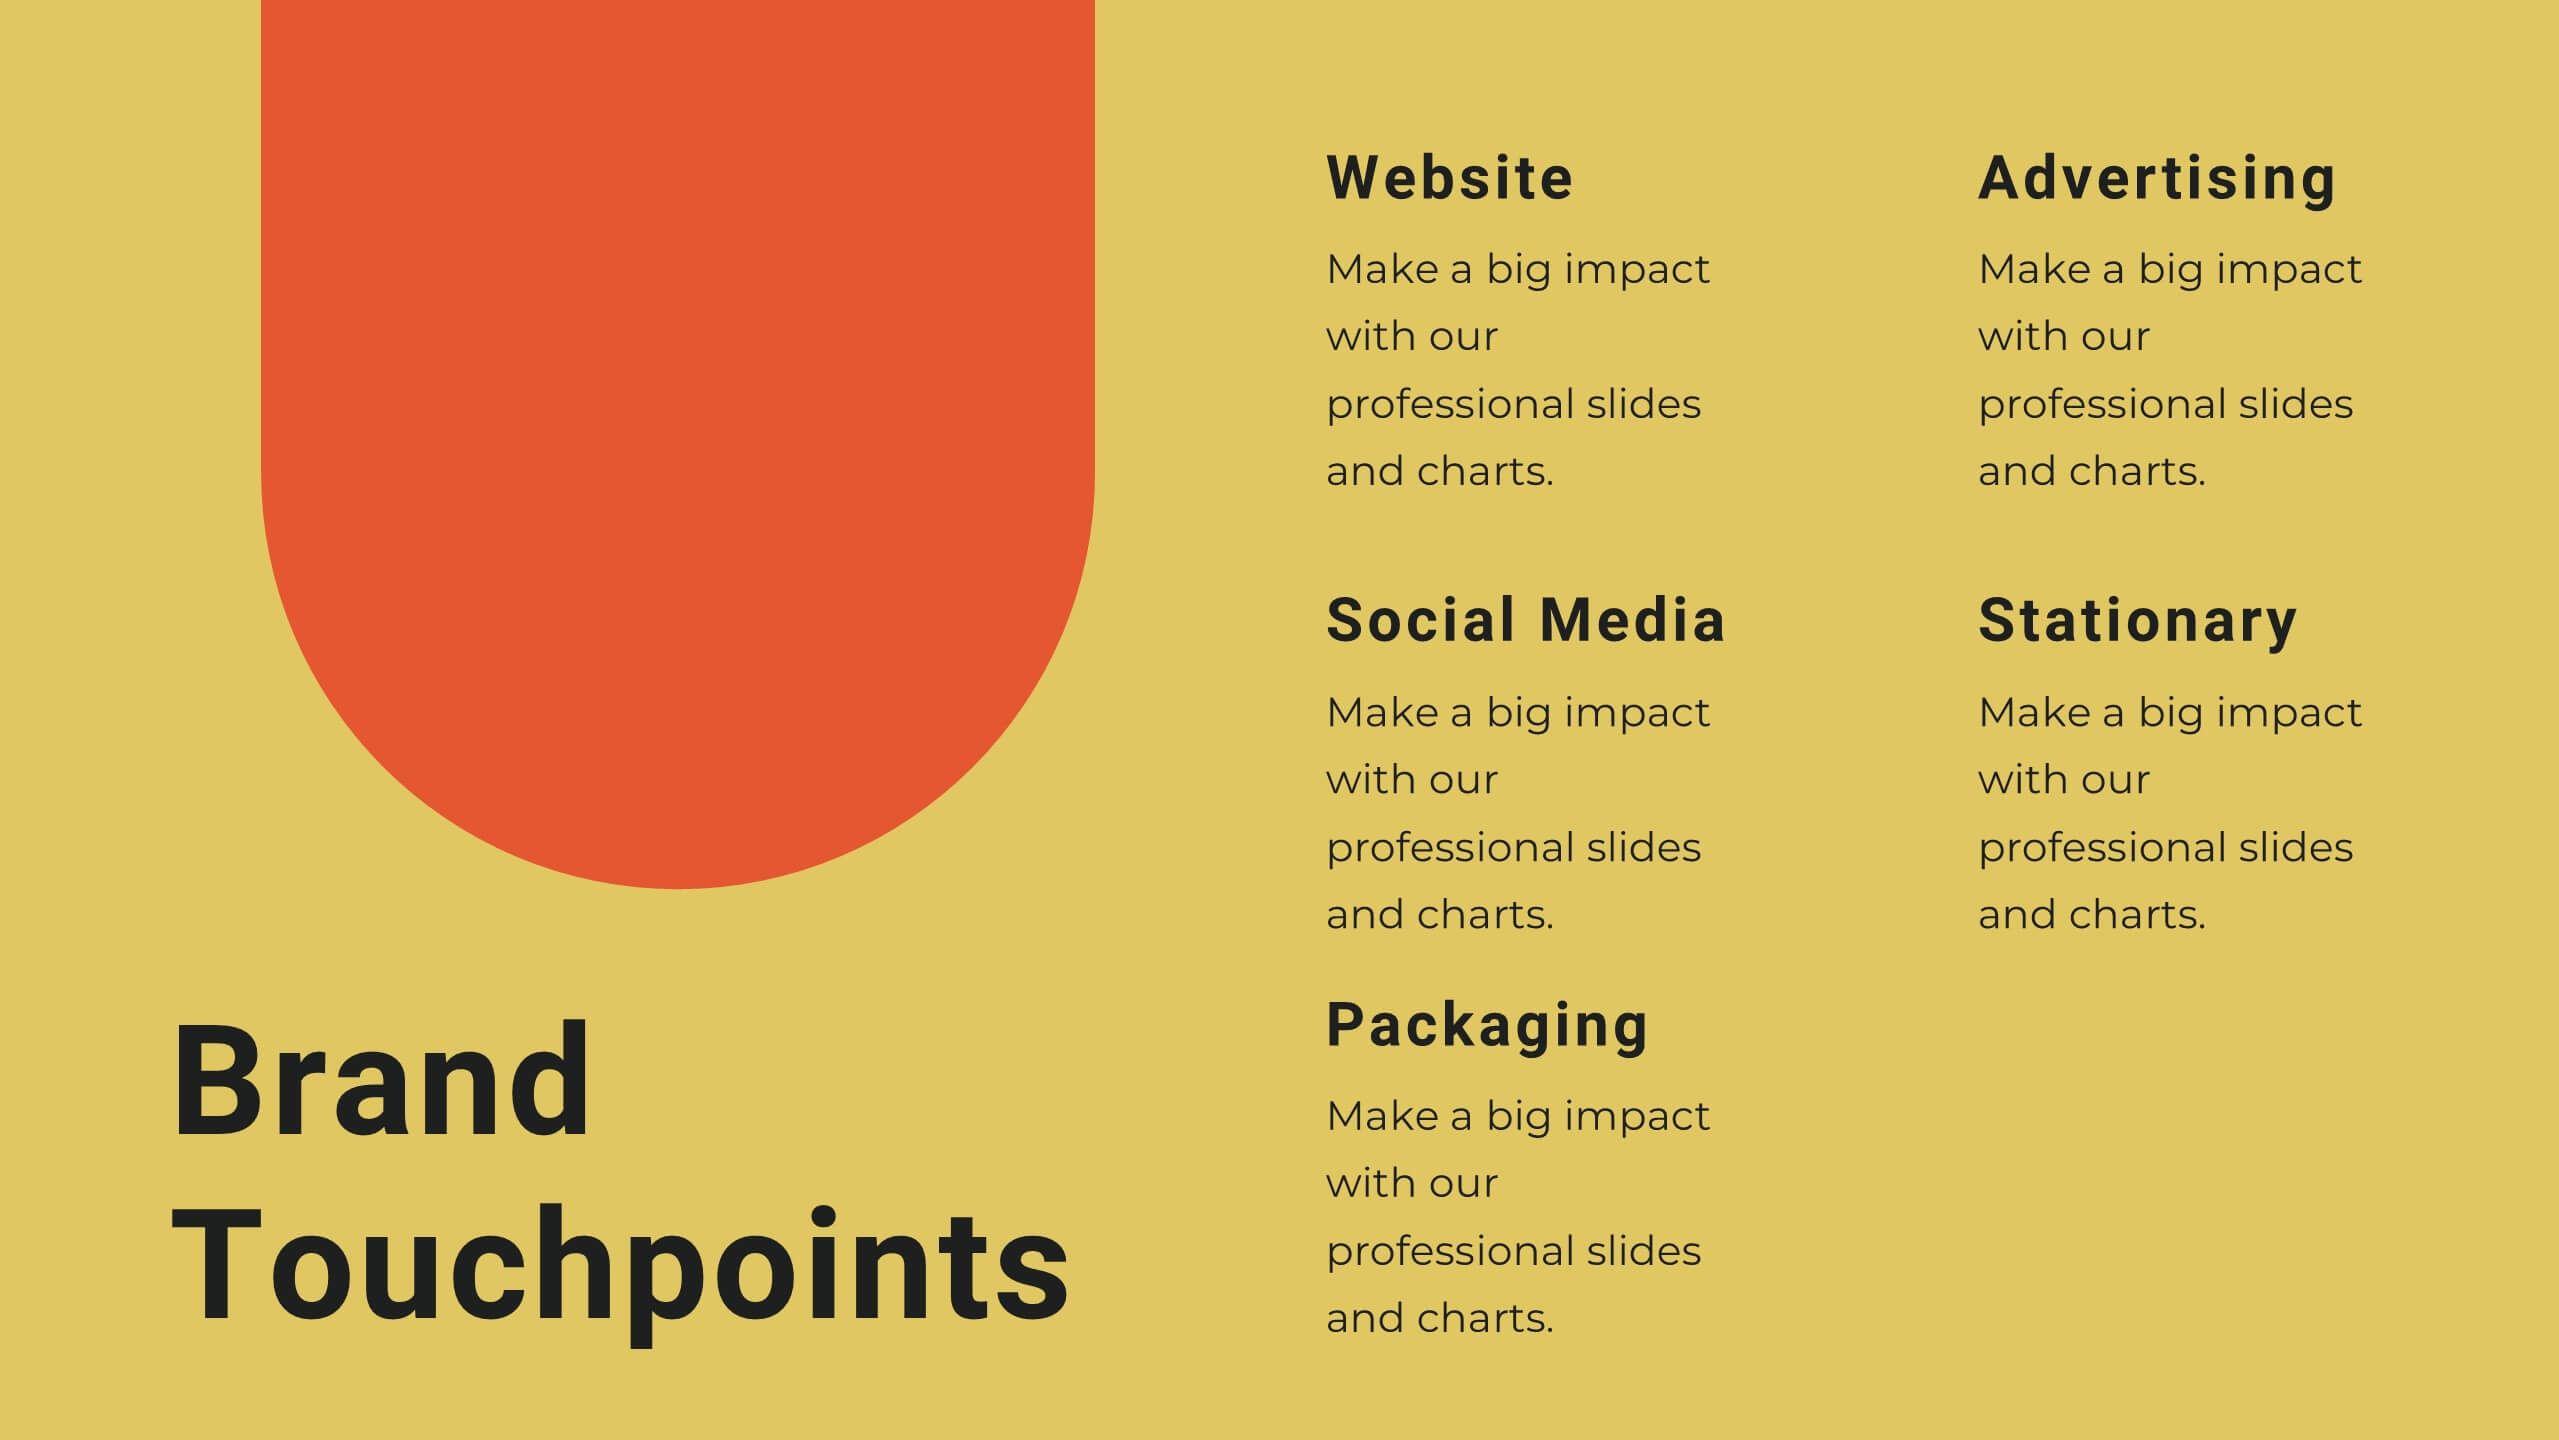
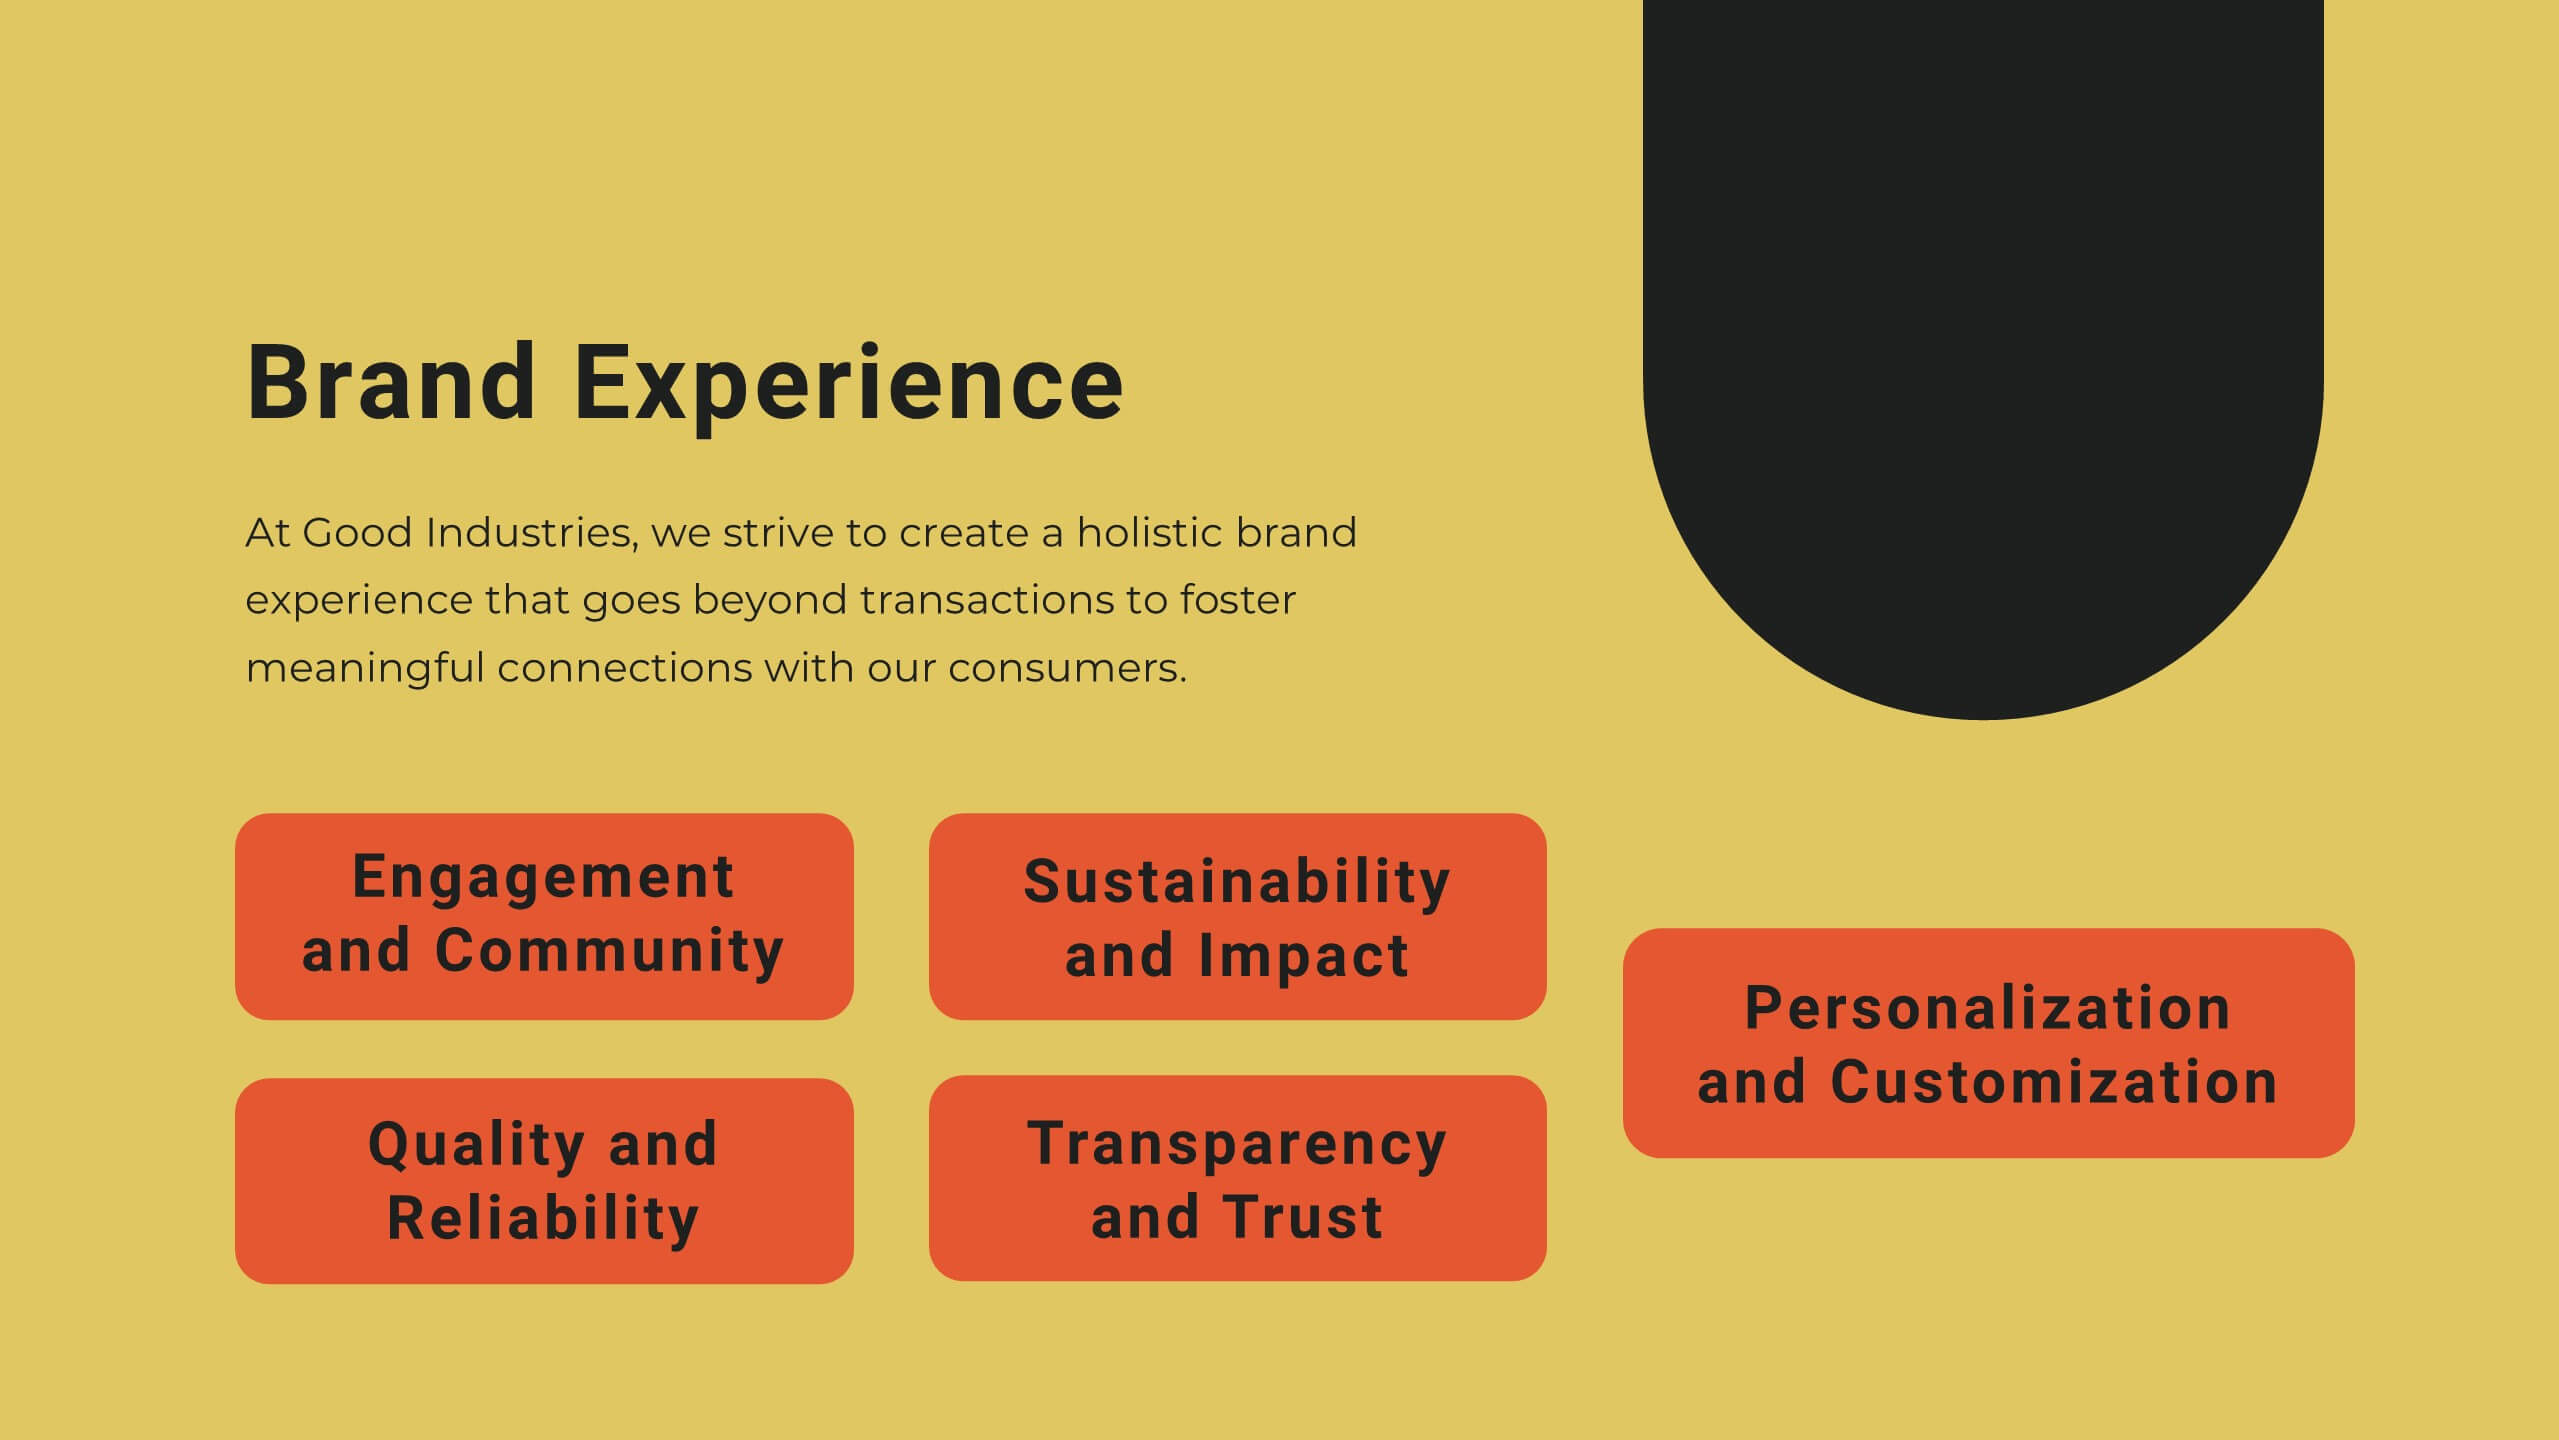
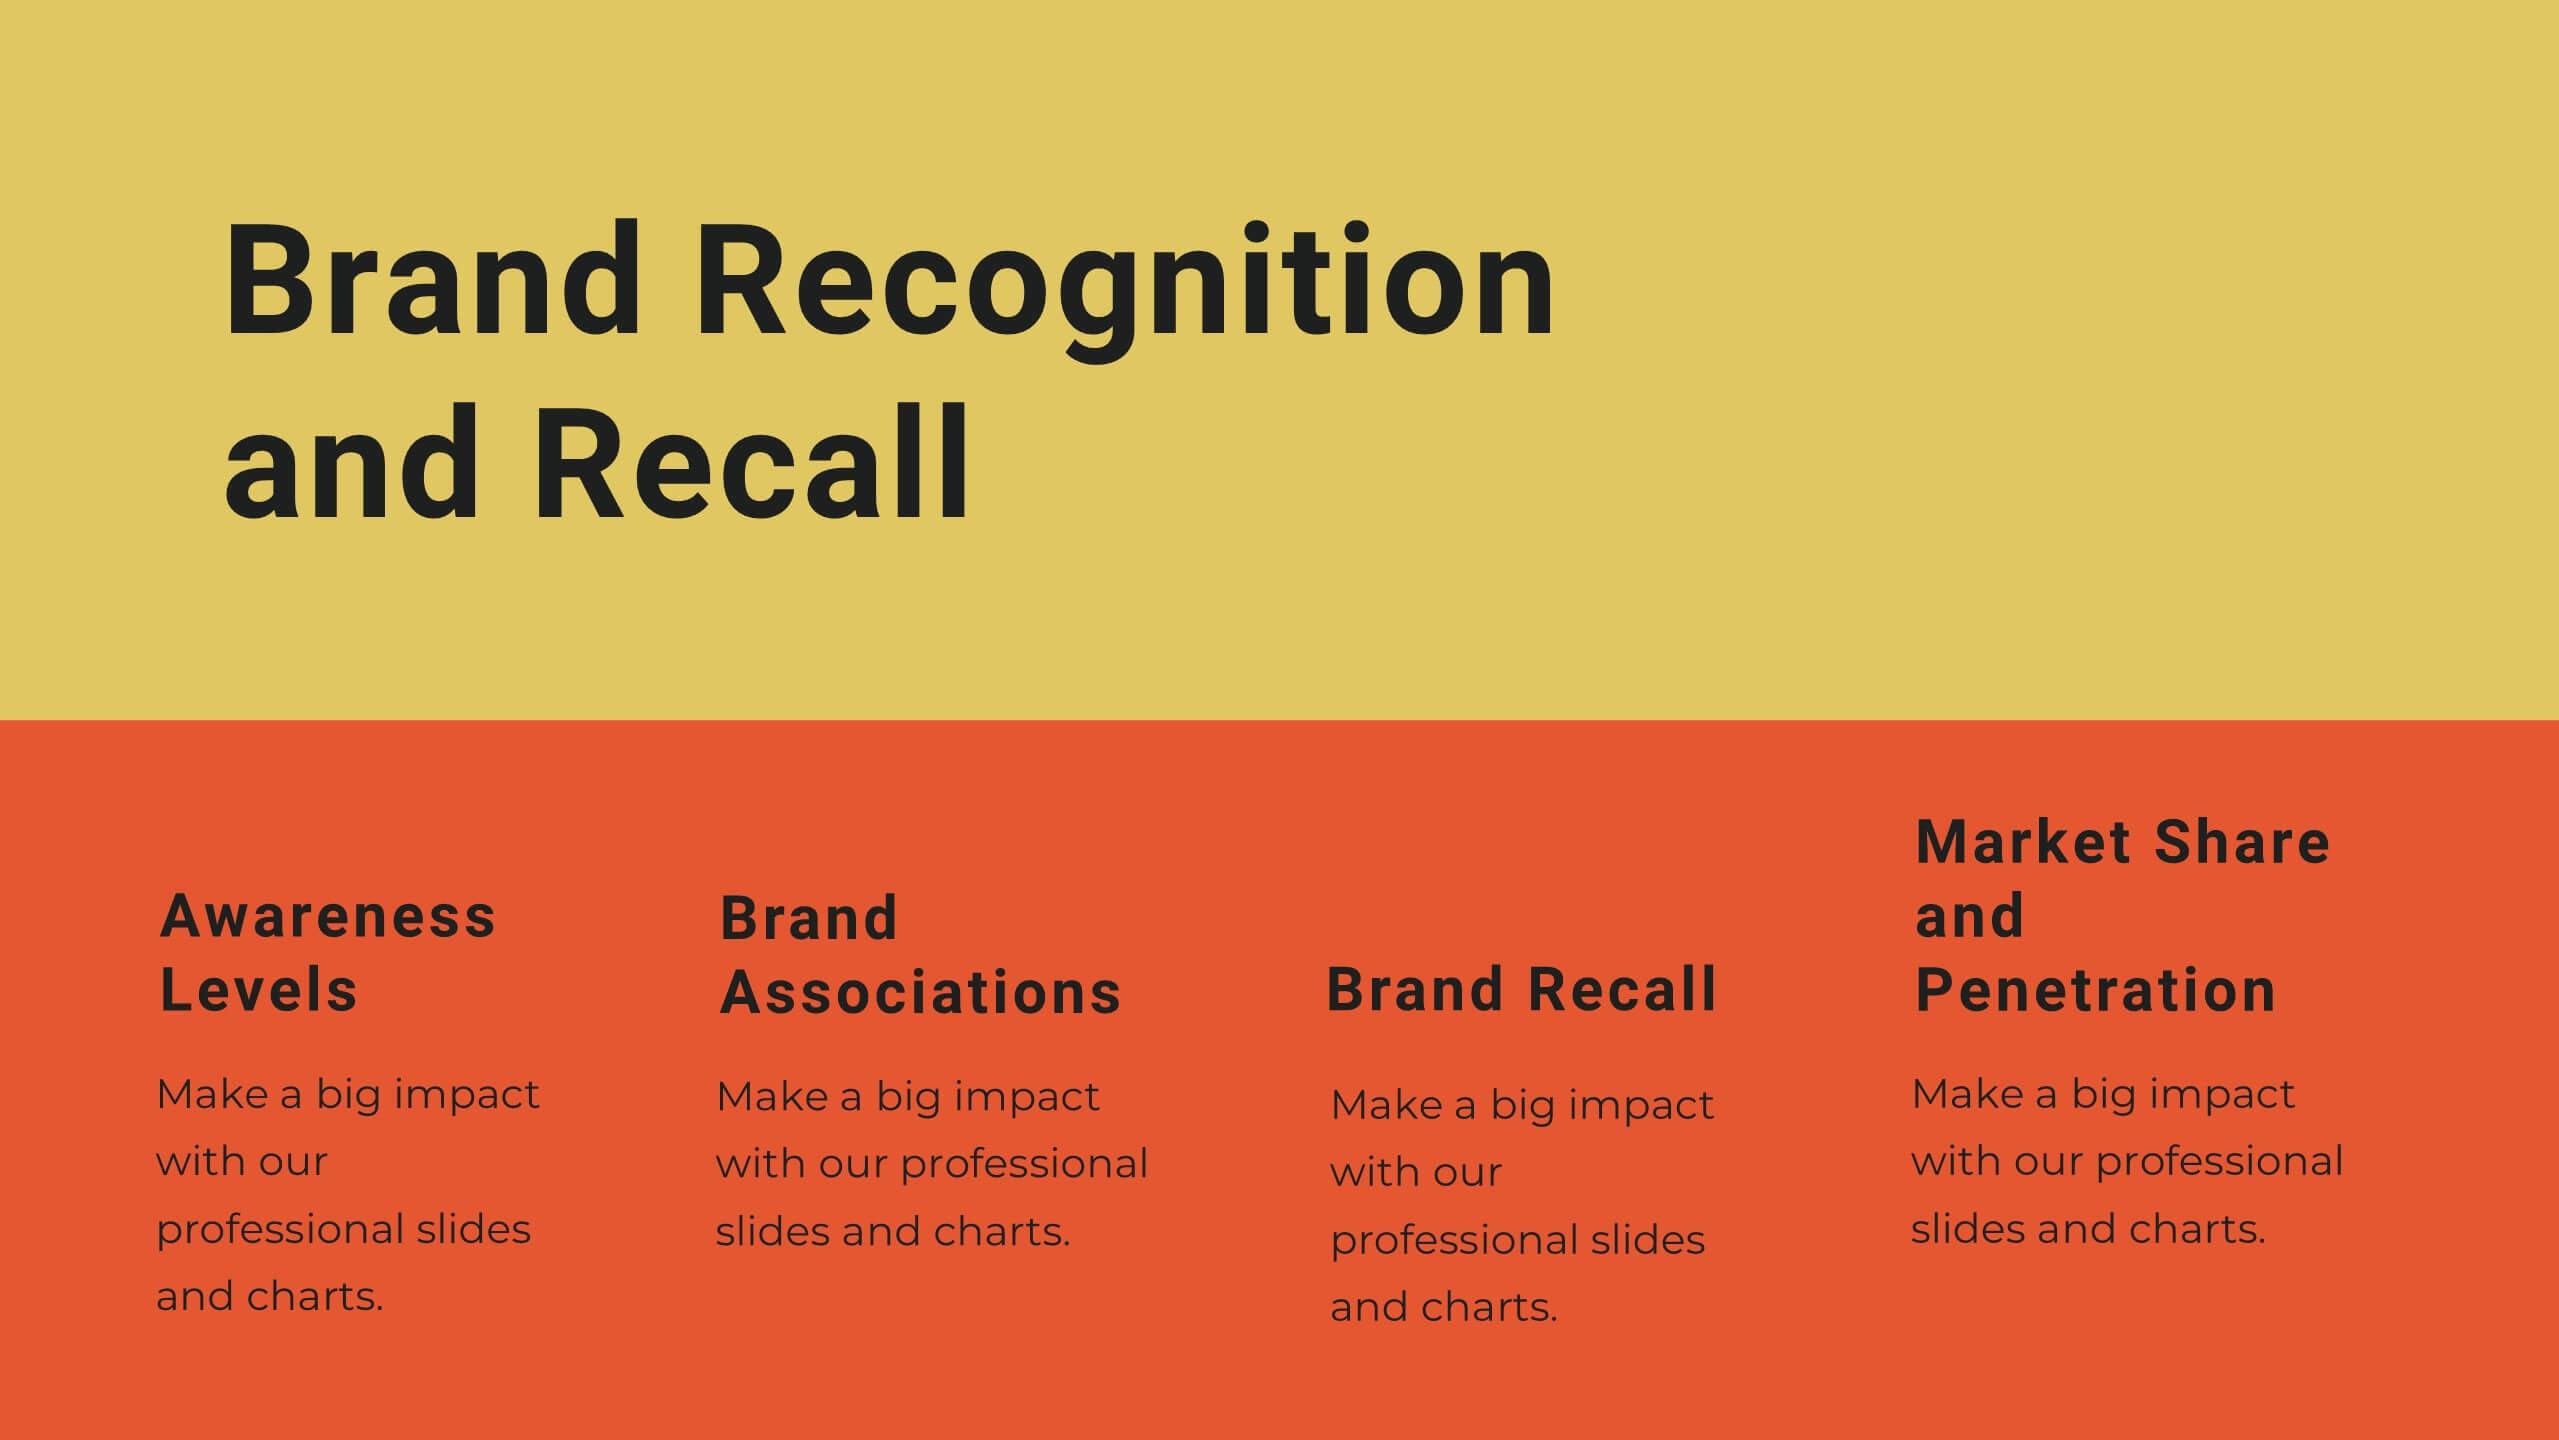
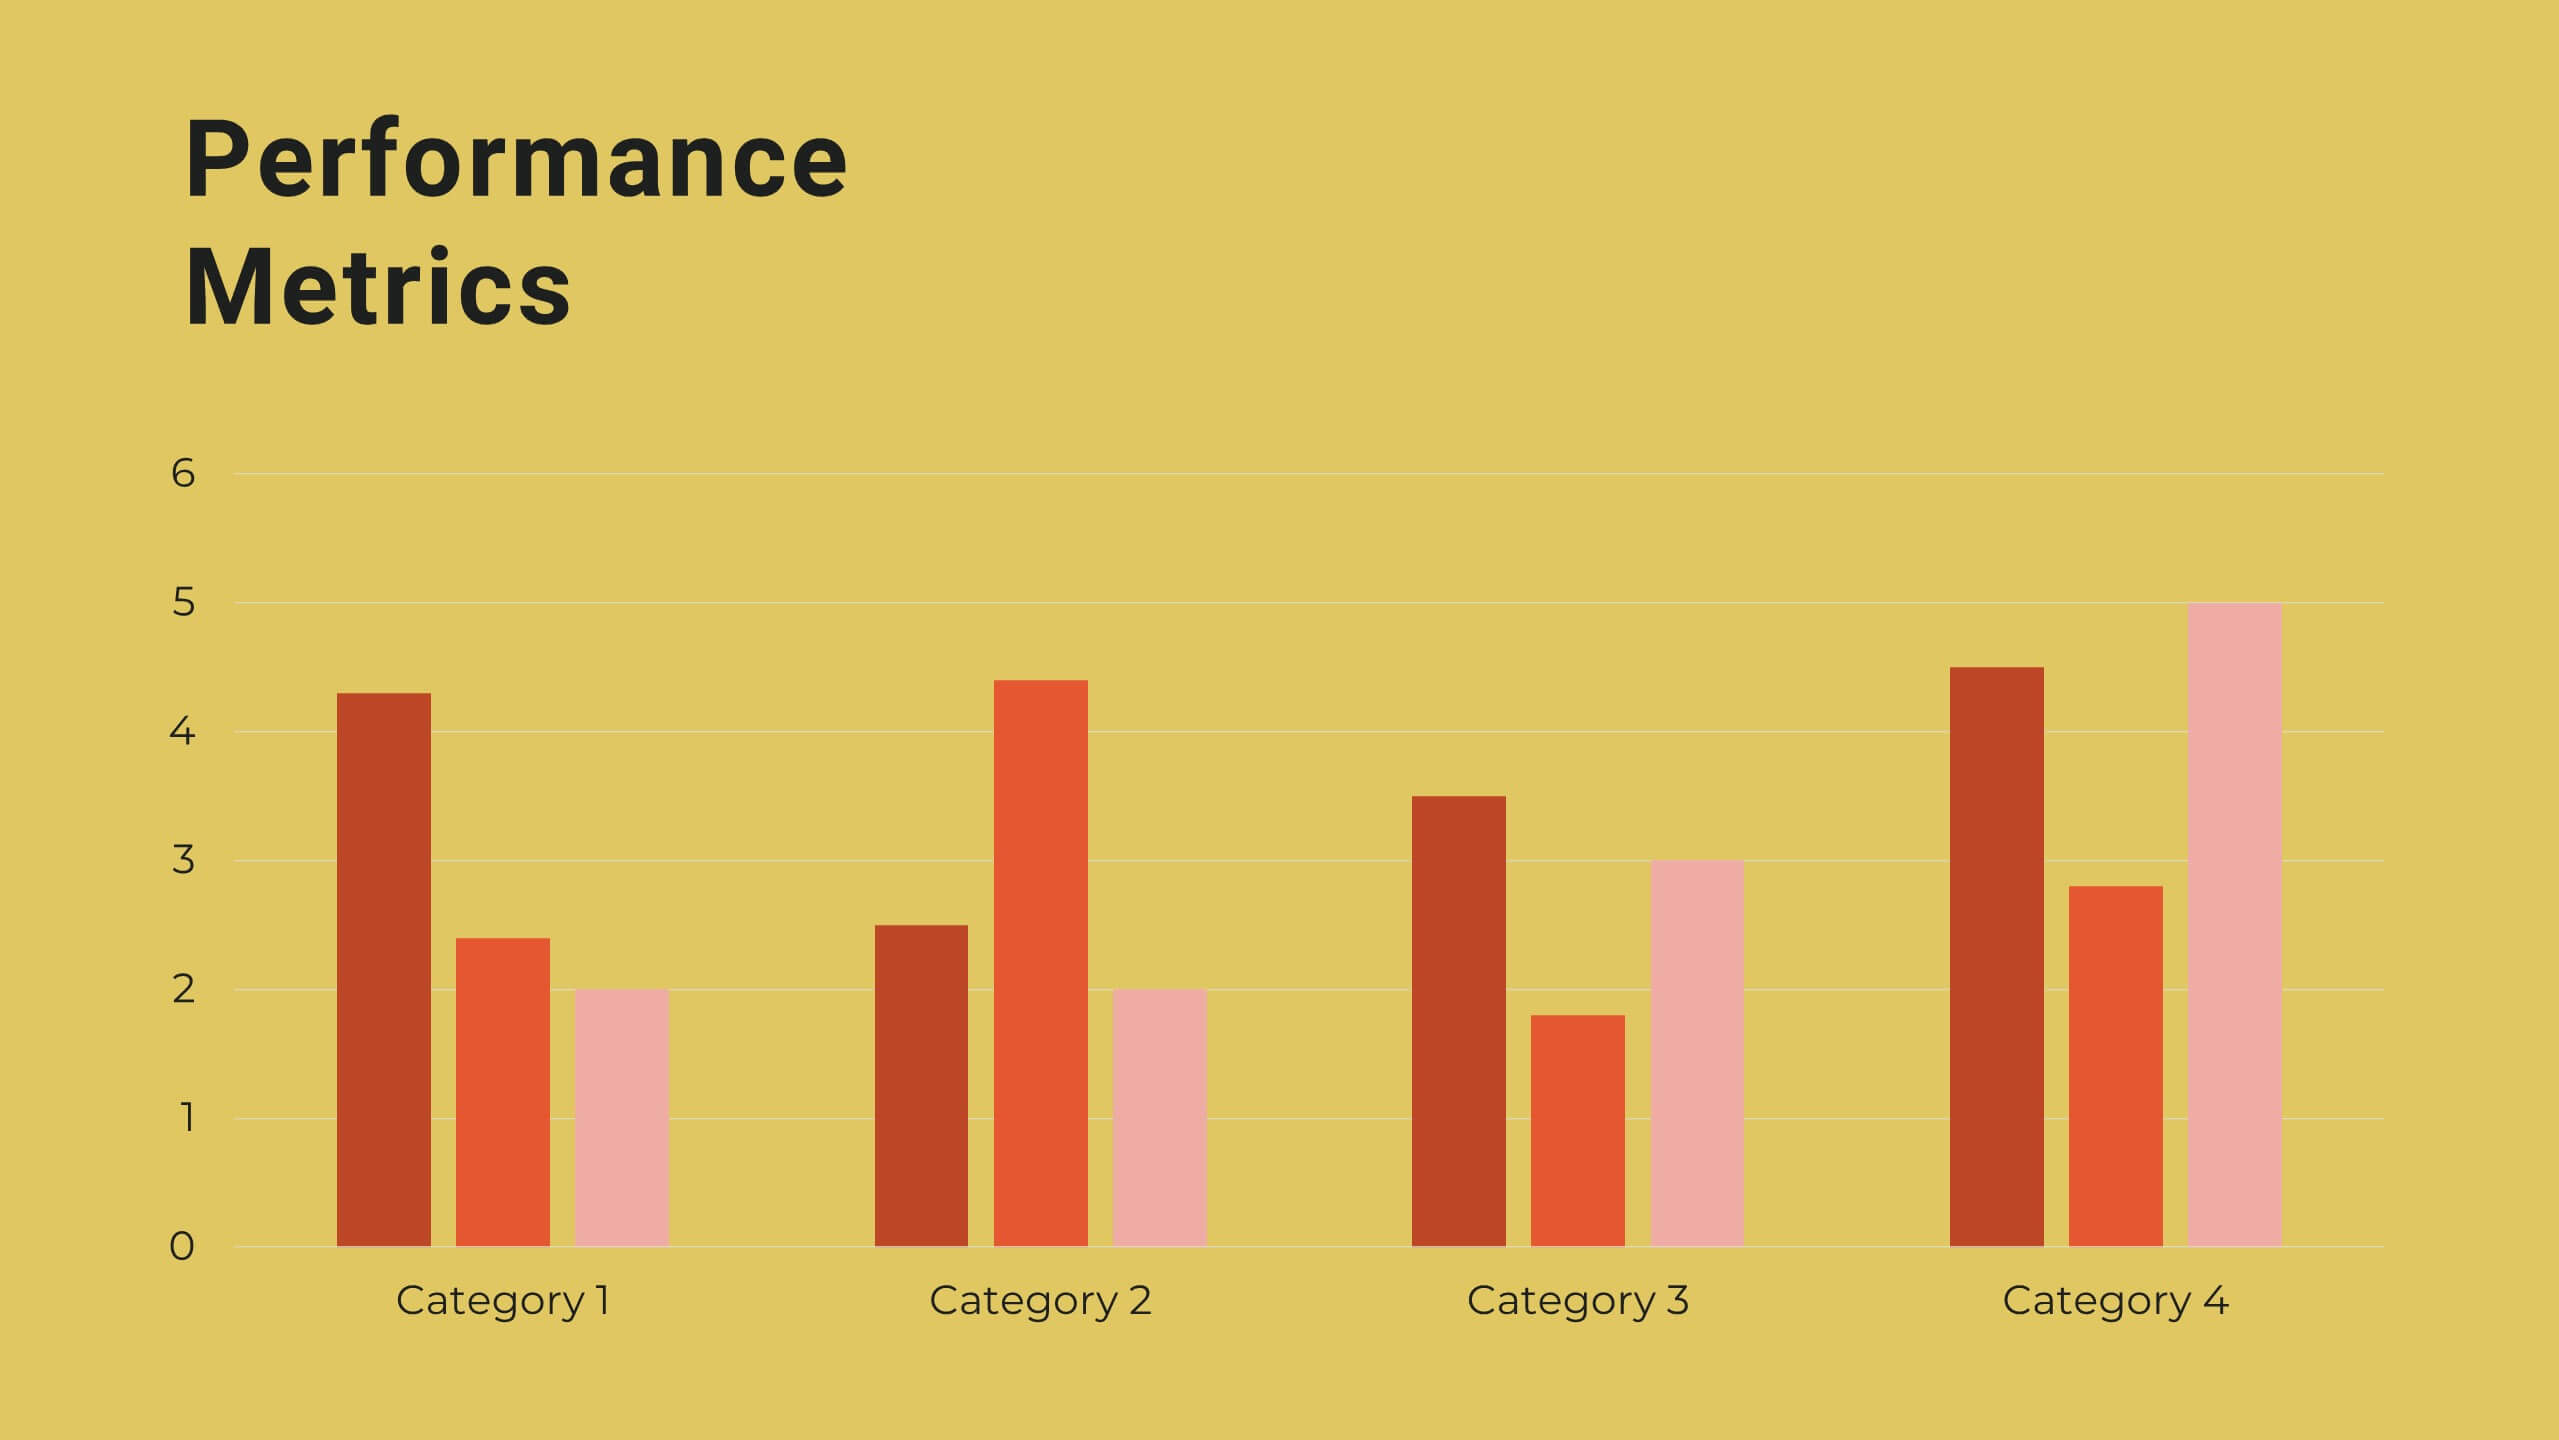
Yttrium Brand Strategy Report Presentation
Present your brand strategy with confidence using this vibrant, structured template! Covering brand identity, values, audience personas, and positioning, this template is perfect for crafting a compelling brand narrative. Fully customizable, it’s designed for seamless use in PowerPoint, Keynote, and Google Slides, making it an ideal tool for branding presentations.