


Features
- 3 Unique slides
- Fully editable and easy to edit in Microsoft Powerpoint, Keynote and Google Slides
- 16:9 widescreen layout
- Clean and professional designs
- Export to JPG, PDF or send by email


Do you have any questions?
Recommend


7 slides
Circle Target Infographic
The Circle Infographic is designed to increase the visual appeal and engagement of your content. This circle Infographics template is an awesome way to show off your data. This is a fun, colorful and energetic template that can be used for many different purposes such as business, marketing, sales and much more. This is perfect for any company that wants to show their scope, growth, and reach in a clear and concise way. The template is easy to use and customizable, so you can create your own unique infographic that shows off your brand's strengths. Easily change the colors and style to match your brand.


6 slides
Executive Leadership Training Presentation
Enhance professional development with this executive leadership training template, designed with a step-by-step staircase layout symbolizing career progression. Perfect for leadership programs, corporate training, and skill-building workshops, it visually organizes six key topics for clarity. Fully editable in Canva, PowerPoint, or Google Slides, making customization effortless for any organization’s needs.


6 slides
Brain Vector Infographic
This Brain Vector Infographic is an imaginative tool for presenting complex concepts and ideas in an easy-to-digest visual format. The design employs brain imagery to symbolize various aspects of thought processes, intelligence, brainstorming, or mental health. Its sections are strategically placed to reflect different cognitive areas, making it perfect for educational settings or business workshops focused on innovation. Fully editable and compatible with PowerPoint, Google Slides, and Keynote, this template allows for full customization, from colors to text, adapting to your unique presentation needs. Whether for academic, or personal use, this infographic simplifies conveying intricate information.


7 slides
Big Data Tools Infographic
Big Data refers to large volumes of data, both structured and unstructured, that inundate a business or organization on a day-to-day basis. This infographic template is designed to captivate, educate, and empower, providing a bold and clear representation of the sheer magnitude and impact of big data. Compatible with Powerpoint, Keynote, and Google Slides. This template involves processing and analyzing Big Data to extract meaningful insights, patterns, and trends. These insights can be used for business intelligence, decision-making, research, and various other applications across different domains and industries.


4 slides
Financial Budget Forecasting
Visualize your budget like never before with this clean, data-friendly layout designed to simplify your forecasting. The infographic-style graphics help break down financial estimates, expenses, and revenue projections into clear sections, making it ideal for reports or investor meetings. Compatible with PowerPoint, Keynote, and Google Slides.


7 slides
Cyber Security Infographic Presentation Template
Cybersecurity helps protect your business from cybercrime and unauthorized access to data. It is a crucial step to safeguard your business from malicious attacks that can lead to confidential data being stolen, as well as loss of revenue through fraudulent transactions. With this template you can ensure that you and your business are well informed on the importance of cybersecurity. This template will provide you with a good starting point to create a cybersecurity strategy. This template includes illustrations on goals, benefits, limitations and recommendations based on your audience's needs.


3 slides
Stock Market Performance Overview Presentation
Showcase financial growth like a pro with this clean, data-driven layout designed to visualize performance, market activity, and business progress over time. Ideal for professionals presenting key financial trends, metrics, or strategies. Fully compatible with PowerPoint, Keynote, and Google Slides for easy customization and professional presentation results.


5 slides
RAPID Decision-Making Roles Overview Presentation
Clarify accountability and streamline decisions with the RAPID Decision-Making Roles Overview Presentation. This visual layout breaks down the five essential roles—Recommend, Agree, Perform, Input, and Decide—into a clear quadrant diagram. Ideal for project teams, leadership alignment, or decision-making workshops. Fully editable in PowerPoint, Google Slides, Keynote, and Canva.


5 slides
Search Engine Marketing Analysis Presentation
Showcase your SEM insights with a presentation slide that’s as sharp as your strategy. This layout helps you break down ad performance, keyword data, and campaign elements clearly and visually. Perfect for marketers presenting to clients or teams, and fully compatible with PowerPoint, Keynote, and Google Slides.


21 slides
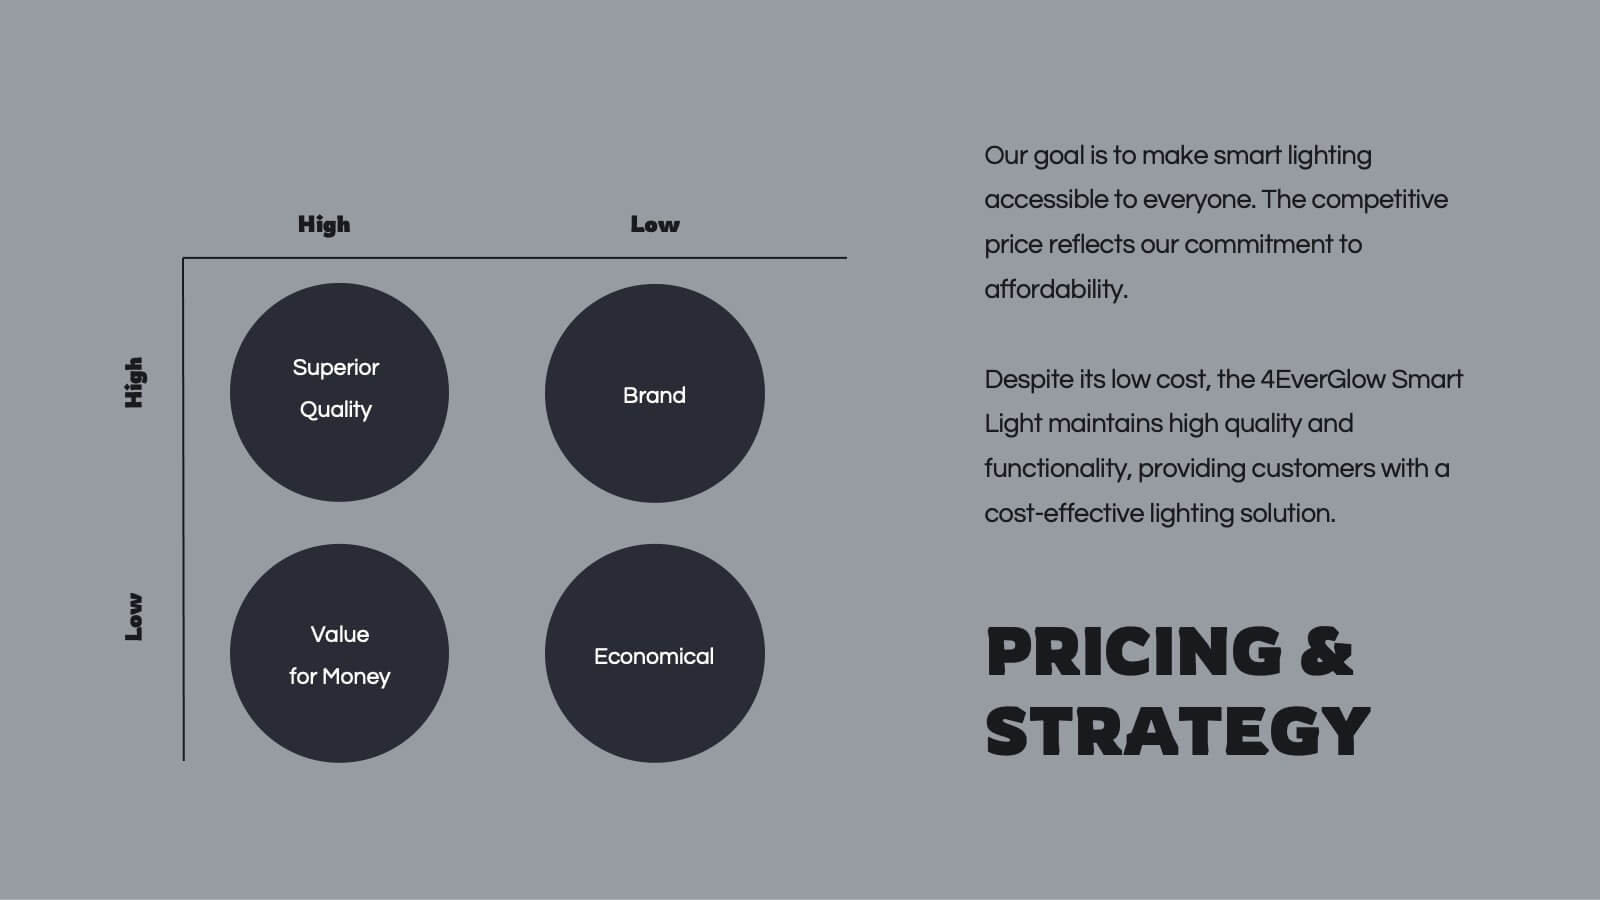
Spinel Product Strategy Report Presentation
Take your product strategy to the next level with this polished, spinel-inspired presentation! Designed to effectively communicate your product's goals, market analysis, and strategy roadmap, this template is both visually striking and easy to navigate. Its sharp design ensures a professional touch. Compatible with PowerPoint, Keynote, and Google Slides.


5 slides
Data Visualization Heat Map Presentation
Turn raw data into bold, visual stories with a colorful layout that highlights trends and performance at a glance. Perfect for illustrating analytics, performance metrics, or survey insights, this presentation makes complex data easy to read. Fully compatible with PowerPoint, Keynote, and Google Slides for smooth customization.


8 slides
Construction Project Planning Presentation
Streamline project timelines with the Construction Project Planning template. This visually structured design helps organize key phases, tasks, and milestones for efficient workflow management. Ideal for project managers and construction professionals, it enhances clarity in presentations. Fully customizable and compatible with PowerPoint, Keynote, and Google Slides for seamless integration.


12 slides
Business Environmental Factors PESTEL Analysis Presentation
Visualize critical external influences on your business strategy with this Business Environmental Factors PESTEL Analysis slide. Designed for consultants, business analysts, and executive teams, this template uses a circular layout to highlight the six core PESTEL categories—Political, Economic, Sociocultural, Technological, Environmental, and Legal. Each segment is clearly marked with icons and labels, offering space to insert key insights or impact notes. Perfect for competitive analysis, board presentations, and long-term planning. Fully editable in PowerPoint, Keynote, and Google Slides.


6 slides
Weekly Project Status Update Presentation
Keep your team aligned and your goals on track with this clear, structured layout designed to summarize weekly progress, milestones, and deliverables. Perfect for project managers and team leads, it turns updates into visuals that are easy to follow. Fully compatible with PowerPoint, Keynote, and Google Slides for smooth customization.


4 slides
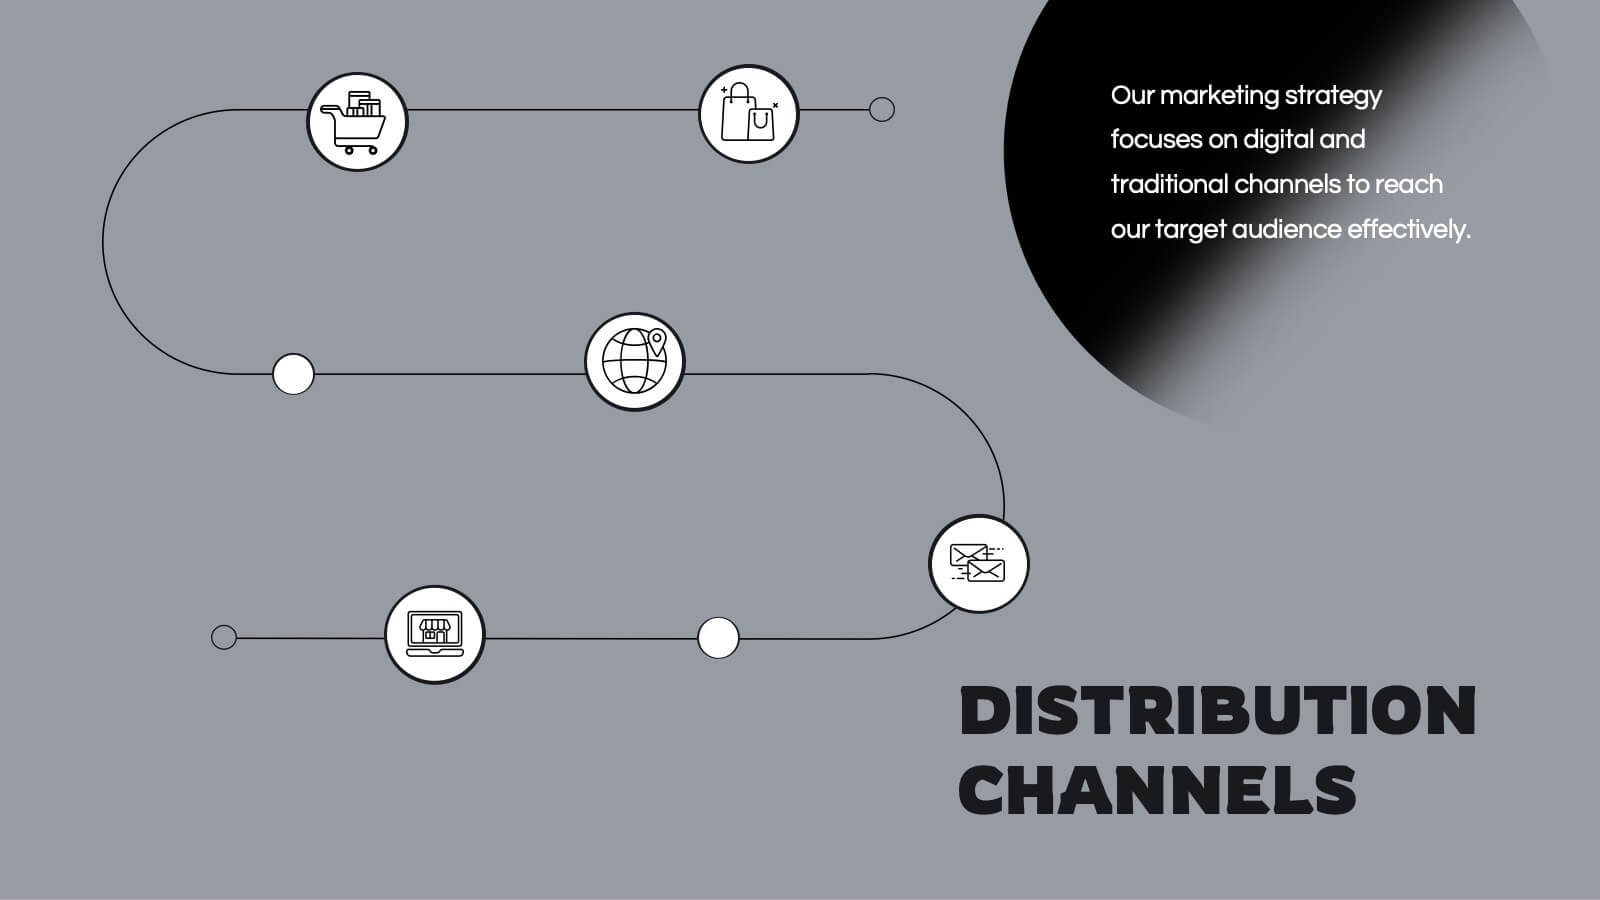
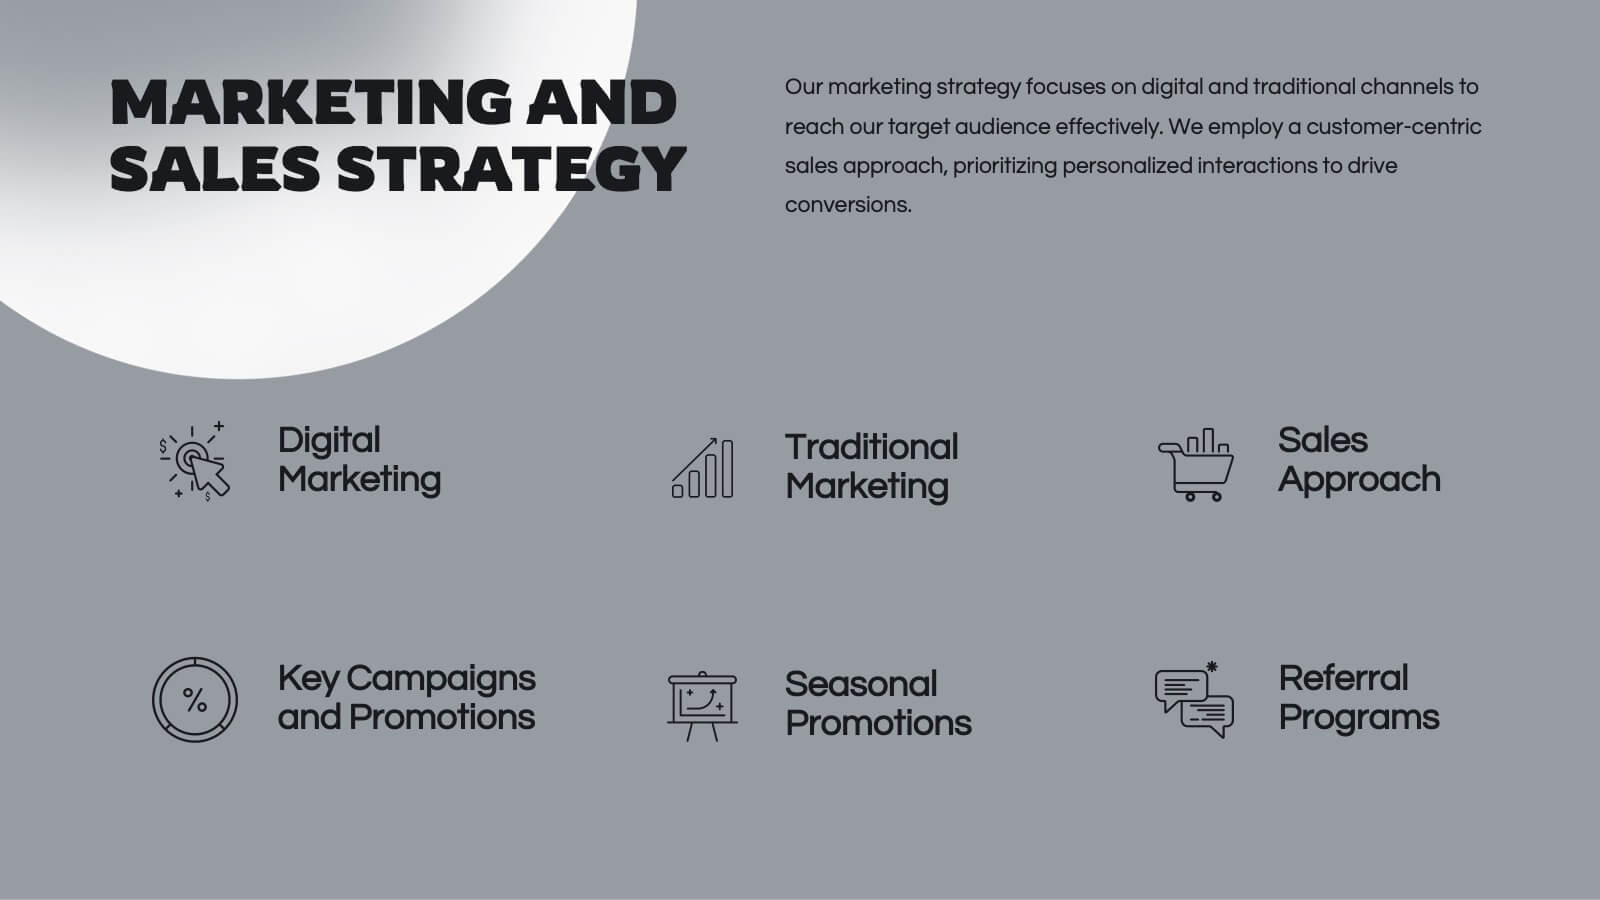
Communication Model and Channels Presentation
Illustrate how your messages move through various channels using this clean, visual communication model slide. Ideal for team briefings, marketing workflows, or internal training, it simplifies how information is shared across platforms. Fully editable in Canva, PowerPoint, and Google Slides for seamless customization to match your branding and messaging goals.


5 slides
Yoga Poses Infographics
Yoga Poses, also known as asanas, are physical postures practiced in the discipline of yoga. They are designed to promote strength, flexibility, balance, and mindfulness. These infographic templates focuses on illustrating various yoga poses and their benefits. It is designed to help individuals understand and practice different yoga poses effectively. This template features beautifully designed infographics with icons and illustrations that showcase different yoga poses. These covers a wide range of yoga, including balancing poses, Chakra yoga, standing poses, and yoga for pregnancy.


7 slides
Project Proposal Budget Infographic
Streamline your financial planning with our Project Proposal Budget Templates, designed to present detailed budgeting information clearly and effectively. These templates are tailored to help project managers and financial analysts outline costs, funding sources, and expenditure allocation, ensuring comprehensive budget proposals. Each template is methodically organized to display financial data in an accessible manner. From summarizing overall budgets to detailing individual expense categories, these slides are perfect for conveying financial strategies and expectations. The templates utilize a soothing blue color scheme, which helps maintain clarity and focus, while various charts and tables provide visual representations of numerical data. Fully customizable to align with your specific project requirements, these budget slides can be easily adapted to include your unique financial details and projections. Whether you’re pitching to stakeholders or outlining budget plans internally, these templates provide a solid foundation for your financial presentations.