Market Research Case Study Presentation
PowerPoint Template and Google Slides Theme


Features
- 4 Unique Slides
- Fully editable and easy to edit in Microsoft Powerpoint, Keynote and Google Slides
- 16:9 widescreen layout
- Clean and professional designs
- Export to JPG, PDF or send by email
- Remove from favorites
Powerpoint Template
1 MB
Google Slides Template
External link
Keynote Template
1 MB
Recommend
- Remove from favorites
Powerpoint Template
1 MB
Google Slides Template
External link
Keynote Template
1 MB
6 slides
Construction Project Timeline and Stages Presentation
Map out your project from groundbreaking to completion with the Construction Project Timeline and Stages Presentation. This visual timeline uses illustrated trucks to represent key construction phases—ideal for progress reports, planning reviews, or contractor briefings. Fully editable in PowerPoint, Keynote, and Google Slides.
- Remove from favorites
Powerpoint Template
1 MB
Google Slides Template
External link
Keynote Template
1 MB
7 slides
Root Cause Protocol Infographic Presentation
A Root Cause Infographic is a visual tool that is used to analyze and identify the underlying causes of a problem or issue. This template is perfect to use for quality control, project management, or problem-solving processes to help organizations identify the root cause of an issue and develop effective solutions. This infographic includes a series of interconnected elements or components, with the central element representing the problem or issue being analyzed. This template includes text, icons, and other graphic elements to help illustrate the relationships between different components.
- Remove from favorites
Powerpoint Template
1 MB
Google Slides Template
External link
Keynote Template
1 MB
4 slides
Executive Summary Business Presentation
Summarize key business insights effectively with this executive summary template! Designed to present an overview of your strategy, problem statement, solutions, and conclusions in a structured format, this layout ensures clarity and impact. Ideal for reports, proposals, and business plans. Fully customizable and compatible with PowerPoint, Keynote, and Google Slides.
- Remove from favorites
Powerpoint Template
1 MB
Google Slides Template
External link
Keynote Template
1 MB
6 slides
Go-to-Market Launch Plan Presentation
Launch with confidence using this Go-to-Market Launch Plan Presentation. This clean, step-by-step visual framework highlights each phase of your GTM strategy—from market research to execution metrics. Ideal for startups, product managers, and marketing teams. Fully customizable in PowerPoint, Keynote, and Google Slides.
- Remove from favorites
Powerpoint Template
1 MB
Google Slides Template
External link
Keynote Template
2 MB
7 slides
Aviation Management Infographic
Aviation management encompasses the effective and efficient operation of various facets within the aviation industry. This vibrant and informative infographic is designed to take you through the skies of efficient aviation operations and successful management strategies. Compatible with Powerpoint, Keynote, and Google Slides. This template involves planning, organizing, directing, and coordinating the activities of airlines, airports, and other organizations related to aviation and aerospace. The featured jet visuals symbolizes the aviation industry's movement and efficiency, setting the tone for the informative adventure.
- Remove from favorites
Powerpoint Template
1 MB
Google Slides Template
External link
Keynote Template
2 MB
10 slides
Agile Scrum Framework Presentations
Kickstart your workflow with a clear, energetic layout designed to simplify complex processes and highlight each stage of your agile cycle. This presentation explains how iterative teamwork, transparency, and fast delivery shape efficient project management. Clean visuals guide viewers through structured steps. Compatible with PowerPoint, Keynote, and Google Slides.
- Remove from favorites
Powerpoint Template
1 MB
Google Slides Template
External link
Keynote Template
2 MB
8 slides
Customer Market Segmentation Analysis
Visualize your audience insights with precision using the Customer Market Segmentation Analysis Presentation. This slide features a sleek, layered funnel design with percentage bars and arrow pointers—ideal for illustrating demographic splits, buyer behavior, or psychographic segments. With space for four data-driven categories and custom labels, this template is perfect for marketers, analysts, and product teams looking to present actionable customer data. Fully editable in PowerPoint, Keynote, and Google Slides, and easy to adapt to any color scheme or branding.
- Remove from favorites
Powerpoint Template
1 MB
Google Slides Template
External link
Keynote Template
1 MB
6 slides
End-to-End Value Chain Process Presentation
Visualize every link in your process with the End-to-End Value Chain Process Presentation. This modern chain diagram helps illustrate each stage of your business or production flow—from initial input to final output. It's ideal for strategy, supply chain, and operational planning. Fully editable in PowerPoint, Keynote, Canva, or Google Slides.
- Remove from favorites
Powerpoint Template
1 MB
Google Slides Template
External link
Keynote Template
2 MB
7 slides
Team Work Skills Infographic Presentation
Teamwork is vital in the success of any venture. A team of people may be more powerful and productive than an individual. This template is designed to showcase all of your team work skills and abilities in an easy to follow structure. It uses icons, relevant graphics and vibrant colors. This Template will help you deliver your message with ease and style, enhancing the impact of your speech, whether in a solo performance or with a large audience. With this infographic your information is represented using geometric shapes, line graphs, pie charts, and more. Showcases your teamwork skills!
- Remove from favorites
Powerpoint Template
9 MB
Google Slides Template
External link
Keynote Template
7 MB
26 slides
Gala Event Program Presentation
Step into the splendor of high society with our Gala Event presentation template, tailored for PowerPoint, Keynote, and Google Slides. This template is exquisitely designed for event organizers, charitable foundations, and corporate hosts planning an elegant evening of fundraising or celebration. It's crafted to capture the essence of a sophisticated event with its sleek design and elegant color scheme. Invite your guests to a night of enchantment with 'big image slides' showcasing the venue's grandeur or the evening's entertainment. Utilize 'chart slides' to detail fundraising goals or 'timeline infographics' to outline the evening's schedule. Each slide serves as an invitation to experience the magic of the gala. Our Gala Event template is your canvas to paint an unforgettable evening. It's more than a presentation tool; it's a way to build anticipation, convey the purpose of the event, and leave a lasting impression of the night's allure. Download it now and let each slide be a step down the red carpet.
- Remove from favorites
Powerpoint Template
4 MB
Google Slides Template
External link
Keynote Template
5 MB
6 slides
Creative Interior Design Portfolio Showcase Presentation
Showcase your creativity with the Creative Design Portfolio Showcase presentation. This template is perfect for graphic designers, architects, and creative professionals looking to display their work in a visually compelling format. Featuring modern layouts, high-quality image placeholders, and structured text sections, it allows for easy customization to highlight key insights. Fully compatible with PowerPoint, Keynote, and Google Slides.
- Remove from favorites
Powerpoint Template
1 MB
Google Slides Template
External link
Keynote Template
2 MB
4 slides
Modern Company Profile Layout Presentation
Bring your brand to life with this clean and modern layout built to highlight your company’s mission, values, and team. Its balanced design and easy-to-read sections make every detail stand out beautifully. Fully editable and compatible with PowerPoint, Keynote, and Google Slides for smooth customization and professional presentations.
- Remove from favorites
Powerpoint Template
1 MB
Google Slides Template
External link
Keynote Template
1 MB
4 slides
Visual Relationships in Venn Format Presentation
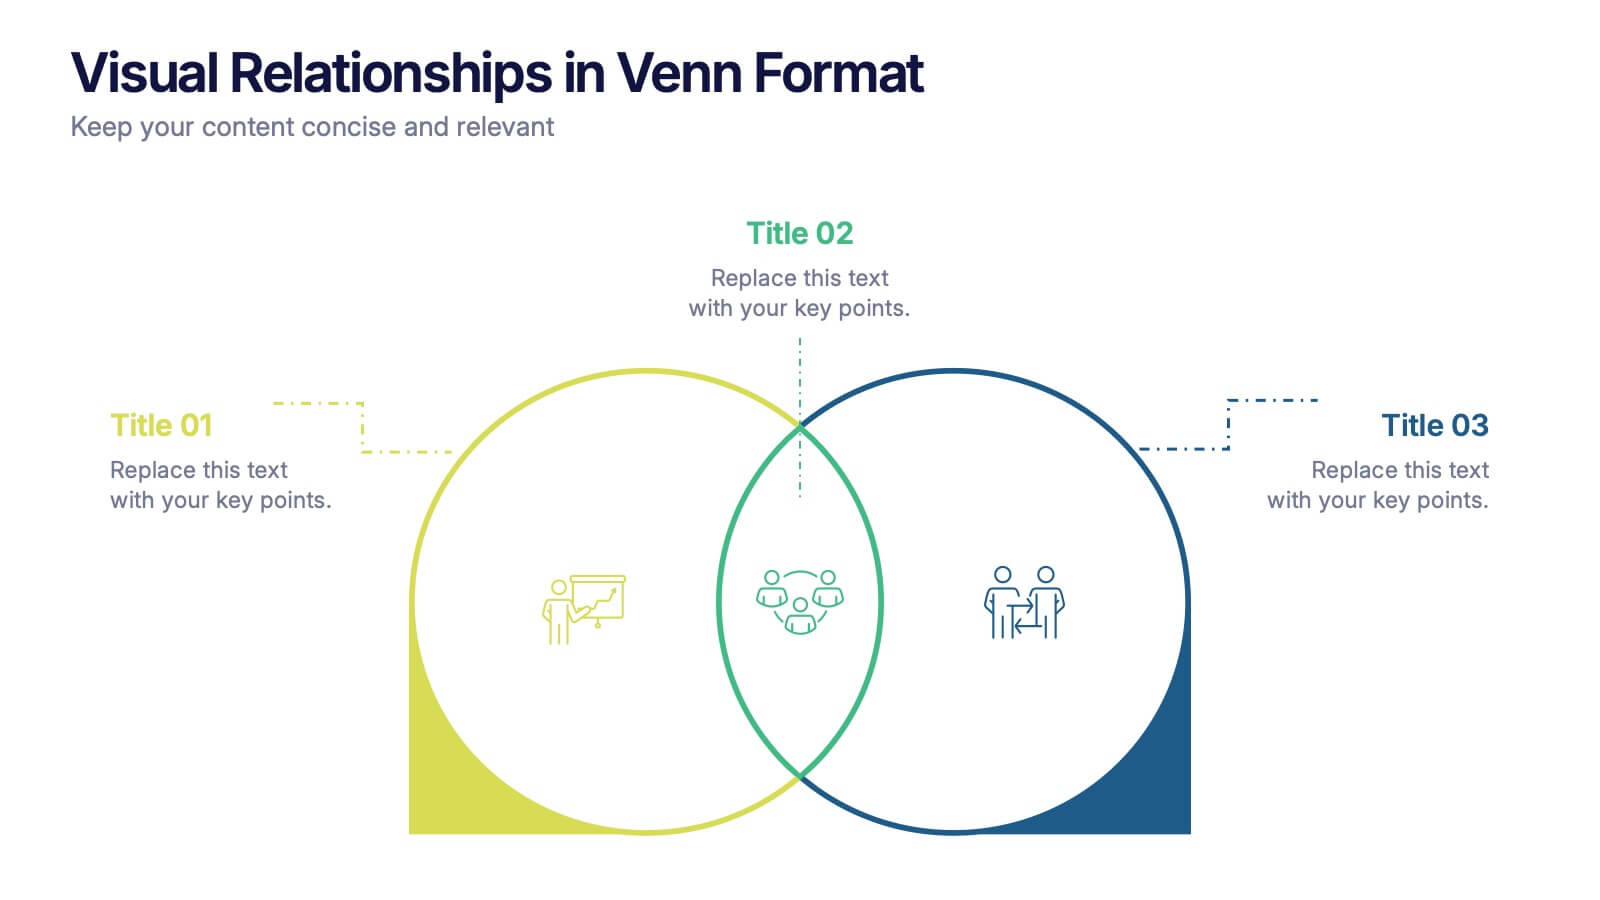
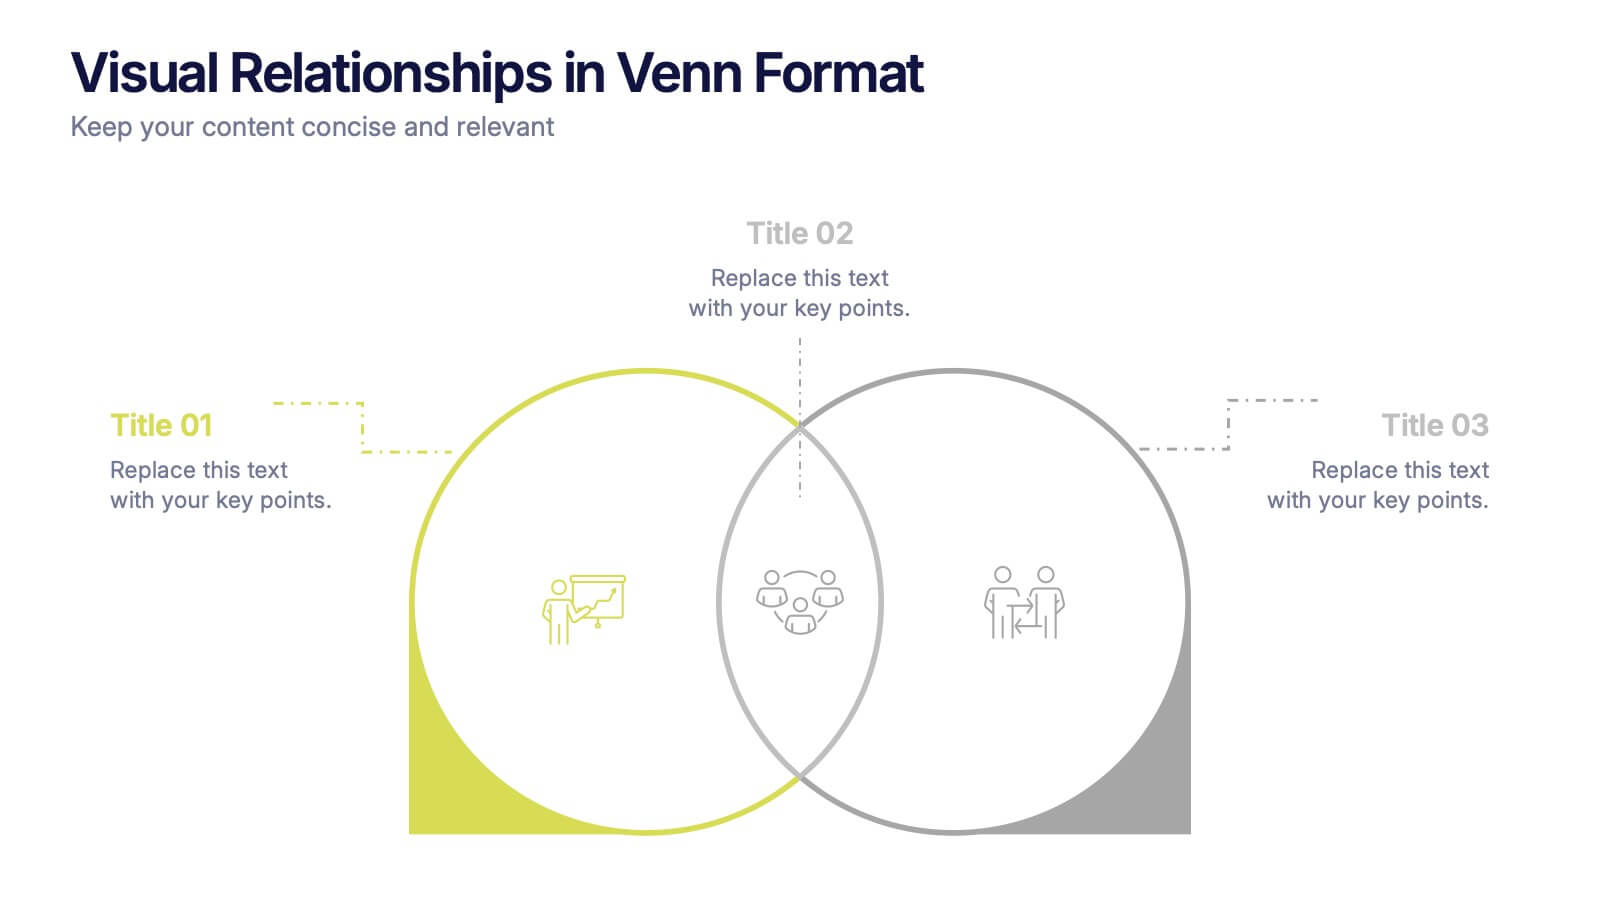
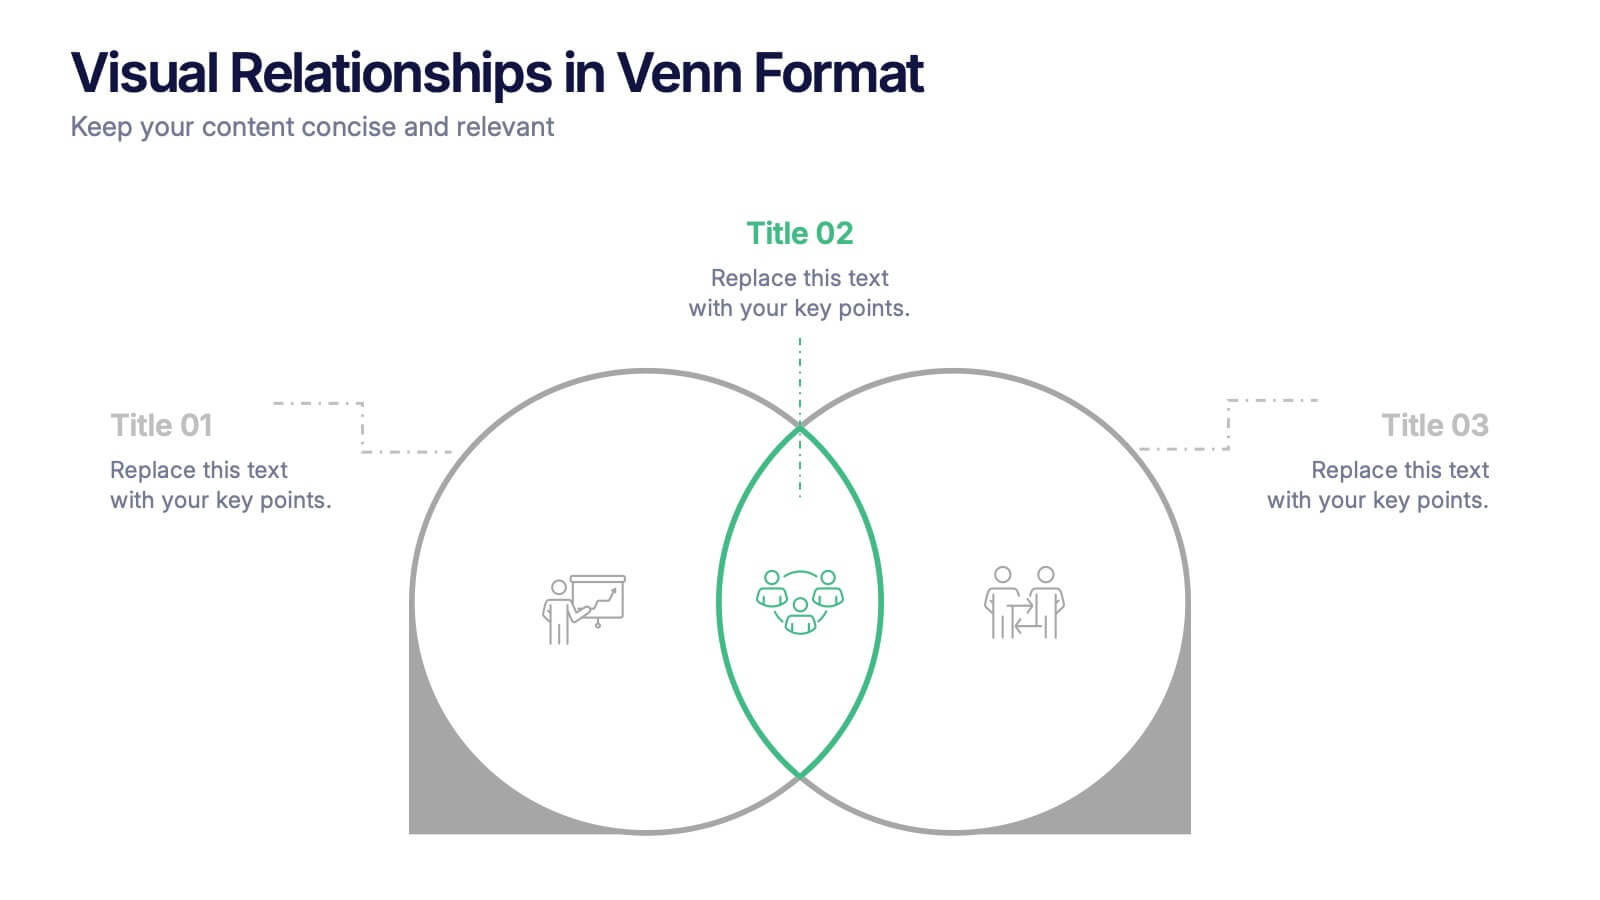
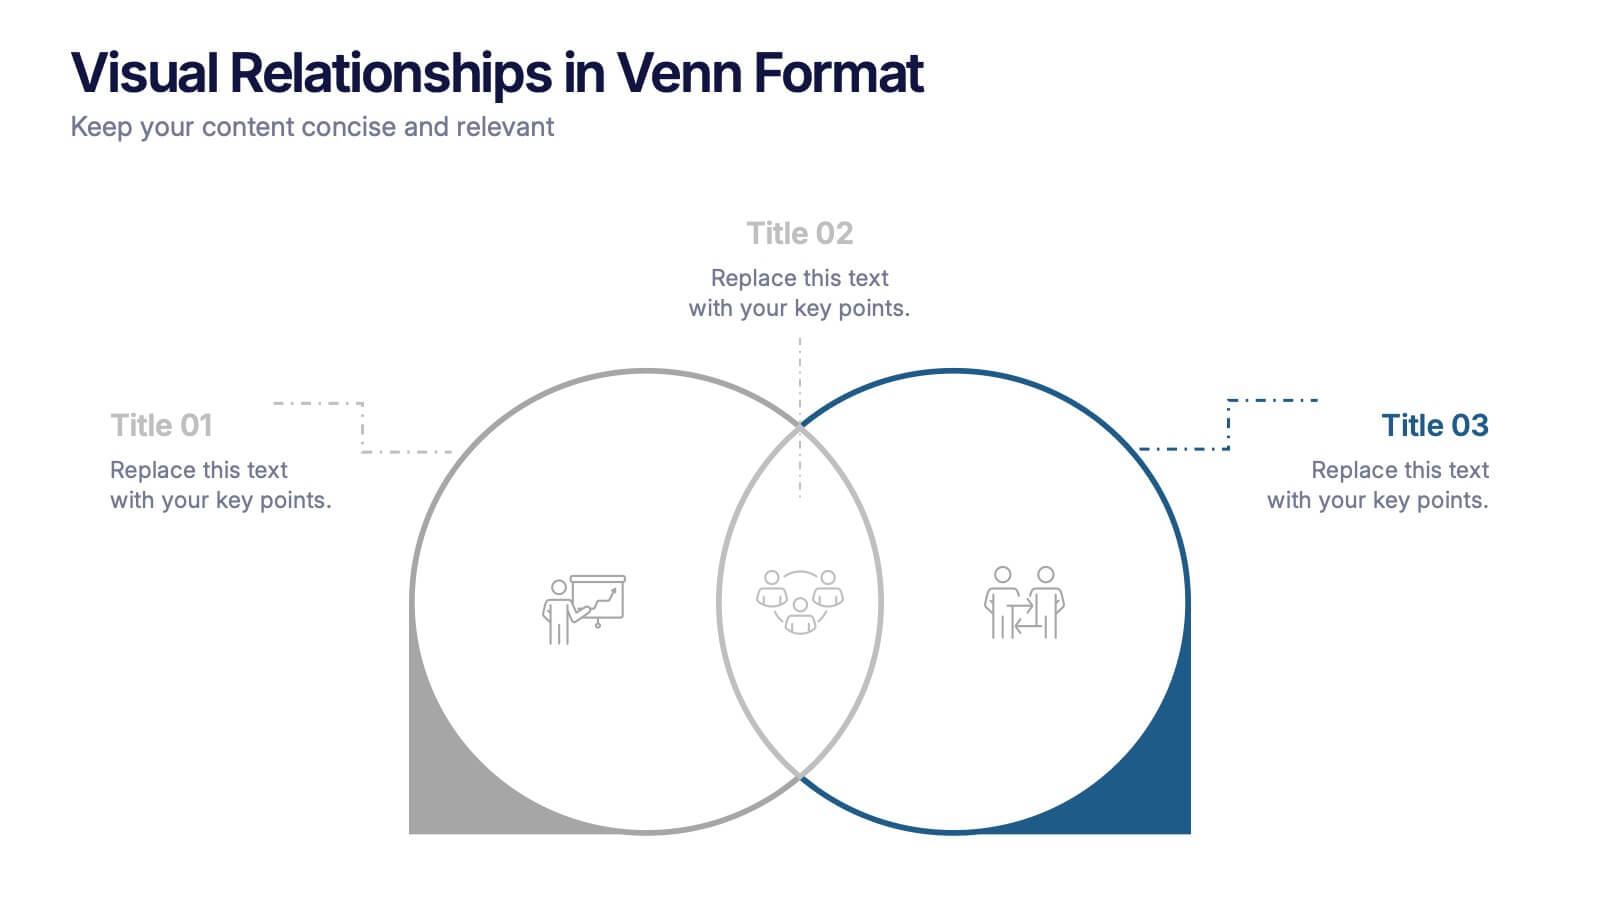
Highlight similarities and differences between two or more ideas using this clean, two-circle Venn diagram layout. Ideal for comparing concepts, teams, or strategies. Customize icons, text, and color themes effortlessly. Compatible with PowerPoint, Keynote, and Google Slides—perfect for business meetings, educational content, and marketing comparisons.
- Remove from favorites
Powerpoint Template
1 MB
Google Slides Template
External link
Keynote Template
1 MB
4 slides
Total Addressable Market Strategy Presentation
Define Your Market Potential with this Total Addressable Market Strategy presentation template. This visually structured design effectively breaks down TAM, SAM, and SOM using Venn diagrams and clear segmentation to help businesses analyze market opportunities and define realistic growth targets. Ideal for startups, investors, and business strategists, this fully editable template is compatible with PowerPoint, Keynote, and Google Slides, ensuring seamless customization for market research, pitch decks, and financial planning.
- Remove from favorites
Powerpoint Template
1 MB
Google Slides Template
External link
Keynote Template
1 MB
5 slides
Big Data Interpretation and Metrics Presentation
Break down complex data into digestible segments with the Big Data Interpretation and Metrics Presentation. Featuring a puzzle-inspired layout, this template is ideal for illustrating interconnected data points, analytics strategies, or metric-based frameworks. Fully customizable in PowerPoint, Keynote, and Google Slides.
- Remove from favorites
Powerpoint Template
1 MB
Google Slides Template
External link
Keynote Template
1 MB
4 slides
Turning Ideas into Impact Presentation
Showcase your transformation journey from concept to achievement with this bold visual layout. The three-step diagram—idea, action, success—makes it ideal for project planning, product development, or strategic execution. Easily editable in PowerPoint, Keynote, and Google Slides for pitch decks, business roadmaps, or innovation workflows. Clean, modern, and impactful.
- Remove from favorites
Powerpoint Template
1 MB
Google Slides Template
External link
Keynote Template
1 MB
6 slides
PESTEL Analysis Business Presentation
The "PESTEL Analysis Business Presentation" template effectively facilitates a comprehensive review of the political, economic, social, technological, environmental, and legal factors that impact strategic business decisions. This template is designed to help strategists, analysts, and managers evaluate and present external factors that could affect their business operations and market environment. Each segment of the analysis is visually represented through connected circles, making complex data easily understandable. This layout encourages a structured discussion on each PESTEL aspect, ensuring that all critical elements are covered, making it an essential tool for businesses looking to align their strategies with external conditions.


