
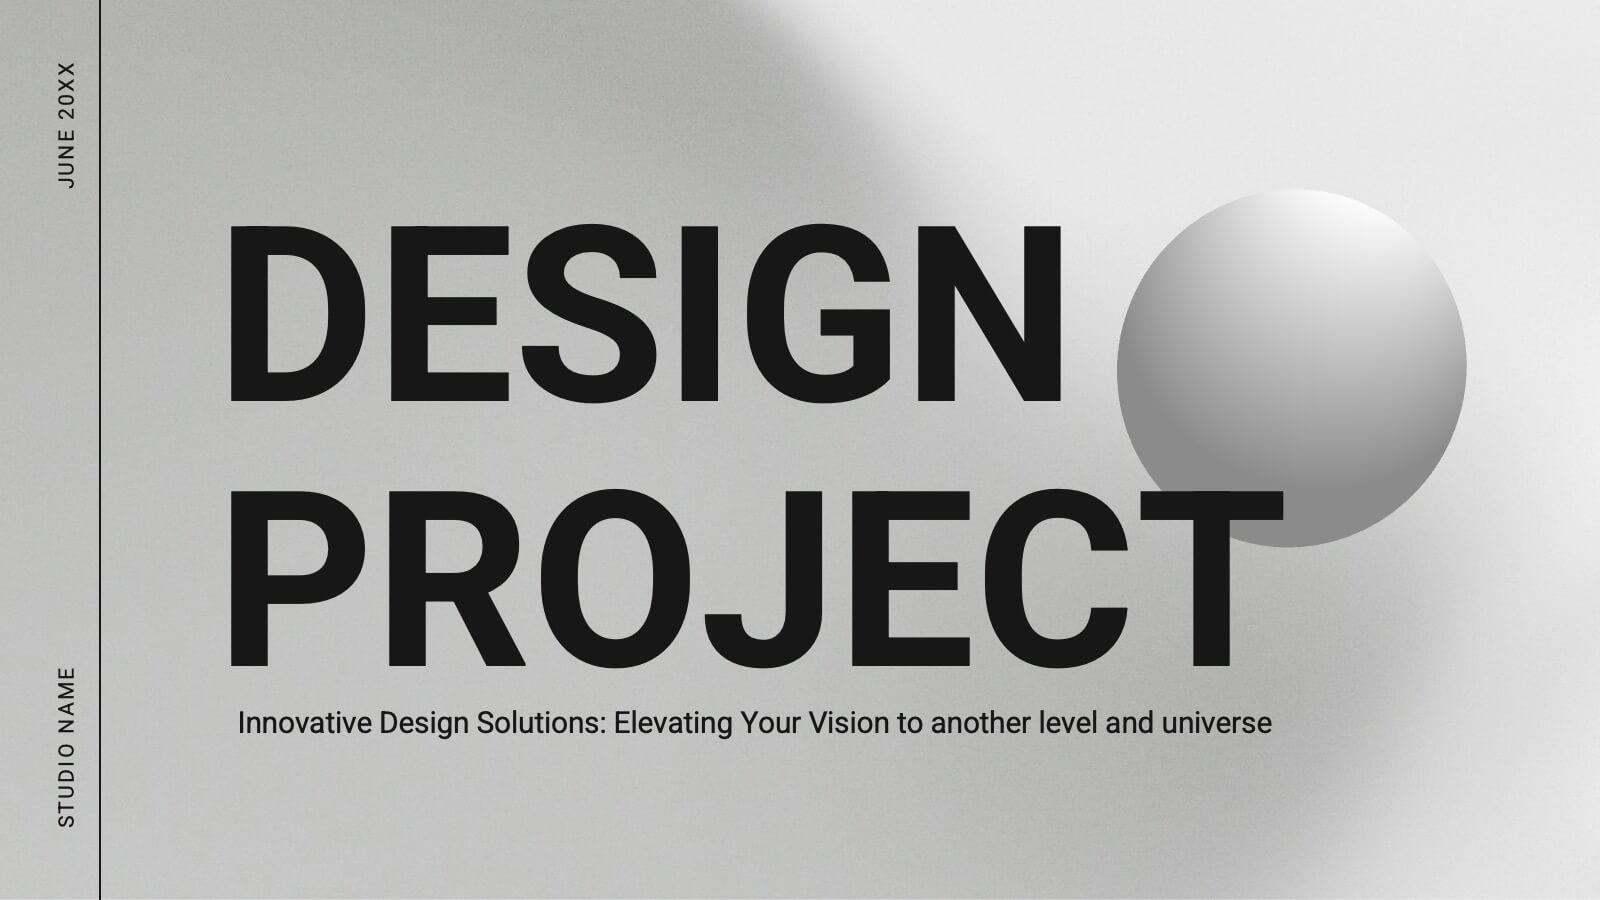
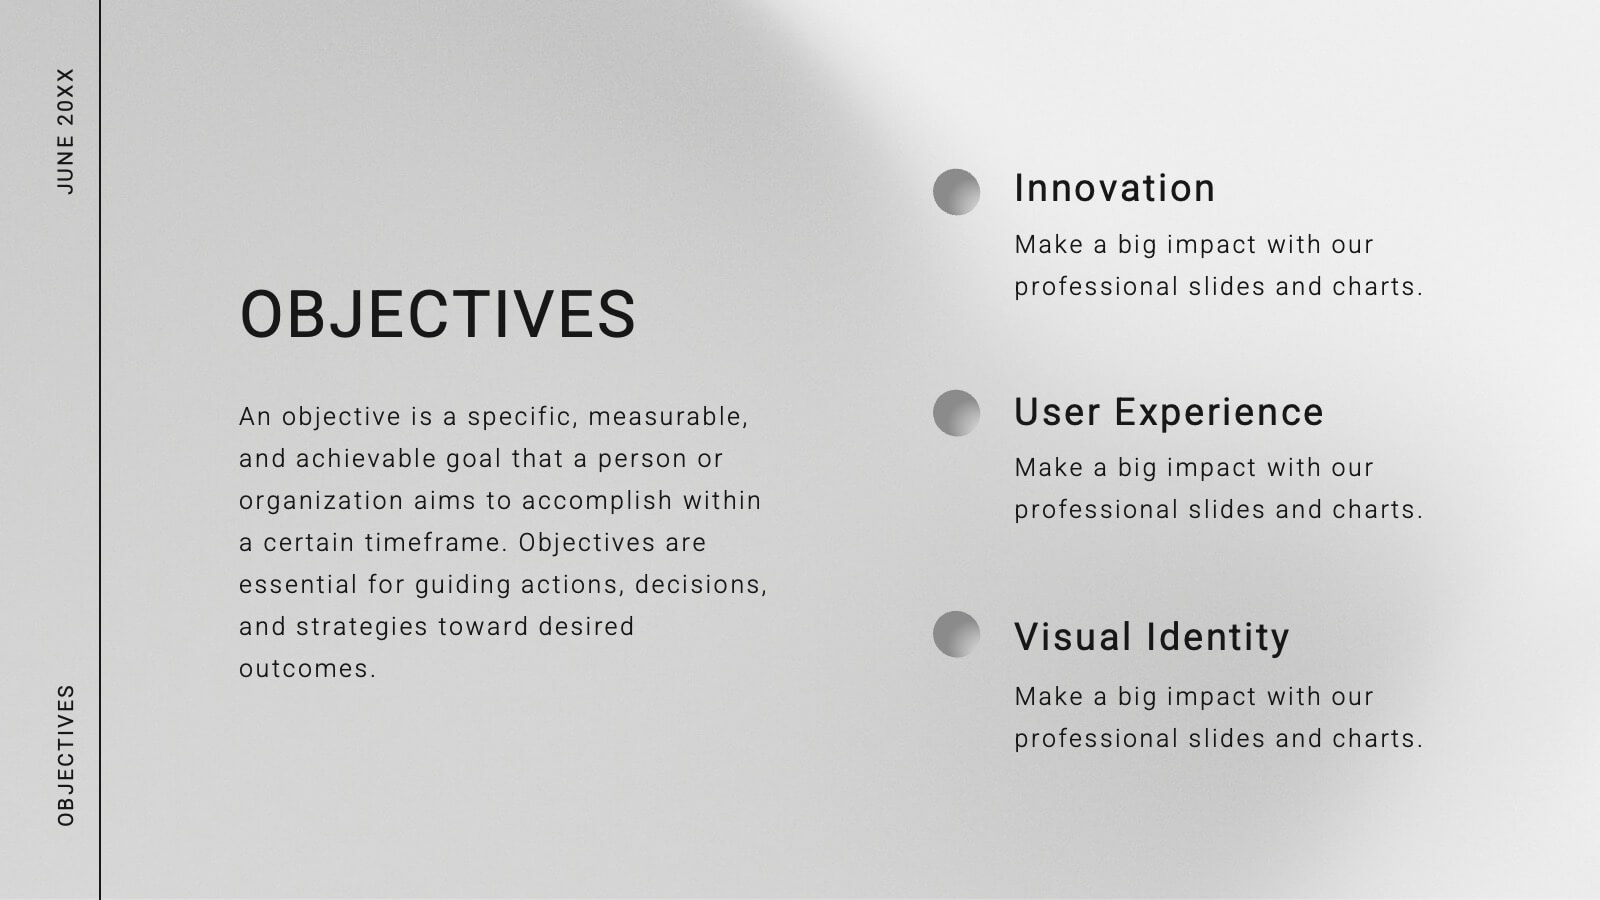
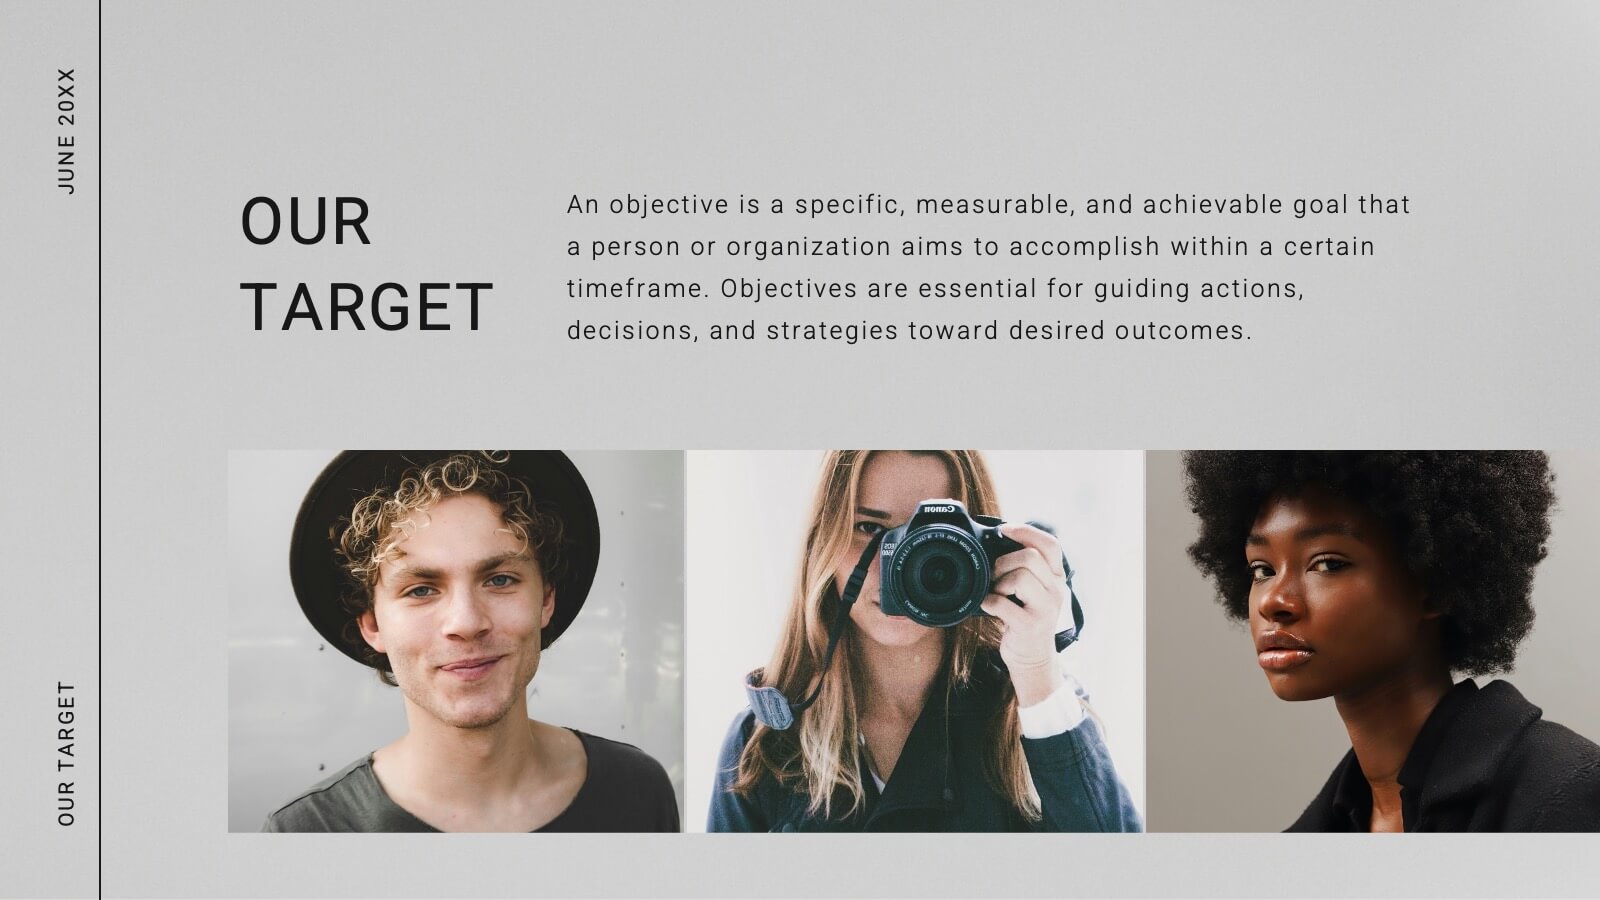
Features
- 6 Unique slides
- Fully editable and easy to edit in Microsoft Powerpoint, Keynote and Google Slides
- 16:9 widescreen layout
- Clean and professional designs
- Export to JPG, PDF or send by email


Do you have any questions?
Recommend


6 slides
Science Project Infographic
Science projects are hands-on activities designed to explore and investigate scientific concepts. This infographic template aims to communicate complex scientific information in a visually appealing and easy-to-understand manner. The infographic provides an overview of the project's key elements, including the question, hypothesis, materials, procedure, results, and conclusion. This serves as a creative and engaging guide to help students choose and plan their science projects for school science fairs or independent research. The infographic uses visuals, illustrations, and icons to enhance understanding and engagement.


6 slides
Key Points Overview Presentation
Bring your message to life with a slide that makes every key point feel clear, organized, and easy to follow. This presentation helps you highlight essential ideas, compare insights, and simplify complex information for any audience. Perfect for meetings, reports, or strategy updates. Fully compatible with PowerPoint, Keynote, and Google Slides.


7 slides
Big Data Tools Infographic
Big Data refers to large volumes of data, both structured and unstructured, that inundate a business or organization on a day-to-day basis. This infographic template is designed to captivate, educate, and empower, providing a bold and clear representation of the sheer magnitude and impact of big data. Compatible with Powerpoint, Keynote, and Google Slides. This template involves processing and analyzing Big Data to extract meaningful insights, patterns, and trends. These insights can be used for business intelligence, decision-making, research, and various other applications across different domains and industries.


18 slides
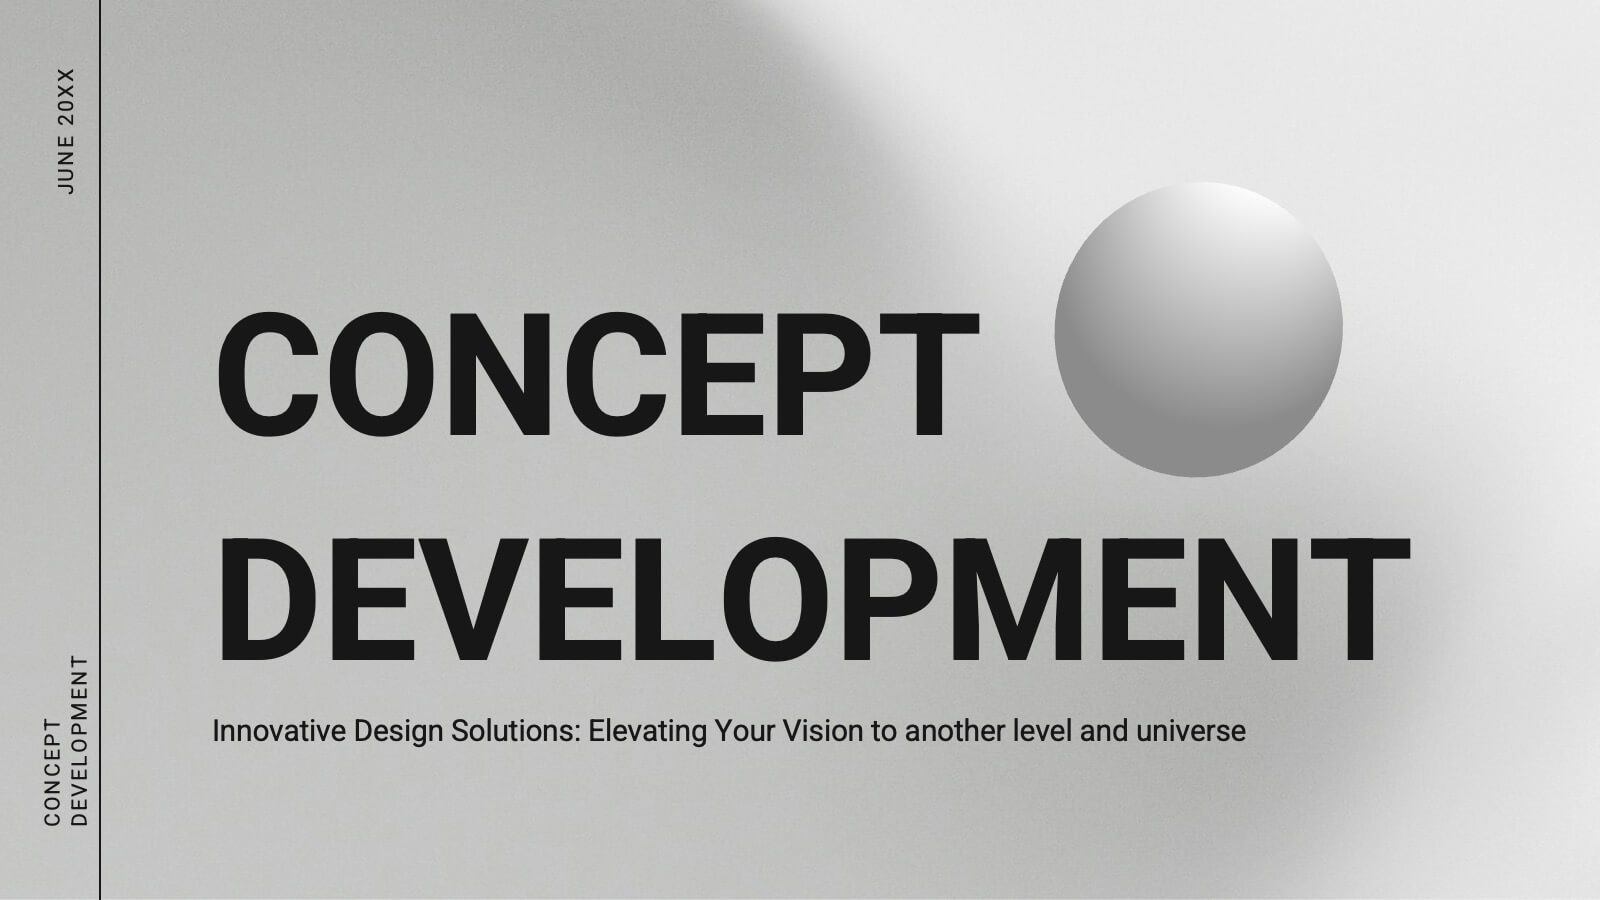
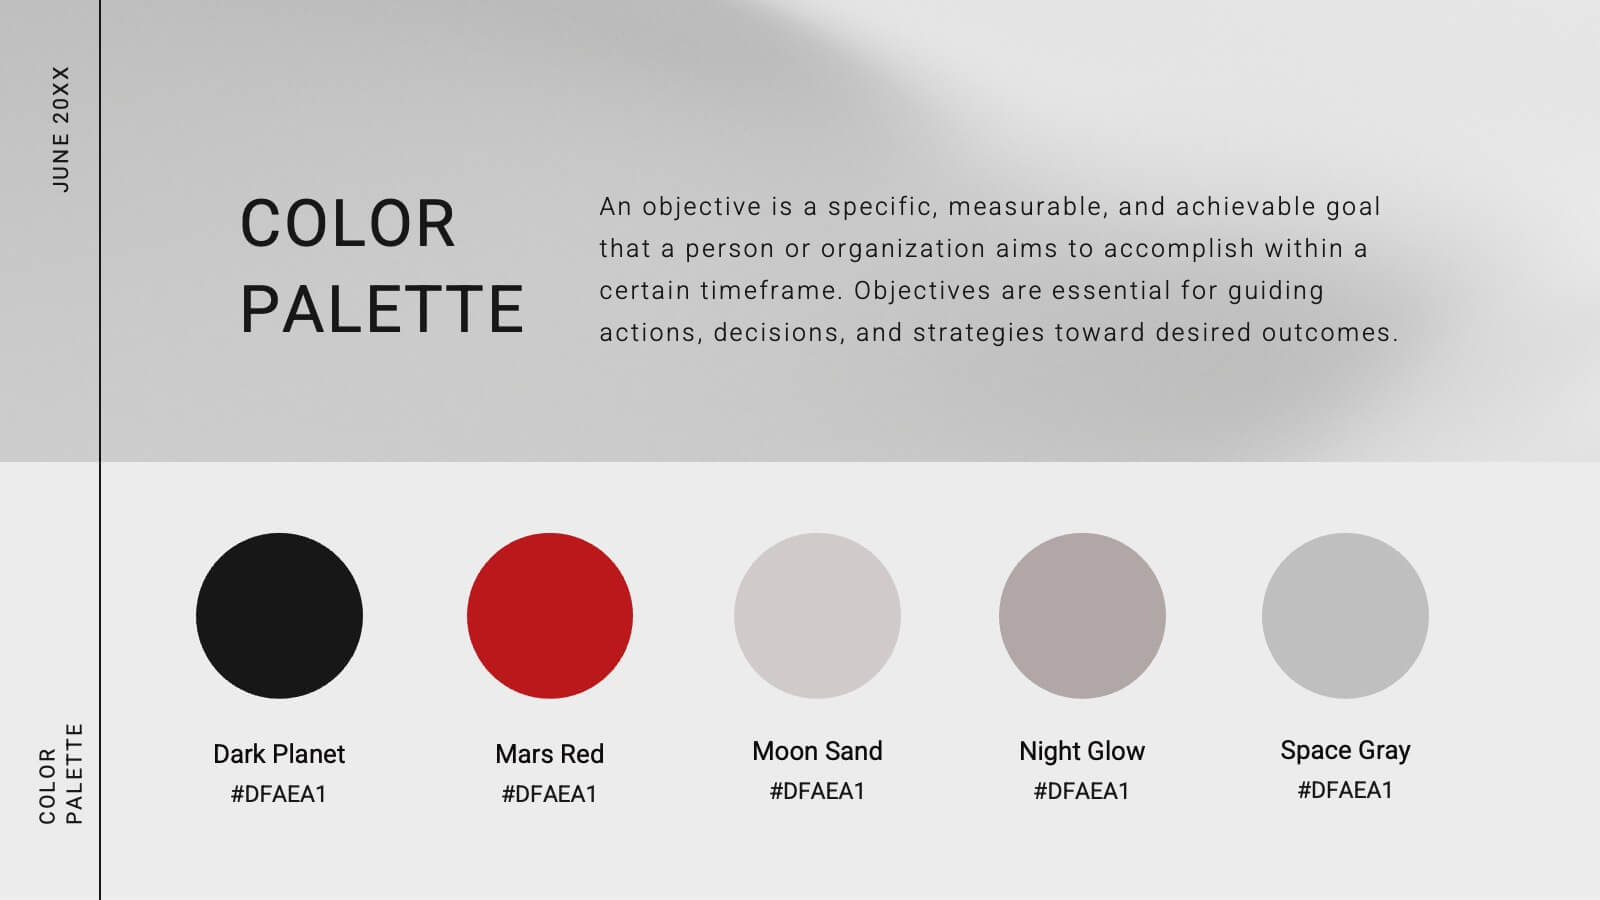
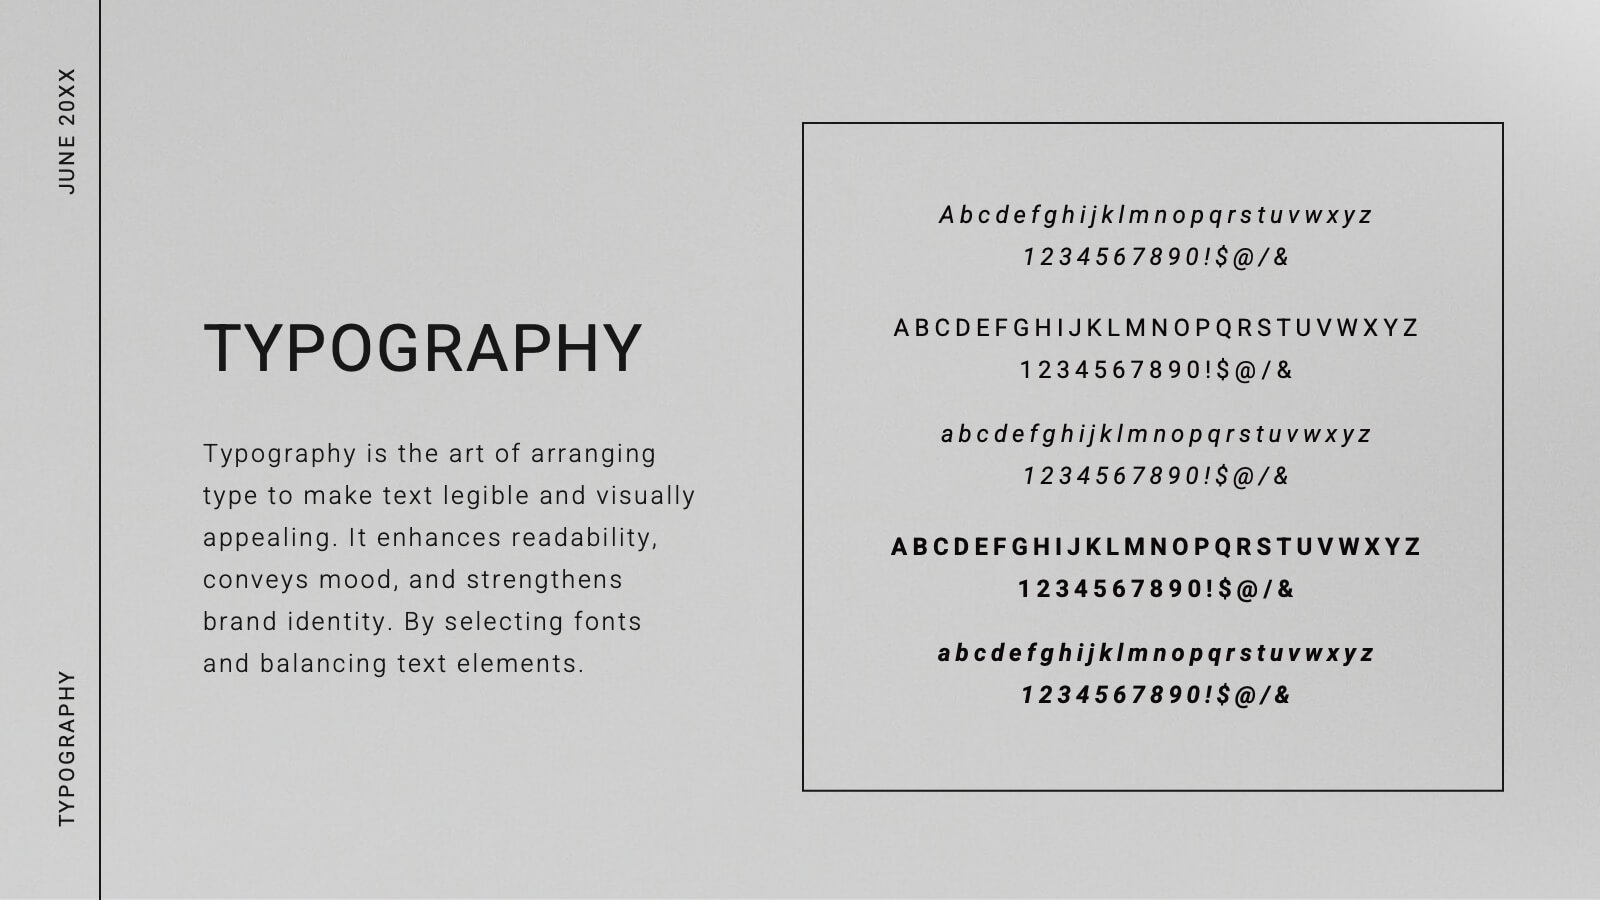
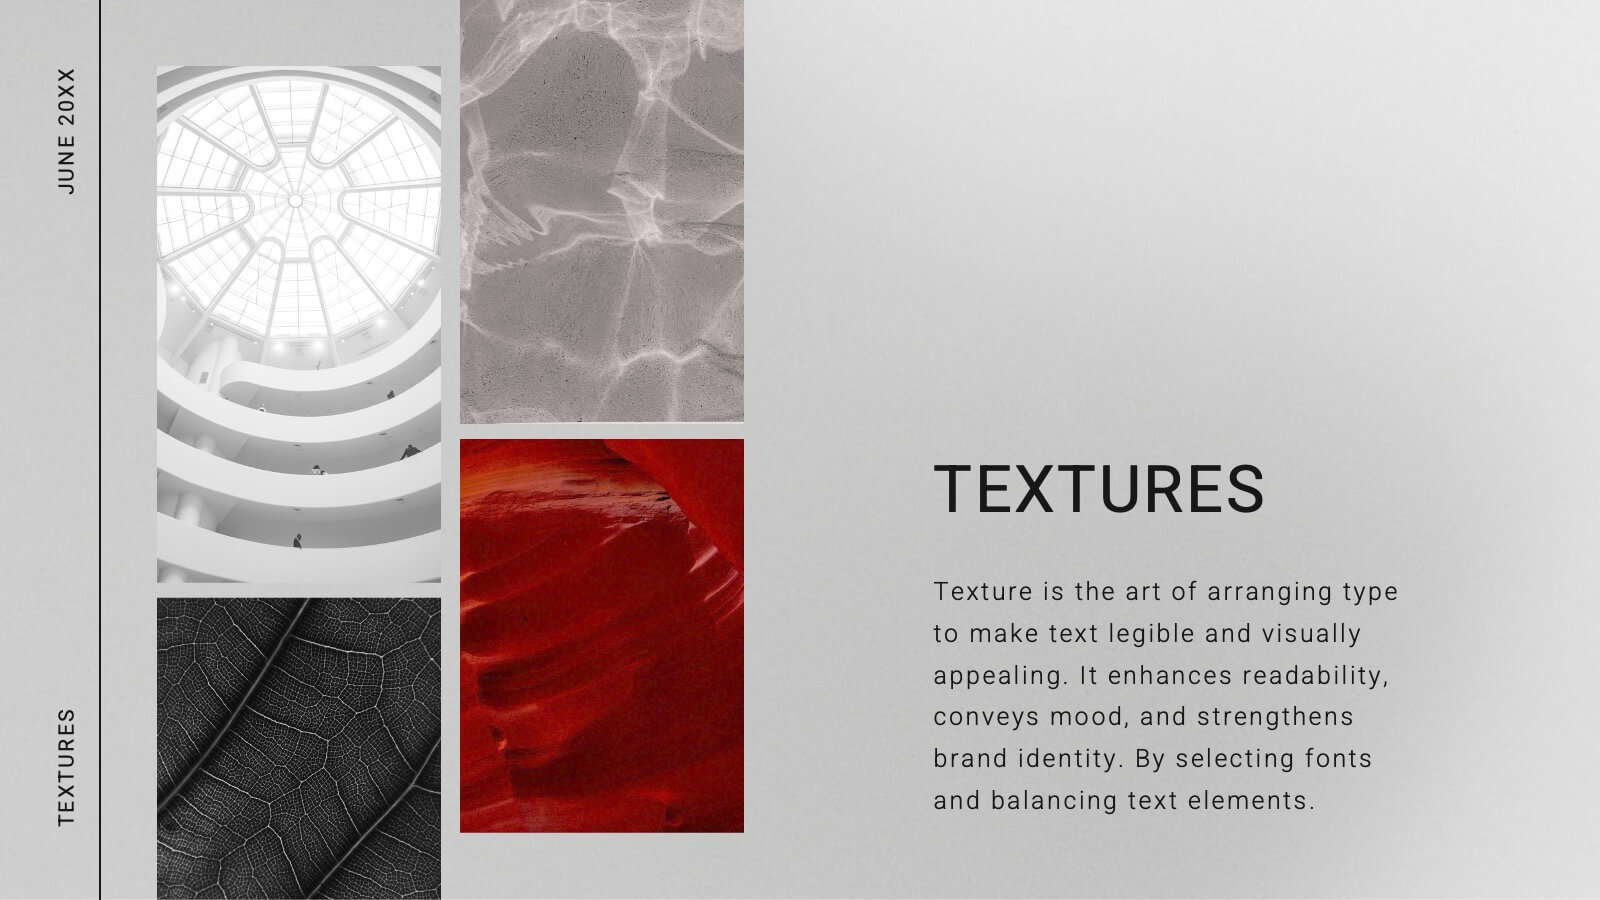
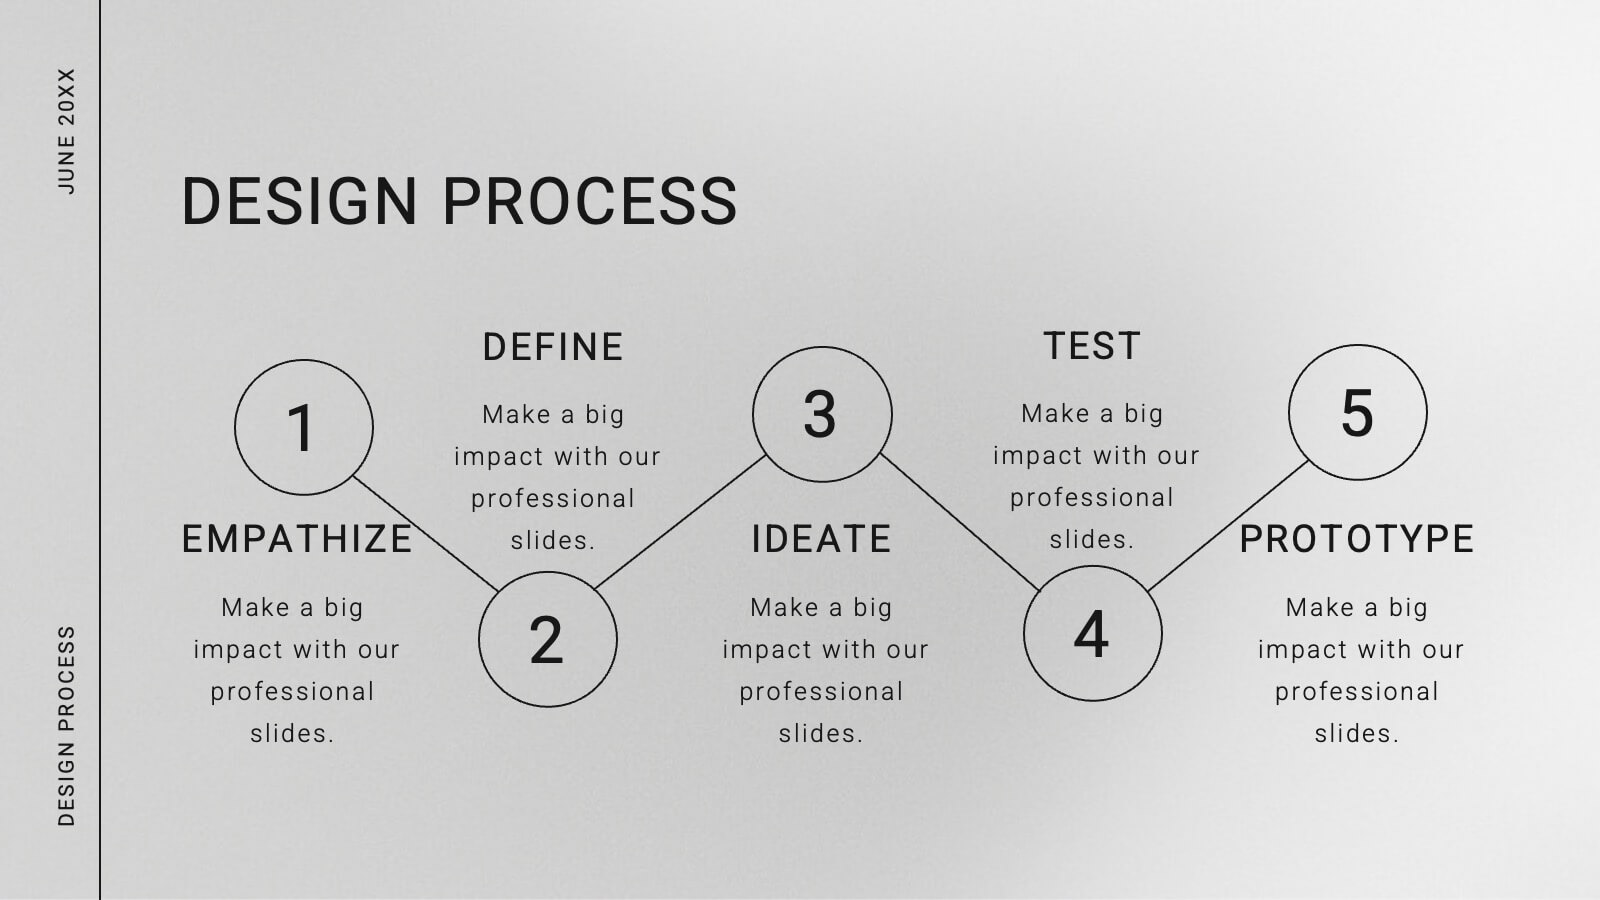
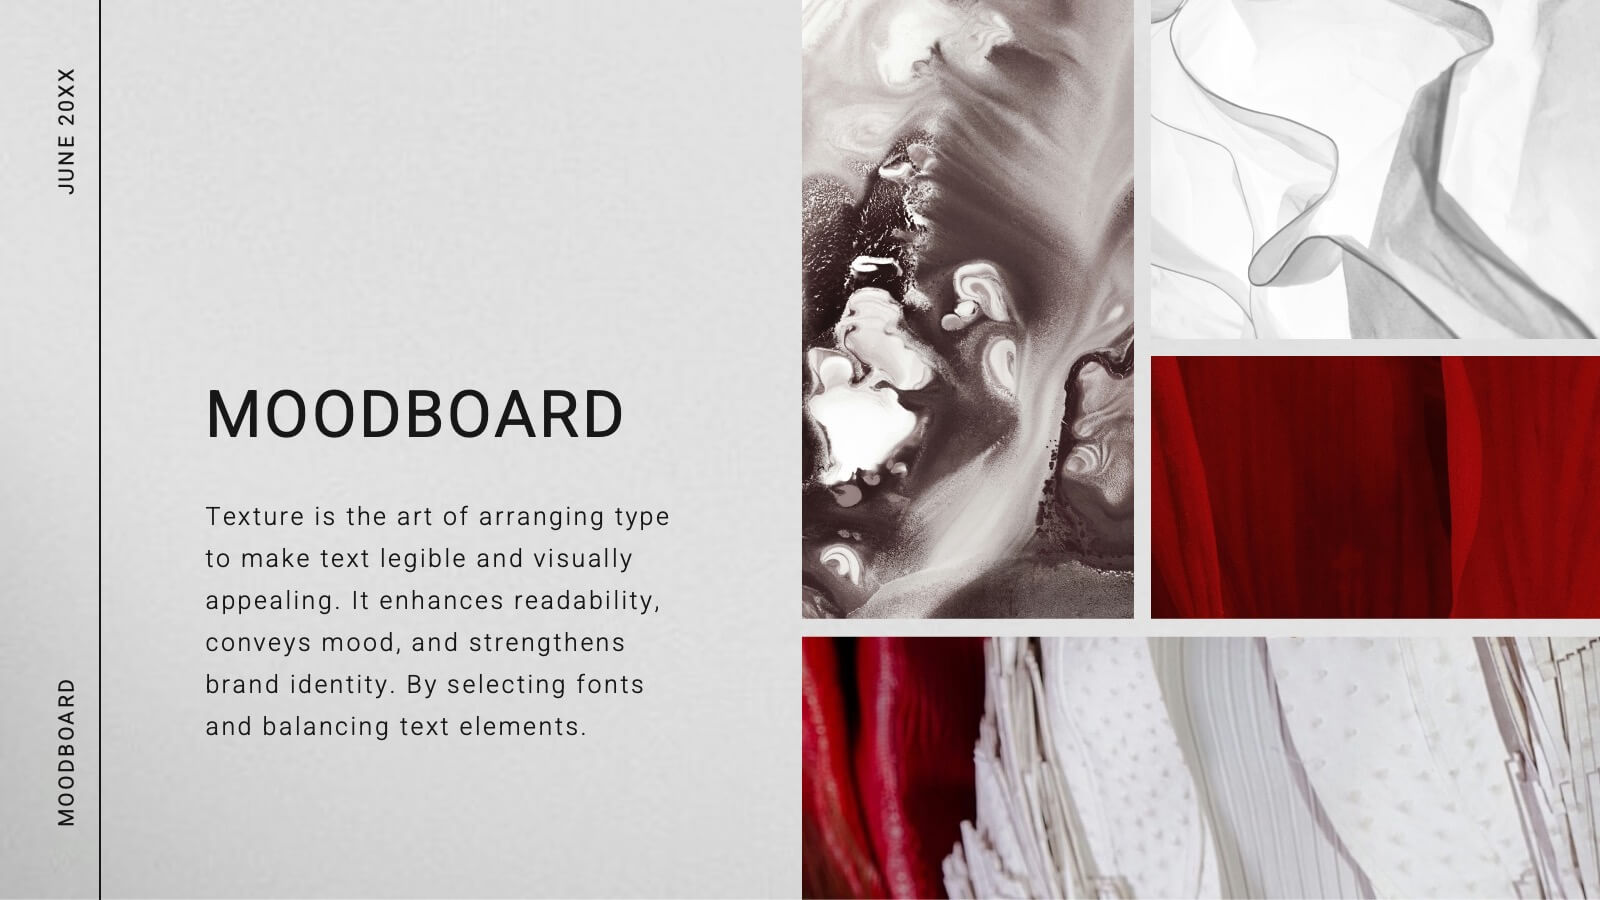
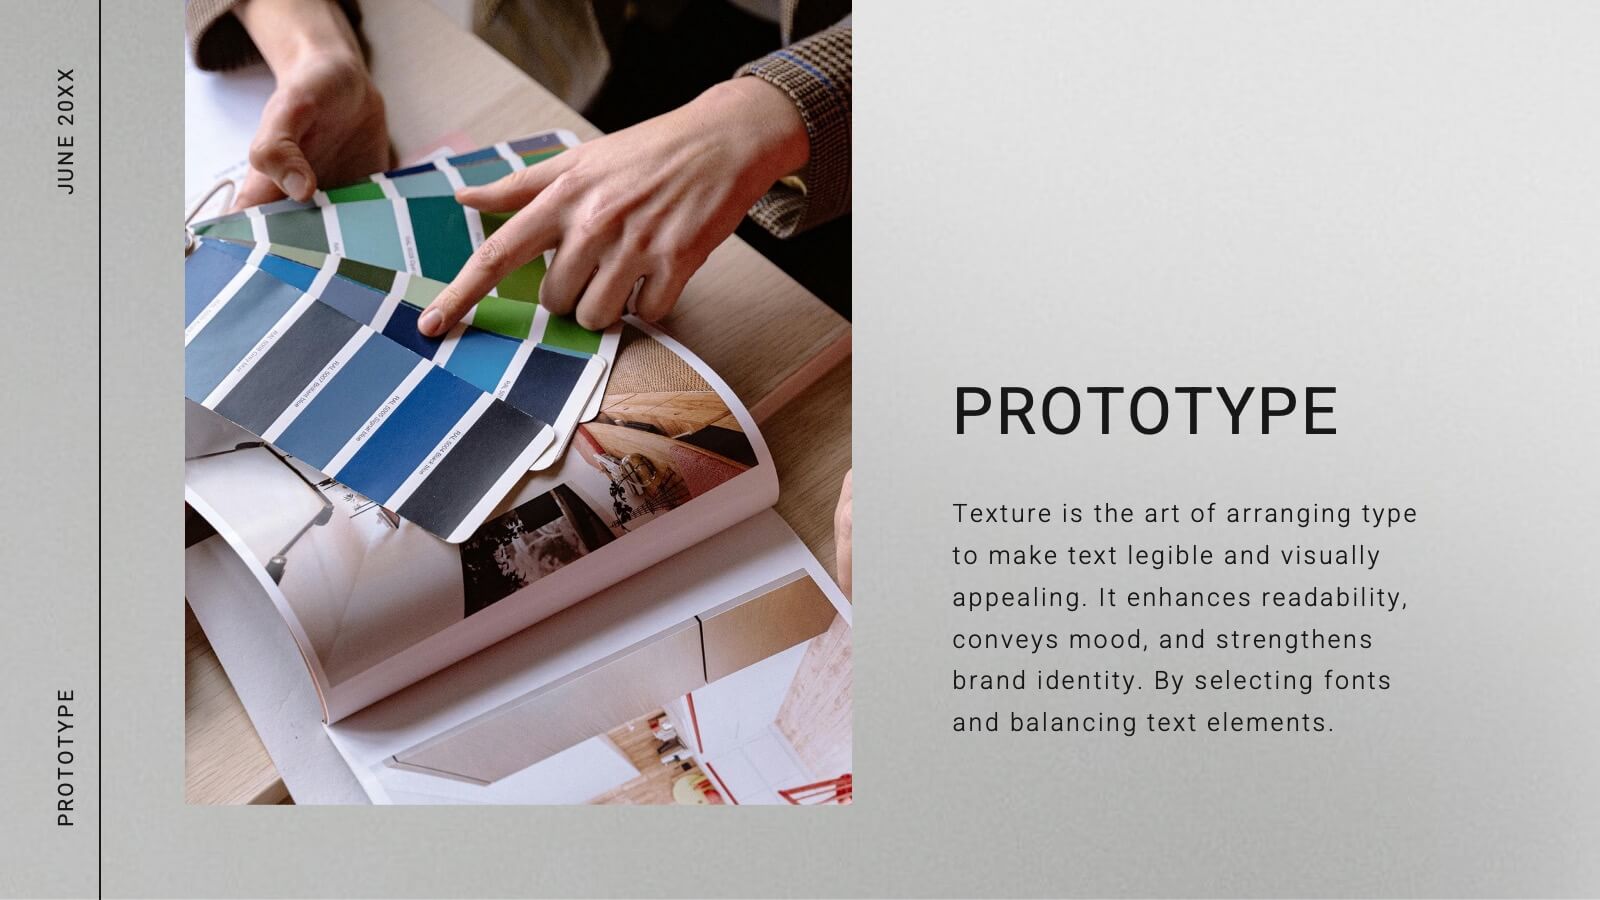
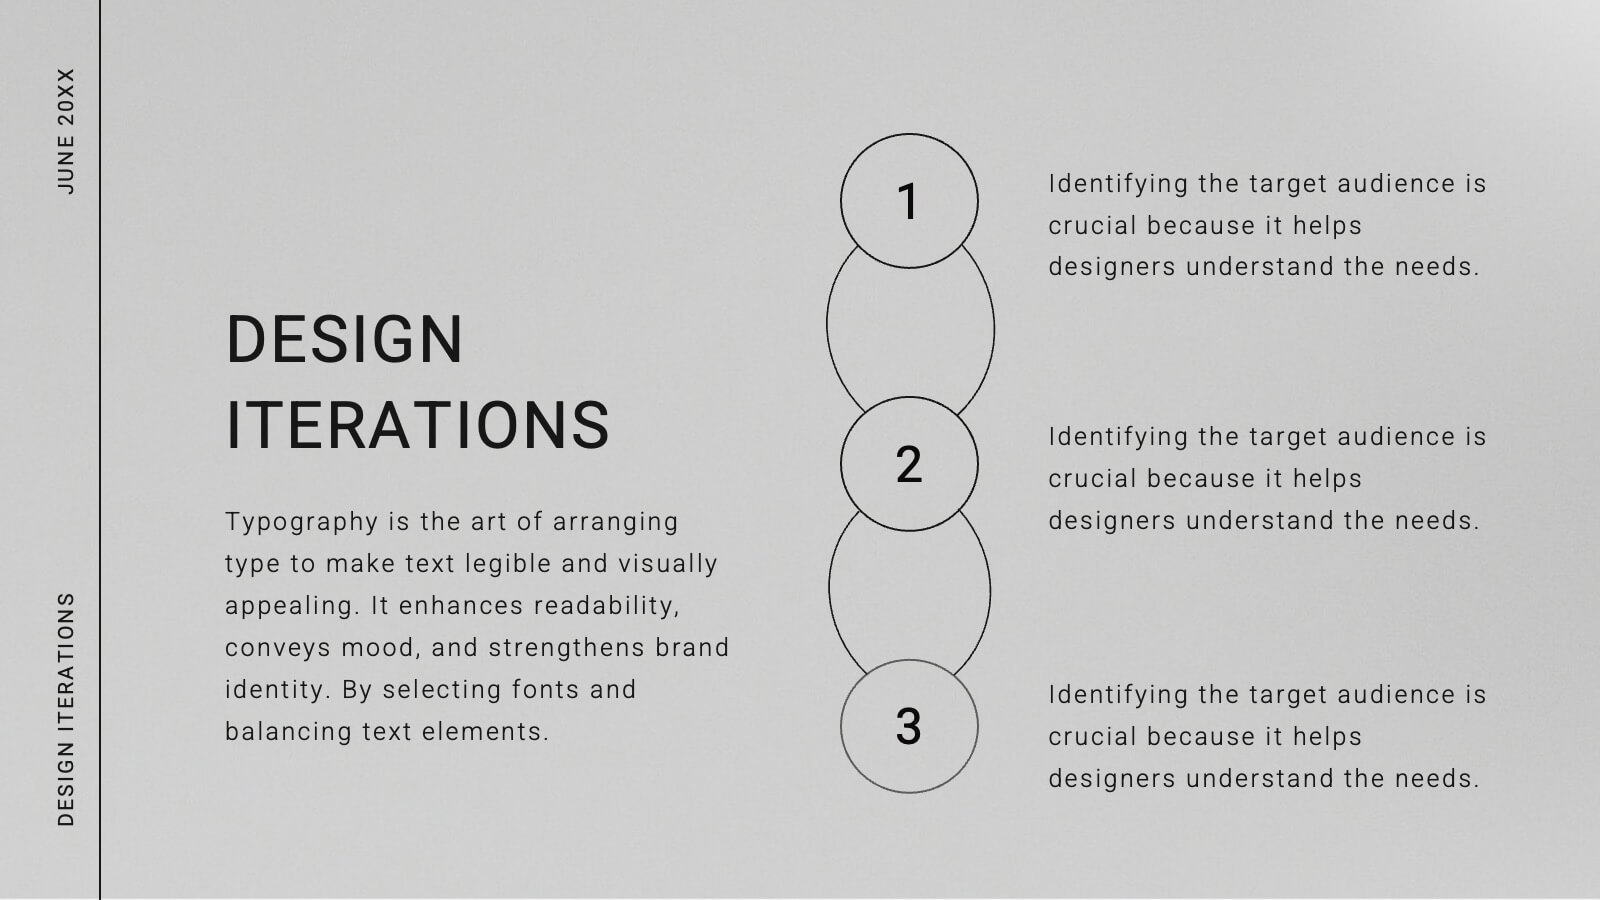
Riftbound Creative Design Report Presentation
Unleash your creative vision with this beautifully structured design presentation! It covers essential aspects like concept development, typography, moodboards, wireframes, and final design, ensuring a comprehensive journey from idea to execution. Perfect for creative teams or client presentations, this template is fully compatible with PowerPoint, Keynote, and Google Slides.


6 slides
Bubble Diagram for Idea Development
Streamline your brainstorming sessions and visualize concept progression with this Bubble Diagram for Idea Development presentation. Featuring a circular, color-coded layout from A to F, it’s ideal for mapping interconnected ideas, workflows, or innovation cycles. Easily editable in PowerPoint, Keynote, and Google Slides.


4 slides
Environmental Sustainability Strategy Presentation
The "Environmental Sustainability Strategy" presentation template is a visually engaging tool designed to outline an organization's approach to integrating sustainable practices into its operations. The template illustrates the journey from social to environmental and corporate sustainability, represented by seedlings growing into mature plants, symbolizing development and growth in sustainable practices. This template is perfect for businesses aiming to communicate their commitment to sustainability, detailing specific strategies and milestones in social, environmental, and corporate domains. It encourages viewers to think about the progressive stages of implementing sustainable actions within a corporate framework.


7 slides
TAM SAM SOM Model Infographic
Strategically target market opportunities with our TAM SAM SOM Model Infographic, a crucial tool for entrepreneurs, marketers, and business strategists. This infographic simplifies the understanding of market sizing and potential for new products or services. Our infographic visually breaks down the Total Addressable Market (TAM), Serviceable Available Market (SAM), and Serviceable Obtainable Market (SOM), helping you to quantify the market demand and focus your business strategies effectively. With this tool, you can illustrate the layers of market segmentation, from the broadest perspective to the target segment you aim to capture. This SEO-friendly infographic is designed to guide teams in prioritizing product development, marketing efforts, and sales strategies. Utilize our TAM SAM SOM Model Infographic in your business plans and investor presentations to convey a clear market analysis and establish a strong foundation for your go-to-market strategy.


7 slides
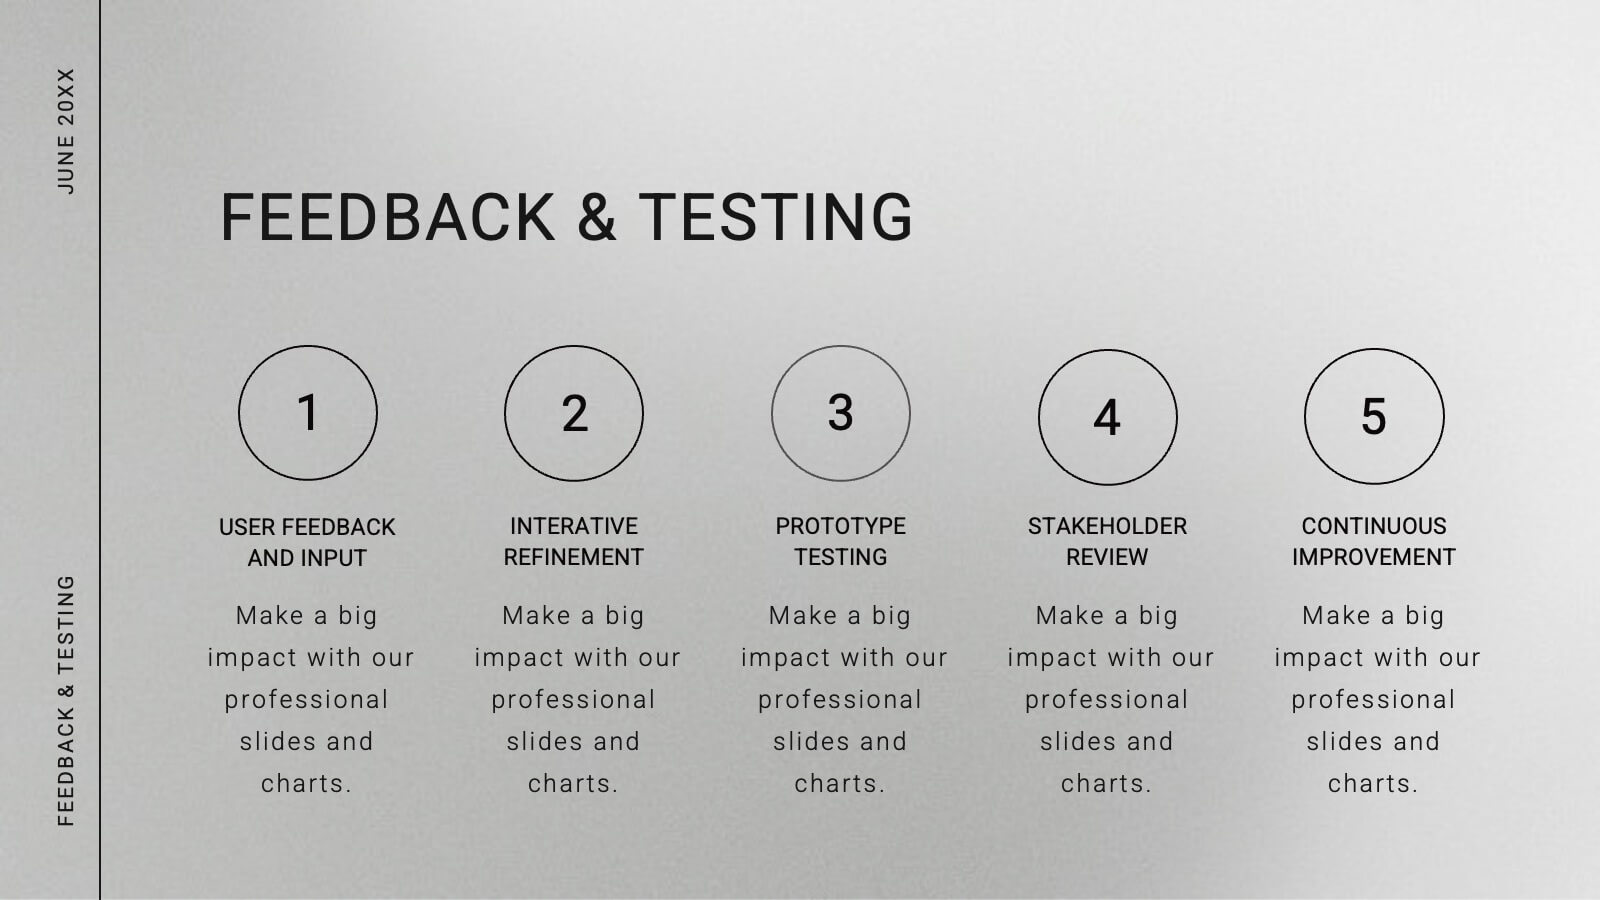
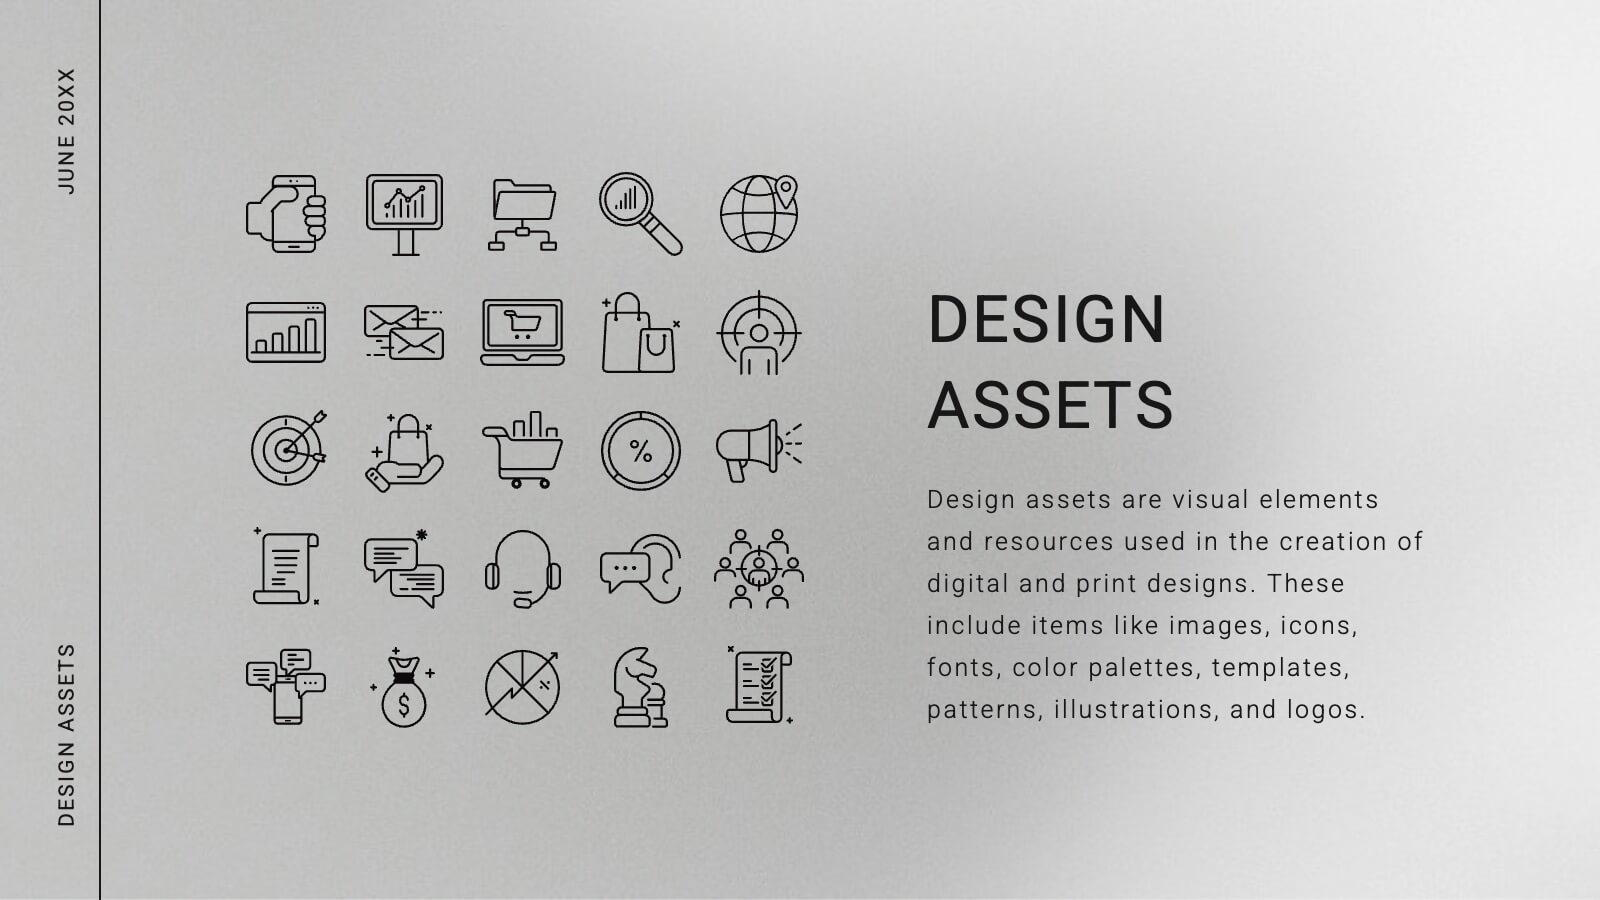
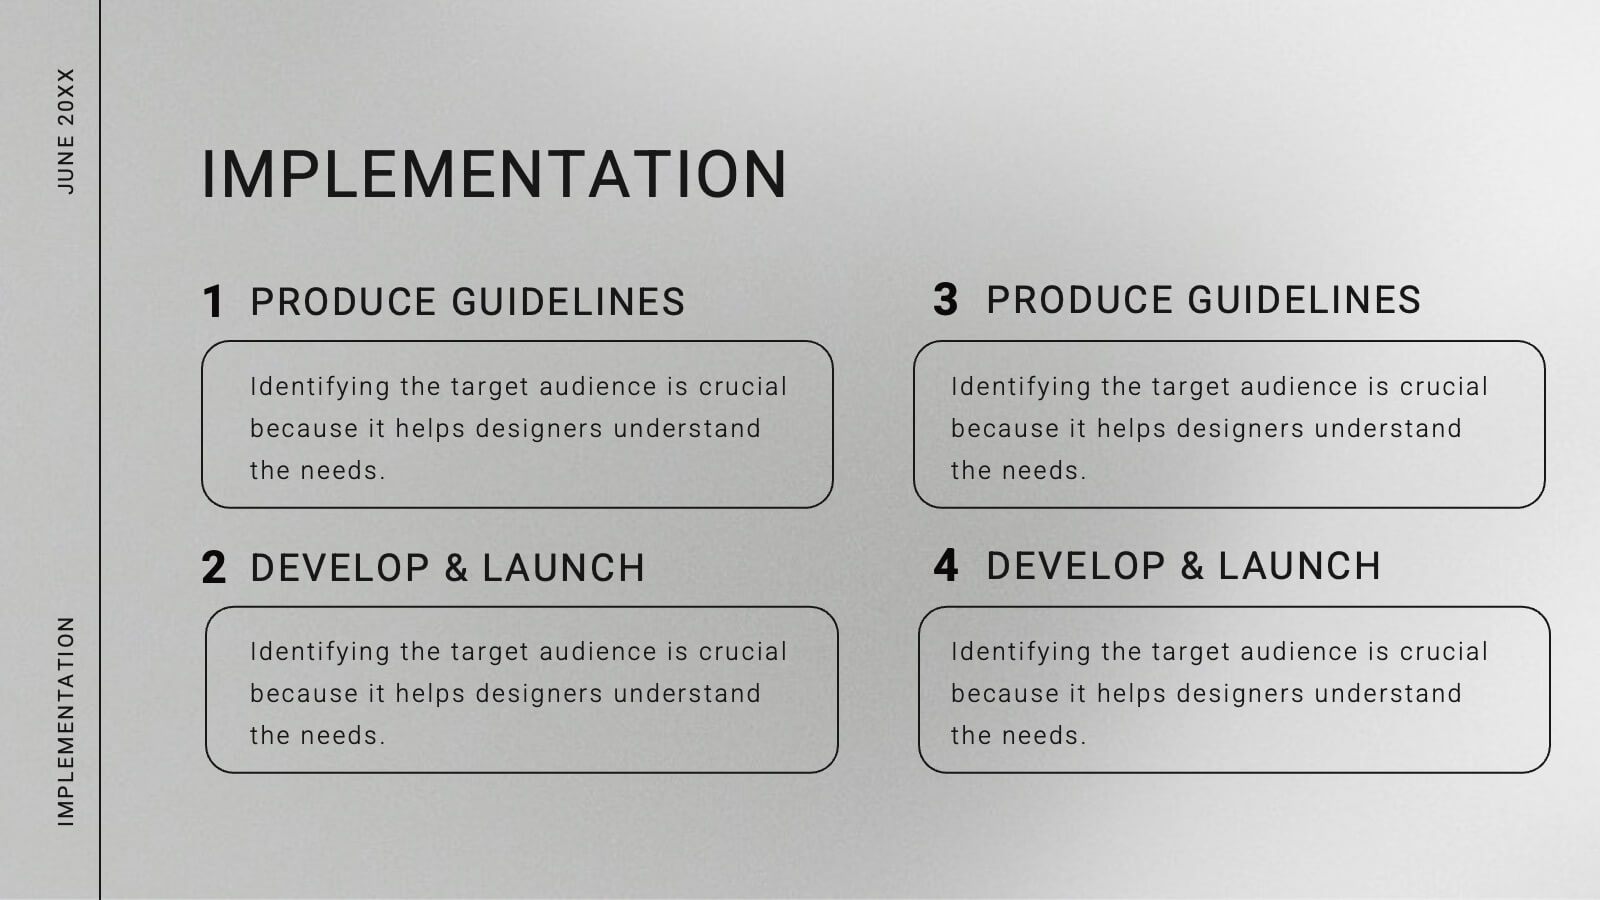
Design Team Infographic
The displayed slides are specifically tailored for design teams, reflecting a strong focus on visual elements that convey creative processes and team structures. Each slide is crafted to enhance the presentation of design projects, illustrating workflows, team roles, and project milestones with a visually appealing approach. The collection utilizes a vibrant color palette and dynamic shapes to keep the viewer engaged, making these templates ideal for showcasing design projects, brainstorming sessions, and team capabilities in a clear and aesthetically pleasing manner. The templates feature various layouts including organizational charts, process diagrams, and brainstorming tools that facilitate effective communication of design concepts and strategies. They are designed to be versatile, supporting a wide range of design projects from graphic and digital design to UI/UX prototypes. This set serves as an essential tool for design teams to demonstrate their methods, track project progress, and showcase their creative solutions to clients or stakeholders, ensuring that every aspect of the design process is both understood and visually compelling.


6 slides
Company Heritage and Legacy Timeline Presentation
Chronicle your business milestones with this modern timeline presentation. Featuring a horizontal layout with photo placeholders and color-coded markers, this design helps visually map your company’s history. Perfect for brand storytelling, anniversaries, or executive reports. Fully customizable in PowerPoint, Keynote, and Google Slides for seamless editing and branding.


12 slides
SMART Goal Setting Presentation
Achieve clarity and focus with this SMART Goal Setting Presentation template. Featuring a visually engaging target and color-coded SMART framework, this slide helps break down objectives into Specific, Measurable, Attainable, Relevant, and Timely components. Perfect for business planning, project management, and personal development. Compatible with PowerPoint, Keynote, and Google Slides.


21 slides
Aetherial UX Research Report Presentation
A professional and modern template for UX research presentations. Highlight key elements such as user personas, journey mapping, wireframes, and testing processes. Includes slides for accessibility considerations, design systems, and feedback iteration. Fully customizable and compatible with PowerPoint, Keynote, and Google Slides to deliver impactful insights and research findings.


7 slides
RACI Matrix Infographic Presentation Template
A RACI Matrix Infographic is a visual representation of the RACI model, which is used to clarify roles and responsibilities in an organization. The RACI model stands for Responsible, Accountable, Consulted, and Informed, and is a framework for defining the relationships between individuals and tasks in a project. This infographic displays a visual representation of the RACI matrix, showing the roles and responsibilities of each topic in a clear and organized manner. This Infographic can serve as a useful tool for managers and teams, as it can help to ensure clear communication and organization.

20 slides
Comet Graphic Design Project Plan Presentation
Craft stunning design project presentations with this elegant template. Showcase objectives, processes, mood boards, and final designs effectively. Ideal for creative teams and clients. Fully compatible with PowerPoint, Keynote, and Google Slides.


3 slides
Corporate Sustainabilitiy Management Strategy Presentation
Drive your company’s future with a presentation that blends strategy, innovation, and sustainability. Designed to communicate eco-friendly initiatives and long-term business goals, it helps visualize performance, impact, and growth clearly. Fully customizable and compatible with PowerPoint, Keynote, and Google Slides for seamless, professional, and engaging sustainability presentations.
10 slides
Educational Goals and Progress Tracking Presentation
Track academic milestones with ease using the Educational Goals and Progress Tracking Presentation. This timeline-style visual is perfect for mapping learning objectives, course progression, or academic achievements. Great for teachers, trainers, or student planning sessions. Fully editable in PowerPoint, Keynote, Canva, and Google Slides.


7 slides
Sustainability Risk Management Infographic
Elevate your presentations with our Sustainability Risk Management infographic, compatible with Powerpoint, Keynote, and Google Slides. This infographic is a vital tool for professionals dedicated to showcasing the importance of sustainable practices and risk mitigation in their organizations. It's crafted to display the interconnectivity between environmental, social, and governance (ESG) factors and business operations. Our Sustainability Risk Management infographic effectively breaks down complex sustainability challenges into digestible parts. It's an invaluable resource for corporate strategists, environmental consultants, and policy makers. By simplifying the communication of sustainability data, it encourages stakeholder engagement and facilitates strategic planning sessions. The design of the infographic ensures that sustainability goals and risk assessments are presented in an engaging and memorable manner. It supports your narrative by visually guiding your audience through the elements of sustainability that are pivotal for risk management. By integrating this infographic into your slide decks, you can confidently convey the message that responsible management is key to long-term success.


7 slides
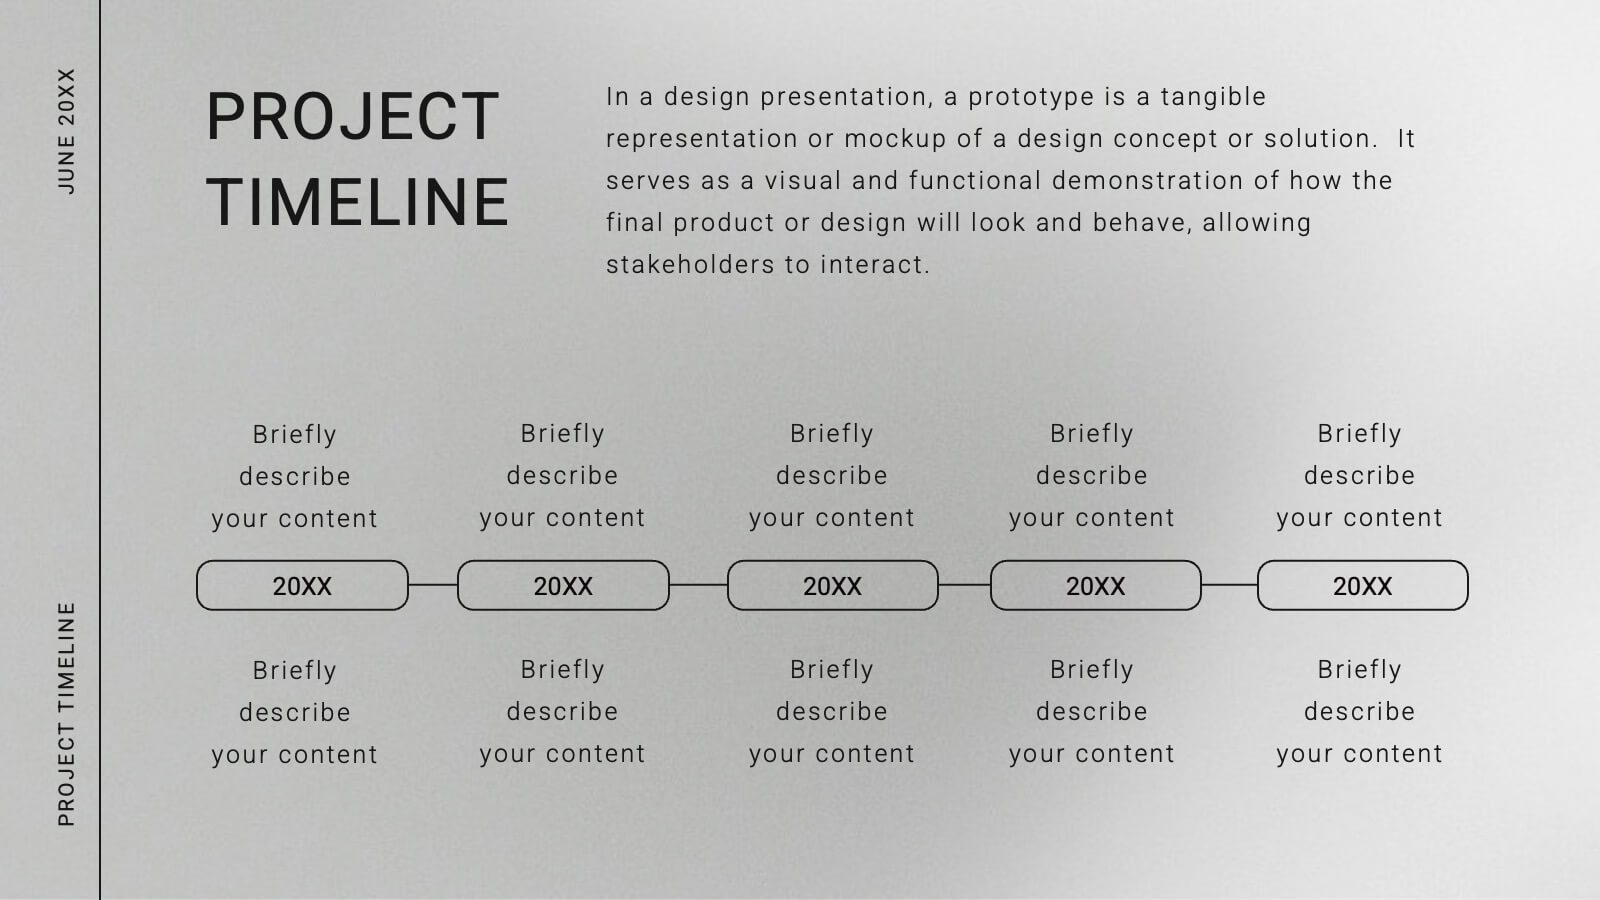
Timeline Schedule Infographics
A Timeline Schedule is an effective way to communicate complex schedules or timelines. It's a constructive tool for coordinating work and managing projects. This template can help you build a timeline, show the overview and present your value proposition. This timeline Infographic can be used for any business, personal, or academic project. This is a fully editable template so you can change the color, size and everything as per your needs. The timeline charts have been designed with various categories and time range pattern through which you can plan your projects in an effective way!