


Features
- 6 Unique slides
- Fully editable and easy to edit in Microsoft Powerpoint, Keynote and Google Slides
- 16:9 widescreen layout
- Clean and professional designs
- Export to JPG, PDF or send by email


Do you have any questions?
Recommend


5 slides
Fashion Design Infographics
Fashion Design is the art of creating clothing and accessories, incorporating elements of style, aesthetics, and functionality. These infographic templates offer a visually captivating and informative way to present key concepts, trends, and insights in the world of fashion design. This template is ideal for fashion designers, students, industry professionals, or anyone interested in sharing knowledge about fashion design principles, fashion history, or emerging trends. Featuring a stylish design that reflects the creative and dynamic nature of the fashion industry. This allows for easy customization and seamless integration of your fashion-related content.


7 slides
Matrix Sales Infographic
Steer through the intricacies of sales data with our matrix sales infographic. Set upon a pristine white backdrop, the design pulses with the analytical depth of blue, the urgency of red, and the vibrancy of orange. With meticulously crafted infographics, relevant icons, and adaptable image placeholders, this template delivers a systematic representation of the sales matrix, from product positioning to market segmentation. Exquisitely designed for Powerpoint, Keynote, or Google Slides. A pivotal tool for sales managers, market analysts, strategists, or any business professional aiming to dissect sales data and drive decisions.


5 slides
Concept Overlap with Venn Diagram Presentation
Visually map overlapping concepts and relationships with this four-circle Venn diagram slide. Perfect for presenting interdependencies, cross-functional insights, or product comparisons. Each section includes editable labels and icons to personalize your content. Compatible with PowerPoint, Keynote, and Google Slides—ideal for business strategies, brainstorming sessions, and collaborative team presentations.


6 slides
5-Stage Sales Funnel Presentation
Visualize your sales process effortlessly with this 5-Stage Sales Funnel template. Ideal for showcasing lead conversion, customer journey, and sales strategies, this design is fully customizable. Adjust colors, text, and icons to fit your needs. Compatible with PowerPoint, Keynote, and Google Slides for seamless integration into your presentations.


23 slides
Mystic Small Business Pitch Deck Presentation
Elevate your small business presentations with this sleek, professional pitch deck template! It’s designed to highlight your company's background, market opportunities, and key objectives in a visually appealing format. Perfect for showcasing your products, services, value proposition, and financial performance, this template makes your pitch stand out. Customize it for PowerPoint, Keynote, or Google Slides to suit your needs.


20 slides
Axisflare Artist Portfolio Presentation
Showcase your creative journey with this vibrant artist portfolio template, featuring sections for project highlights, philosophy, style, and client testimonials. Ideal for presenting your work and artistic approach, this template is compatible with PowerPoint, Keynote, and Google Slides for seamless presentation across various platforms.


5 slides
Business Choices and Outcomes Analysis Presentation
Visually connect key business options with their potential results using the Business Choices and Outcomes Analysis slide. Featuring a clean puzzle-style layout, this template is perfect for illustrating decision pathways, pros and cons, or strategy alternatives. Ideal for consultants, managers, and analysts. Easily customizable in PowerPoint, Keynote, and Google Slides.


7 slides
Puzzle Communication Infographic
Piece together the art of effective communication with our puzzle communication infographic. Set on a sleek white foundation, complemented by the enigma of purple, the zest of orange, and the passion of red, this template ingeniously utilizes puzzle pieces to symbolize interconnected communication elements. Enhanced with inventive infographics, representative icons, and adjustable image placeholders, it offers a comprehensive exploration of communication dynamics. Exquisitely crafted for Powerpoint, Keynote, or Google Slides. An indispensable tool for communication specialists, team leads, trainers, or anyone keen on enhancing interpersonal exchanges.


5 slides
Interlocking Puzzle Infographic Presentation
Visually connect ideas with the Interlocking Puzzle Infographic. This design is perfect for illustrating processes, relationships, and key concepts that fit together seamlessly. Whether you're presenting business strategies, project workflows, or educational content, this template enhances clarity and engagement. Fully customizable and compatible with PowerPoint, Keynote, and Google Slides.


7 slides
Company Profile Infographic
This collection of company profile templates is designed to meet the diverse needs of various businesses, providing an efficient and polished method for presenting a company's identity, accomplishments, and offerings. Each template is meticulously crafted to cater to different professional contexts, making them suitable for annual reports, investment summaries, or internal briefings. Structured for clarity, these templates enable businesses to effectively communicate essential details such as company history, objectives, and the breadth of services or products offered. They are also equipped to showcase crucial statistics like employee numbers, significant achievements, and organizational hierarchy, enhancing the overall presentation. The design blends modern aesthetics with functionality, incorporating a professional color palette and clean layout that holds viewer interest and enhances readability. Customization is straightforward, allowing for easy adjustments in colors, fonts, and design elements to align with specific brand identities. Ideal for corporations looking to convey their market stance and engage potential clients, investors, or prospective employees, these templates serve as a vital tool in creating impactful and informative company profiles.


7 slides
Work From Home Online Infographic
Work from home online refers to a work arrangement where individuals can perform their job responsibilities remotely, usually from their homes, using internet-connected devices like computers, laptops, tablets, or smartphones. Unveil the modern realm of remote work with our work from home online infographic. This visually engaging and informative template takes you on a journey through the digital landscape of remote work, showcasing its advantages, best practices, and the tools that enable seamless virtual collaboration. This infographic isn't just a visual guide it's a roadmap to thrive in the evolving world of work.


4 slides
Efficient Workflow Management Presentation
Optimize productivity with the Efficient Workflow Management template, designed to streamline processes and improve task coordination. Ideal for project managers, teams, and businesses, this template visually maps workflows, helping to identify bottlenecks and enhance efficiency. Fully customizable and compatible with PowerPoint, Keynote, and Google Slides for seamless presentations.

22 slides
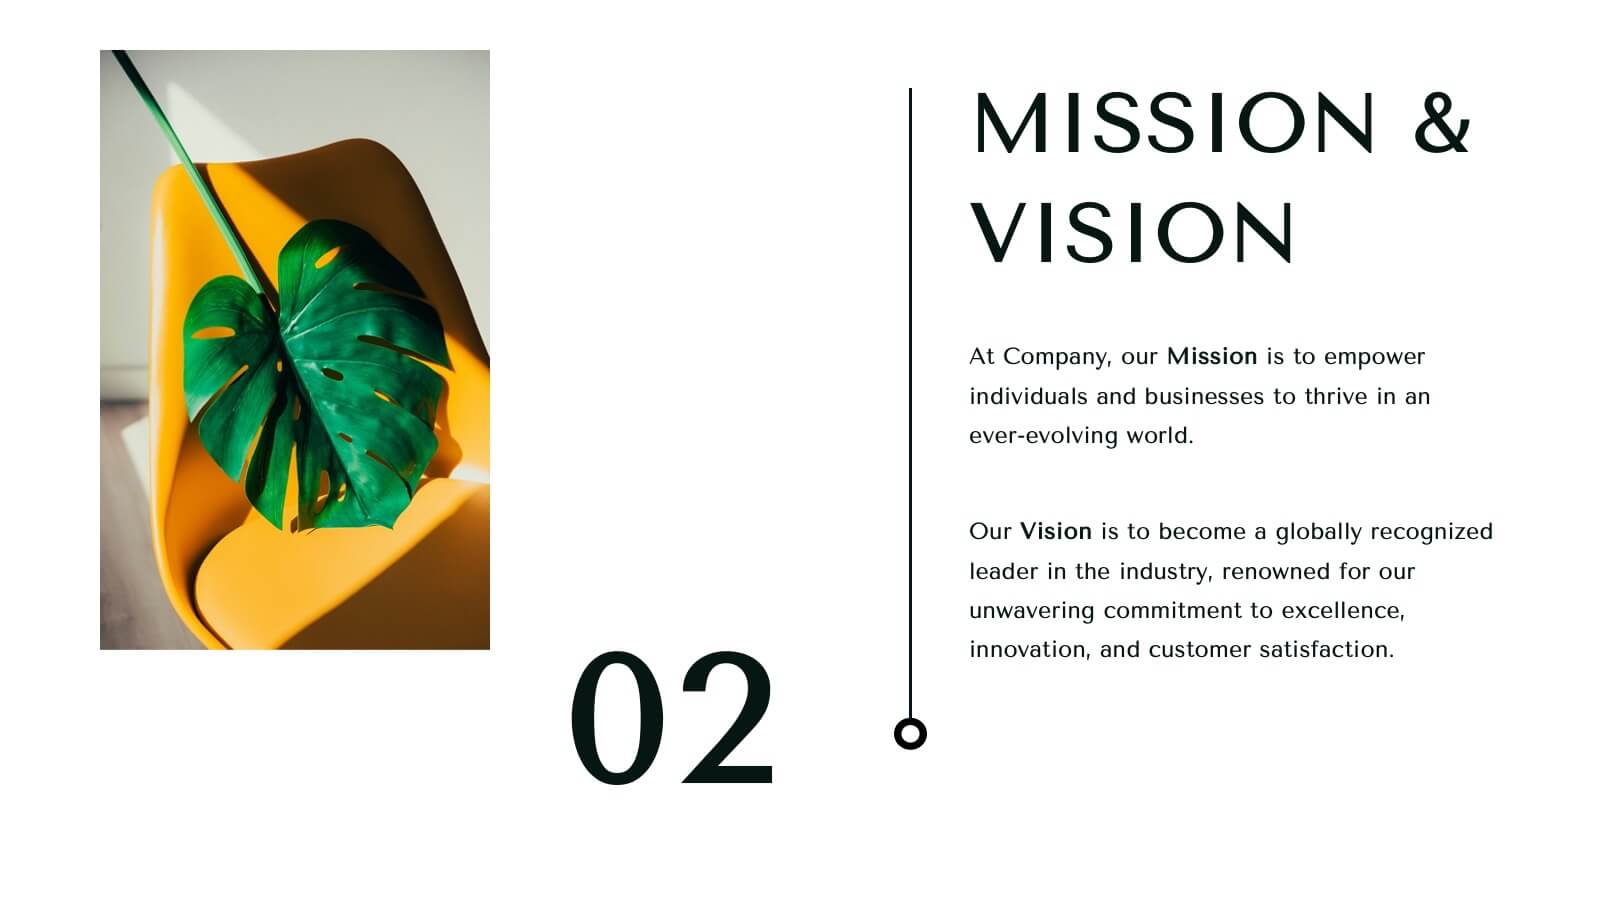
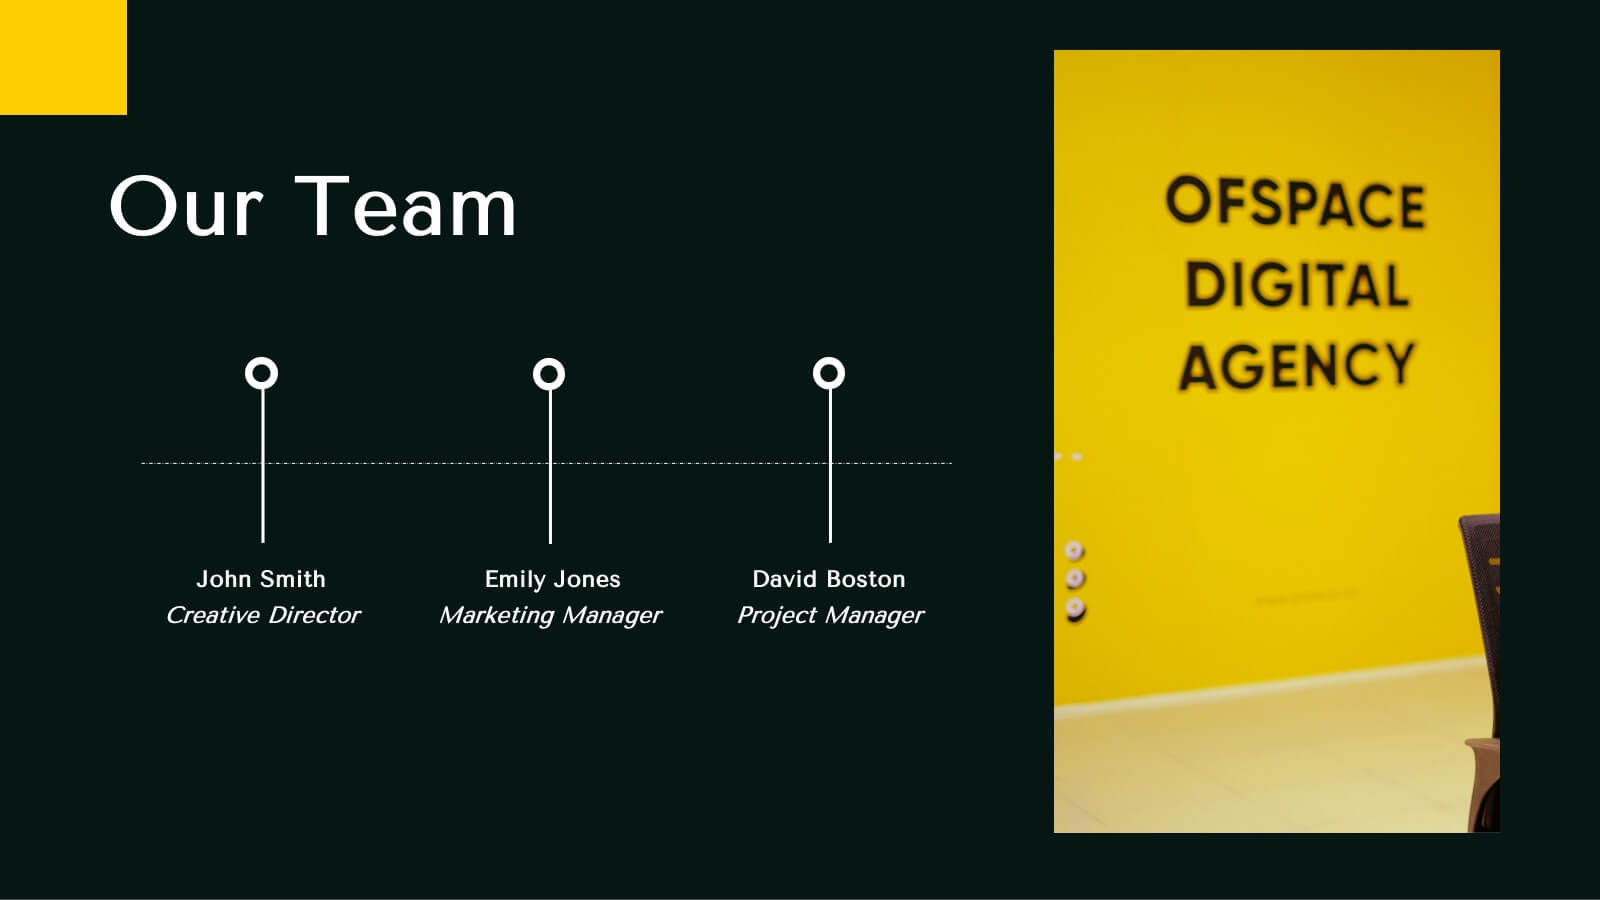
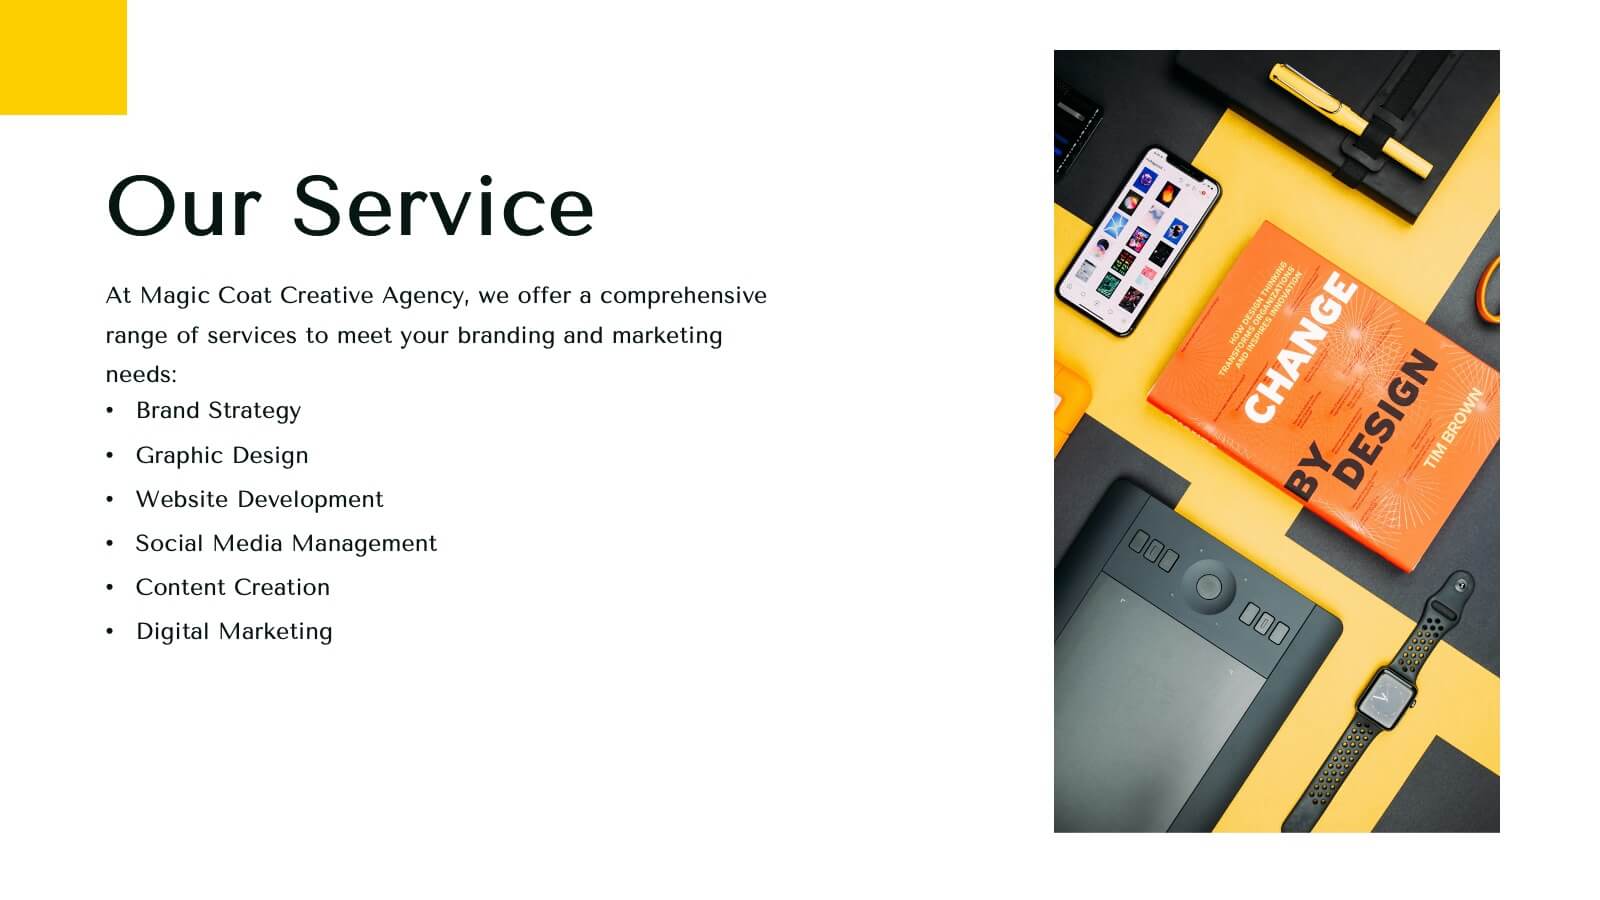
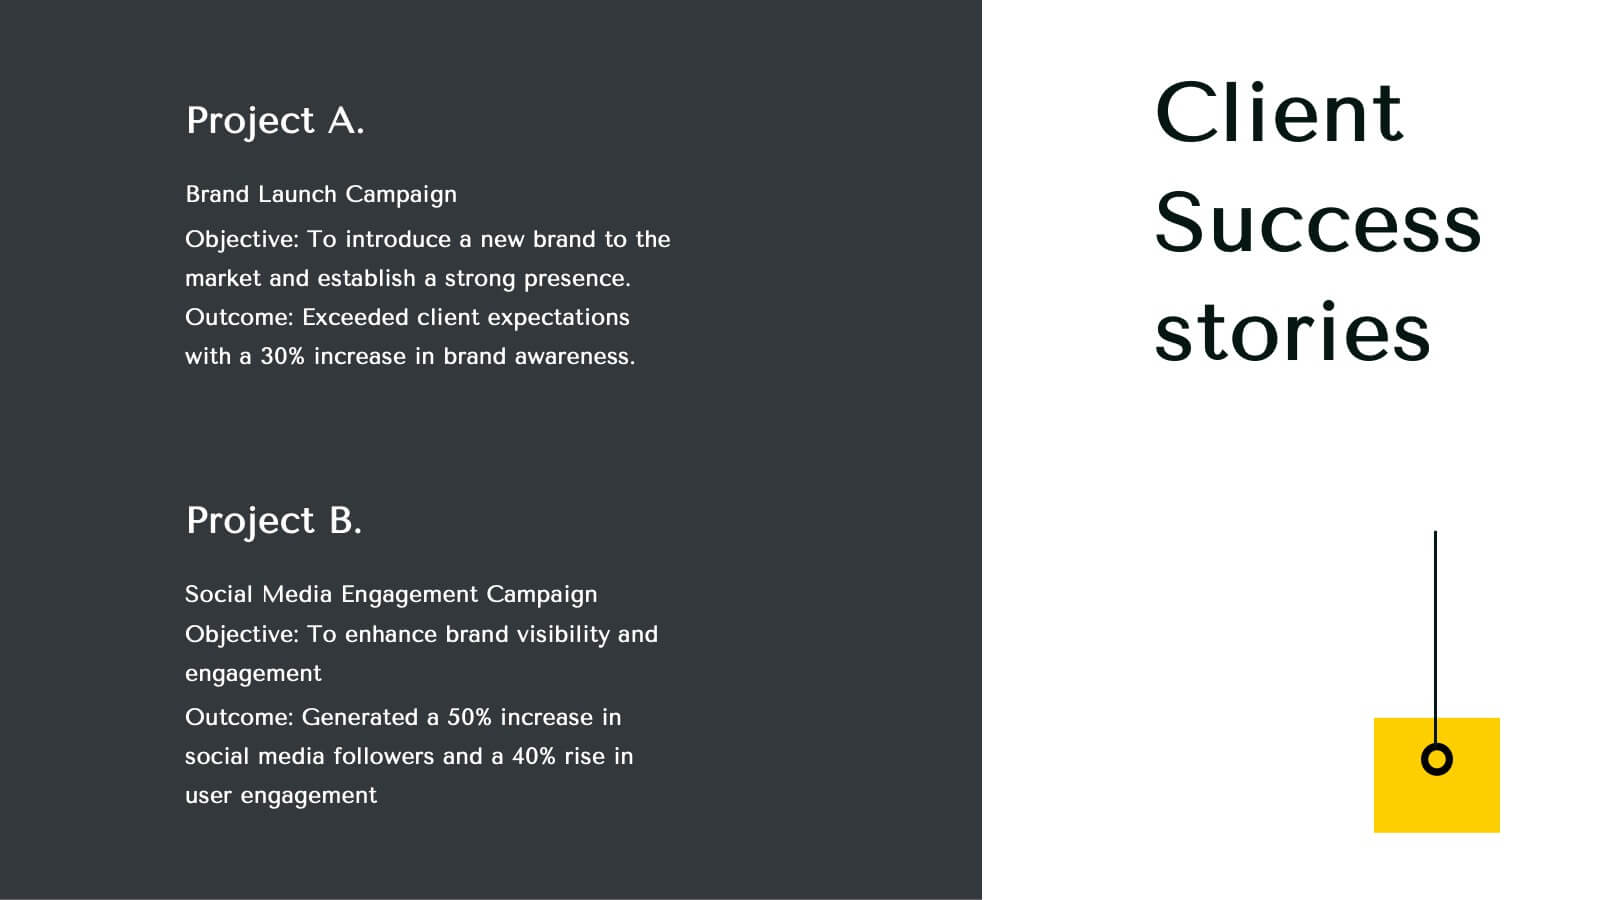
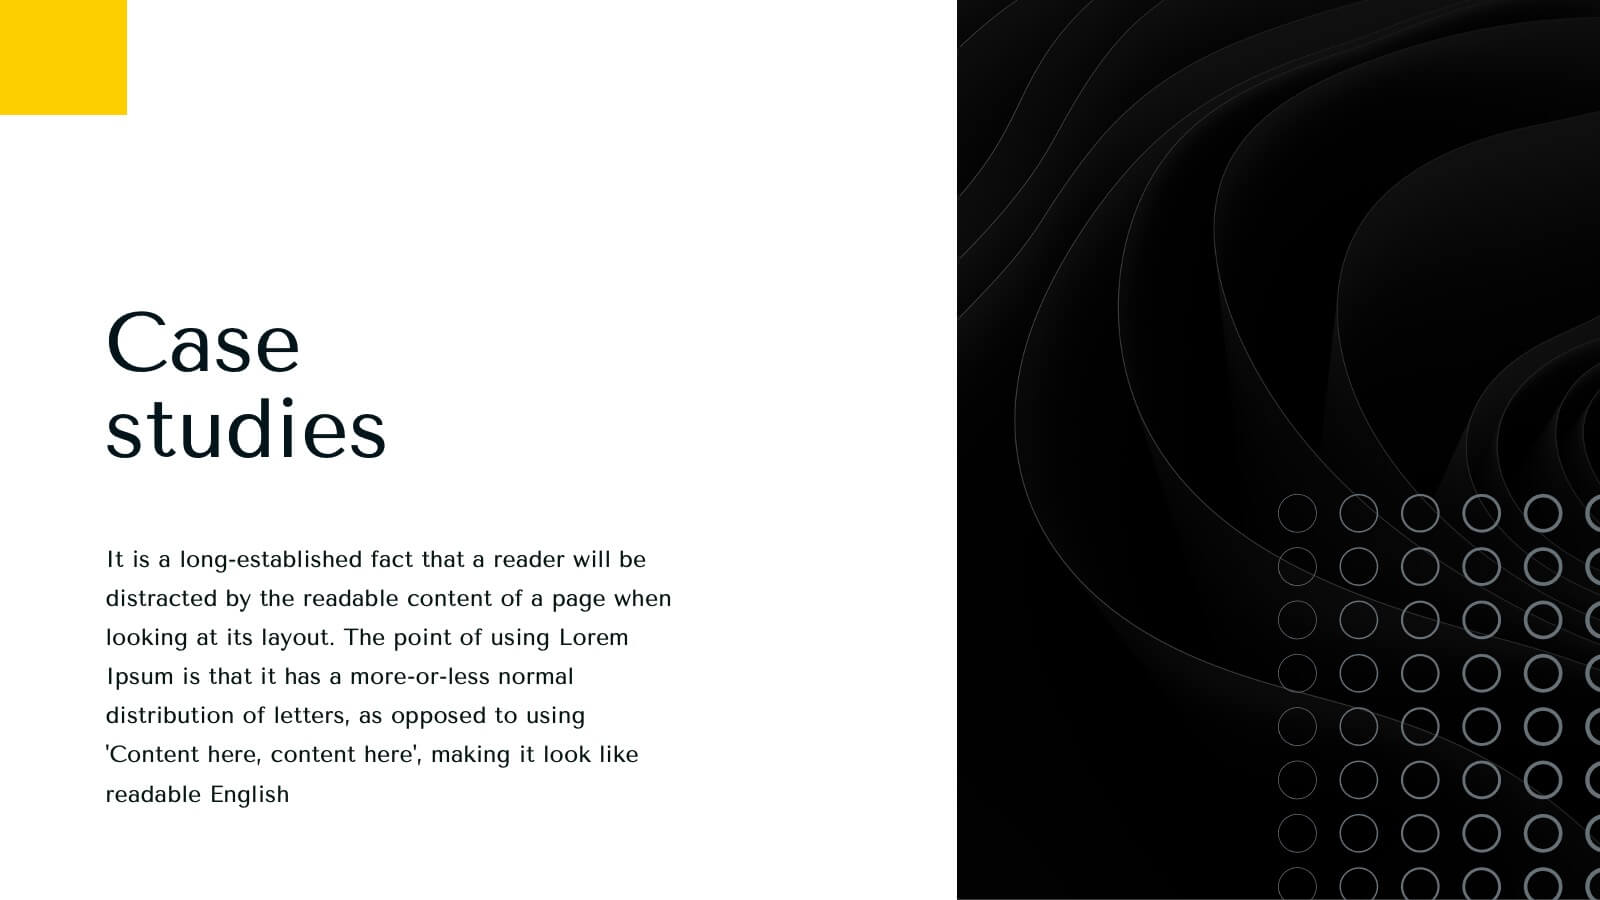
Infinity Agency Portfolio Presentation
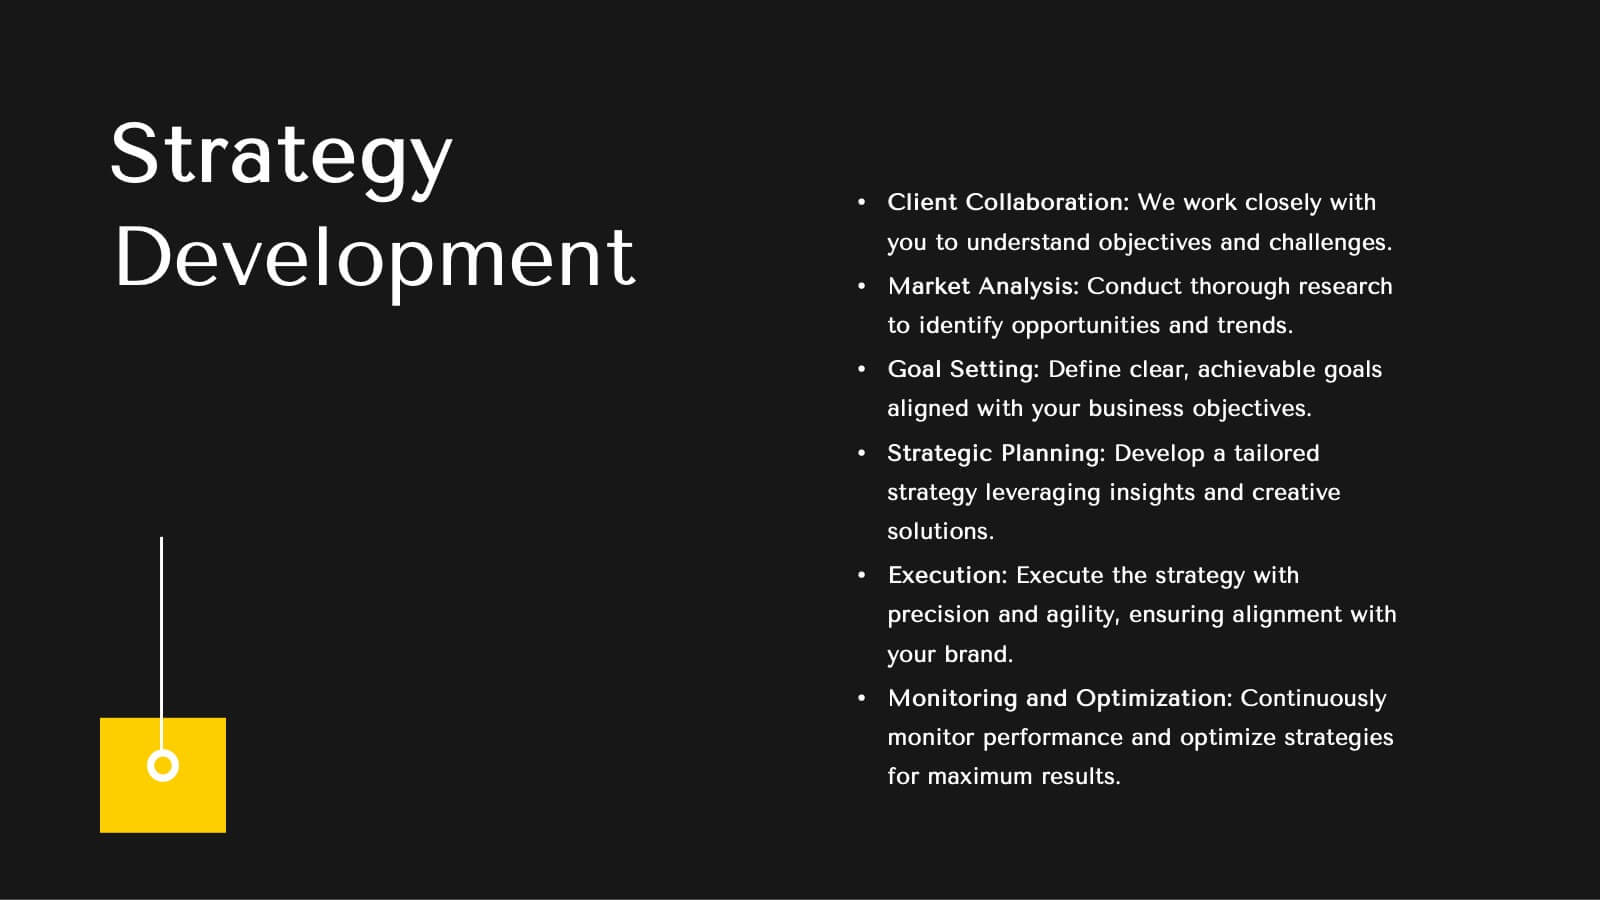
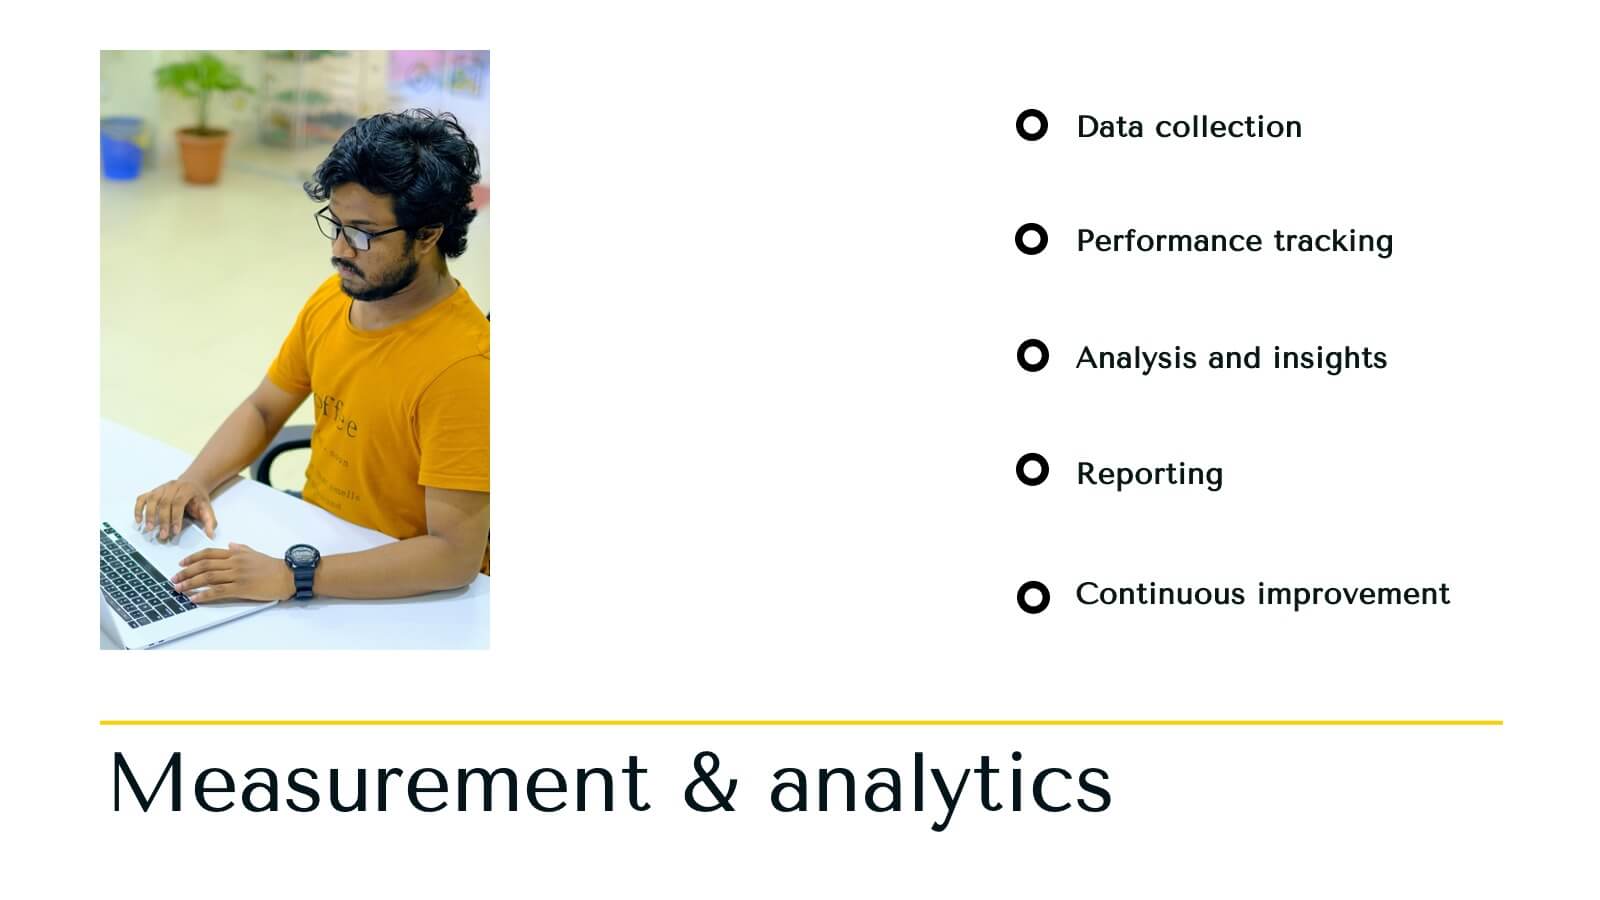
Showcase your agency's excellence with this dynamic and modern presentation template. Ideal for presenting market analysis, client success stories, and strategic development plans, it features a bold design with a vibrant yellow and black theme. Highlight your unique approach and creative process to captivate your audience. Compatible with PowerPoint, Keynote, and Google Slides, it's perfect for any platform.


6 slides
Statistics and Figures Report Presentation
Present complex data with clarity using the Statistics and Figures Report Presentation template. Featuring scatter plots, radar charts, and key metric highlights, this template is perfect for performance tracking, analytics reports, and business reviews. Fully customizable for PowerPoint, Keynote, and Google Slides, it ensures professional and insightful data visualization.


4 slides
RACI Matrix for Role Assignment Presentation
Simplify team roles and task ownership with this RACI Matrix for Role Assignment slide. Clearly map out who is Responsible, Accountable, Consulted, and Informed for each project task across team members. Ideal for project planning, team meetings, or stakeholder alignment. This structured matrix layout allows easy customization for names, tasks, and role indicators. Fully editable and compatible with PowerPoint, Keynote, and Google Slides.


5 slides
Revenue Streams & Expense Management Layout Presentation
Visualize your income and costs with the Revenue Streams & Expense Management Layout Presentation. This slide layout uses a vertical arrow chart to display four data categories, ideal for comparing sources of income and related expenditures. Great for financial reports, budgeting reviews, and strategy discussions. Compatible with Canva, PowerPoint, Google Slides, and Keynote.


21 slides
Nucleus Project Timeline Presentation
Plan with precision using this clean and modern Project Timeline Presentation Template. Highlight key phases, milestones, and deliverables with visually organized sections such as Project Overview, Objectives, Budget Breakdown, Resource Allocation, and Risk Management. Perfect for presenting timelines, evaluation criteria, and next steps to stakeholders. Fully customizable and compatible with PowerPoint, Keynote, and Google Slides.