


Features
- 20 Unique slides
- Fully editable and easy to edit in Microsoft Powerpoint, Keynote and Google Slides
- 16:9 widescreen layout
- Clean and professional designs
- Export to JPG, PDF or send by email


Do you have any questions?
Recommend
4 slides
Arrow Path Business Journey Presentation
Visualize growth, decisions, and direction with the Arrow Path Business Journey Presentation. This dynamic slide is designed to illustrate key stages, multiple outcomes, or strategic forks in the road. Great for showing parallel team tracks, phased development, or transformation journeys. Fully editable and works seamlessly in PowerPoint, Google Slides, and Canva.


26 slides
Maev Presentation Template
Maev is a perfect modern template with a clean and professional feel. Maev was designed by professionals to help businesses connect with their audience. This template has a modern, chic aesthetic and very detailed look which is extremely appealing. The colors are fresh which help keep the look clean and easy to read. The theme comes packed with features to target your audience and help you get your message across. Charts, timelines and easy to edit text, this template is perfect for businesses seeking to make an impression on their audience. by demonstrating they are transparent and reliable.
5 slides
Feedback Rating Smile Icons Presentation
Light up your presentation with a playful visual that turns audience feedback into clear, colorful insights. This slide helps you compare ratings, highlight sentiment patterns, and present review data in a friendly, memorable way. Perfect for surveys, reports, and performance reviews. Fully compatible with PowerPoint, Keynote, and Google Slides.


6 slides
Leadership Vision and Strategy Presentation
Present your organization’s goals with this leadership vision and strategy template, designed with a hierarchy graphic to represent team structure and growth. Perfect for strategic planning, leadership meetings, and corporate presentations. Fully editable in Canva, PowerPoint, or Google Slides, making it easy to customize colors, text, and layout to fit your brand.


12 slides
Digital Marketing Strategy Presentations
Turn complex campaigns into captivating visuals with this modern, data-driven layout designed for marketing professionals. Perfect for outlining strategies, performance metrics, and digital funnels, it keeps information clear and visually engaging. Easily customizable and fully compatible with PowerPoint, Keynote, and Google Slides for seamless editing across your favorite platforms.


22 slides
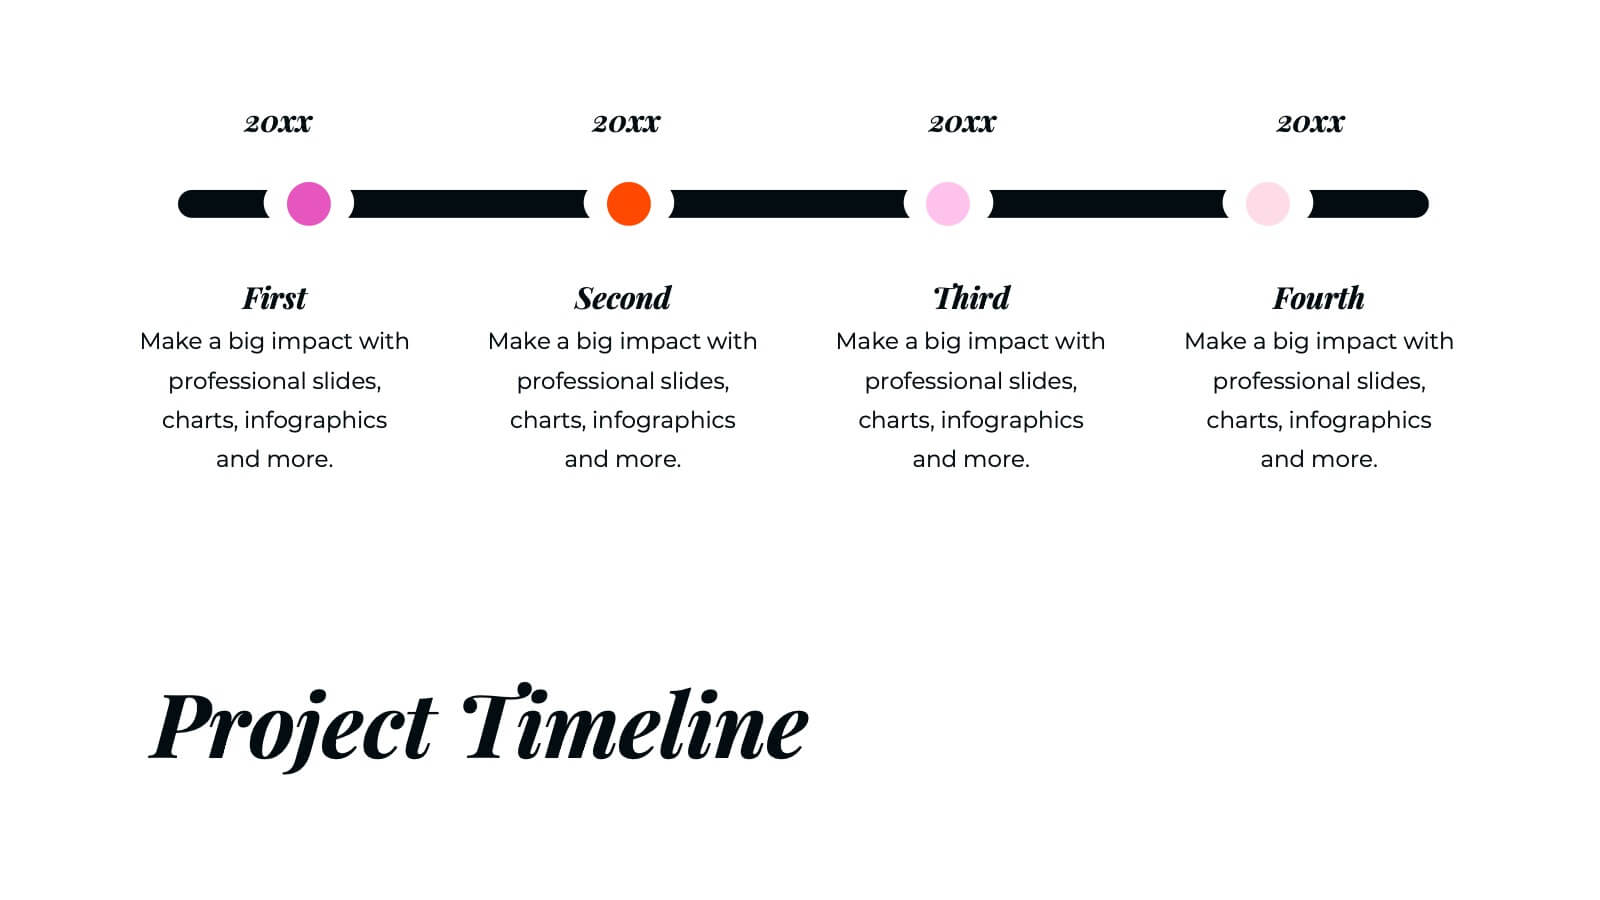
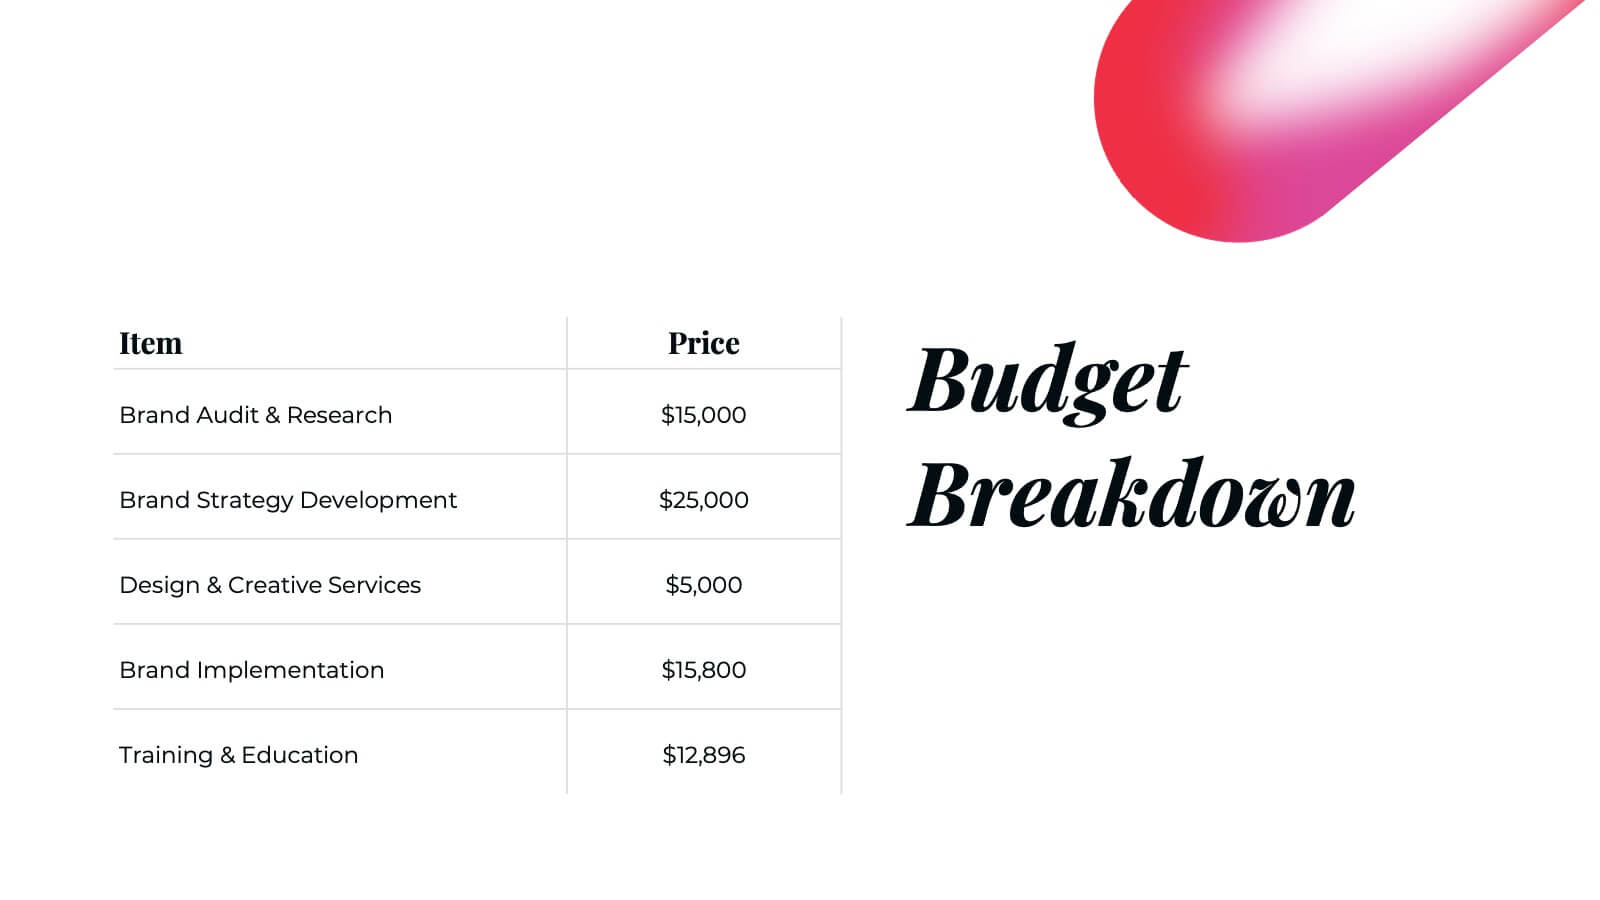
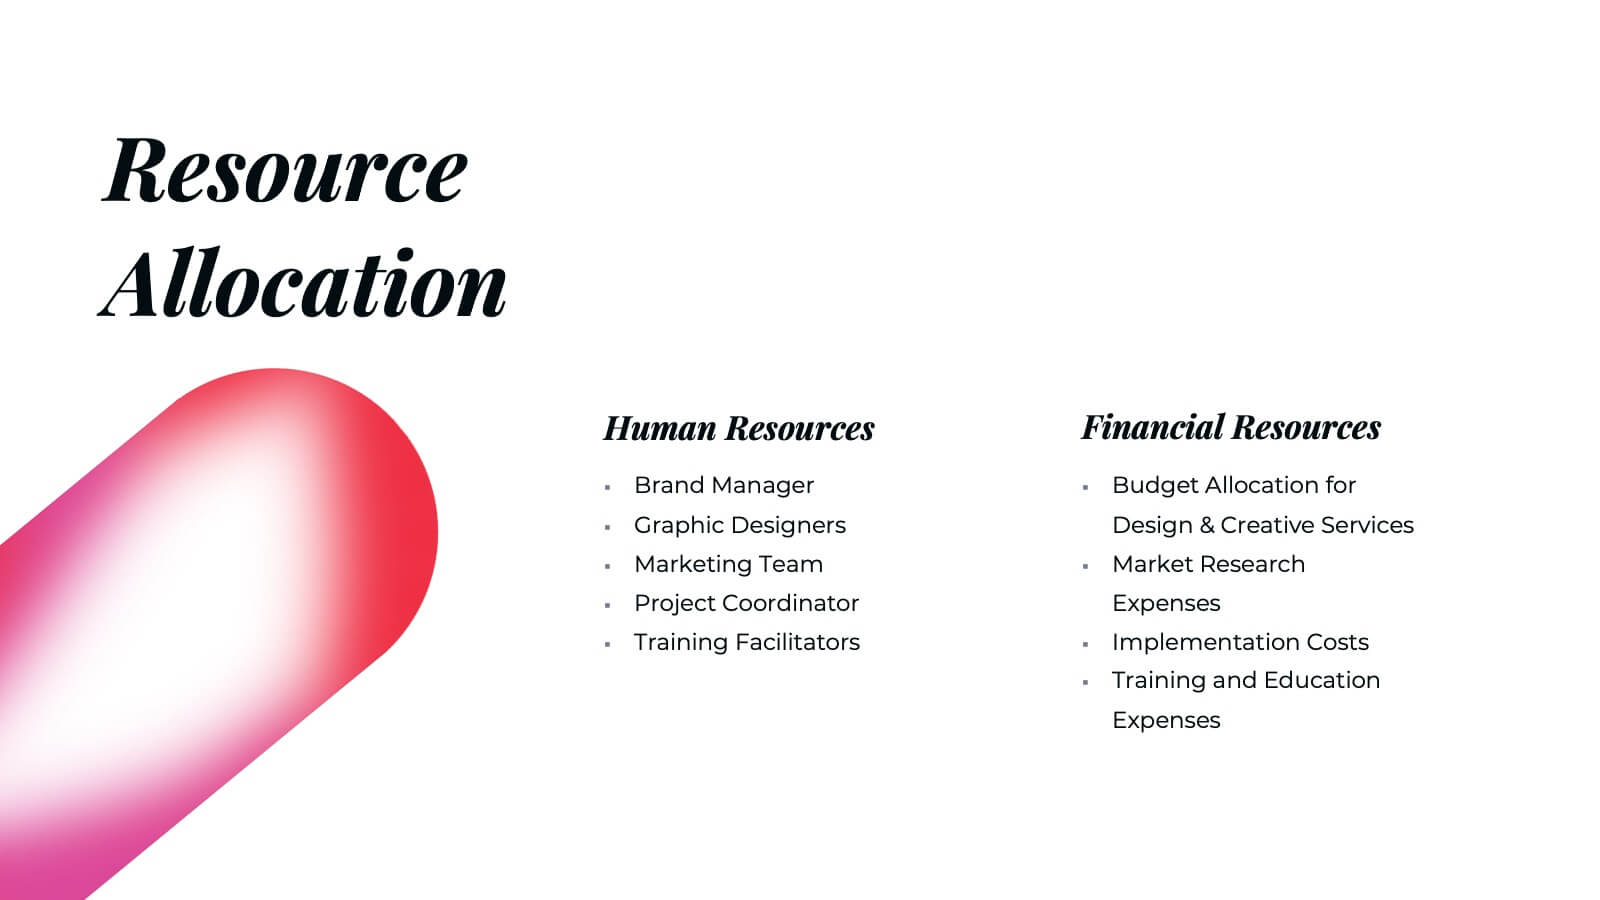
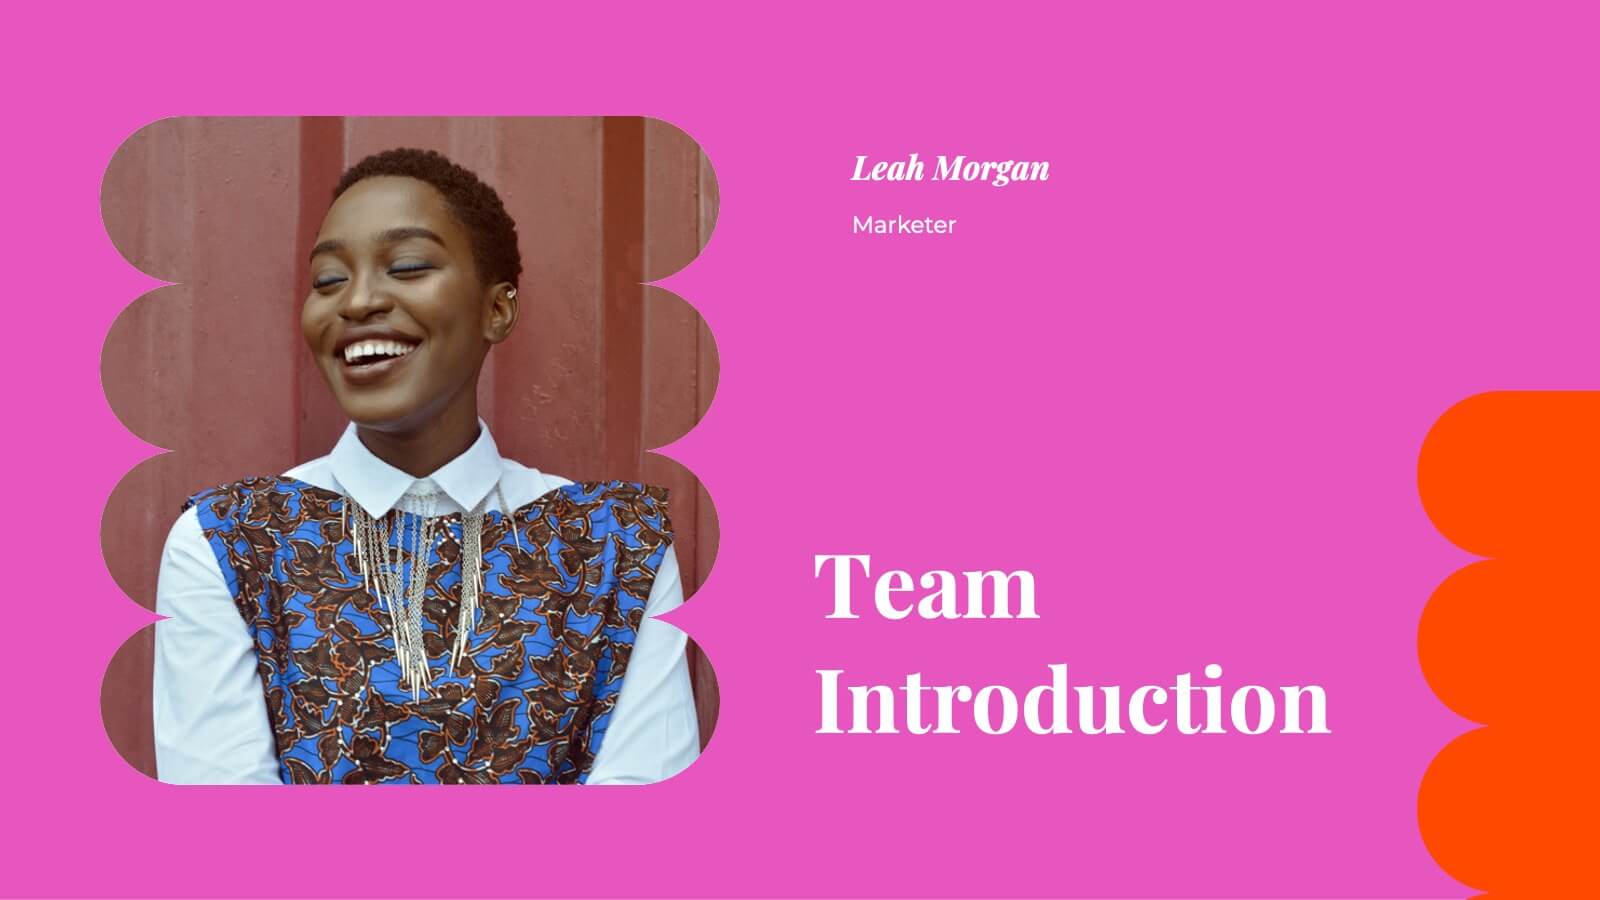
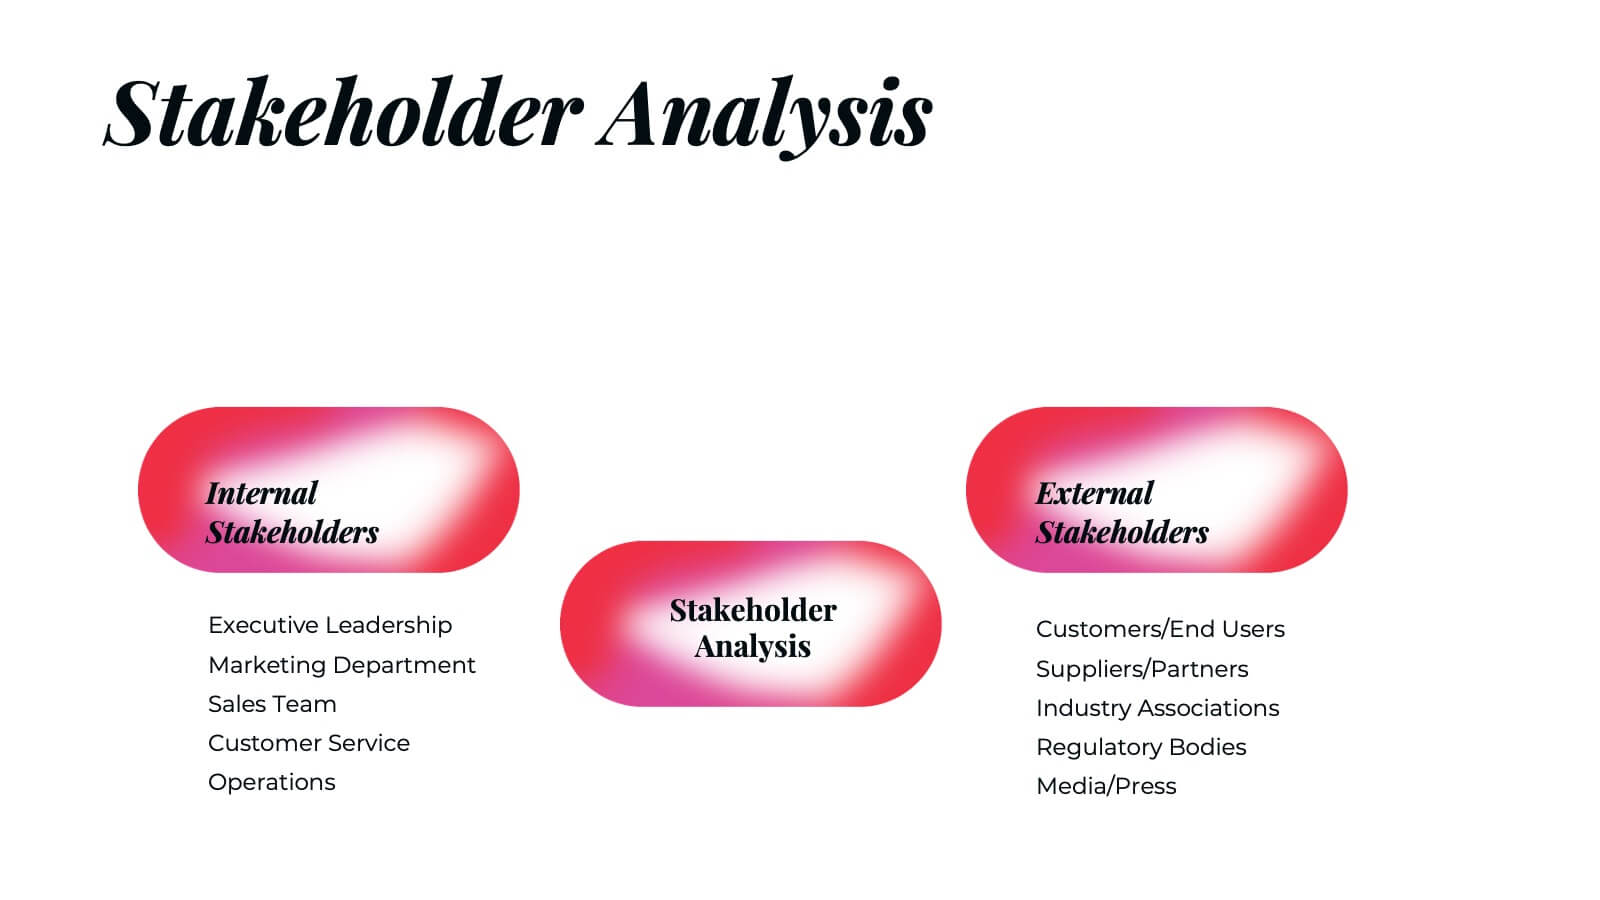
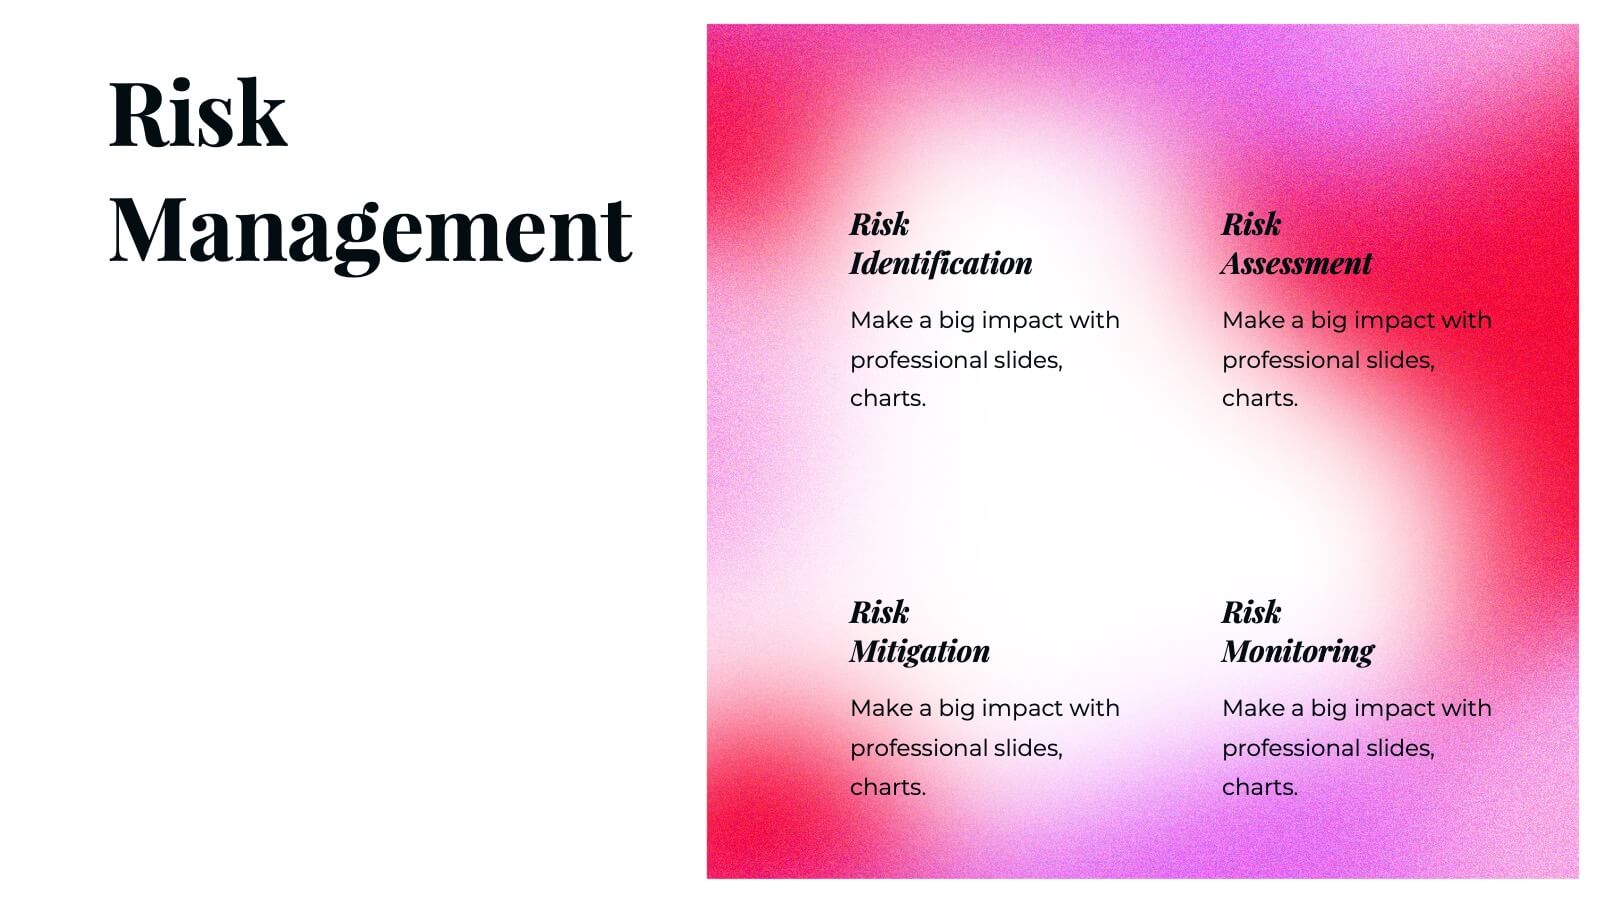
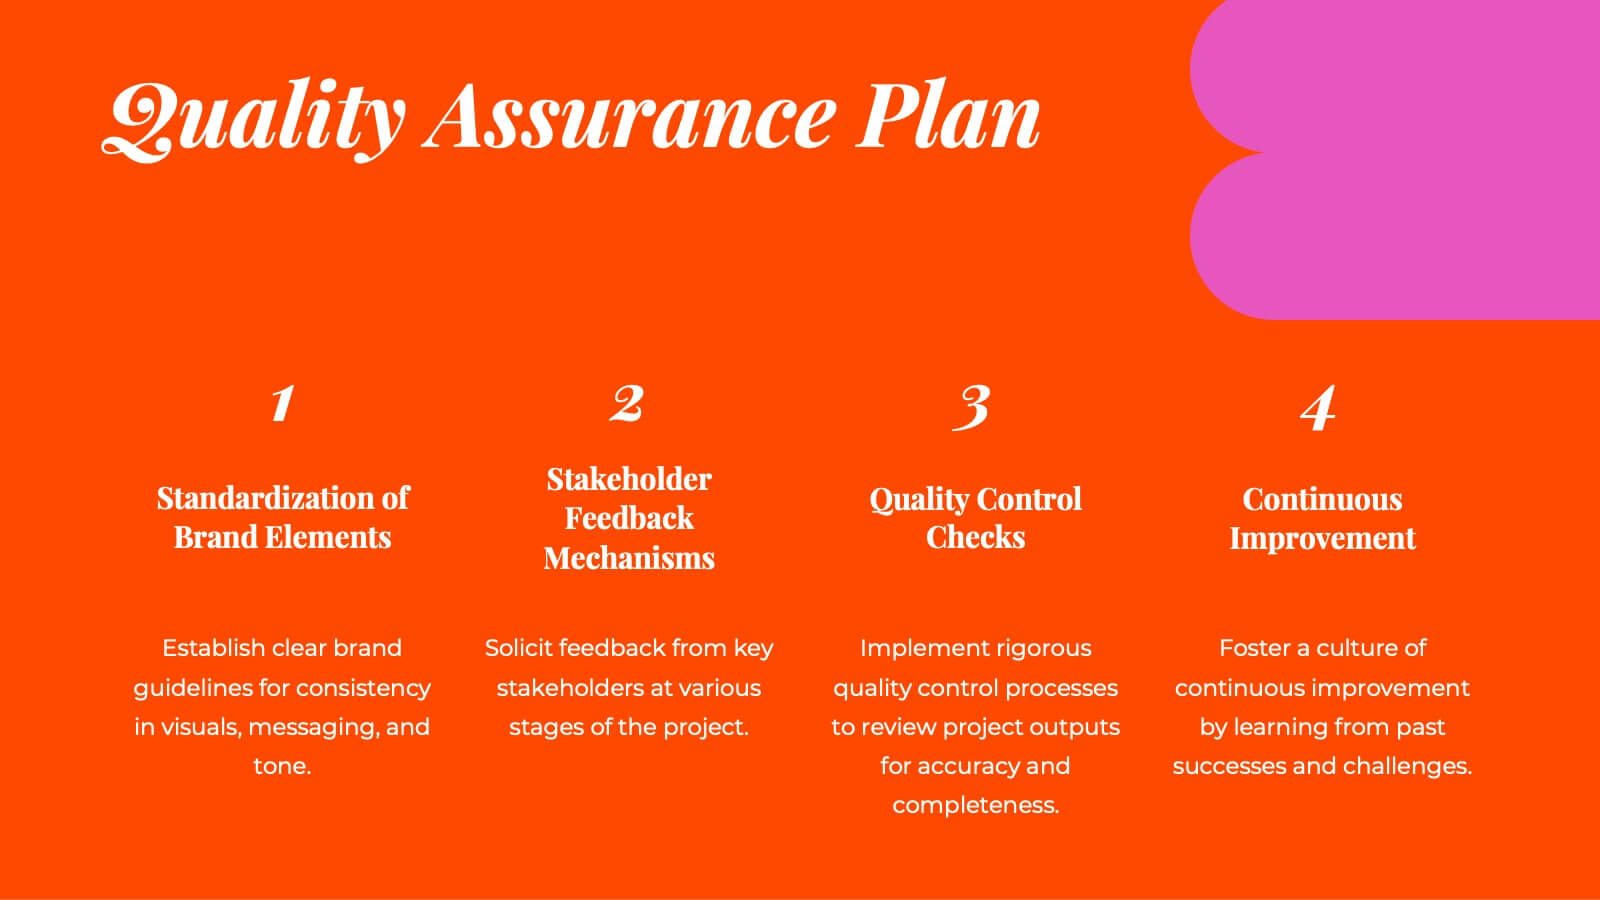
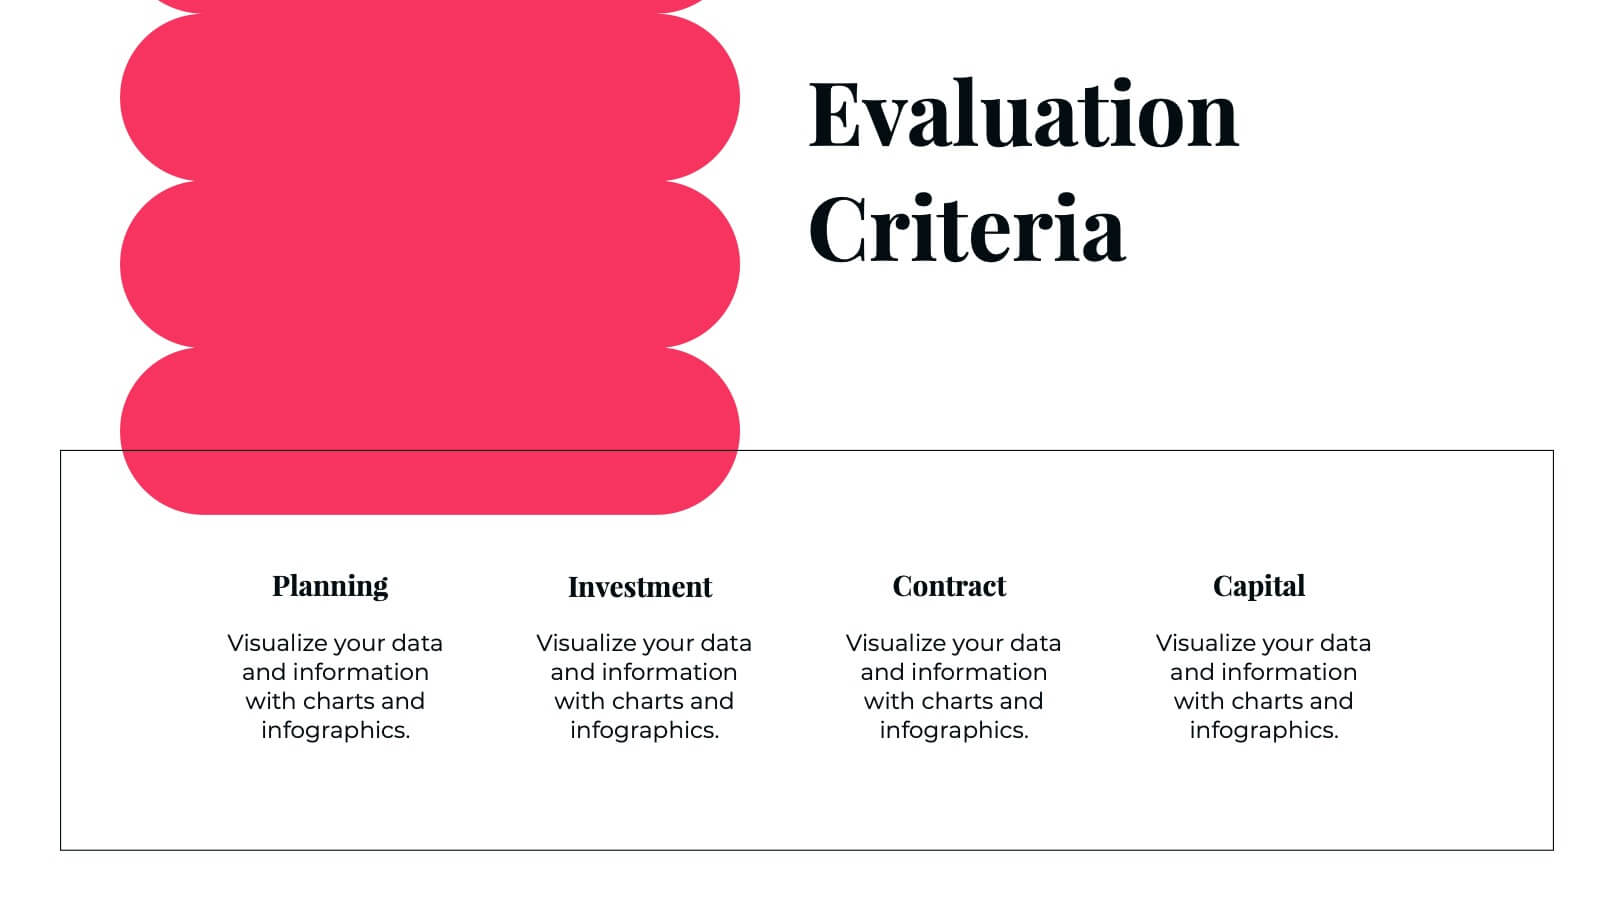
Moonstone Detailed Project Execution Plan Presentation
Create a compelling project execution plan with this vibrant and well-structured presentation template! Covering every key aspect from problem statements and objectives to risk management and quality assurance, this template provides a clear roadmap for your project. It’s perfect for organizing timelines, budget breakdowns, and stakeholder analysis. Compatible with PowerPoint, Keynote, and Google Slides for smooth presentations.


11 slides
Company Team Meeting Presentation
Bring your team together with our dynamic Company Team Meeting presentation template. Designed for clarity and engagement, this template sets the stage for productive discussions, from weekly roundups to strategic planning sessions. It begins with a vibrant cover slide that sets an upbeat tone for the meeting, followed by a clear agenda to keep your discussion on track. With slides tailored for talking points, updates, upcoming events, and deadlines, it helps you streamline the flow of information. The template includes sections for announcements and feedback, encouraging open dialogue. Ground rules are laid out to foster a respectful and collaborative environment, while the progress and challenges slides are perfect for a transparent review of the company's status and addressing any hurdles head-on with practical solutions. This template, adaptable to PowerPoint, Keynote, and Google Slides, not only captures attention with its colorful design but also reinforces team cohesion and focus on common goals. Use it to energize your team meetings and ensure everyone leaves aligned and motivated.


26 slides
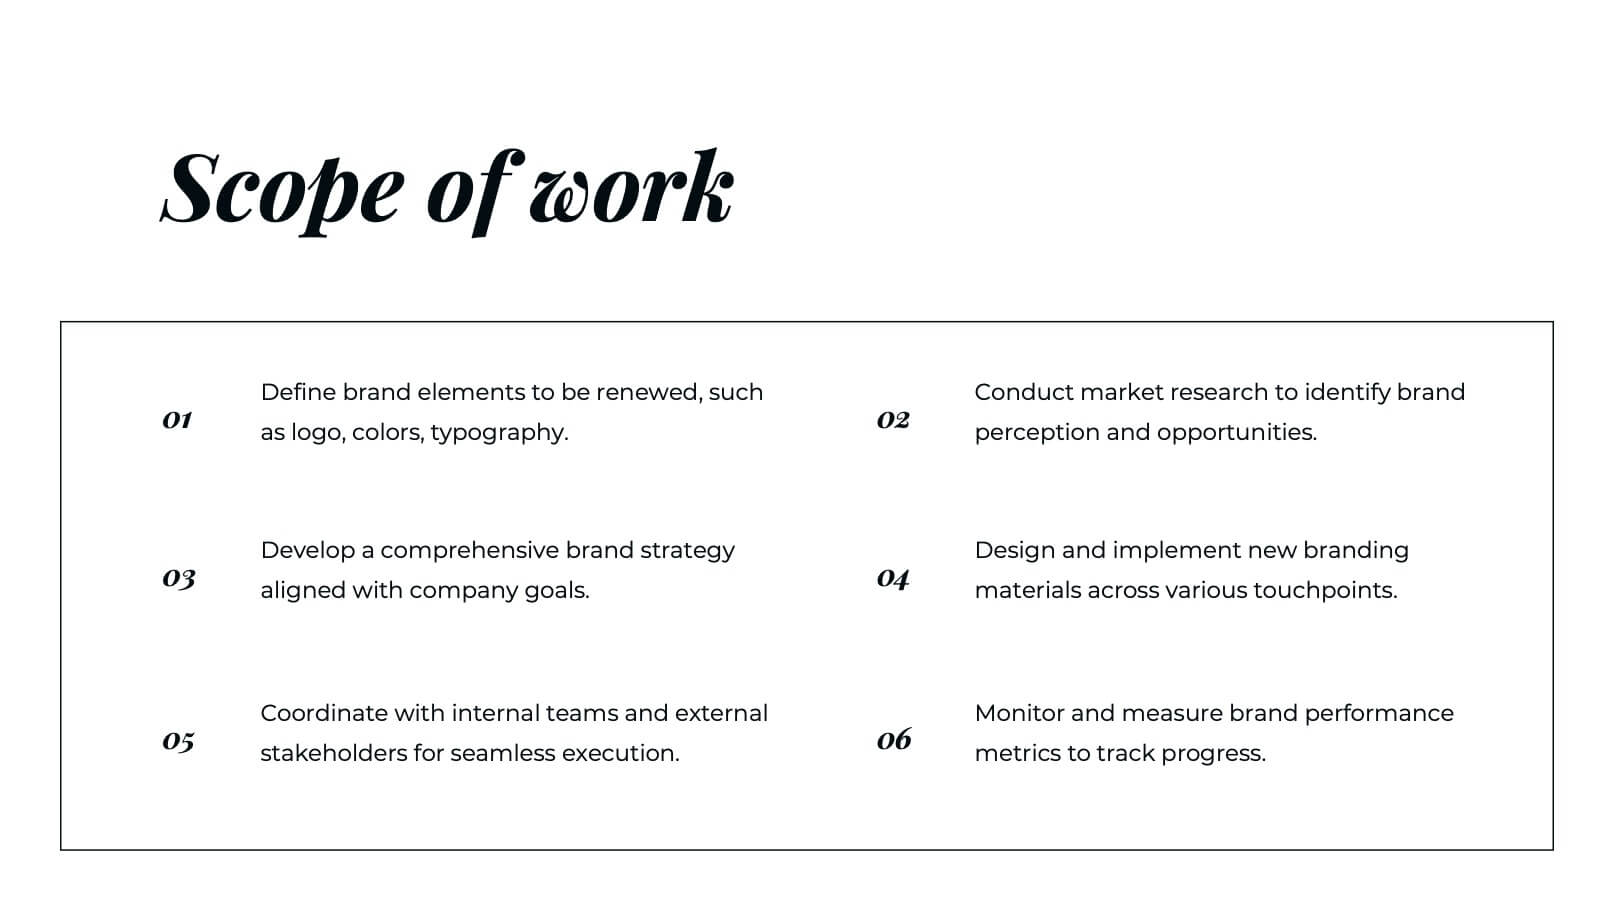
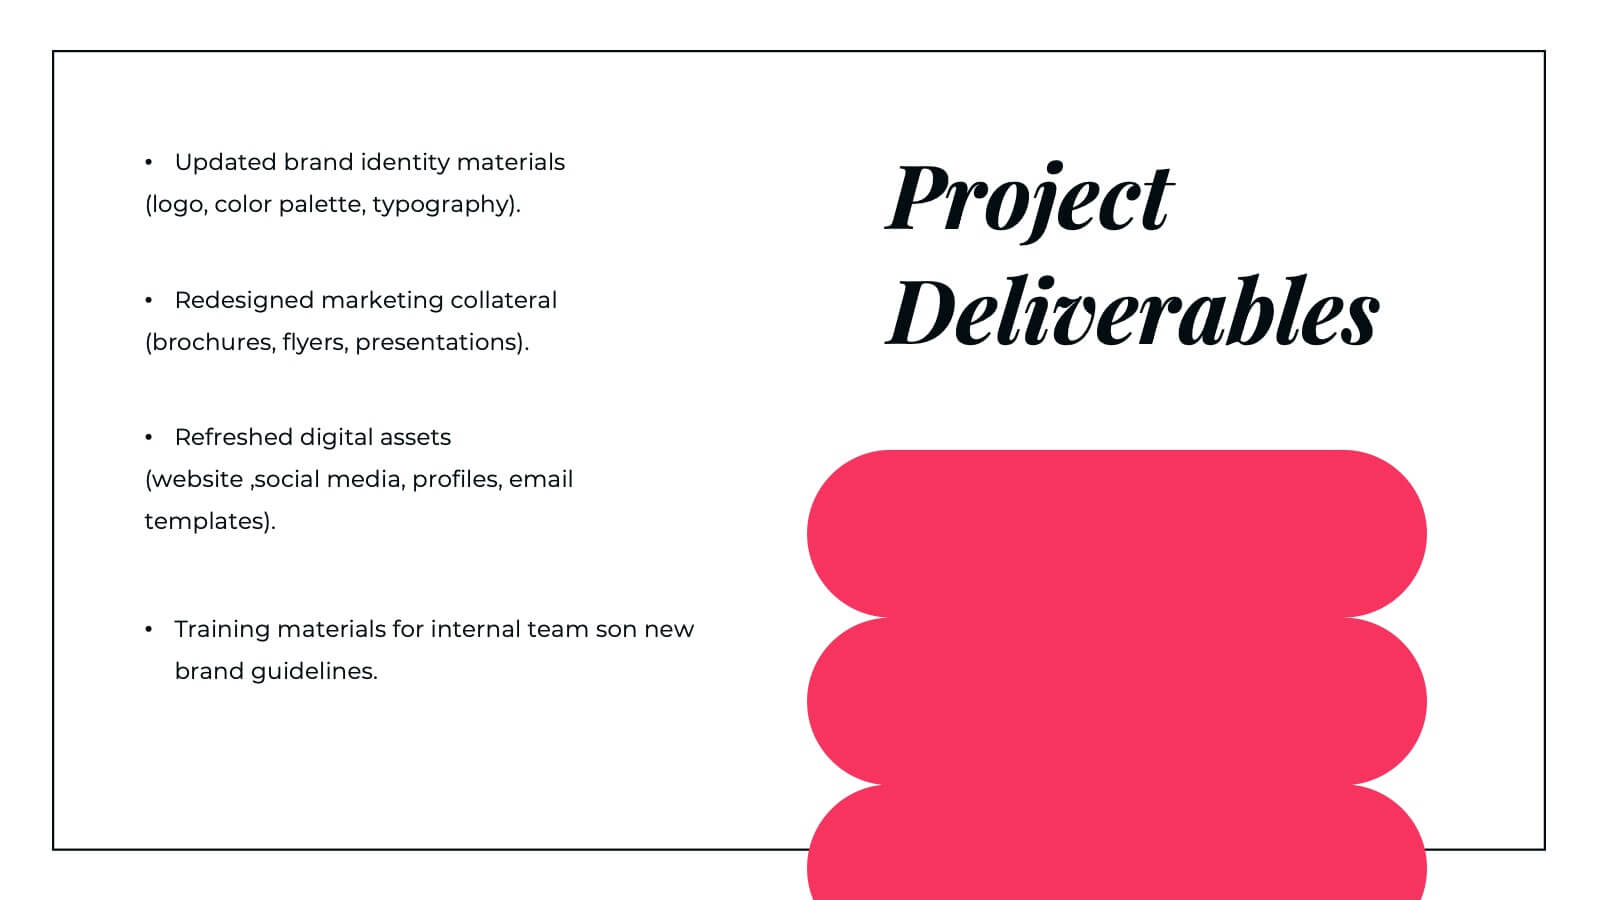
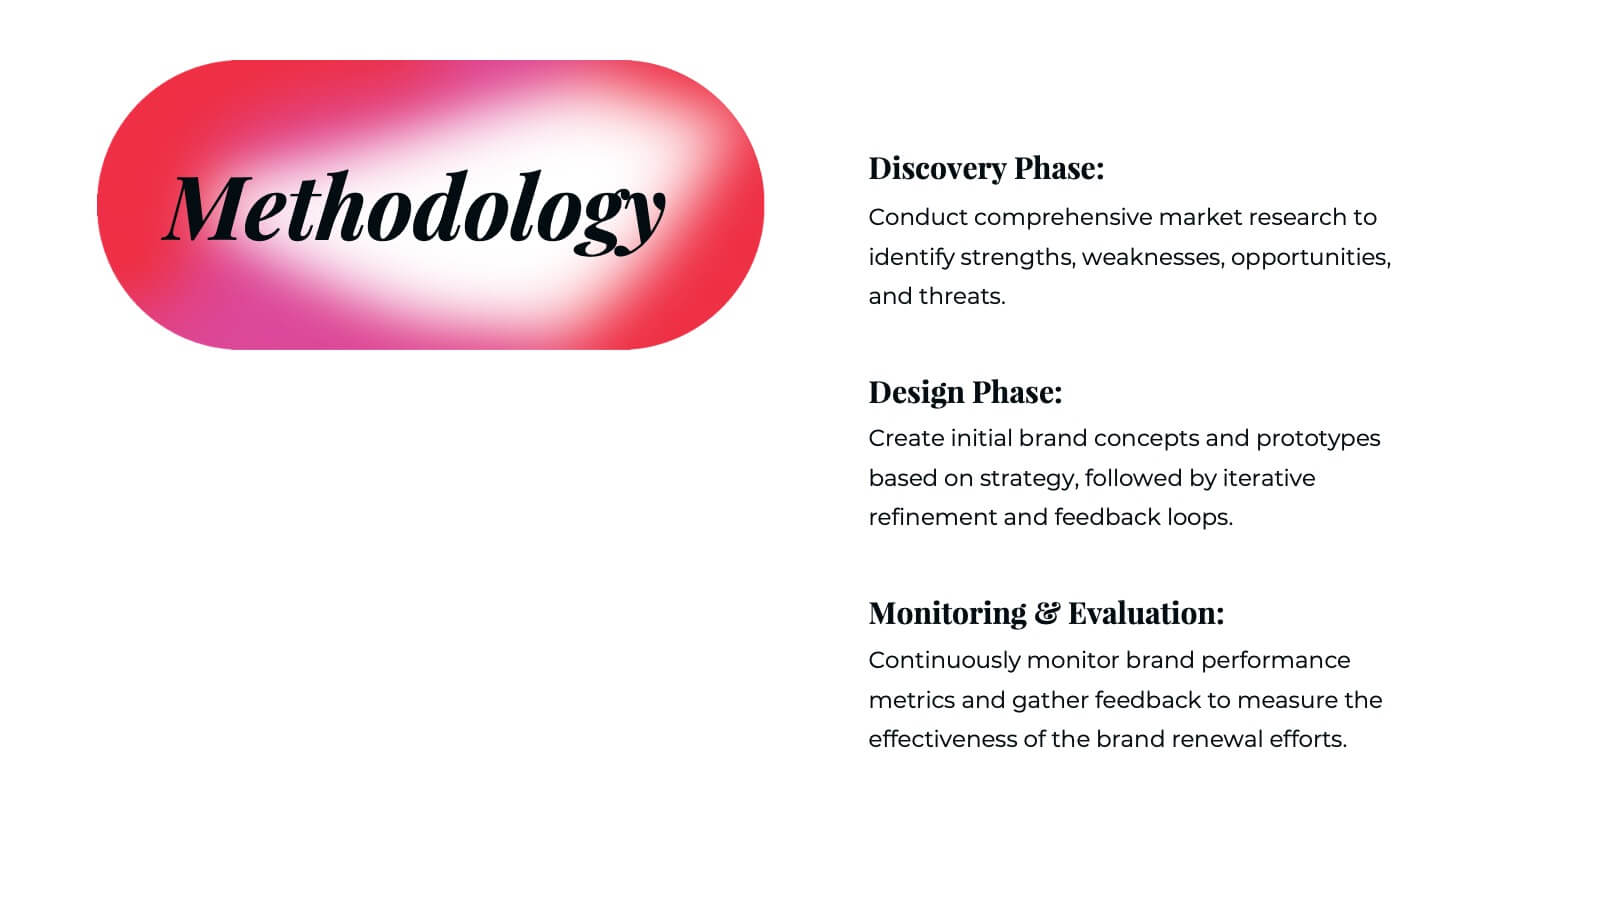
Olympus Brand Guidelines Proposal Presentation
The Olympus Brand Identity Presentation is a sleek and modern template designed to help you showcase your brand's unique identity and strategy. This template kicks off with a clean and engaging slide that sets the stage for the entire presentation. It guides you through various aspects of brand identity, including brand components, target audience, and unique selling proposition (USP). The template also dives into brand positioning, strategy, and guidelines, ensuring that your brand's message is consistent and compelling. Additionally, it covers brand experience, recognition, and recall, offering a comprehensive view of your brand's impact. With dedicated sections for performance metrics, brand success stories, and future development, this template provides a complete toolkit for effectively communicating your brand's strengths and vision. Fully compatible with PowerPoint, Keynote, and Google Slides, the Olympus template is perfect for any brand-focused presentation.


4 slides
Project Workflow Steps and Flowchart Presentation
Map out each phase of your project with clarity using the Project Workflow Steps and Flowchart Presentation. This detailed template offers a visual grid layout for illustrating task sequences, decision points, and team responsibilities. Ideal for project managers, analysts, and operations teams. Fully editable and compatible with PowerPoint, Keynote, and Google Slides.


21 slides
Aetherial UX Research Report Presentation
A professional and modern template for UX research presentations. Highlight key elements such as user personas, journey mapping, wireframes, and testing processes. Includes slides for accessibility considerations, design systems, and feedback iteration. Fully customizable and compatible with PowerPoint, Keynote, and Google Slides to deliver impactful insights and research findings.

1 slide
Professional Presentation Cover Slide Presentation
Make a bold first impression with this sleek and modern cover slide designed to introduce your presentation with confidence. Its clean layout and striking geometric shapes create a polished look while giving viewers a clear sense of professionalism. Perfect for business, marketing, or project presentations, and fully compatible with PowerPoint, Keynote, and Google Slides.


4 slides
Creative Title Layout Presentation
Give your presentation a fresh, artistic flair with a bold and playful cover design that instantly grabs attention. Ideal for creative portfolios, branding pitches, or modern business decks, this layout blends minimalism with fluid shapes for a dynamic look. Fully customizable in PowerPoint, Keynote, and Google Slides.


21 slides
Versa Product Development Plan Presentation
Bring your product ideas to life with this sleek and professional presentation template. It covers every stage of the development process: from product overviews, features, and competitive analysis to pricing strategies, marketing plans, and technical specifications. Visually striking sections like distribution channels and production processes ensure a clear and structured roadmap for your team and stakeholders. Fully customizable and compatible with PowerPoint, Keynote, and Google Slides.


6 slides
Circular Concept Diagram for Strategy Presentation
Visualize interconnected ideas with this circular concept diagram, ideal for showcasing six key strategic pillars or processes. Each segment is clearly labeled and icon-supported, creating an easy-to-follow layout. Perfect for business planning, marketing strategies, or organizational models. Compatible with PowerPoint, Keynote, and Google Slides for full customization.


4 slides
Colorful Workflow Process Chart Presentation
Bring your workflow to life with a vibrant, easy-to-follow layout that makes every stage feel connected and purposeful. This presentation helps you map processes, explain team roles, and simplify complex steps using a clean, visual flow. Fully compatible with PowerPoint, Keynote, and Google Slides.


4 slides
Circular Strategy Model Presentation
Turn your ideas into a story that flows effortlessly with this clean and modern presentation design. Perfect for visualizing continuous improvement, collaboration strategies, or organizational frameworks, it helps you present key points in a clear circular format. Fully compatible with PowerPoint, Keynote, and Google Slides for easy customization.


6 slides
5-Stage Circular Cycle Presentation
Energize your workflow with a clean, circular layout that turns five interconnected steps into a clear, engaging story. This presentation helps you explain any repeating process or continuous cycle with simplicity and flow, making complex ideas easier to follow. Compatible with PowerPoint, Keynote, and Google Slides.