


Features
- 5 Unique slides
- Fully editable and easy to edit in Microsoft Powerpoint, Keynote and Google Slides
- 16:9 widescreen layout
- Clean and professional designs
- Export to JPG, PDF or send by email


Do you have any questions?
Recommend

21 slides
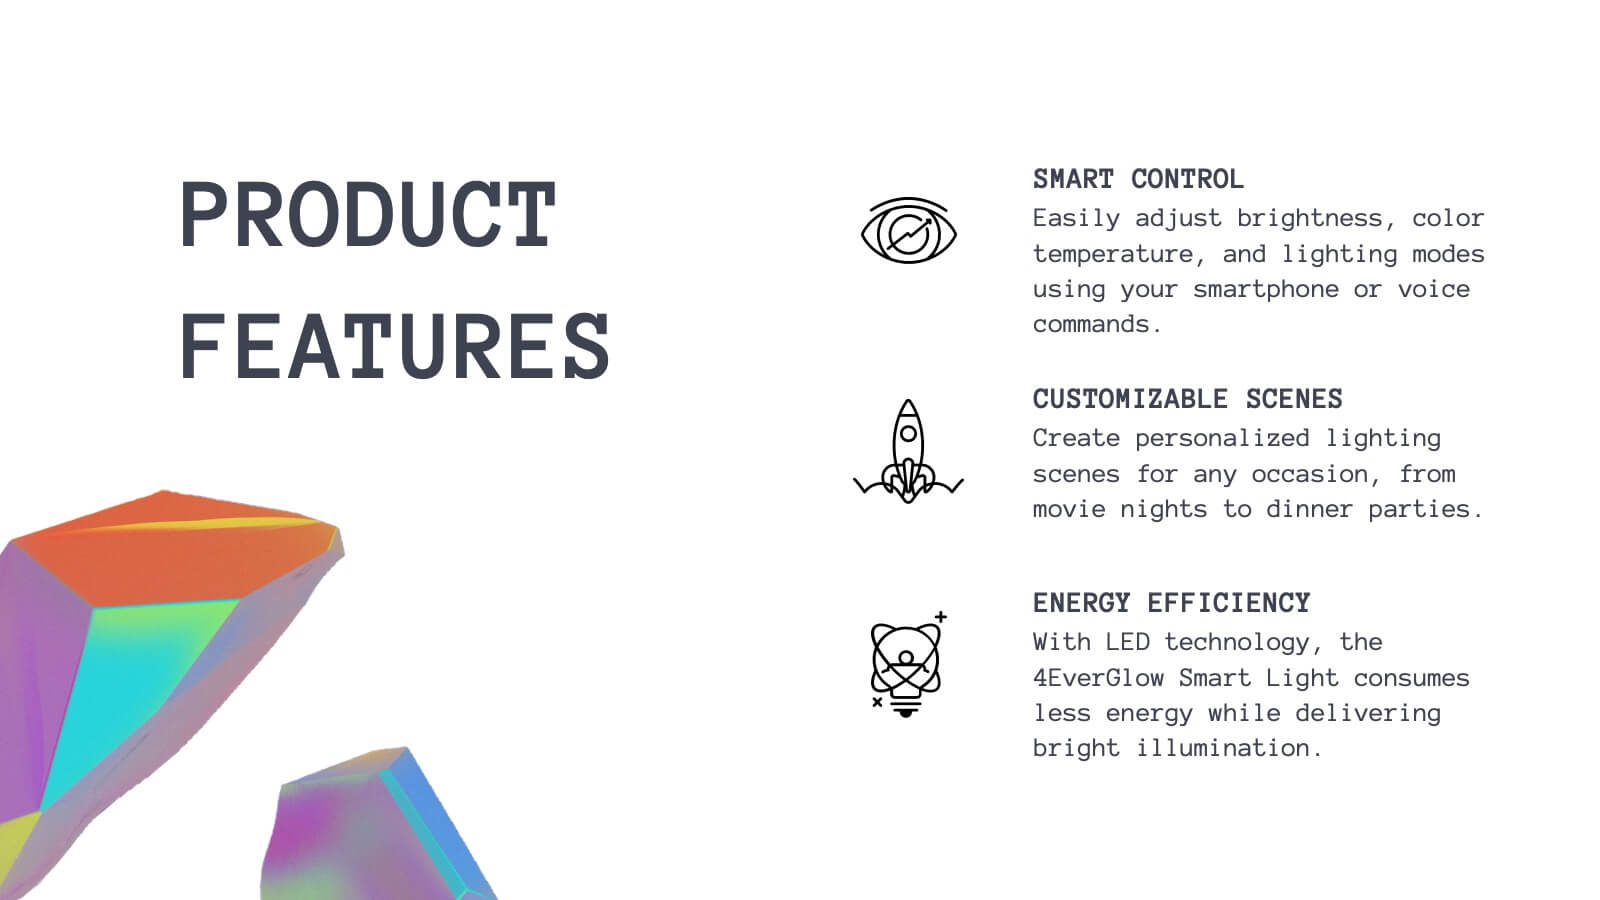
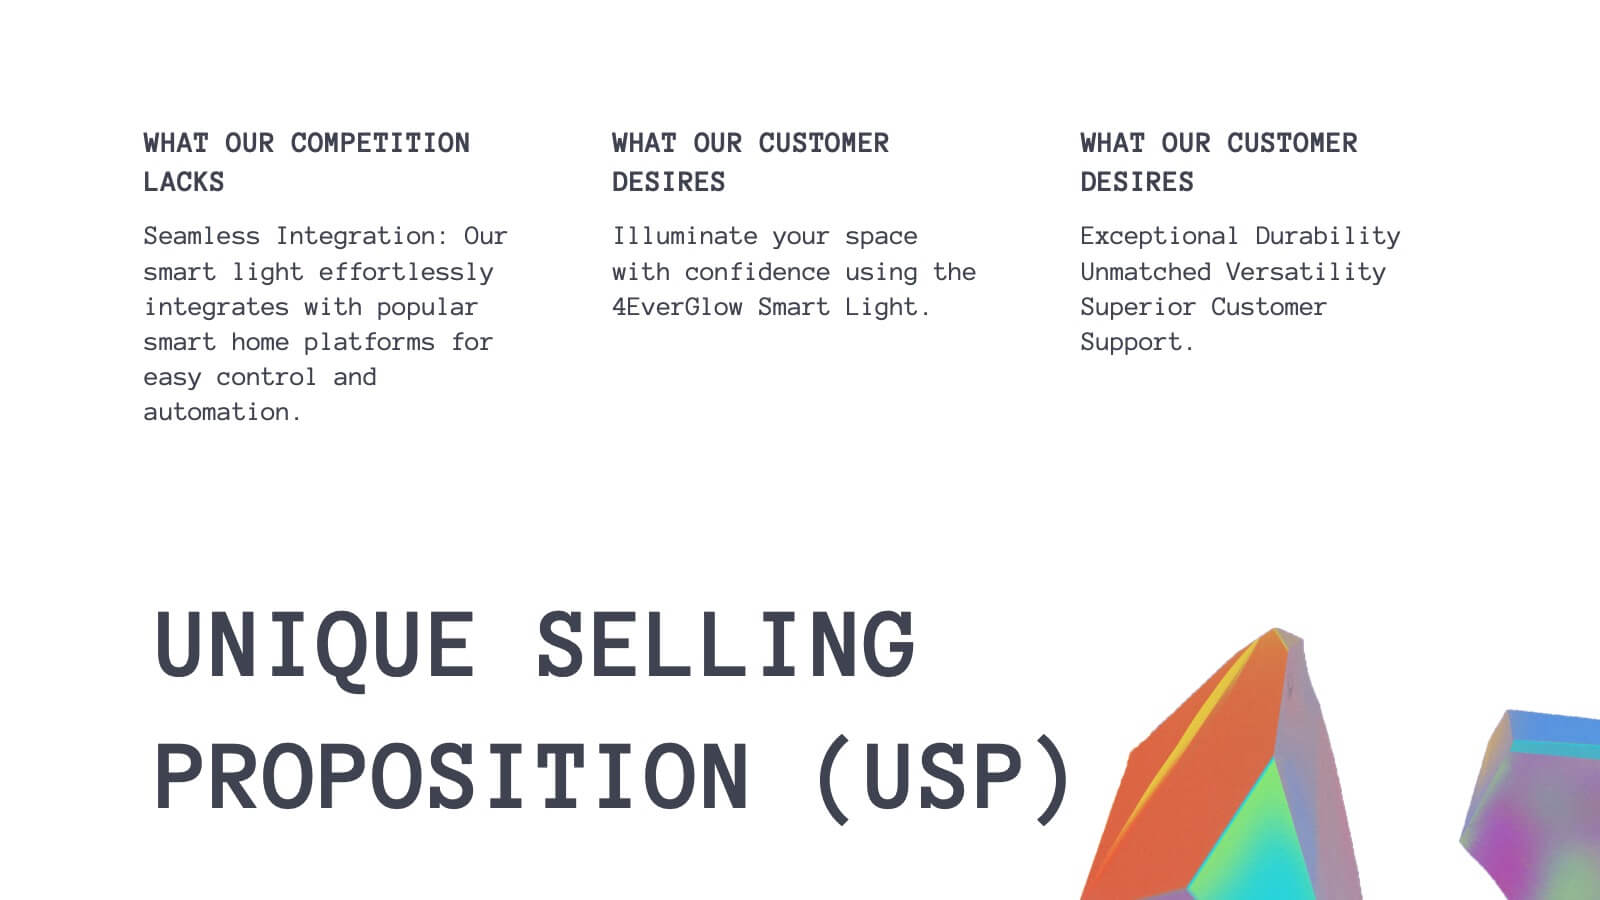
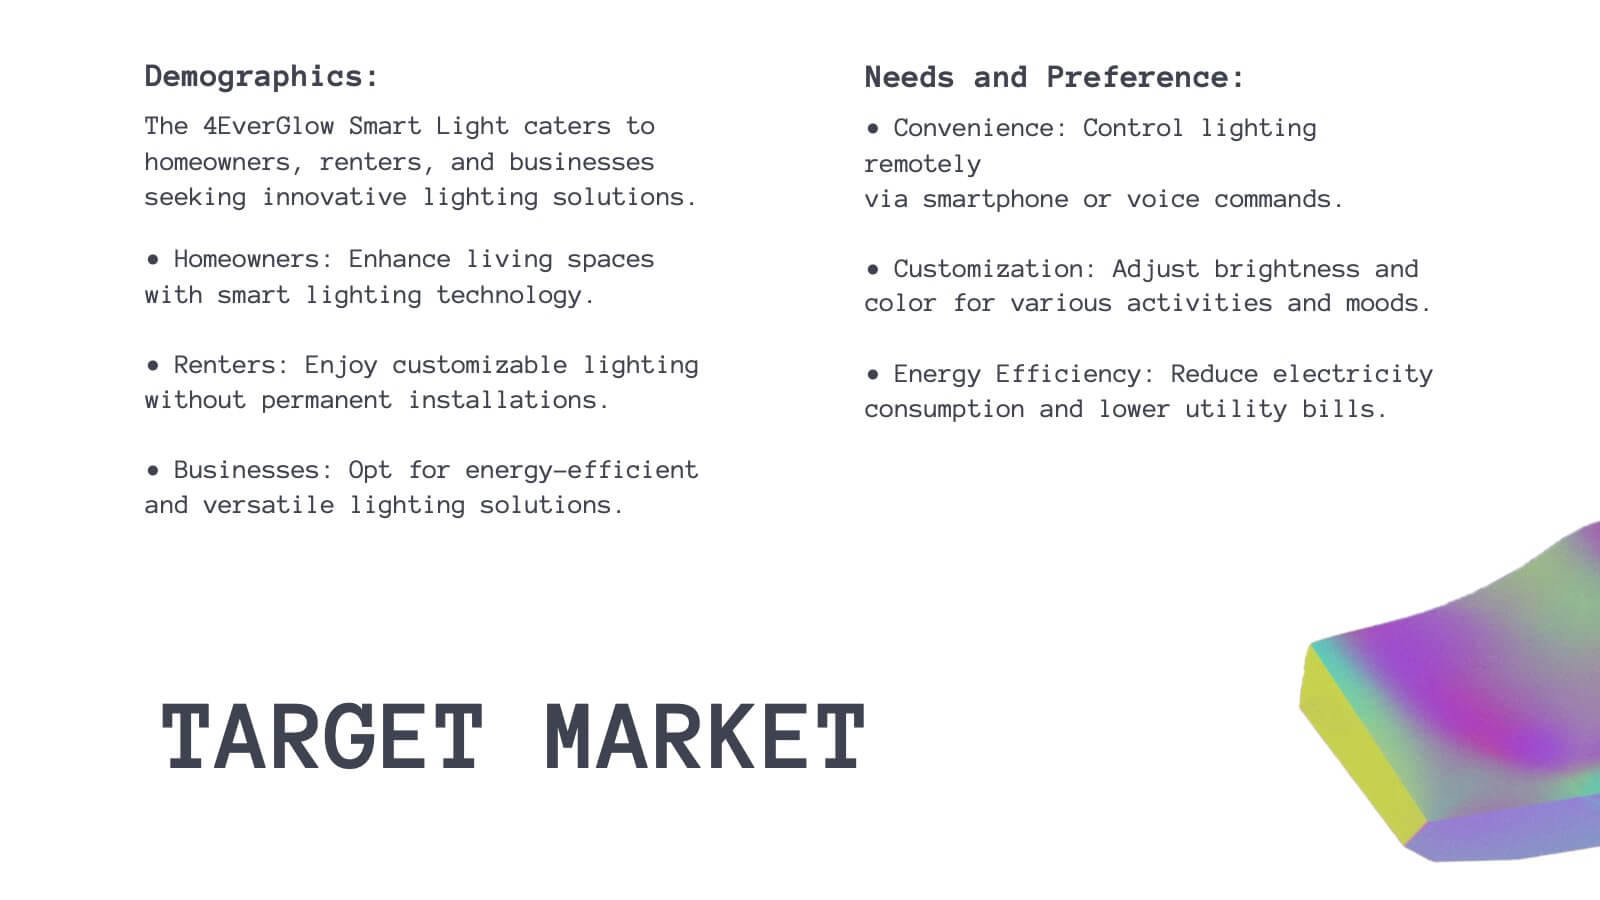
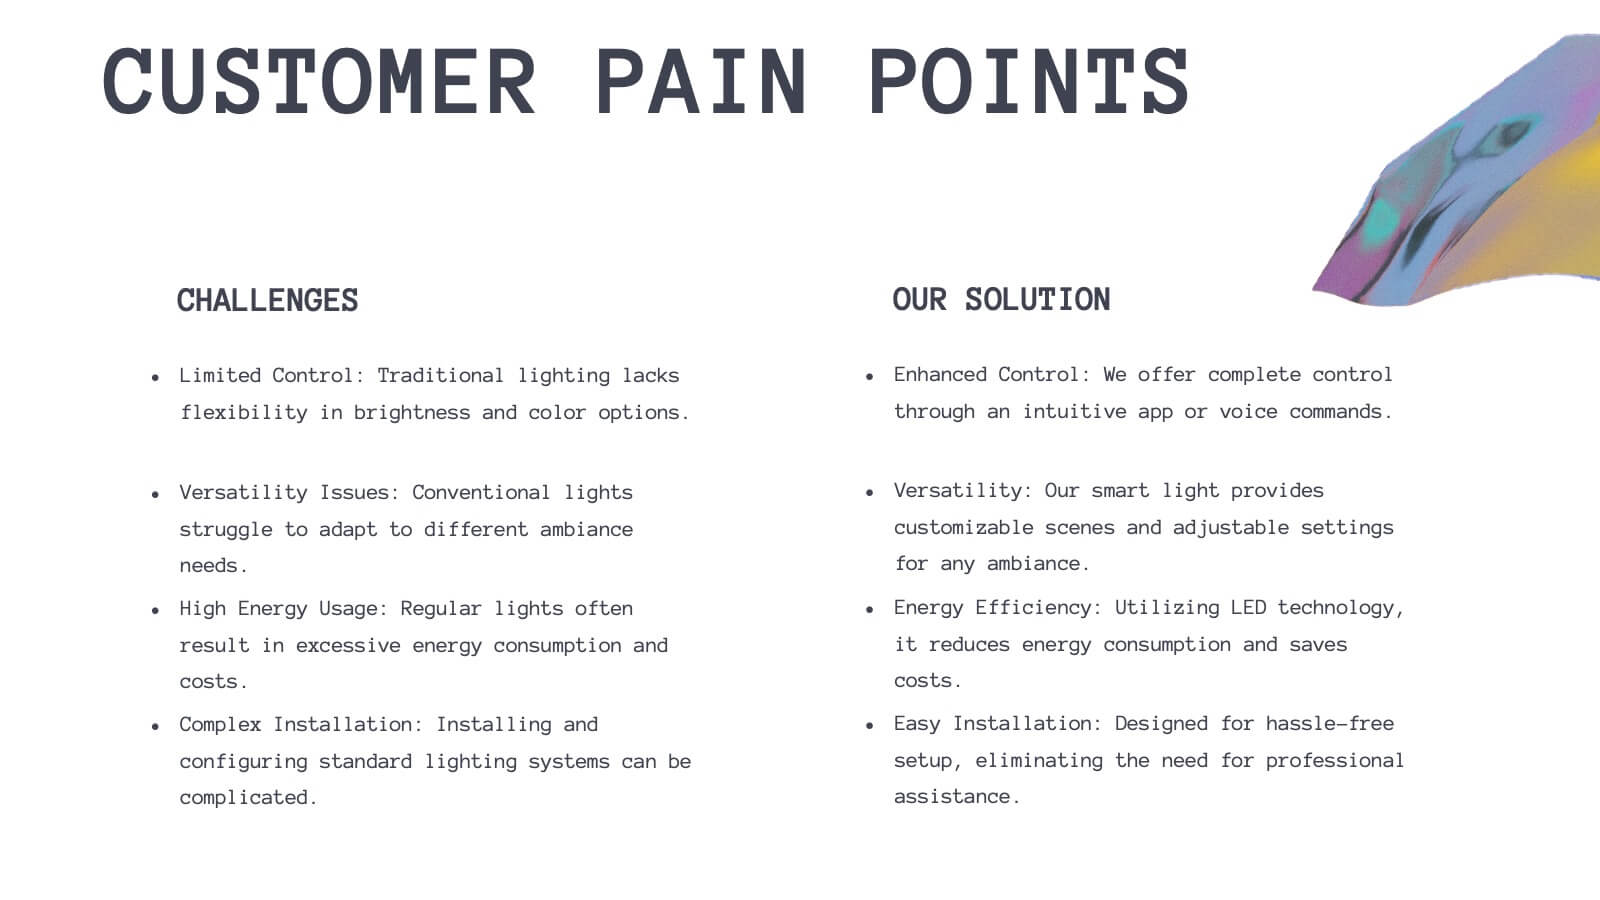
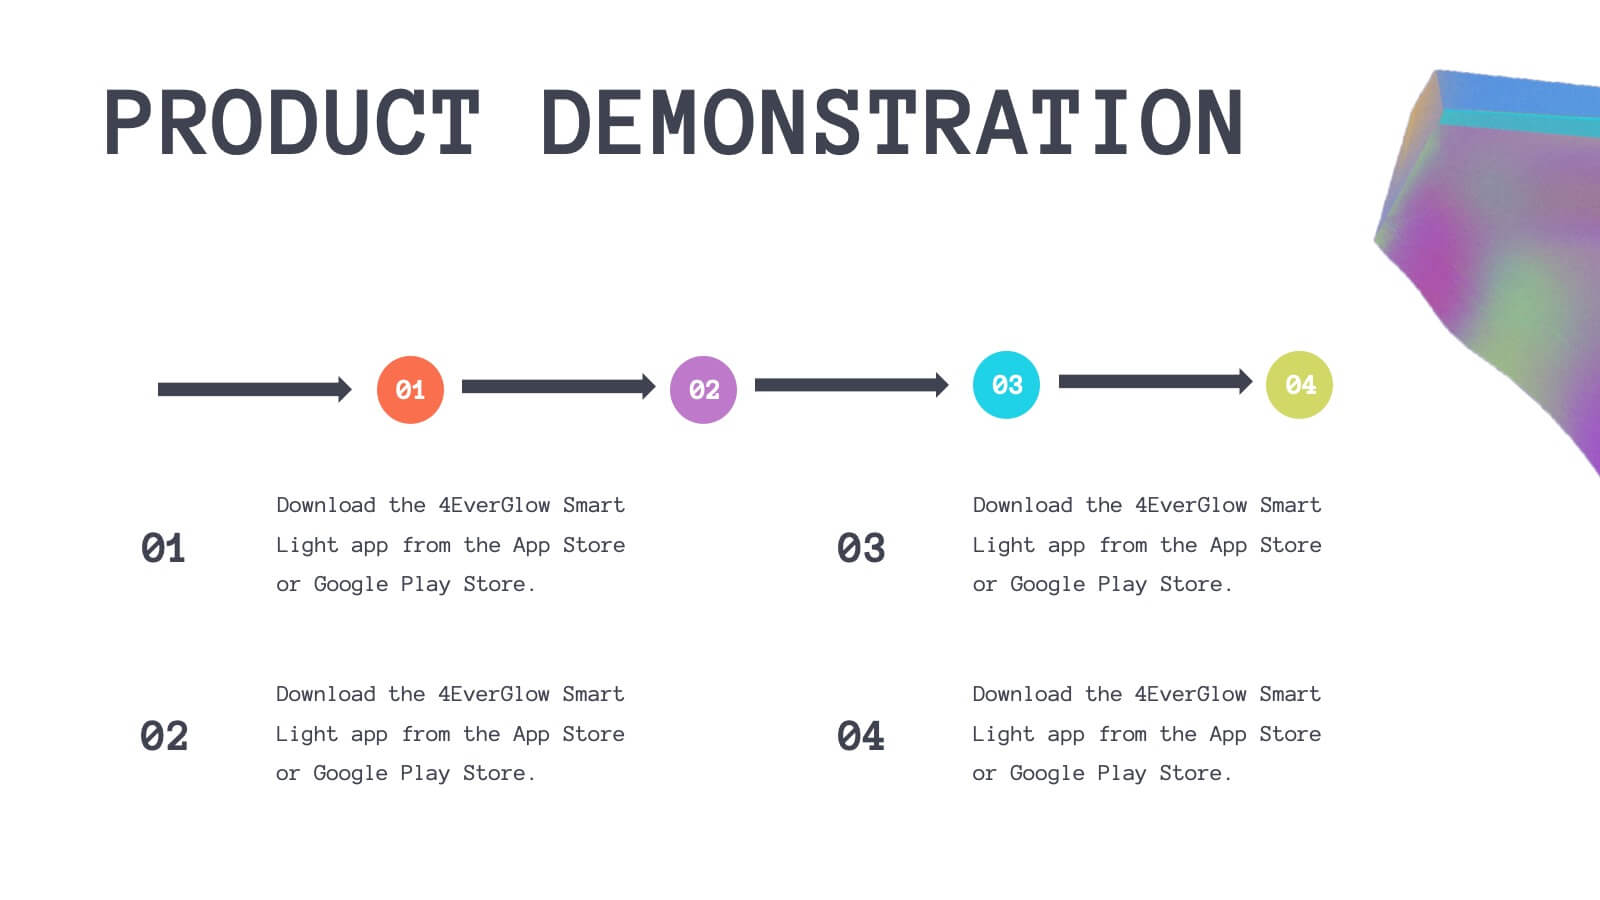
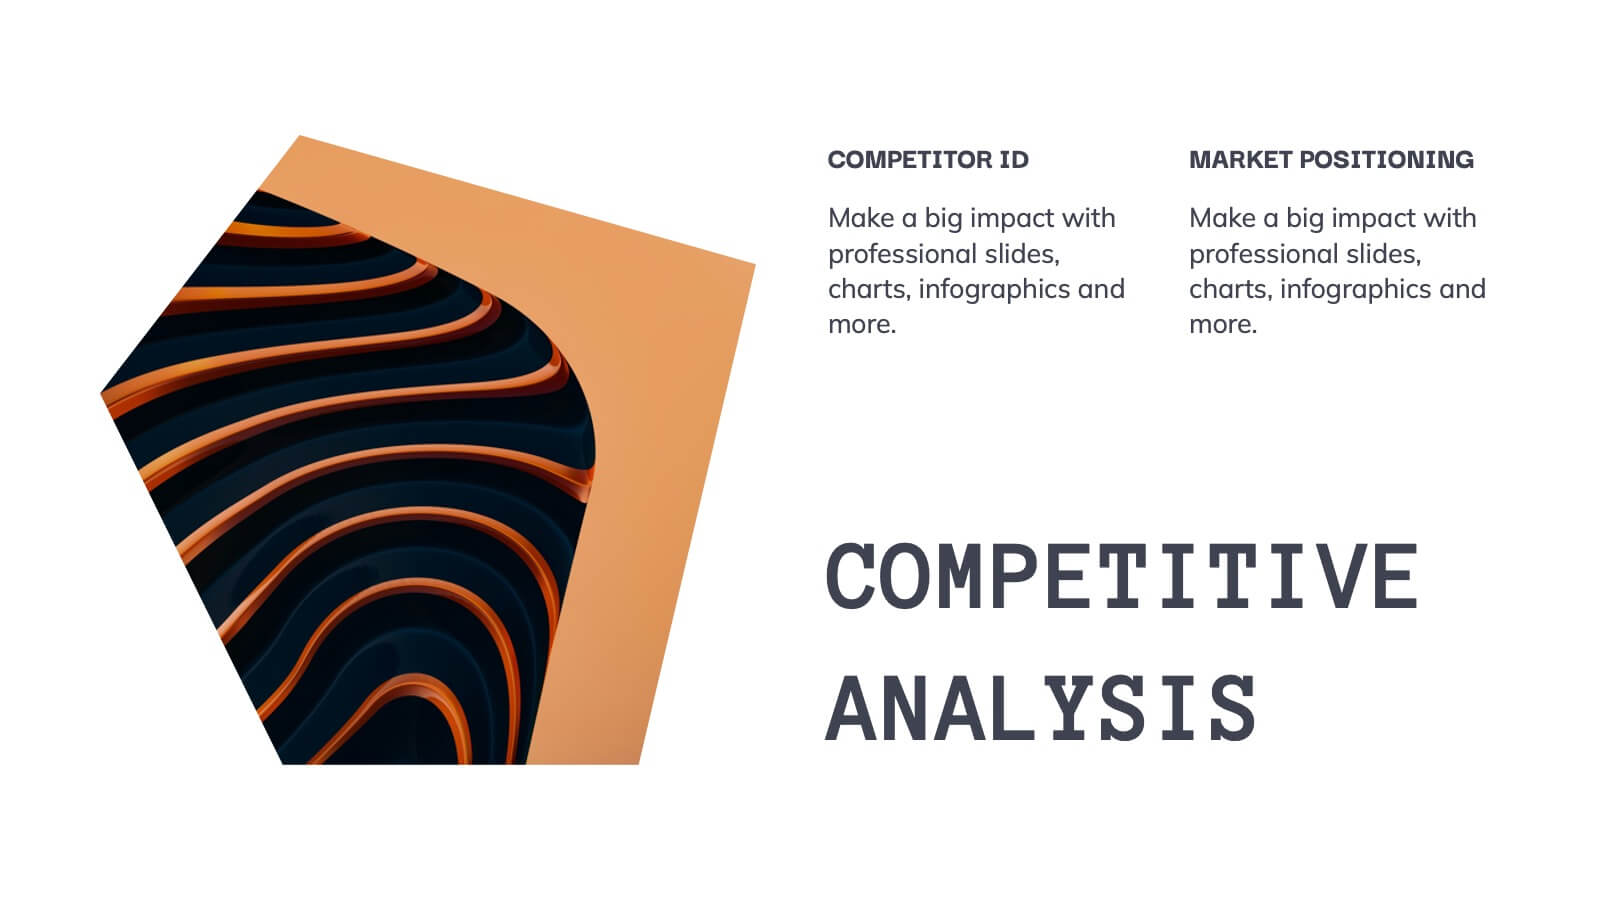
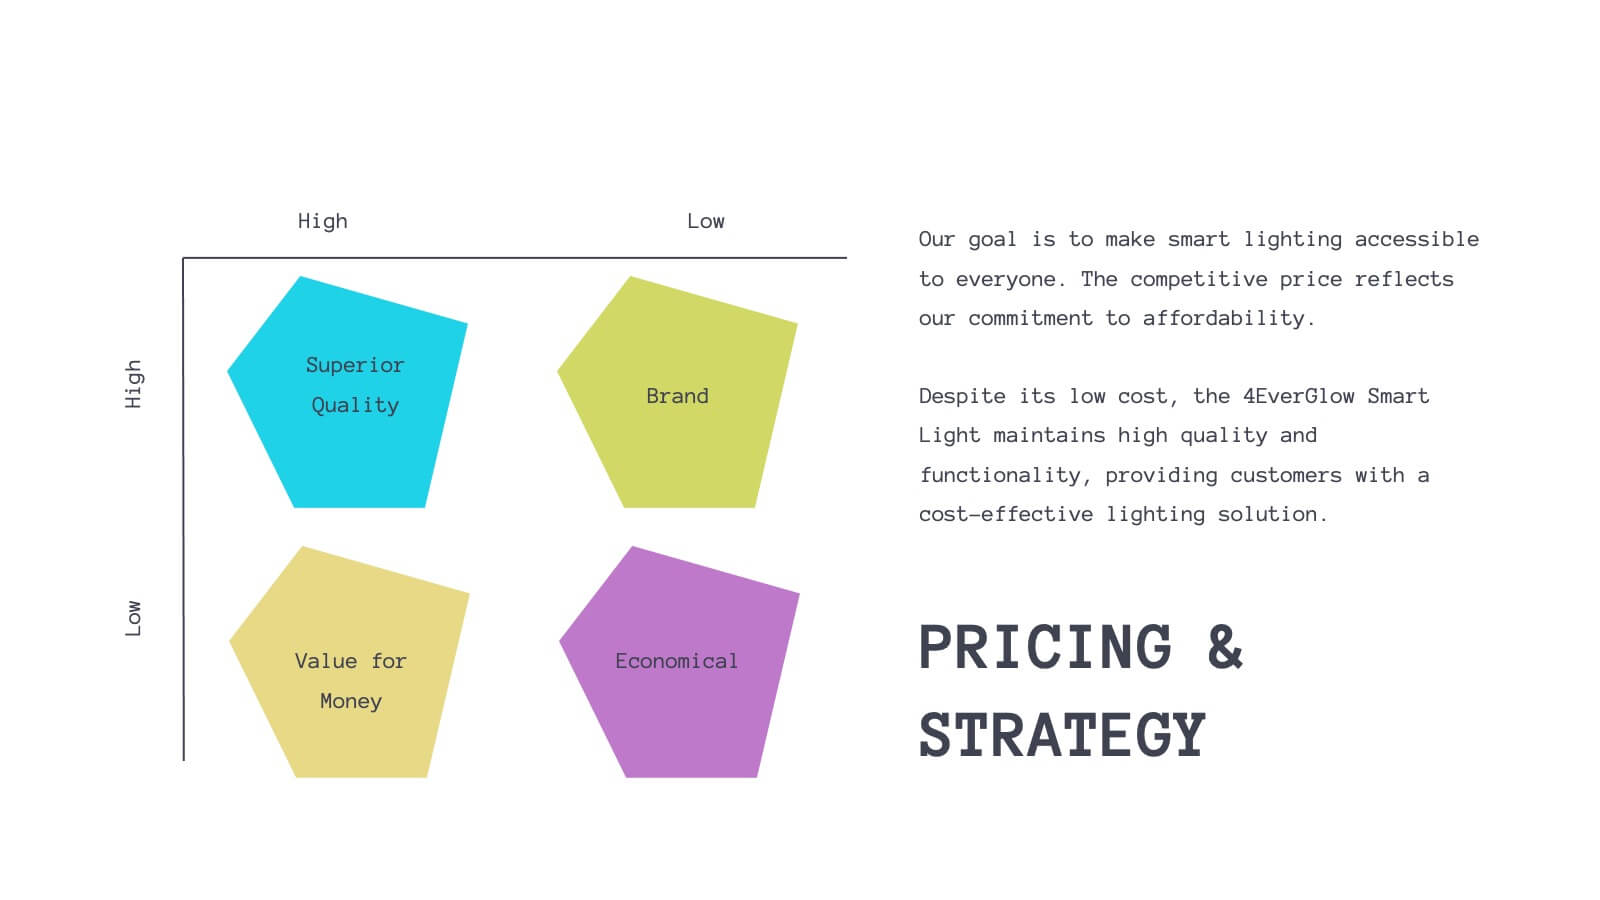
Luster Product Roadmap Presentation
Bring your product journey to life with this vibrant, modern presentation template! Perfect for guiding your audience through product features, customer pain points, and competitive analysis, it’s designed for maximum clarity and engagement. Whether you’re showcasing technical specs or marketing strategies, this template fits all your needs. Compatible with PowerPoint, Keynote, and Google Slides.


5 slides
World History Infographic Presentation
Bring the past to life with this engaging World History Infographic presentation. Featuring a circular layout with 4 editable sections, this infographic allows you to highlight key events, historical milestones, or cultural movements. Ideal for educators, students, and history enthusiasts, it’s designed for clarity, storytelling, and visual appeal. Fully compatible with PowerPoint, Keynote, and Google Slides – and easy to customize for any topic or timeline.


5 slides
5-Level Risk Management Plan Presentation
Turn complex strategies into clear, visual steps with this sleek layered layout designed for analyzing and mitigating potential risks. Each level helps you outline priorities, assess impact, and communicate safety measures effectively. Fully compatible with PowerPoint, Keynote, and Google Slides, making customization fast, professional, and presentation-ready.


5 slides
Iceberg Chart Template Infographics
Navigate the depths beneath the surface with the iceberg chart template infographics. This resource, bathed in varying shades of blue, captures the essence of uncovering hidden data, much like an iceberg reveals only a fraction of its mass above water. Professionals across diverse sectors, including business analysts and educators, will find value in this creative, ice-themed vertical template. It's especially beneficial for presentations aiming to explore beneath-the-surface dynamics, or unseen risks. The template is complete with customizable graphics, icons, and image placeholders, structured to visually break down complex concepts into digestible information.


6 slides
Business Model Canvas Resources Infographic
Embark on a journey through the essential concept of the Business Model Canvas (BMC)! This infographic serves as your gateway to understanding how this versatile tool can revolutionize your business strategy. From identifying key elements to optimizing your business model, we reveal the secrets that make the BMC an invaluable resource. Discover how the BMC can guide you in crafting a sustainable and adaptable business strategy. Learn to align your resources, activities, and customer focus to achieve competitive advantage. Explore real-world examples of successful businesses that have leveraged the BMC to innovate and grow. With this engaging infographic, compatible with PowerPoint, Keynote, and Google Slides, sharing your understanding of the Business Model Canvas is effortless. Empower yourself with the knowledge to revolutionize your business approach. Dive into the world of the BMC and embark on a journey of strategic exploration and innovation.


4 slides
Multi-Stage Process Hexagon Infographic Presentation
Showcase your workflows clearly with the Multi-Stage Process Hexagon Infographic Presentation. This template features a sleek chain of hexagons, ideal for visualizing linear steps, sequential planning, or project phases. Each stage is editable, color-coded, and easy to customize in PowerPoint, Keynote, or Google Slides—perfect for teams, educators, or project managers.


6 slides
Corporate Responsibility Sustainability Plan Presentation
Present your sustainability vision with the Corporate Responsibility Sustainability Plan Presentation. Designed around a tree-themed layout, this infographic highlights six key initiatives—perfect for showcasing environmental, social, and governance (ESG) efforts. Ideal for CSR reports, strategy decks, or stakeholder presentations. Fully editable in Canva, PowerPoint, Keynote, and Google Slides.


21 slides
Motionflux Project Milestones Report Presentation
Present project milestones with this structured template, covering objectives, methodology, timeline, budget, resource allocation, and risk management. Ideal for showcasing project progress and planning next steps. Perfect for PowerPoint, Keynote, and Google Slides, this design ensures a professional and clear presentation of key achievements and future plans.


26 slides
Textures Company Profile Black Presentation
A company profile is a concise document that provides an overview of a business, its history, products or services, achievements, mission, vision, values, and other relevant information. This presentation template is designed for businesses to showcase their brand identity and services in an elegant and professional manner. With a dominant black color theme, this presentation exudes a sense of modernity and class, making it perfect for businesses in various industries. Introduce your company's history, mission, and values in a concise and compelling manner. Utilize the clean and clear typography to maintain a professional and sophisticated look.


3 slides
Logistics and Inventory Flow Strategy Presentation
Visualize your operational flow with the Logistics and Inventory Flow Strategy Presentation. Designed with 3D-style isometric elements, this slide helps illustrate key stages of shipping, warehousing, and delivery. Easily customize icons, colors, and titles to reflect your supply chain or inventory management strategy. Compatible with PowerPoint, Keynote, and Google Slides.


5 slides
E-Learning and Digital Education Trends Presentation
Stay ahead in the digital learning space with the E-Learning and Digital Education Trends Presentation template. Designed for educators, trainers, and e-learning professionals, this modern and insightful layout highlights key trends, innovative tools, and strategies in online education. With fully customizable elements, you can tailor the slides to your audience’s needs. Compatible with PowerPoint, Keynote, and Google Slides for a seamless presentation experience.


6 slides
McKinsey 7S Model Articles Infographics
Explore the seven critical elements that make up the McKinsey 7S Model, including Strategy, Structure, Systems, Shared Values, Skills, Style, and Staff. Each of these components plays a vital role in shaping your company's success. This infographic is compatible with popular presentation tools like PowerPoint, Keynote, and Google Slides, making it effortless to incorporate into your next business presentation. Unlock the secrets of organizational effectiveness with this concise and visually appealing resource. Enhance your understanding of the McKinsey 7S Model and supercharge your company's performance today. Get ready to transform your business strategy with this user-friendly infographic.


7 slides
Company Profile Structure Infographic
This series of templates is meticulously crafted to represent a company’s structure in a detailed and organized manner. Each template varies in design and layout, ensuring that there is a style to suit different business needs and preferences. From straightforward, clean layouts to more dynamic, visually engaging designs, these templates provide an excellent basis for companies to present their organizational structure, core team members, departmental divisions, and key business areas effectively. Key information such as company values, mission statements, and strategic objectives can be clearly highlighted, allowing companies to communicate their business essence and operational ethos to stakeholders. Each template also accommodates data visualization through charts, graphs, and infographics, which are instrumental in depicting growth trajectories, performance metrics, or demographic breakdowns. With customization options, these templates can be tailored to reflect a company's unique brand identity, including color schemes, typography, and corporate logos, making each presentation not only informative but also reflective of the company's image. This collection is ideal for corporate introductions, stakeholder meetings, and internal presentations aimed at fostering a clear understanding of the company’s operational framework and strategic direction.


7 slides
Company Profile Overview Infographic
This set of company profile templates is expertly designed to help organizations succinctly and effectively convey their corporate identity and core values. Ideal for businesses seeking to outline their brand, history, and capabilities, each template is structured to enhance the presentation of company data to stakeholders and clients. The templates feature professional layouts that prioritize ease of reading and aesthetic appeal, ensuring that critical information like company achievements, mission, and service offerings are highlighted effectively. The designs incorporate a clean, contemporary style with ample space for customization, allowing companies to adapt the visuals and text to match their branding requirements. This adaptability makes the templates suitable for a wide range of industries and purposes, from corporate introductions and annual reports to marketing materials and business proposals. By providing a coherent structure that businesses can personalize with their specific details, these templates serve as a valuable tool in building a strong, professional image. They offer practical solutions for companies to present themselves in a polished and organized manner, fostering a positive impression among potential investors, clients, and partners.


5 slides
Health Care Access and Equity Infographics
Health Care Access refers to the ability of individuals and communities to obtain medical services and receive appropriate care when needed. These infographic templates serve as an educational and advocacy tool, helping to raise awareness about the importance of equitable healthcare access and the need for addressing disparities. Whether used in healthcare organizations, educational settings, or public awareness campaigns, this template effectively communicates the urgency of achieving health equity and encourages individuals to take action towards a more equitable healthcare system. Compatible with Powerpoint, Keynote, and Google Notes.


7 slides
Creative Tree Diagram Infographic
Unveil hierarchical structures or processes with our evocative tree diagram infographic. Set against a pristine white canvas and enriched with shades of trusty blue and organic green, this creative template epitomizes growth, interconnections, and systematic understanding. Embellished with crisp infographics, intuitive icons, and illustrative image placeholders, it effortlessly visualizes layered information. Perfectly tailored for Powerpoint, Keynote, or Google Slides. An indispensable resource for project managers, educators, business analysts, or any organization aiming to display branching information or decisions. Grow with clarity; let each slide branch out into a wealth of understanding.


5 slides
Big Data Infrastructure Planning Presentation
Build your big data strategy step-by-step with this clean and visual planning template. Designed to map out the key gears of infrastructure—from hardware to storage and cloud integration—it’s a powerful tool for IT leaders and tech teams. Fully editable and works with PowerPoint, Keynote, and Google Slides.